Embed Size (px)
Citation preview

WASHINGTON STATE UNIVERSITY—TREE FRUIT RESEARCH AND EXTENSION CENTER
2003 ARTICLE, Quality of the 2000 Crop of Washington Apples
POSTHARVEST INFORMATION NETWORK http://postharvest.tfrec.wsu.edu/EMK2003C.pdf
QUALITY OF THE 2000 CROP OF WASHINGTON APPLES: A REPORT TO THE WASHINGTON
TREE FRUIT INDUSTRY
Eugene Kupferman Jake Gutzwiler Nancy Buchanan Chris Sater
Washington State University Tree Fruit Research and Extension Center 1100 N. Western Ave. Wenatchee, WA 98801
Email: [email protected]
March 2002

WASHINGTON STATE UNIVERSITY—TREE FRUIT RESEARCH AND EXTENSION CENTER
2003 ARTICLE, Quality of the 2000 Crop of Washington Apples page i of 29
POSTHARVEST INFORMATION NETWORK http://postharvest.tfrec.wsu.edu/EMK2003C.pdf
EXECUTIVE SUMMARY This study was implemented at the request of the Grade and Pack Committee of the Washington State Horticultural Association. Initially the purpose of this work was to determine how grade standards based on the edible quality of “newer” varieties of apples would affect consumer acceptance and profitability. Subsequently, the Grade and Pack Committee requested that we expand this work to include the major varieties currently in production. Funding was provided by the Washington Tree Fruit Research Commission.
The establishment of achievable grade standards based on edible quality relies on four components. The first component is the knowledge of how consumers define edible quality; i.e., the effect of various levels of firmness, soluble solids and/or acidity on acceptability. This information is being investigated under a different project. The second component is whether the industry can meet the quality levels that consumers demand. The third component is whether non-destructive sorting technologies can be developed to implement new grade standards based on firmness, soluble solids and/or acidity so that every apple is evaluated. The fourth is whether the industry is willing to make radical changes on how fruit are sorted and how growers are paid.
This report describes the quality of apples from the 2000 crop as they were packed for shipment. The technician, Jake Gutzwiler, obtained almost 500 samples from 38 different packinglines as close to weekly as possible. Sampling began in late December 2000 and continued to the end of the packing season. Fruit were taken to the laboratory in Wenatchee and evaluated. Every apple was evaluated for firmness and each lot of apples was evaluated for total soluble solids (TSS) and titratable acidity (TA). Temperature (internal and external) of apples at time of packing was also determined at each visit. Included in this report are data from similar studies performed throughout the 1990s for comparison purposes.
FRUIT TEMPERATURES At time of packing the surface temperatures of apples averaged between 59 and 69 ºF, with individual apples ranging from 41 to 87 ºF. Red Delicious and Granny Smith temperatures averaged about 4 to 5 ºF warmer than other varieties.
The internal temperatures at time of packing averaged between 46 and 63 ºF, with an individual apple range of 33 to 85 ºF. This is similar to what was found in survey work done in the 1990s. Previous studies, summarized in this report, found that it can take as much as 100 hours to cool boxed palletized fruit in commercial storage rooms from 60 ºF to below 40 ºF. Fruit soften as cooling is delayed, and acidity levels are also depleted.
FRUIT QUALITY The quality of Washington apples can be looked at in the large view in which all apples are considered together; in which apples from a region or individual packinghouses are compared; or in the microcosm in which apples of individual growers are evaluated. It is the purpose of this work to evaluate Washington State apples in the large view. Consumers are not aware of the region or the producer; they buy apples labeled with the generic Washington logo.

WASHINGTON STATE UNIVERSITY—TREE FRUIT RESEARCH AND EXTENSION CENTER
2003 ARTICLE, Quality of the 2000 Crop of Washington Apples page ii of 29
POSTHARVEST INFORMATION NETWORK http://postharvest.tfrec.wsu.edu/EMK2003C.pdf
Red Delicious—For this variety, as with most of the other varieties, we have presented a histogram of the firmness of all apples sampled throughout the season. The histogram depicts every penetrometer measurement (two per apple). The Red Delicious histogram shows that 95% of the penetrometer readings were between 10 and 19 lbf, with an average of 15 lbf. However, 11.5% of the readings were below the 12-lbf standard the industry has set as the minimum firmness for shipping.
Graphs of lot average firmnesses over the sampling season show a slight decline in firmness over time. The variability in soluble solids was large during the start of the calendar year, but was more uniform late in the season. Acidity was very uniform throughout the season.
Golden Delicious—The firmness of Golden Delicious apples was highly variable throughout the season. Overall, the average firmness reading was 13 lbf, with 95% of the readings between 9 and 18 lbf. Although only 7% of the firmness readings were below 10 lbf, 14% were below 11 lbf and over 25% were below 12 lbf.
Graphs of lot average firmness show variability throughout the season. Soluble solids levels were also variable throughout the season.
Granny Smith—The firmness of Granny Smith apples has not been a problem in the market. The vast majority (95%) of the firmness readings ranged from 11 to 22 lbf, with an average of 16.5 lbf. However, there was a dramatic drop in both firmness and acidity as the season progressed.
Fuji—Firmness readings of Fuji apples averaged 15 lbf and ranged between 11 and 19 lbf. However, as the season progressed acidity dropped at a constant rate. Soluble solids were not particularly high were just about at the same levels as other varieties (14% average TSS, range of 12 to 16%).
Gala—Firmness readings of Gala apples averaged 14.6 lbf and ranged between 10 and 19 lbf, with 17% below 12 lbf. Lot average firmness fell slightly as the season progressed, but soluble solids and acidity held constant. Limited data are presented on Braeburn, Jonagold, Pink Lady® brand and Cameo. However there were not enough lots sampled to be certain that the results are indicative of the quality being shipped.
The areas of concern brought to mind by this data include:
• The high temperature of apples at time of packing. Efforts must be taken to reduce temperatures to preserve edible quality (Section 2).
• The range in firmness of Red Delicious apples indicates that too many apples sampled are below Washington minimum standards (Section 3.1).
• The large number of low firmness readings for Golden Delicious apples (Section 3.2). • The rapid decline in acidity in Fuji apples and low soluble solids levels (Section 3.3).
This project is continuing with sampling of the 2001 crop throughout the packing season. Special efforts are underway to include additional samples of the “newer” apple varieties.
Special thanks to all of the packinghouses that participated in this study. Reports on the fruit sampled from each packinghouse are being sent to the packinghouse managers.

WASHINGTON STATE UNIVERSITY—TREE FRUIT RESEARCH AND EXTENSION CENTER
2003 ARTICLE, Quality of the 2000 Crop of Washington Apples page iii of 29
POSTHARVEST INFORMATION NETWORK http://postharvest.tfrec.wsu.edu/EMK2003C.pdf
TABLE OF CONTENTS 1. INTRODUCTION................................................................................................................1
1.1 METHODS...................................................................................................................1 1.2 SAMPLING PROCEDURE.........................................................................................2
2. TEMPERATURE DATA.....................................................................................................3 2.1 2000 CROP DATA.......................................................................................................3 2.2 HISTORICAL COMPARISON ...................................................................................3 2.3 WHY SHOULD TEMPERATURE MANAGEMENT BE IMPROVED?..................4
3. FRUIT QUALITY................................................................................................................6 3.1 RED DELICIOUS ........................................................................................................6
3.1.1 2000 Red Delicious Crop .....................................................................................6 3.1.2 Historical Perspective for Red Delicious .............................................................8
3.2 GOLDEN DELICIOUS..............................................................................................11 3.2.1 2000 Golden Delicious Crop ..............................................................................11 3.2.2 Historical Perspective for Golden Delicious ......................................................12
3.3 FUJI ............................................................................................................................15 3.3.1 2000 Fuji Crop....................................................................................................15 3.3.2 Historical Perspective for Fuji............................................................................16
3.4 GRANNY SMITH......................................................................................................19 3.4.1 2000 Granny Smith Crop....................................................................................19 3.4.2 Historical Perspective for Granny Smith............................................................20
3.5 GALA .........................................................................................................................23 3.5.1 2000 Gala Crop...................................................................................................23 3.5.2 Historical Perspective for Gala...........................................................................24
3.6 BRAEBURN, JONAGOLD, PINK LADY® BRAND AND CAMEO ....................27

WASHINGTON STATE UNIVERSITY—TREE FRUIT RESEARCH AND EXTENSION CENTER
2003 ARTICLE, Quality of the 2000 Crop of Washington Apples page iv of 29
POSTHARVEST INFORMATION NETWORK http://postharvest.tfrec.wsu.edu/EMK2003C.pdf
LIST OF FIGURES Figure 1. Number of samples per week.......................................................................................1 Figure 2. Hours to decrease apple temperature from 60 to 40 ºF ................................................4 Figure 3. Change in firmness of Red Delicious and Gala held at 70 ºF ......................................5 Figure 4. Red Delicious firmness (per penetrometer measurement), 2000 crop.........................8 Figure 5. Red Delicious lot average firmness vs. soluble solids, 2000 crop ...............................9 Figure 6. Red Delicious lot average firmness, TA and TSS by week, 2000 crop .....................10 Figure 7. Golden Delicious firmness (per penetrometer measurement), 2000 crop..................12 Figure 8. Golden Delicious lot average firmness vs. soluble solids, 2000 crop........................13 Figure 9. Golden Delicious lot average firmness, TA and TSS by week, 2000 crop................14 Figure 10. Fuji firmness (per penetrometer measurement), 2000 crop .....................................16 Figure 11. Fuji lot average firmness vs. soluble solids, 2000 crop ...........................................17 Figure 12. Fuji lot average firmness, TA and TSS by week, 2000 crop ...................................18 Figure 13. Granny Smith firmness (per penetrometer measurement), 2000 crop .....................20 Figure 14. Granny Smith lot average firmness vs. soluble solids, 2000 crop ...........................21 Figure 15. Granny Smith lot average firmness, TA and TSS by week, 2000 crop ...................22 Figure 16. Gala firmness (per penetrometer measurement), 2000 crop ....................................24 Figure 17. Gala lot average firmness vs. soluble solids, 2000 crop ..........................................25 Figure 18. Gala lot average firmness, TA and TSS by week, 2000 crop ..................................26 Figure 19. Braeburn firmness (per penetrometer measurement), 2000 crop.............................27 Figure 20. Jonagold firmness (per penetrometer measurement), 2000 crop .............................28 Figure 21. Pink Lady® brand firmness (per penetrometer measurement), 2000 crop ..............28 Figure 22. Cameo firmness (per penetrometer measurement), 2000 crop ................................29

WASHINGTON STATE UNIVERSITY—TREE FRUIT RESEARCH AND EXTENSION CENTER
2003 ARTICLE, Quality of the 2000 Crop of Washington Apples page v of 29
POSTHARVEST INFORMATION NETWORK http://postharvest.tfrec.wsu.edu/EMK2003C.pdf
LIST OF TABLES Table 1. Location and number of packinglines sampled .............................................................1 Table 2. Number of lots sampled per variety, 2000 crop ............................................................2 Table 3. Average surface and internal temperature by variety, 2000 crop..................................3 Table 4. Average internal temperature by variety for previous years and the 2000 crop............4 Table 5. Summary of Red Delicious quality attributes, by packinghouse...................................7 Table 6. Comparison of Red Delicious quality attributes over the past 10 years........................8 Table 7. Summary of Golden Delicious quality attributes, by packinghouse ...........................11 Table 8. Comparison of Golden Delicious quality attributes in 1991 and 2000 .......................12 Table 9. Summary of Fuji quality attributes, by packinghouse .................................................15 Table 10. Comparison of Fuji quality attributes over the past 10 years ....................................16 Table 11. Summary of Granny Smith quality attributes, by packinghouse...............................19 Table 12. Comparison of Granny Smith quality attributes in 1995 and 2000 ...........................20 Table 13. Summary of Gala quality attributes, by packinghouse..............................................23 Table 14. Comparison of Gala quality attributes over the past 10 years ...................................24 Table 15. Quality attributes for Braeburn, Jonagold, Pink Lady® brand and Cameo...............27

WASHINGTON STATE UNIVERSITY—TREE FRUIT RESEARCH AND EXTENSION CENTER
2003 ARTICLE, Quality of the 2000 Crop of Washington Apples page 1 of 29
POSTHARVEST INFORMATION NETWORK http://postharvest.tfrec.wsu.edu/EMK2003C.pdf
Pink Lady® Brand Firmnessper penetrometer measurement (two measurements per apple)
02468
10121416
7 8 9 10 11 12 13 14 15 16 17 18 19 20 21 22 23 24 25 26 27Firmness (lbf)
Tota
l pen
etro
met
er m
easu
rem
ents
85 Apples
Figure 1. Number of samples per week, December 20, 2000 to September 26, 2001.
1. INTRODUCTION The Grade and Pack Committee of the Washington State Horticultural Association requested that we initiate a survey of the quality of Washington grown apples. This survey is intended to provide data for the development of grade standards based on edible quality. The technician, Jake Gutzwiler, obtained samples of apples at time of packing from cooperating packinghouses on a regular basis.
This report includes the methods and results of sampling the major Washington apple varieties from the 2000 harvest. Survey activities are continuing with the 2001 crop with a greater emphasis on working with packers who supply “newer” apple varieties.
This project has been funded in part by the Washington Tree Fruit Research Commission.
1.1 METHODS Apple samples were gathered weekly from 22 packinghouses from the week of December 22, 2000 through the week of September 26, 2001. All fruit sampled was from the 2000 crop. Sampling was suspended in all of July (cherry harvest) due to the small number of apples being packed (Figure 1). Packinghouses were sampled in all three apple-growing regions of Washington (Table 1).
Table 1. Location and number of packinglines sampled. Location Number of packinglines
Yakima 18 Wenatchee 10 North of Wenatchee 10

WASHINGTON STATE UNIVERSITY—TREE FRUIT RESEARCH AND EXTENSION CENTER
2003 ARTICLE, Quality of the 2000 Crop of Washington Apples page 2 of 29
POSTHARVEST INFORMATION NETWORK http://postharvest.tfrec.wsu.edu/EMK2003C.pdf
1.2 SAMPLING PROCEDURE Fruit were sampled directly from each packingline at a location immediately before they would have been placed on trays. The variety and size sampled was dependent on the packinghouse schedule. During each packinghouse visit all varieties being packed were sampled. Pre-sized fruit were sampled from one tray line. On lines running fruit that had not been pre-sized, one sample was taken of a single fruit size between 100 and 64. A fruit sample for each packingline from each packinghouse visit was considered a “lot.” Lot sizes started at 10 apples and increased to 25 apples in May. The number of lots of each variety sampled during the season is shown in Table 2.
Table 2. Number of lots sampled per variety, 2000 crop. Variety Lots Sampled
Red Delicious 170 Golden Delicious 94 Fuji 93 Granny Smith 56 Gala 55 Braeburn 13 Jonagold 7 Pink Lady® brand 6 Cameo 5
Total 499 The information collected at the packinghouse on each lot of fruit consisted of:
• Flesh temperature of five apples at time of sampling • Storage conditions and history (storage temperature, O2 and CO2 levels) • CA room opening dates • Grower/lot numbers and orchard location
Initially a 10-apple sample was taken to the lab for analysis. The laboratory analysis included:
• Flesh firmness (lbf) determined by the Fruit Texture Analyzer—two readings per apple • Soluble solids (% brix) determined by digital refractometer • Acidity (%) determined by Brinkman Automatic Titrator
As the project developed other measurements of fruit quality were added to the weekly regime:
• Surface temperature of five apples determined by Ryan infrared thermometer (initiated week of February 20, 2000)
• Non-destructive firmness measurement determined by Acoustic Firmness Sensor (initiated week of May 10, 2001)
• Lot size was increased from 10 to 25 apples (initiated week of May 17, 2001)

WASHINGTON STATE UNIVERSITY—TREE FRUIT RESEARCH AND EXTENSION CENTER
2003 ARTICLE, Quality of the 2000 Crop of Washington Apples page 3 of 29
POSTHARVEST INFORMATION NETWORK http://postharvest.tfrec.wsu.edu/EMK2003C.pdf
2. TEMPERATURE DATA Data in this section is represented as averages of lots of fruit. As a result, data for varieties with fewer lots sampled—Braeburn, Jonagold, Pink Lady® brand, and Cameo—may be less representative of the entire packinghouse population than other varieties.
2.1 2000 CROP DATA The surface temperatures of Granny Smith and Red Delicious were an average of 4 to 5 ºF warmer than the other varieties, but internal temperatures were similar (Table 3). Red Delicious had the highest surface and internal temperatures recorded (87 ºF and 85 ºF, respectively). Because Golden Delicious are not always waxed, you would expect the fruit temperatures to be lower than other varieties that are run through the hot wax on the packingline. However, this was not the case and Golden Delicious surface and internal temperatures were similar to waxed fruit.
Surface temperatures were taken with a non-contact infrared thermometer. Internal temperatures were taken with a probe inserted approximately 1 cm inside the fruit flesh.
Table 3. Average surface and internal temperature by variety, 2000 crop. Surface Temperature (ºF), Lot Averages
Red Golden Fuji Granny Gala Braeburn Jonagold* Pink
Lady®* Cameo*
Min 45 41 48 55 49 54 55 55 45 Max 87 80 79 82 73 75 77 67 73
Average 69 64 65 68 64 63 65 62 59
Internal Temperature (ºF), Lot Averages
Red Golden Fuji Granny Gala Braeburn Jonagold* Pink
Lady®* Cameo*Min 42 36 33 42 36 42 50 49 34 Max 85 76 68 78 72 66 60 78 64
Average 56 55 53 55 54 52 54 63 46 * There were fewer lots of these varieties sampled throughout the season, thus the data are less reliable a predictor of the range of apples being shipped from Washington than that of the other varieties
2.2 HISTORICAL COMPARISON Previously we surveyed apple packinglines during the packing of the 1991, 1992, 1993 and 1995 crops. We looked at where on the line the apples were picking up heat and consistently found that the rise in temperature occurred when the fruit was placed into a heated dump tank. Often this rise in fruit temperature was as much as 20 ºF.
Internal temperature (lot averages) from previous years’ crops and the 2000 crop are summarized in Table 4. These temperatures were taken just before the fruit were packed into boxes. As you can see, the average temperature of just-packed fruit has remained in the mid-50s to mid-60s for the past 10 years. In some lots, the internal temperature of the fruit was 80 ºF when packed.

WASHINGTON STATE UNIVERSITY—TREE FRUIT RESEARCH AND EXTENSION CENTER
2003 ARTICLE, Quality of the 2000 Crop of Washington Apples page 4 of 29
POSTHARVEST INFORMATION NETWORK http://postharvest.tfrec.wsu.edu/EMK2003C.pdf
Table 4. Average internal temperature by variety for previous years and the 2000 crop. Internal Temperature (ºF), Lot Averages
Red Golden Fuji Gala Braeburn* Jonagold*
1991 60 55 1992 59 64 1993 64 63 1995 63 64 2000 56 55 53 54 52 54
* There were fewer lots of these varieties sampled throughout the season, thus the data are less reliable a predictor of the range of apples being shipped from Washington than that of the other varieties
2.3 WHY SHOULD TEMPERATURE MANAGEMENT BE IMPROVED? We have examined the rate of cooling of boxed apples immediately following palletization in several packinghouses (Figure 2). The times to cool the fruit from 60 ºF to less than 40 ºF varied depending upon the location of the box. The worst case was in those boxes in which only the end of the box was exposed to cooling temperatures. The fruit in these boxes can take 100 hours or more to cool. Of course fruit in boxes on the corners of the pallet will cool much faster.
When cooling is delayed, fruit respiration is rapid and firmness decreases (Figure 3). The amount of firmness lost is dependent on the variety, the temperature profile and the time.
41.5
101.598
32.8
103.5
29.8
48.340.2
84.5
0
20
40
60
80
100
120
Top Middle BottomLocation on Pallet
Hou
rs
1
2
3
4
5
6
7
8
9
1
23
Top
Middle
64
5
Bottom
7
98
Figure 2. Hours to decrease apple temperature from 60 to 40 ºF. Temperature measured by probes inserted in apples in middle of each box. Strip sheets were placed between the pallet and the boxes (Kupferman and Miller 1995).

WASHINGTON STATE UNIVERSITY—TREE FRUIT RESEARCH AND EXTENSION CENTER
2003 ARTICLE, Quality of the 2000 Crop of Washington Apples page 5 of 29
POSTHARVEST INFORMATION NETWORK http://postharvest.tfrec.wsu.edu/EMK2003C.pdf
11
12
13
14
15
16
Day 1 Day 3 Day 6 Day 8 Day 10 Day 13
Days out of storage at 70 ºF
Firm
ness
(lbf
)
Red Delicious
Gala
Figure 3. Change in firmness of Red Delicious and Gala held at 70 ºF.
WASHINGTON STATE UNIVERSITY—TREE FRUIT RESEARCH AND EXTENSION CENTER
2003 ARTICLE, Quality of the 2000 Crop of Washington Apples page 6 of 29
POSTHARVEST INFORMATION NETWORK http://postharvest.tfrec.wsu.edu/EMK2003C.pdf
3. FRUIT QUALITY Fruit quality declined through the season, with the rate of decline dependent on the variety. Each fruit quality attribute (firmness, soluble solids, acidity) declined at a different rate. In addition, some quality differences were apparent between packinghouses.
The quality characteristics of each variety sampled are discussed in the following sections. The sections are arranged by the number of lots sampled, starting at Red Delicious (170 lots) and going through Gala (55 lots). Varieties with only a few lots are discussed as a group at the end of the report. The quality discussion for each variety includes a histogram showing the firmness of individual penetrometer readings (two per apple). This is done to show the range in firmness of the population of Washington apples encountered by inspectors.
In addition to individual apple firmness data, graphs are presented based on lot averages. Our work with consumers has shown that both firmness and soluble solids levels influence acceptability. There is a graph for each variety showing this relationship. Also there are graphs that show the firmness, soluble solids levels and acidity averages over the season to illustrate changes in these quality attributes over time.
In tables displaying fruit quality information some values are highlighted in bold italics, indicating averages comprised of more than five lots. Values not highlighted are a result of a small number of lots and thus may not be representative of the typical output of the packinghouse.
3.1 RED DELICIOUS
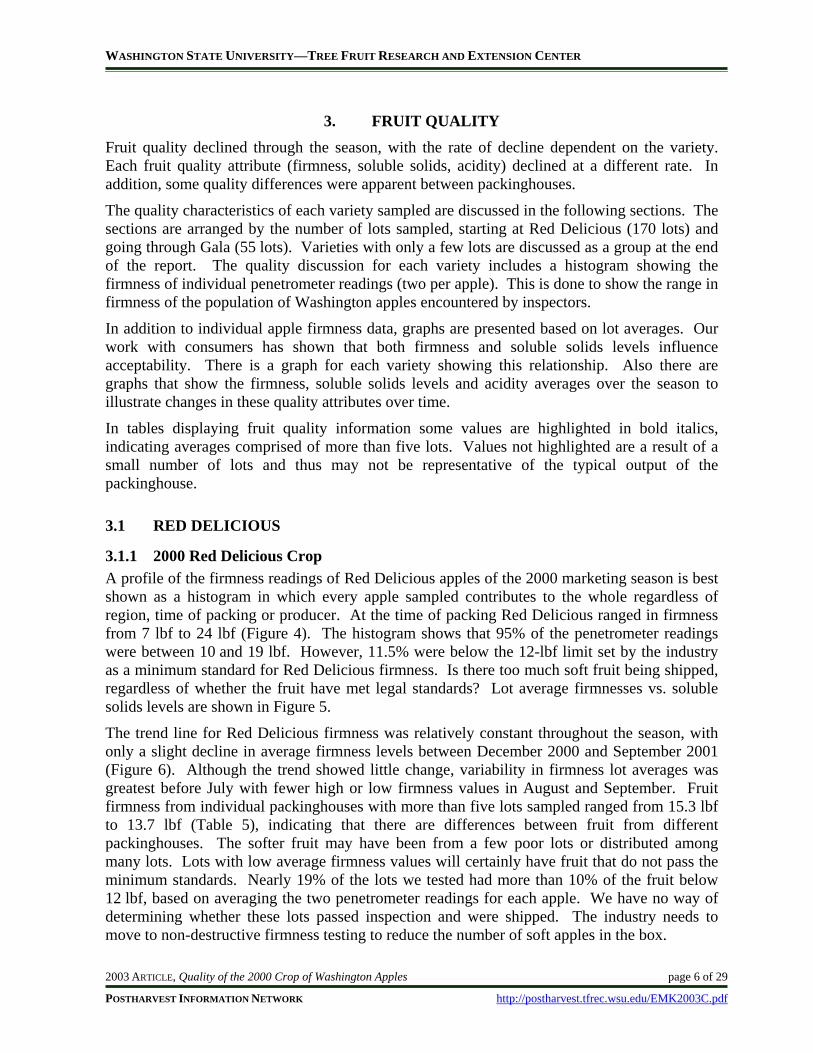
3.1.1 2000 Red Delicious Crop A profile of the firmness readings of Red Delicious apples of the 2000 marketing season is best shown as a histogram in which every apple sampled contributes to the whole regardless of region, time of packing or producer. At the time of packing Red Delicious ranged in firmness from 7 lbf to 24 lbf (Figure 4). The histogram shows that 95% of the penetrometer readings were between 10 and 19 lbf. However, 11.5% were below the 12-lbf limit set by the industry as a minimum standard for Red Delicious firmness. Is there too much soft fruit being shipped, regardless of whether the fruit have met legal standards? Lot average firmnesses vs. soluble solids levels are shown in Figure 5.
The trend line for Red Delicious firmness was relatively constant throughout the season, with only a slight decline in average firmness levels between December 2000 and September 2001 (Figure 6). Although the trend showed little change, variability in firmness lot averages was greatest before July with fewer high or low firmness values in August and September. Fruit firmness from individual packinghouses with more than five lots sampled ranged from 15.3 lbf to 13.7 lbf (Table 5), indicating that there are differences between fruit from different packinghouses. The softer fruit may have been from a few poor lots or distributed among many lots. Lots with low average firmness values will certainly have fruit that do not pass the minimum standards. Nearly 19% of the lots we tested had more than 10% of the fruit below 12 lbf, based on averaging the two penetrometer readings for each apple. We have no way of determining whether these lots passed inspection and were shipped. The industry needs to move to non-destructive firmness testing to reduce the number of soft apples in the box.

WASHINGTON STATE UNIVERSITY—TREE FRUIT RESEARCH AND EXTENSION CENTER
2003 ARTICLE, Quality of the 2000 Crop of Washington Apples page 7 of 29
POSTHARVEST INFORMATION NETWORK http://postharvest.tfrec.wsu.edu/EMK2003C.pdf
Table 5. Summary of Red Delicious quality attributes, by packinghouse. Packinghouse TSS (%) Acidity (%) Firmness (lbf)
a 13.0 0.20 14.5 b 13.8 0.23 14.4 c 13.2 0.22 15.0 e 13.6 0.23 14.3 f 13.3 0.20 13.8 g 13.3 0.22 13.7 h 13.4 0.22 14.1 i 13.1 0.18 13.9 j 13.4 0.22 14.6 l 14.0 0.24 14.0
m 13.4 0.24 14.5 n 13.4 0.22 13.0 o 13.0 0.23 15.0 q 13.0 0.23 14.9 r 13.4 0.25 13.7 s 13.4 0.26 15.3 t 12.6 0.23 15.0 u 13.2 0.22 13.5 v 13.0 0.20 14.6
Average 13.2 0.22 15.6 Range 10 to 16 0.11 to 0.33 11 to 18
Values in bold italics indicate more than five lots sampled.
A slight decline in titratable acidity in Red Delicious was apparent as the season progressed (Figure 6). There were almost no outlying values (high or low) all season. There were only minor differences in lot-to-lot acidity values compared to the ranges in lot average acidity of the other varieties. There was a slow decline in acid values over time in storage.
Overall, soluble solids were fairly stable throughout the season (Figure 6). However there were more outlying values (high and low values) in the beginning of the season as compared with the last third of the packing season. There was little difference in soluble solids levels between packinghouses.
WASHINGTON STATE UNIVERSITY—TREE FRUIT RESEARCH AND EXTENSION CENTER
2003 ARTICLE, Quality of the 2000 Crop of Washington Apples page 8 of 29
POSTHARVEST INFORMATION NETWORK http://postharvest.tfrec.wsu.edu/EMK2003C.pdf
3.1.2 Historical Perspective for Red Delicious The sampling work done with the previous crops shows that the firmness and acidity of Red Delicious at time of packing has changed only slightly over the years (Table 6).
Table 6. Comparison of Red Delicious quality attributes over the past 10 years. 1990 Crop 1991 Crop 1992 Crop 2000 Crop
Firmness (lbf) average range
15.4 (12 to 19)
15.8 (12 to 20)
14.6 (12 to 19)
15.2 (11 to 18)
Soluble solids (%) average range
13.2 (11 to 16)
13.3 (11 to 15)
13.7 (12 to 15)
13.6 (10 to 16)
Acidity (%) average range
0.21 (0.14 to 0.44)
0.25 (0.18 to 0.41)
0.32 (0.20 to 0.50)
0.22 (0.11 to 0.33)
Number of lots 338 265 240 170
Red Delicious Firmnessper penetrometer measurement (two measurements per apple)
0
100
200
300
400
500
7 8 9 10 11 12 13 14 15 16 17 18 19 20 21 22 23 24 25 26 27Firmness (lbf)
Tota
l pen
etro
met
er m
easu
rem
ents
2127 Apples
Figure 4. Red Delicious firmness (per penetrometer measurement), 2000 crop.

WASHINGTON STATE UNIVERSITY—TREE FRUIT RESEARCH AND EXTENSION CENTER
2003 ARTICLE, Quality of the 2000 Crop of Washington Apples page 9 of 29
POSTHARVEST INFORMATION NETWORK http://postharvest.tfrec.wsu.edu/EMK2003C.pdf
Red Delicious
10
11
12
13
14
15
16
7 9 11 13 15 17 19 21Firmness (lbf)
Solu
ble
solid
s (%
)
Figure 5. Red Delicious lot average firmness vs. soluble solids, 2000 crop.

WASHINGTON STATE UNIVERSITY—TREE FRUIT RESEARCH AND EXTENSION CENTER
2003 ARTICLE, Quality of the 2000 Crop of Washington Apples page 10 of 29
POSTHARVEST INFORMATION NETWORK http://postharvest.tfrec.wsu.edu/EMK2003C.pdf
Figure 6. Red Delicious lot average firmness, TA and TSS by week, 2000 crop.
WASHINGTON STATE UNIVERSITY—TREE FRUIT RESEARCH AND EXTENSION CENTER
2003 ARTICLE, Quality of the 2000 Crop of Washington Apples page 11 of 29
POSTHARVEST INFORMATION NETWORK http://postharvest.tfrec.wsu.edu/EMK2003C.pdf
3.2 GOLDEN DELICIOUS
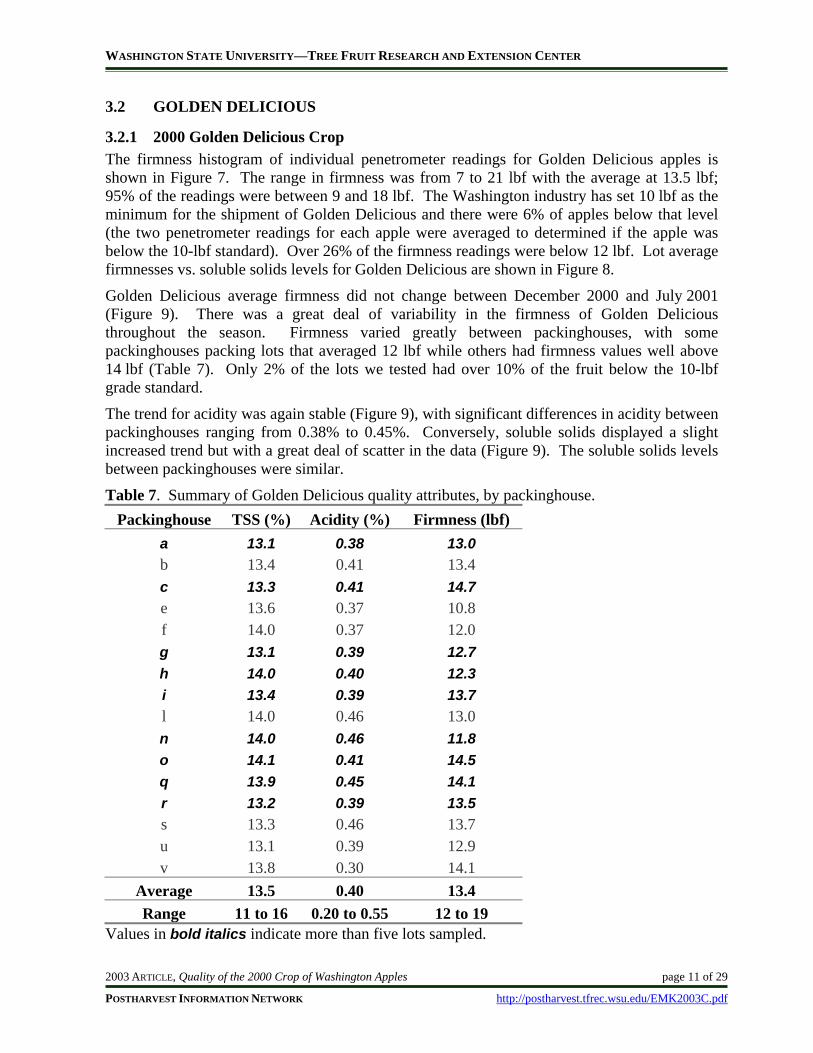
3.2.1 2000 Golden Delicious Crop The firmness histogram of individual penetrometer readings for Golden Delicious apples is shown in Figure 7. The range in firmness was from 7 to 21 lbf with the average at 13.5 lbf; 95% of the readings were between 9 and 18 lbf. The Washington industry has set 10 lbf as the minimum for the shipment of Golden Delicious and there were 6% of apples below that level (the two penetrometer readings for each apple were averaged to determined if the apple was below the 10-lbf standard). Over 26% of the firmness readings were below 12 lbf. Lot average firmnesses vs. soluble solids levels for Golden Delicious are shown in Figure 8.
Golden Delicious average firmness did not change between December 2000 and July 2001 (Figure 9). There was a great deal of variability in the firmness of Golden Delicious throughout the season. Firmness varied greatly between packinghouses, with some packinghouses packing lots that averaged 12 lbf while others had firmness values well above 14 lbf (Table 7). Only 2% of the lots we tested had over 10% of the fruit below the 10-lbf grade standard.
The trend for acidity was again stable (Figure 9), with significant differences in acidity between packinghouses ranging from 0.38% to 0.45%. Conversely, soluble solids displayed a slight increased trend but with a great deal of scatter in the data (Figure 9). The soluble solids levels between packinghouses were similar.
Table 7. Summary of Golden Delicious quality attributes, by packinghouse. Packinghouse TSS (%) Acidity (%) Firmness (lbf)
a 13.1 0.38 13.0 b 13.4 0.41 13.4 c 13.3 0.41 14.7 e 13.6 0.37 10.8 f 14.0 0.37 12.0 g 13.1 0.39 12.7 h 14.0 0.40 12.3 i 13.4 0.39 13.7 l 14.0 0.46 13.0 n 14.0 0.46 11.8 o 14.1 0.41 14.5 q 13.9 0.45 14.1 r 13.2 0.39 13.5 s 13.3 0.46 13.7 u 13.1 0.39 12.9 v 13.8 0.30 14.1
Average 13.5 0.40 13.4 Range 11 to 16 0.20 to 0.55 12 to 19
Values in bold italics indicate more than five lots sampled.

WASHINGTON STATE UNIVERSITY—TREE FRUIT RESEARCH AND EXTENSION CENTER
2003 ARTICLE, Quality of the 2000 Crop of Washington Apples page 12 of 29
POSTHARVEST INFORMATION NETWORK http://postharvest.tfrec.wsu.edu/EMK2003C.pdf
3.2.2 Historical Perspective for Golden Delicious We sampled Golden Delicious apples in both 1991 and 2000 (Table 8). We found that the firmness of the fruit in 1991 was about 1 lbf firmer, but the soluble solids were lower in 1991 than in 2000. Fruit were sampled over the same part of the season (December to June) both years.
Table 8. Comparison of Golden Delicious quality attributes in 1991 and 2000. 1991 Crop 2000 Crop
Firmness (lbf) average range
14.5 (11 to 18)
13.4 (12 to 19)
Soluble solids (%) average range
12.8 (11 to 15)
13.5 (11 to16)
Acidity (%) average range
0.39 (0.24 to 0.57)
0.40 (0.20 to 0.55)
Number of lots 148 94
Golden Delicious Firmnessper penetrometer measurement (two measurements per apple)
0
50
100
150
200
250
7 8 9 10 11 12 13 14 15 16 17 18 19 20 21 22 23 24 25 26 27Firmness (lbf)
Tota
l pen
etro
met
er m
easu
rem
ents
1138 Apples
Figure 7. Golden Delicious firmness (per penetrometer measurement), 2000 crop.

WASHINGTON STATE UNIVERSITY—TREE FRUIT RESEARCH AND EXTENSION CENTER
2003 ARTICLE, Quality of the 2000 Crop of Washington Apples page 13 of 29
POSTHARVEST INFORMATION NETWORK http://postharvest.tfrec.wsu.edu/EMK2003C.pdf
Golden Delicious
10
11
12
13
14
15
16
7 9 11 13 15 17 19 21Firmness (lbf)
Solu
ble
solid
s (%
)
Figure 8. Golden Delicious lot average firmness vs. soluble solids, 2000 crop.

WASHINGTON STATE UNIVERSITY—TREE FRUIT RESEARCH AND EXTENSION CENTER
2003 ARTICLE, Quality of the 2000 Crop of Washington Apples page 14 of 29
POSTHARVEST INFORMATION NETWORK http://postharvest.tfrec.wsu.edu/EMK2003C.pdf
Figure 9. Golden Delicious lot average firmness, TA and TSS by week, 2000 crop.

WASHINGTON STATE UNIVERSITY—TREE FRUIT RESEARCH AND EXTENSION CENTER
2003 ARTICLE, Quality of the 2000 Crop of Washington Apples page 15 of 29
POSTHARVEST INFORMATION NETWORK http://postharvest.tfrec.wsu.edu/EMK2003C.pdf
3.3 FUJI
3.3.1 2000 Fuji Crop Individual firmness readings of Washington Fuji apples (1073 apples) averaged 15 lbf; 95% of the readings were between 11 and 19 lbf (Figure 10). Lot average firmnesses vs. soluble solids levels are shown in Figure 11.
Firmness of Fuji declined over the sampling season (Figure 12). There were differences between packinghouses, with some averaging 13 lbf and others as high as 17 lbf (Table 9).
Titratable acidity started relatively low in December and declined to levels below 0.15% by September (Figure 12). This decline was not apparent until after June. There was a difference in the acidity of Fuji apples from different packinghouses (in a range of 0.30 to 0.21%).
The optimum Fuji apple is one with high TSS levels that reflect the sweet taste of the apple. Fuji is known for its sweetness; however, the TSS levels of the Fujis sampled were not appreciably higher than other varieties packed at the same time. In general TSS levels increased slightly during the sampling season, although samples taken at the beginning of the sampling period and after July had TSS levels lower than the rest of the season (Figure 12). Soluble solids averages between packinghouses were similar.
Table 9. Comparison of Fuji quality attributes, by packinghouse. Packinghouse TSS (%) Acidity (%) Firmness(lbf)
a 13.2 0.26 15.4 b 13.5 0.27 15.5 c 13.6 0.25 14.9 d 13.8 0.30 15.1 e 13.5 0.28 16.6 f 15.0 0.21 17.5 g 14.0 0.29 15.7 i 13.9 0.24 15.3 j 13.7 0.29 14.0 l 13.9 0.26 15.0 n 14.2 0.30 13.6 p 13.8 0.27 15.5 q 13.8 0.27 16.7 r 13.9 0.27 15.4 s 13.1 0.20 13.0 t 14.2 0.26 15.1 u 13.5 0.21 14.1 v 13.4 0.23 14.9
Average 13.7 0.26 15.1 Range 12 to 16 0.12 to 0.42 12 to 20
Values in bold italics indicate more than five lots sampled.

WASHINGTON STATE UNIVERSITY—TREE FRUIT RESEARCH AND EXTENSION CENTER
2003 ARTICLE, Quality of the 2000 Crop of Washington Apples page 16 of 29
POSTHARVEST INFORMATION NETWORK http://postharvest.tfrec.wsu.edu/EMK2003C.pdf
3.3.2 Historical Perspective for Fuji We sampled Fuji apples during the packing of the 1992, 1993 and 2000 crops. Firmness, acidity and soluble solids were significantly lower in the 2000 crop (Table 10). Most packers and growers will agree that the edible quality of Fuji apples in 2000 was not exceptional.
Table 10. Comparison of Fuji quality attributes over the past 10 years. 1992 Crop 1993 Crop 2000 Crop
Firmness (lbf) average range
16.9 (14 to 19)
16.5 (11 to 23)
15.1 (12 to 20)
Soluble solids (%) average range
14.9 (13 to 17)
14.6 (13 to 17)
13.7 (12 to 16)
Acidity (%) average range
0.41 (0.23 to 0.65)
0.34 (0.23 to 0.46)
0.26 (0.12 to 0.42)
Number of lots 84 36 93
Fuji Firmnessper penetrometer measurement (two measurements per apple)
0
50
100
150
200
250
7 8 9 10 11 12 13 14 15 16 17 18 19 20 21 22 23 24 25 26 27Firmness (lbf)
Tota
l pen
etro
met
er m
easu
rem
ents
1073 Apples
Figure 10. Fuji firmness (per penetrometer measurement), 2000 crop.

WASHINGTON STATE UNIVERSITY—TREE FRUIT RESEARCH AND EXTENSION CENTER
2003 ARTICLE, Quality of the 2000 Crop of Washington Apples page 17 of 29
POSTHARVEST INFORMATION NETWORK http://postharvest.tfrec.wsu.edu/EMK2003C.pdf
Fuji
10
11
12
13
14
15
16
7 9 11 13 15 17 19 21Firmness (lbf)
Solu
ble
solid
s (%
)
Figure 11. Fuji lot average firmness vs. soluble solids, 2000 crop.

WASHINGTON STATE UNIVERSITY—TREE FRUIT RESEARCH AND EXTENSION CENTER
2003 ARTICLE, Quality of the 2000 Crop of Washington Apples page 18 of 29
POSTHARVEST INFORMATION NETWORK http://postharvest.tfrec.wsu.edu/EMK2003C.pdf
Figure 12. Fuji lot average firmness, TA and TSS by week, 2000 crop.

WASHINGTON STATE UNIVERSITY—TREE FRUIT RESEARCH AND EXTENSION CENTER
2003 ARTICLE, Quality of the 2000 Crop of Washington Apples page 19 of 29
POSTHARVEST INFORMATION NETWORK http://postharvest.tfrec.wsu.edu/EMK2003C.pdf
3.4 GRANNY SMITH
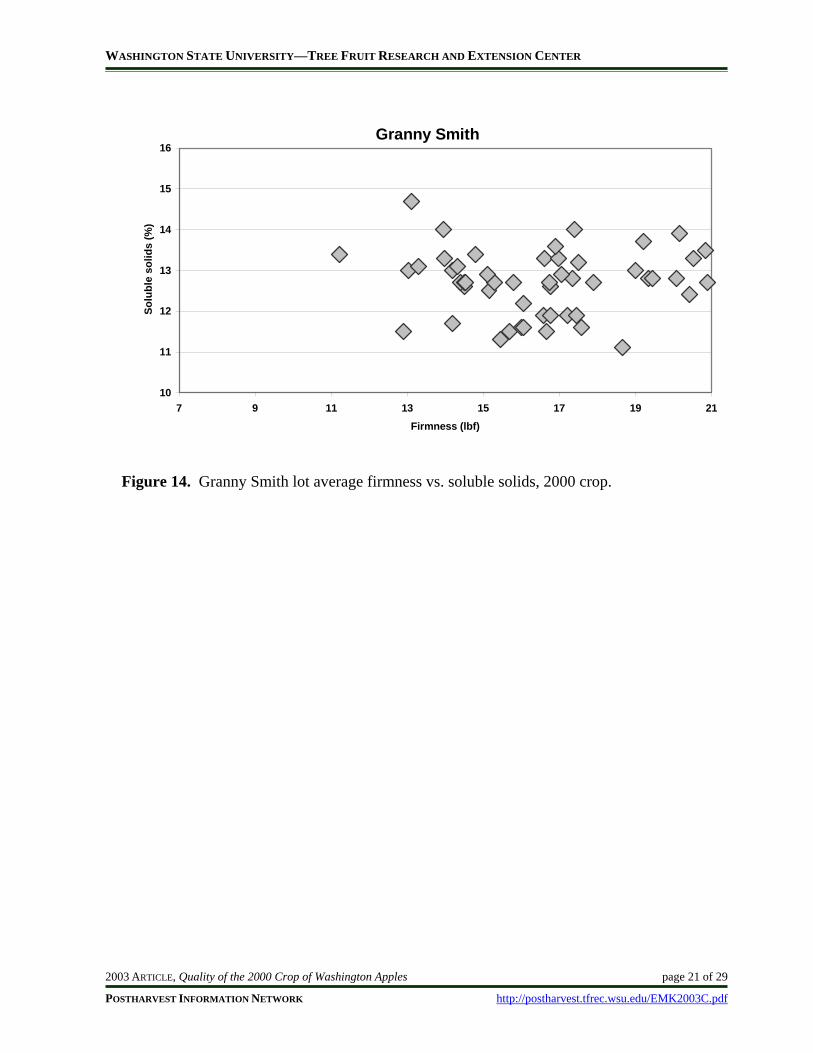
3.4.1 2000 Granny Smith Crop The individual firmness readings of Washington State Granny Smith apples (623 apples) are shown in Figure 13. Firmness readings ranged from 8 lbf to 28 lbf, with the average at 17 lbf; 95% of the readings were between 11 and 22 lbf. Lot average firmnesses vs. soluble solids levels for Granny Smith are shown in Figure 14.
There was a marked decline in firmness lot averages and titratable acidity, as well as a slight decline in the soluble solids levels as the season progressed (Figure 15).
Five or more Granny Smith samples were collected from only two packinghouses (Table 11) but the quality varied between the two packinghouses. The Granny Smith apples packinghouse “a” packed had higher acidity (0.62%) and lower firmness (15.5 lbf), than the fruit from packinghouse “v” (0.51% acidity and 17.6 lbf firmness). Soluble solids levels were the same for both packinghouses.
Table 11. Summary of Granny Smith quality attributes, by packinghouse. Packinghouse TSS (%) Acidity (%) Firmness (lbf)
a 12.9 0.62 15.5 b 12.6 0.56 14.5 d 12.9 0.64 15.5 e 13.0 0.54 17.0 j 12.4 0.59 16.8 n 14.0 0.73 x o 12.3 0.66 17.3 q 13.0 0.68 16.7 r 12.6 0.57 18.0 s 12.3 0.66 17.3 t 12.1 0.58 16.0 u 11.5 0.52 12.9 v 12.9 0.51 17.6
Average 12.7 0.58 16.5 Range 11 to 15 0.32 to 0.76 11 to 21
Values in bold italics indicate more than five lots sampled.

WASHINGTON STATE UNIVERSITY—TREE FRUIT RESEARCH AND EXTENSION CENTER
2003 ARTICLE, Quality of the 2000 Crop of Washington Apples page 20 of 29
POSTHARVEST INFORMATION NETWORK http://postharvest.tfrec.wsu.edu/EMK2003C.pdf
3.4.2 Historical Perspective for Granny Smith There is a very limited amount of data from 1995 to compare with the 2000 crop (Table 12). Granny Smith apples sampled in 1995 were firmer than those sampled in 2000. Soluble solids levels were about the same, while acidity was much more variable in 2000.
Table 12. Comparison of Granny Smith quality attributes in 1995 and 2000. 1995 Crop 2000 Crop
Firmness (lbf) average range
18.7 (18 to 19)
16.5 (11 to 21)
Soluble solids (%) average range
12.9 (12 to 13)
12.7 (11 to 15)
Acidity (%) average range
0.54 (0.51 to 0.56)
0.58 (0.32 to 0.76)
Number of lots 14 56
Granny Smith Firmnessper penetrometer measurement (two measurements per apple)
0
20
40
60
80
100
120
7 8 9 10 11 12 13 14 15 16 17 18 19 20 21 22 23 24 25 26 27Firmness (lbf)
Tota
l pen
etro
met
er m
easu
rem
ents
623 Apples
Figure 13. Granny Smith firmness (per penetrometer measurement), 2000 crop.
WASHINGTON STATE UNIVERSITY—TREE FRUIT RESEARCH AND EXTENSION CENTER
2003 ARTICLE, Quality of the 2000 Crop of Washington Apples page 21 of 29
POSTHARVEST INFORMATION NETWORK http://postharvest.tfrec.wsu.edu/EMK2003C.pdf
Granny Smith
10
11
12
13
14
15
16
7 9 11 13 15 17 19 21Firmness (lbf)
Solu
ble
solid
s (%
)
Figure 14. Granny Smith lot average firmness vs. soluble solids, 2000 crop.

WASHINGTON STATE UNIVERSITY—TREE FRUIT RESEARCH AND EXTENSION CENTER
2003 ARTICLE, Quality of the 2000 Crop of Washington Apples page 22 of 29
POSTHARVEST INFORMATION NETWORK http://postharvest.tfrec.wsu.edu/EMK2003C.pdf
Granny Smith
10
11
12
13
14
15
16
7 9 11 13 15 17 19 21Firmness (lbf)
Solu
ble
solid
s (%
)
Figure 14. Granny Smith lot average firmness vs. soluble solids, 2000 crop.
Figure 15. Granny Smith lot average firmness, TA and TSS by week, 2000 crop.

WASHINGTON STATE UNIVERSITY—TREE FRUIT RESEARCH AND EXTENSION CENTER
2003 ARTICLE, Quality of the 2000 Crop of Washington Apples page 23 of 29
POSTHARVEST INFORMATION NETWORK http://postharvest.tfrec.wsu.edu/EMK2003C.pdf
3.5 GALA
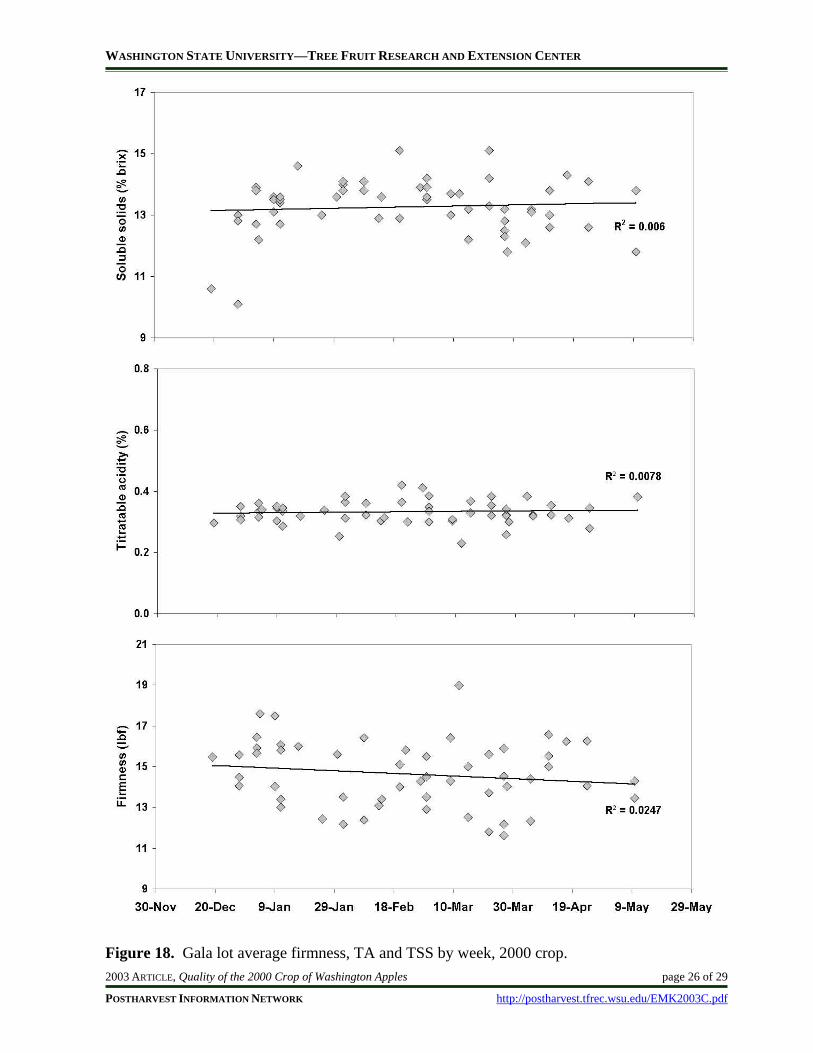
3.5.1 2000 Gala Crop The individual firmness readings of Washington Gala apples (507 apples) are shown in Figure 16. Gala firmness readings averaged 14 lbf with 95% of the readings between 10 and 19 lbf. Over 17% of the readings were below 12 lbf. Lot average firmnesses vs. soluble solids levels for Galas are shown in Figure 17.
Gala sampling ended in mid-May 2001. Firmness declined slightly during the sampling period and individual lot values were scattered between 11 and 18 lbf (Figure 18).
Titratable acidity was relatively consistent and did not decline during the sampling period (Figure 18). The acidity levels did not vary significantly between packinghouses and averaged 0.34% (Table 13). Soluble solids increased during the season (Figure 18). However, at the beginning and end of the sampling period there were some low soluble solids values (below 12%). Between packinghouses there were some differences in soluble solids, with a range of 12.6 to 13.8%.
Table 13. Summary of Gala quality attributes, by packinghouse. Packinghouse TSS (%) Acidity (%) Firmness (lbf)
a 13.6 0.32 15.3 b 13.7 0.37 13.5 c 12.8 0.33 15.2 e 14.0 0.36 16.0 f 14.0 0.41 14.0 g 13.3 0.32 14.1 h 13.8 0.35 12.3 i 13.2 0.35 14.8 j 12.6 0.34 14.4 k 13.0 0.34 16.0 l 13.8 0.34 14.4
m 13.0 0.31 15.0 n 14.3 0.32 13.3 o 12.7 0.32 16.3 r 14.5 0.38 15.5 s 12.5 0.35 13.6 u 13.0 0.31 14.0 v 13.8 0.24 17.5
Average 13.3 0.33 14.6 Range 10 to 15 0.23 to 0.42 8 to 16
Values in bold italics more than five lots sampled.

WASHINGTON STATE UNIVERSITY—TREE FRUIT RESEARCH AND EXTENSION CENTER
2003 ARTICLE, Quality of the 2000 Crop of Washington Apples page 24 of 29
POSTHARVEST INFORMATION NETWORK http://postharvest.tfrec.wsu.edu/EMK2003C.pdf
3.5.2 Historical Perspective for Gala Gala apples were sampled during the packing of the 1992, 1993, 1995 and 2000 crops (Table 14). Fruit firmness has gone down significantly while soluble solids were about the same and acidity has decreased. However, it is possible in 1992, 1993 and 1995 fruit were sampled earlier in the harvest. The 2000 sampling period only began in December that average firmness values are not typical of the entire season. (We have collected data from the start of the Gala shipping season for the 2001 crop).
Table 14. Comparison of Gala quality attributes over the past 10 years. 1992 Crop 1993 Crop 1995 Crop 2000 Crop
Firmness (lbf) average range
16.1 (14 to 18)
16.7 (13 to 20)
15.2 (12 to 18)
14.6 (8 to 16)
Soluble solids (%) average range
13 (11 to 16)
13.1 (11 to 16)
13.9 (12 to 16)
13.3 (10 to 15)
Acidity (%) average range
0.53 (0.32 to 0.82)
0.42 (0.32 to 0.56)
0.3 (0.22 to 0.38)
0.33 (0.23 to 0.42)
Number of lots 180 100 210 55
Gala Firmnessper penetrometer measurement (two measurements per apple)
0102030405060708090
7 8 9 10 11 12 13 14 15 16 17 18 19 20 21 22 23 24 25 26 27Firmness (lbf)
Tota
l pen
etro
met
er m
easu
rem
ents
507 Apples
Figure 16. Gala firmness (per penetrometer measurement), 2000 crop.

WASHINGTON STATE UNIVERSITY—TREE FRUIT RESEARCH AND EXTENSION CENTER
2003 ARTICLE, Quality of the 2000 Crop of Washington Apples page 25 of 29
POSTHARVEST INFORMATION NETWORK http://postharvest.tfrec.wsu.edu/EMK2003C.pdf
Gala
10
11
12
13
14
15
16
7 9 11 13 15 17 19 21Firmness (lbf)
Solu
ble
solid
s (%
)
Figure 17. Gala lot average firmness vs. soluble solids, 2000 crop.
WASHINGTON STATE UNIVERSITY—TREE FRUIT RESEARCH AND EXTENSION CENTER
2003 ARTICLE, Quality of the 2000 Crop of Washington Apples page 26 of 29
POSTHARVEST INFORMATION NETWORK http://postharvest.tfrec.wsu.edu/EMK2003C.pdf
Figure 18. Gala lot average firmness, TA and TSS by week, 2000 crop.

WASHINGTON STATE UNIVERSITY—TREE FRUIT RESEARCH AND EXTENSION CENTER
2003 ARTICLE, Quality of the 2000 Crop of Washington Apples page 27 of 29
POSTHARVEST INFORMATION NETWORK http://postharvest.tfrec.wsu.edu/EMK2003C.pdf
3.6 BRAEBURN, JONAGOLD, PINK LADY® BRAND AND CAMEO The firmness readings of Washington Braeburn apples (146 apples) ranged from 9.5 to 20.5 lbf. There were too few apples sampled to make observations. Firmness histograms for Braeburn (146 apples), Jonagold (70 apples), Pink Lady® brand (85 apples) and Cameo (30 apples) are included (Figures 19 to 22).
Averages and ranges of quality factors in Braeburn, Cameo, Jonagold and Pink Lady® brand apples (Table 15) were calculated from less than 20 lots of fruit. As a result of this limited sampling no packinghouse comparison is presented.
Table 15. Quality attributes for Braeburn, Jonagold, Pink Lady® brand and Cameo. TSS (%) Acidity (%) Firmness (lbf) Average Range Average Range Average Range
Braeburn 13.1 12 to 15 0.45 0.23 to 0.52 15.3 12 to 18 Jonagold 13.6 12 to 15 0.39 0.27 to 0.52 10.8 10 to 13 Pink Lady® 14.0 14 to 15 0.69 0.56 to 0.80 18.3 16 to 21 Cameo 13.4 13 to 14 0.32 0.24 to 0.44 15.3 12 to 18
Braeburn Firmnessper penetrometer measurement (two measurements per apple)
0
5
10
15
20
25
30
7 8 9 10 11 12 13 14 15 16 17 18 19 20 21 22 23 24 25 26 27Firmness (lbf)
Tota
l pen
etro
met
er m
easu
rem
ents
146 Apples
Figure 19. Braeburn firmness (per penetrometer measurement), 2000 crop.

WASHINGTON STATE UNIVERSITY—TREE FRUIT RESEARCH AND EXTENSION CENTER
2003 ARTICLE, Quality of the 2000 Crop of Washington Apples page 28 of 29
POSTHARVEST INFORMATION NETWORK http://postharvest.tfrec.wsu.edu/EMK2003C.pdf
Jonagold Firmnessper penetrometer measurement (two measurements per apple)
0
5
10
15
20
7 8 9 10 11 12 13 14 15 16 17 18 19 20 21 22 23 24 25 26 27Firmness (lbf)
Tota
l pen
etro
met
er m
easu
rem
ents
70 Apples
Figure 20. Jonagold firmness (per penetrometer measurement), 2000 crop.
Pink Lady® Brand Firmnessper penetrometer measurement (two measurements per apple)
02468
10121416
7 8 9 10 11 12 13 14 15 16 17 18 19 20 21 22 23 24 25 26 27Firmness (lbf)
Tota
l pen
etro
met
er m
easu
rem
ents
85 Apples
Figure 21. Pink Lady® brand apple firmness (per penetrometer measurement), 2000 crop.

WASHINGTON STATE UNIVERSITY—TREE FRUIT RESEARCH AND EXTENSION CENTER
2003 ARTICLE, Quality of the 2000 Crop of Washington Apples page 29 of 29
POSTHARVEST INFORMATION NETWORK http://postharvest.tfrec.wsu.edu/EMK2003C.pdf
Cameo Firmnessper penetrometer measurement (two measurements per apple)
012345678
7 8 9 10 11 12 13 14 15 16 17 18 19 20 21 22 23 24 25 26 27Firmness (lbf)
Tota
l pen
etro
met
er m
easu
rem
ents
30 Apples
Figure 22. Cameo firmness (per penetrometer measurement), 2000 crop.