Embed Size (px)
Citation preview

Data 2011–12
2015 edition
Quality report on European statistics on international trade in goods
Exer in vu
lla faci blam
con
se euis n
ibh
el utat d
ip ex elestisim
R
ilis aug
iati siscilit venis n
im
Statistical working papers
ISSN 1681-4789
2013
ed
ition
ISSN 2315-0807


Data 2011–12
2015 edition
Quality report on European statisticson international trade in goods
Statistical working papers
2015 edition

Europe Direct is a service to help you find answersto your questions about the European Union.
Freephone number (*):
00 800 6 7 8 9 10 11(*) The information given is free, as are most calls (though some operators, phone
boxes or hotels may charge you).
More information on the European Union is available on the Internet (http://europa.eu).
Cataloguing data can be found at the end of this publication.
Luxembourg: Publications Office of the European Union, 2015
ISBN 978-92-79-48302-8ISSN 2315-0807doi:10.2785/648459Cat. No: KS-TC-15-002-EN-N
Theme 6: International tradeCollection: Statistical working papers
© European Union, 2015Reproduction is authorised provided the source is acknowledged.
Contents
Quality report on European statistics on international trade in goods
Quality Report on International Trade in Goods Statistics
3
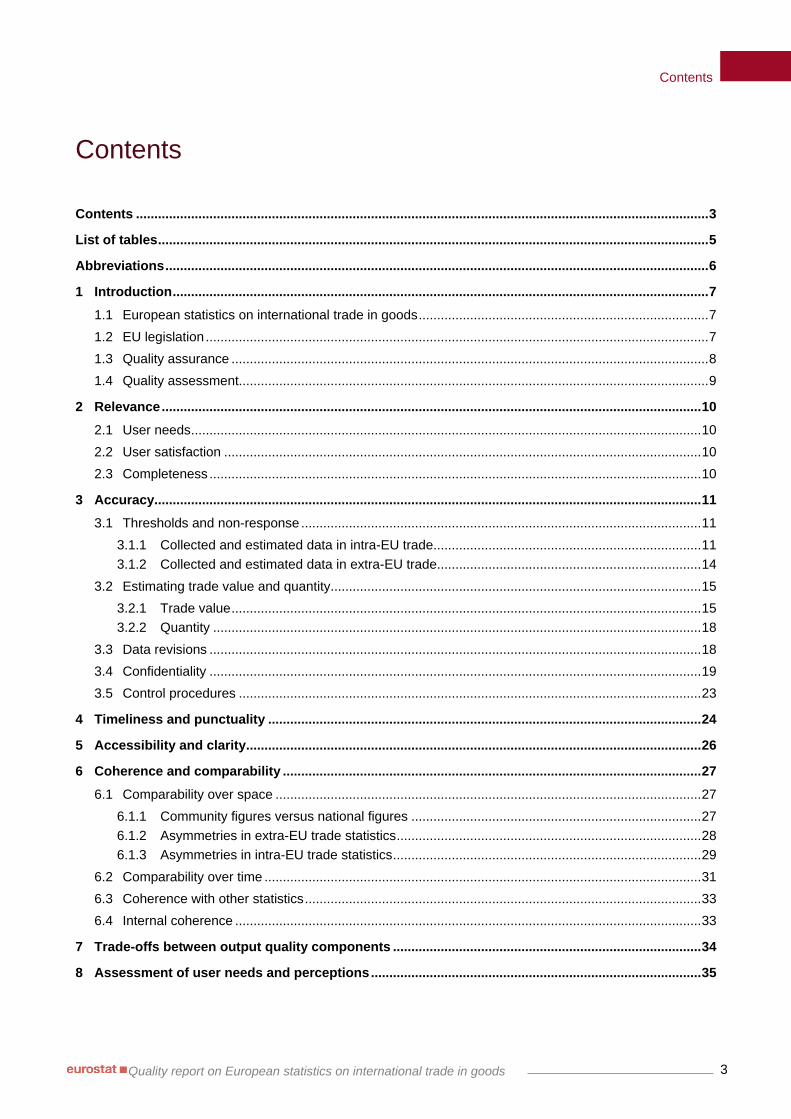
Contents
Contents ............................................................................................................................................................ 3
List of tables ...................................................................................................................................................... 5
Abbreviations .................................................................................................................................................... 6
1 Introduction .................................................................................................................................................. 7
1.1 European statistics on international trade in goods ............................................................................... 7
1.2 EU legislation ......................................................................................................................................... 7
1.3 Quality assurance .................................................................................................................................. 8
1.4 Quality assessment................................................................................................................................ 9
2 Relevance ................................................................................................................................................... 10
2.1 User needs ........................................................................................................................................... 10
2.2 User satisfaction .................................................................................................................................. 10
2.3 Completeness ...................................................................................................................................... 10
3 Accuracy..................................................................................................................................................... 11
3.1 Thresholds and non-response ............................................................................................................. 11
3.1.1 Collected and estimated data in intra-EU trade ......................................................................... 11
3.1.2 Collected and estimated data in extra-EU trade ........................................................................ 14
3.2 Estimating trade value and quantity..................................................................................................... 15
3.2.1 Trade value ................................................................................................................................ 15
3.2.2 Quantity ..................................................................................................................................... 18
3.3 Data revisions ...................................................................................................................................... 18
3.4 Confidentiality ...................................................................................................................................... 19
3.5 Control procedures .............................................................................................................................. 23
4 Timeliness and punctuality ...................................................................................................................... 24
5 Accessibility and clarity ............................................................................................................................ 26
6 Coherence and comparability .................................................................................................................. 27
6.1 Comparability over space .................................................................................................................... 27
6.1.1 Community figures versus national figures ............................................................................... 27
6.1.2 Asymmetries in extra-EU trade statistics ................................................................................... 28
6.1.3 Asymmetries in intra-EU trade statistics .................................................................................... 29
6.2 Comparability over time ....................................................................................................................... 31
6.3 Coherence with other statistics ............................................................................................................ 33
6.4 Internal coherence ............................................................................................................................... 33
7 Trade-offs between output quality components .................................................................................... 34
8 Assessment of user needs and perceptions .......................................................................................... 35

Contents
Quality report on European statistics on international trade in goods
Quality Report on International Trade in Goods Statistics
4
9 Performance, cost and respondent burden ............................................................................................ 36
9.1 Performance and cost .......................................................................................................................... 36
9.2 Respondent burden ............................................................................................................................. 36
10 Confidentiality, transparency and security ............................................................................................. 40
Annex — Data for 2011 .................................................................................................................................. 41
Glossary .......................................................................................................................................................... 53

List of tables
Quality report on European statistics on international trade in goods
Quality Report on International Trade in Goods Statistics
5
List of tables
Table 1: Shares of collected and estimated data in intra-EU trade, 2012 ........................................................12
Table 2: Estimates in intra-EU trade — Level of details, 2012 .........................................................................13
Table 3: Shares of collected and estimated data in extra-EU trade, 2012 .......................................................14
Table 4: Estimates in extra-EU trade — Level of details, 2012 ........................................................................15
Table 5: Intra-EU trade — Estimated statistical value vs collected invoice value, 2011 ..................................16
Table 6: Intra-EU trade — Exemption from statistical value reporting and estimation, 2012 ...........................17
Table 7: Impact of revisions in intra- and extra-EU trade, 2012 .......................................................................19
Table 8: Impact of confidentiality in intra-EU trade, 2012 .................................................................................20
Table 9: Impact of confidentiality in extra-EU trade, 2012 ................................................................................21
Table 10: Number of CN8 codes according to the type of confidentiality, 2012 ...............................................22
Table 11: Punctuality of detailed and aggregated data, 2012 ..........................................................................25
Table 12: Conceptual differences between European statistics and national statistics, 2012 .........................28
Table 13: Asymmetries with the top-10 extra-EU partner countries, 2012 .......................................................29
Table 14: Intra-EU asymmetries, 2012 .............................................................................................................30
Table 15: Changes affecting comparability over time .......................................................................................31
Table 16: Changes to CN8 codes over time .....................................................................................................32
Table 17: Coherence across domains ..............................................................................................................33
Table 18: Intrastat exemption thresholds and share of beneficiary traders, 2012 ............................................37
Table 19: Intrastat simplification thresholds and share of beneficiary PSIs, 2012 ...........................................37
Table 20: Intrastat statistical value thresholds and share of beneficiary PSIs, 2012 .......................................38
Table 21: Extrastat statistical thresholds, 2012 ................................................................................................39

Abbreviations
Quality report on European statistics on international trade in goods
Quality Report on International Trade in Goods Statistics
6
Abbreviations
BoP Balance of payments
CN Combined Nomenclature
EU European Union
HS Harmonized System
ITGS International Trade in Goods Statistics
PSI Provider of statistical information
SME Small- and medium-size enterprise
UN United Nations
VAT Value added tax
VIES VAT Information Exchange System

1 Introduction
Quality report on European statistics on international trade in goods
Quality Report on International Trade in Goods Statistics
7
1 Introduction The purpose of this Quality Report is to provide users with a tool for assessing the quality of the
international trade in goods statistics (ITGS) disseminated by Eurostat. It complements the User Guide,
which sets out the concepts and definitions used for the data collection and compilation, and provides
information on collection, compilation and dissemination of European statistics on international trade in
goods.
The Report presents the main quality indicators compiled for the reference years 2011 and 2012. The
purpose is not to rank the EU Member States from best to worst for each indicator, but to provide users
with information on different factors affecting statistics, thus allowing them to assess data quality.
1.1 European statistics on international trade in goods
The European statistics on international trade in goods measure the value and quantity of goods traded
between the EU Member States (intra-EU trade) and goods traded by them with non-EU countries
(extra-EU trade). They are the official harmonised source of information about the imports, exports and
trade balance of the European Union (EU), its Member States and the euro area.
As international trade forms an important part of the world economy, statistics on the trading of goods are
a key instrument for numerous public and private sector decision-makers. For example, the European
ITGS:
enable Community authorities to prepare multilateral and bilateral negotiations in the framework of
the common commercial policy;
enable Community authorities to evaluate the progress of the Single Market and the integration of
EU economies;
constitute an essential source of information for balance of payments statistics, national accounts and
economic studies; and
help EU enterprises to conduct market research and develop their commercial strategy.
This list, which is not exhaustive, demonstrates the diversity of the users and of their needs.
ITGS are based on two data collection systems: Extrastat and Intrastat. Extrastat data, which relate to
the trading of goods with non-EU countries, are collected by customs administrations and are based on
the records of trade transactions in customs declarations. Intrastat data, which relate to the trading of
goods between the EU Member States, are collected once a month directly from traders. This direct data
collection is the consequence of the implementation of the Single Market and the abolition of customs
controls at the borders between Member States in 1993.
1.2 EU legislation Generally speaking, EU law (the acquis communautaire) comprises primary and secondary legislation.
The primary legislation consists of the Treaties, principally the Treaty on the European Union
(Maastricht Treaty entered in force in 1993) and the Treaty on the Functioning of the European Union
(former Treaty of Rome entered in force in 1958). The latest amendments were introduced by the Treaty
of Lisbon, which came into force in 2009.
The secondary legislation consists of regulations, directives, decisions, recommendations and opinions
based on the Treaties. Regulations are directly applicable in Member States and national laws do not need
to be adopted for them to be implemented.
As regards the production of ITGS, regulations ensure a harmonised approach by all Member States. The
EU provisions apply directly to European statistics only; they do not regulate the methods of compiling
data required for national purposes.

1 Introduction
Quality report on European statistics on international trade in goods
Quality Report on International Trade in Goods Statistics
8
The provisions on EU ITGS are determined in several regulations and address intra- and extra-EU trade
separately. The basic regulations adopted by the Council and the European Parliament establish the
essential rules governing ITGS. The implementing provisions are adopted by the Commission and
contain more detail as regards the implementation of certain articles of the basic regulations. The
Commission can lay down implementing rules only for the articles for which it has been given the
implementing power.
The legal basis for intra- and extra-EU trade statistics relating to 2012 was established in 2009. The
revised regulations did not introduce major changes to the general concepts and definitions, but allowed
for more simplification as regards intra-EU trade and aligned the extra-EU trade statistics with the
Modernised Customs Code. Both regulations included articles on standardised procedures for quality
reporting.
INTRA-EU TRADE
Basic regulation:
Regulation (EC) No 638/2004 of the European Parliament and of the Council
amended by Regulation (EC) No 222/2009
Implementing provisions:
Commission Regulation (EC) No 1982/2004
amended by Commission Regulation (EC) No 1915/2005
Commission Regulation (EU) No 91/2010
Commission Regulation (EU) No 96/2010
NB: This set of legal acts is commonly referred to as ‘Intrastat legislation’.
EXTRA-EU TRADE
Basic regulation:
Regulation (EC) No 471/2009 of the European Parliament and of the Council
Implementing provisions:
Commission Regulation (EU) No 113/2010
Commission Regulation (EU) No 92/2010
NB: This set of legal acts is commonly referred to as ‘Extrastat legislation’.
1.3 Quality assurance
The concept of quality applied in ITGS is in line with the definition developed by the European Statistical
System (ESS), whereby the components of quality are relevance, accuracy, timeliness and punctuality,
accessibility and clarity, comparability and coherence. Each component consists of several
subcomponents.
Quality reporting is not a new concept in ITGS. In 2005, the ITGS legislation made annual reporting on
particular quality indicators for intra-EU trade statistics mandatory. Since 2009, it has included a similar
requirement for extra-EU trade statistics. Member States have to provide Eurostat with an annual report
covering the standard quality criteria within a fixed deadline. In practice, this reporting process has been
harmonised: Member States fulfil their quality reporting obligation by completing a report pre-filled by
Eurostat. The key quality indicators are set out in this summary Quality Report.

1 Introduction
Quality report on European statistics on international trade in goods
Quality Report on International Trade in Goods Statistics
9
1.4 Quality assessment
Main strengths of the ITGS: relevance, timeliness and punctuality, accessibility, comparability, clarity
and coherence
Relevance — The key users of ITGS and their respective needs are very well known. The data
relevance can be assessed as good thanks to regular satisfaction surveys and frequent informal and
formal contacts with users.
Timeliness and punctuality — The EU ITGS benefit from well-established data collection and
compilation procedures and also from the Intrastat and Extrastat regulations, which include deadlines
for data transmission to Eurostat.
Accessibility — All dissemination channels are used: electronic and paper publications, predefined
tables, databases, DVDs and FTP addresses for bulk downloads.
Comparability over time — The EU ITGS benefit from a high level of comparability over time thanks
to the stability of the concepts, definitions and classifications. As far as possible, this comparability is
also maintained when methodological changes occur, thanks to the retroactive recalculation of the
time series.
Comparability across countries — The EU ITGS benefit from a high level of comparability across
countries thanks to the implementation of harmonised rules for data collection and compilation. As far
as possible, the concepts and definitions in EU legislation follow the international standards promoted
by the United Nations Statistical Division.
Comparability across domains — The EU ITGS constitute an essential source of information for the
compilation of the balance of payments statistics and national accounts. Nevertheless, comparability
across domains is affected by differences in concepts and definitions which mean that the ITGS first
have to be adjusted.
Clarity — The dissemination of the ITGS is supported by a complete set of structural metadata that
make it easy to identify, retrieve and browse the data. The reference metadata describing the contents
and the data quality are also quite exhaustive. In particular, it is worth mentioning the User Guide and
the annual Quality Report.
Coherence — The Intrastat and Extrastat regulations ensure the harmonisation of the concepts and
definitions applied by the Member States when compiling the data to be provided to Eurostat. In
addition, the coherence is strengthened by Eurostat’s harmonised approach to data production and
dissemination regardless of the type of trade — intra- or extra-EU trade — and the reporting country.
Main area of potential quality improvement: accuracy and comparability
Accuracy — The EU ITGS benefit from well-established data collection systems supported by
efficient validation and compilation tools. However, the intra-EU trade statistics may suffer from
some trade operators responding late or not at all to requests that they report their trade in goods. In
addition, confidentiality has an impact on data accuracy at very detailed (i.e. CN eight-digit) level.
Comparability — The comparability across countries could be improved through further
harmonisation in the Member States’ practices as regard specific goods or movements. In addition,
regular ‘mirror’ analyses (comparing the trade flows reported by the two trading partners) reveal a
lack of accuracy in the detailed statistics. That said, it should be kept in mind that basic data consist of
millions of records each month and it is impossible to achieve complete accuracy. As in all statistical
work, a balance has to be struck between the resources devoted to checking and the likely benefit.
Therefore the users should be aware of the margin of inaccuracy in the data used, at least at the most
detailed level of data.

2 Relevance
Quality report on European statistics on international trade in goods
Quality Report on International Trade in Goods Statistics
10
2 Relevance
ESS DEFINITION
Relevance is the degree to which statistical outputs meet current and potential user needs. It depends on whether all the statistics that are needed are produced and the extent to which concepts used (definitions, classifications etc.) reflect user needs.
2.1 User needs
ITGS are an important primary source for most public and private sector decision-makers. For example,
at EU level, international trade data are used extensively for multilateral and bilateral negotiations in the
framework of the common commercial policy, to develop and implement anti-dumping policy, and to
evaluate the progress of the Single Market and many other policies. They also constitute an essential
source for the compilation of balance of payments statistics and national accounts. In addition, they help
European enterprises carry out market research and determine their commercial strategy.
International trade in goods forms an important part of the world economy and, as such, must be
measured reliably and the relevant statistical data should be comparable and widely disseminated. The
statistics satisfy this need in a variety of ways. Users may need overall figures or very detailed data by
product and partner. They may be interested in trade values in current prices or in trade volumes at
constant prices. Alternatively, their interest may be in the weight of trade or in some other quantity
measures.
These examples, which are far from exhaustive, show the diversity of the users and their requirements.
Eurostat tries to meet these various needs and to adapt to the changing, increasingly global environment.
In particular, the Intrastat and Extrastat Regulations and the ITGS classifications are revised regularly in
order to take into account users’ needs and the economic and administrative environment.
2.2 User satisfaction
User needs are monitored regularly. At EU level, there are regular contacts with key institutional users
(e.g. Commission services or the European Central Bank) and with other main user groups such as trade
associations. In daily work, users can easily communicate their requests and needs to Eurostat by using
dedicated tools integrated in the data dissemination.
Eurostat undertook its last large-scale user satisfaction survey focusing on ITGS in 2007. The survey
found a very high level of satisfaction among users: 85 % were very or fairly satisfied with the data. This
high level of satisfaction has been confirmed by every general User Satisfaction Survey carried out by
Eurostat since then (in 2009, 2011, 2012 and 2013). In the 2013 general survey, ‘International trade’
received the second most positive evaluation of all the statistical domains, with 60.5 % of respondents
rating the data quality as very good or good and 19.3 % as adequate. ‘Economy and finance’ statistics
received the highest evaluation, with 62.4 % (very good or good) and 18.5 % (adequate) respectively.
These two domains outperformed the average rates.
Many Member States also conduct regular user satisfaction surveys. All surveys show a very high level of
satisfaction as regards ITGS.
2.3 Completeness
The EU ITGS are based on EU legislation that is directly applicable in the Member States. In particular,
the legislation includes a clear and precise list of all the statistical variables with which all Member States
must provide Eurostat.

3 Accuracy
Quality report on European statistics on international trade in goods
Quality Report on International Trade in Goods Statistics
11
3 Accuracy
ESS DEFINITION
The accuracy of statistical outputs in the general statistical sense is the degree of closeness of estimates to the true values.
The accuracy of ITGS is affected in different ways by several factors:
thresholds and non-response;
estimation of trade value and quantity;
data revisions;
confidentiality; and
control procedures.
3.1 Thresholds and non-response
3.1.1 Collected and estimated data in intra-EU trade
In order to reduce the statistical burden on business, intra-EU trade data are collected only from the
biggest intra-EU traders. An enterprise has to submit Intrastat declarations if its annual intra-EU trade
exceeds a certain threshold. Intrastat data collection does not therefore cover 100 % of Member States’
intra-EU trade. To achieve complete coverage, the loss caused by the thresholds and by non-response
from traders shall be compensated with estimates.
Table 1 shows the shares of collected and estimated data (for trade below the exemption threshold and for
non- or late response) in total intra-EU trade.

3 Accuracy
Quality report on European statistics on international trade in goods
Quality Report on International Trade in Goods Statistics
12
Table 1: Shares of collected and estimated data in intra-EU trade, 2012 (%)
Collected data
Estimated data
Below threshold Non response
Arrivals Dispatches Arrivals Dispatches Arrivals Dispatches
Belgium 96.4 98.1 (*) 3.6 (*) 1.9
Bulgaria 96.6 98.1 3.3 1.8 0.1 0.1
Czech Republic 95.9 97.8 3.9 2.0 0.2 0.2
Denmark 91.3 94.2 6.7 4.7 2.0 1.1
Germany 95.9 98.1 2.9 1.6 1.2 0.4
Estonia 91.6 93.7 3.4 2.0 5.0 4.2
Ireland 96.6 98.2 2.8 1.0 0.6 0.8
Greece 96.9 98.0 2.5 1.2 0.6 0.8
Spain 96.5 97.8 2.7 1.6 0.8 0.6
France 98.0 98.6 1.6 1.2 0.4 0.2
Italy 98.5 99.1 1.5 0.9 0.0 0.0
Cyprus 96.8 91.5 2.3 1.9 0.9 6.5
Latvia 89.8 92.4 (*) 10.2 (*) 7.6
Lithuania 95.5 97.7 3.8 2.1 0.6 0.2
Luxembourg 98.2 97.1 1.8 0.9 0.1 2.0
Hungary 91.1 95.8 4.8 2.7 4.1 1.4
Malta (**) 99.0 99.0 No est. No est. No est. No est.
Netherlands 89.3 94.1 (*) 10.7 (*) 5.9
Austria 94.9 97.8 4.3 1.7 0.8 0.5
Poland 97.8 98.6 1.8 1.2 0.4 0.3
Portugal 95.6 97.2 3.5 2.2 0.9 0.7
Romania 97.2 97.4 1.8 1.6 1.0 1.0
Slovenia 97.2 98.3 2.8 1.7 0.0 0.0
Slovakia 89.9 92.4 3.5 2.6 6.6 5.0
Finland 94.8 97.3 3.5 1.9 1.6 0.8
Sweden 95.8 97.9 3.4 1.8 0.8 0.4
United Kingdom 95.2 97.5 3.6 2.4 1.2 0.1
Note: The share of estimated data refers to the share in the final data transmitted to Eurostat. This is larger for first and intermediate data.
(*) Estimates both for trade below the exemption threshold and non-response.
(**) No estimate is compiled for trade below the exemption threshold and non-response.
Source: Eurostat calculations based on detailed statistics transmitted by Member States

3 Accuracy
Quality report on European statistics on international trade in goods
Quality Report on International Trade in Goods Statistics
13
The estimates are compiled on the basis of the information in enterprises’ fiscal declarations — VAT
returns or recapitulative statements (VIES data). Intrastat declarations submitted by enterprises above the
exemption threshold are used to allocate the estimated total trade values by partner and product
Under EU legislation, estimates are to be broken down at least by partner Member State and two-digit
codes of the Combined Nomenclature.
Table 2 indicates the levels at which the estimates are compiled.
Table 2: Estimates in intra-EU trade — Level of details, 2012
Estimates for trade
below threshold Estimates for non-response
Belgium CN8 / partner countries CN8 / partner countries
Bulgaria HS2 / partner countries HS2 / partner countries
Czech Republic CN8 / partner countries CN8 / partner countries
Denmark CN8 / partner countries CN8 / partner countries
Germany HS2 / partner countries HS2 / partner countries
Estonia HS2 / partner countries HS2 / partner countries
Ireland By partner only CN8 / partner countries
Greece HS2 / partner countries HS2 / partner countries
Spain HS2 / partner countries HS2 / partner countries
France HS2 / partner countries HS2 / partner countries
Italy HS2 / partner countries No estimate
Cyprus CN8 / partner countries CN8 / partner countries
Latvia HS2 / partner countries HS2 / partner countries
Lithuania HS2 / partner countries HS2 / partner countries
Luxembourg HS2 / partner countries CN8 / partner countries
Hungary HS4 / partner countries HS4 / partner countries
Malta No estimate No estimate
Netherlands HS2 / partner countries HS2 / partner countries
Austria CN8 / partner countries CN8 / partner countries
Poland CN8 / partner countries CN8 / partner countries
Portugal CN8 / partner countries CN8 / partner countries
Romania HS4 / partner countries HS4 / partner countries
Slovenia CN8 / partner countries CN8 / partner countries
Slovakia CN8 / partner countries CN8 / partner countries
Finland HS2 / partner countries HS2 / partner countries
Sweden HS2 / partner countries HS2 / partner countries
United Kingdom CN8 / partner countries HS2 / partner countries
Note: The Combined Nomenclature is based on the Harmonised Commodity Description and Coding System (HS). The Harmonized System (HS) is an international classification at two (HS2), four (HS4) and six-digit (HS6) level. The CN corresponds to the HS plus a further breakdown at eight-digit (CN8) level.
Source: Detailed statistics transmitted by Member States

3 Accuracy
Quality report on European statistics on international trade in goods
Quality Report on International Trade in Goods Statistics
14
3.1.2 Collected and estimated data in extra-EU trade
Theoretically, the problem of late or non-response should not exist in the Extrastat system. Nevertheless,
estimates may have to be made to make up for delayed or incomplete customs records. In addition, for
simplification purposes, Member States are allowed to compile less detailed information for transactions
below the statistical threshold of EUR 1 000 and 1 000 kilograms.
Table 3 shows the proportions of collected and estimated data in total extra-EU trade.
Table 3: Shares of collected and estimated data in extra-EU trade, 2012 (%)
Collected data Estimated data
Standard category
Less detailed data (below statistical
threshold)
Delayed or incomplete records
Imports Exports Imports Exports Imports Exports
Belgium 100.0 100.0
Bulgaria 100.0 100.0
Czech Republic 100.0 100.0
Denmark 100.0 100.0 0.0 0.0
Germany 100.0 100.0
Estonia 100.0 100.0
Ireland 100.0 100.0
Greece 100.0 100.0
Spain 100.0 100.0
France 100.0 100.0
Italy 99.6 99.0 0.4 1.0
Cyprus 100.0 94.3 5.7
Latvia 100.0 100.0
Lithuania 100.0 100.0
Luxembourg 100.0 100.0
Hungary 100.0 100.0
Malta 100.0 100.0
Netherlands 99.6 99.9 0.4 0.1
Austria 100.0 100.0
Poland 100.0 100.0
Portugal 100.0 100.0
Romania 100.0 100.0
Slovenia 100.0 99.9 0.0 0.1
Slovakia 100.0 100.0
Finland 100.0 100.0
Sweden 100.0 100.0
United Kingdom 98.4 98.5 1.6 1.5
Source: Eurostat calculations based on detailed statistics transmitted by Member States
Under EU legislation, estimates have to be broken down at least by partner country and two-digit CN
code. Table 4 indicates the Member States compiling estimates for the extra-EU trade and the levels of
these estimates.

3 Accuracy
Quality report on European statistics on international trade in goods
Quality Report on International Trade in Goods Statistics
15
Table 4: Estimates in extra-EU trade — Level of details, 2012
Data below the statistical
threshold Estimates for delayed or
incomplete records
Denmark CN8 / partner countries
Italy No product or partner breakdown
Cyprus CN8 / partner countries
Netherlands HS2 / partner countries
Slovenia No product or partner breakdown
United Kingdom No product or partner breakdown
Source: Detailed statistics transmitted by Member States
3.2 Estimating trade value and quantity
3.2.1 Trade value
In ITGS, the trade value corresponds to the amount that would be invoiced in the event of sale or
purchase at the national border of the reporting country. It is expressed as a free-on-board (FOB) value)
for exports/dispatches and a cost-insurance-freight (CIF) value) for imports/arrivals.
In extra-EU trade, the statistical value is based on the value determined for customs purposes; therefore,
there is generally no need to estimate it.
In intra-EU trade, only the invoice value — the amount agreed on the sales agreement — is
systematically collected from the providers of statistical information (PSIs). When not provided by the
PSIs, the statistical value is estimated by the National Statistical Authority.
Table 5 shows the discrepancy between total estimated statistical value and total collected invoice value
(aggregation of values at transaction level). At transaction level, the discrepancy can be positive or
negative depending on the proportion of transport costs included in the invoice. The biggest discrepancies
are recorded when the invoice relates to a processing activity like repainting, labelling or packaging. In
such cases, the statistical value will be much higher, as it corresponds to the total amount which would
have been invoiced if the goods had been sold or purchased.
Table 6 indicates where some PSIs are exempted from reporting the statistical value. Most Member States
either do not collect the statistical value at all or collect it only from PSIs with annual trade above a
certain threshold. Table 6 also shows the method used to estimate non-collected statistical value. In all
cases, the estimate is based on the invoice value, which is adjusted by means of a correction coefficient
fixed differently according to Member State.

3 Accuracy
Quality report on European statistics on international trade in goods
Quality Report on International Trade in Goods Statistics
16
Table 5: Intra-EU trade — Estimated statistical value vs collected invoice value, 2011 (%)
Arrivals Dispatches
Belgium 0.0 0.0
Bulgaria 1.4 -0.3
Czech Republic 0.1 -0.8
Denmark : :
Germany -0.2 -0.2
Estonia 1.5 -1.4
Ireland 0.3 0.0
Greece No est. No est.
Spain 0.3 0.1
France -0.1 -0.5
Italy : :
Cyprus 0.7 -0.9
Latvia 1.3 -0.7
Lithuania 1.2 -0.2
Luxembourg 0.9 -0.7
Hungary 0.3 -0.2
Malta No est. No est.
Netherlands : :
Austria 0.0 0.0
Poland 0.8 -0.4
Portugal 0.2 -0.5
Romania 0.9 -0.2
Slovenia 0.4 -0.7
Slovakia 1.1 -0.6
Finland 1.2 -1.6
Sweden 1.0 -0.7
United Kingdom : :
Formula = [total statistical value / total invoice value - 1] * 100
: Data not available
Source: National quality reports transmitted by Member States

3 Accuracy
Quality report on European statistics on international trade in goods
Quality Report on International Trade in Goods Statistics
17
Table 6: Intra-EU trade — Exemption from statistical value reporting and estimation, 2012
PSIs exempted Estimation methods
Belgium All PSIs exempted No estimation, use of the invoice value
Bulgaria PSIs below the threshold Correcting coefficient computed from historical data Statistical value collected from PSIs for goods for/after processing
Czech Republic All PSIs exempted Correcting coefficient computed from historical data.
Denmark All PSIs exempted Estimation from invoice value to statistical value done by applying factors derived from a survey
Germany PSIs below the threshold Correcting coefficient computed from above the threshold data for trade data below the threshold
Estonia PSIs below the threshold Correcting coefficient computed from above the threshold data for trade data below the threshold
Ireland PSIs below the threshold Correcting coefficient computed from above the threshold data for trade data below the threshold
Greece No exemption Statistical value collected from trade operators above the threshold but as well below the threshold. Therefore, no estimation is needed.
Spain PSIs below the threshold Correcting coefficient computed from above the threshold data for trade data below the threshold
France All PSIs exempted Correcting coefficient computed from historical data.
Italy PSIs below the threshold Correcting coefficient computed from above the threshold data for trade data below the threshold
Cyprus PSIs below the threshold Correcting coefficient computed from above the threshold data for trade data below the threshold
Latvia PSIs below the threshold Correcting coefficient computed from historical data for trade data below the threshold
Lithuania PSIs below the threshold Correcting coefficient computed from above the threshold data for trade data below the threshold
Luxembourg PSIs below the threshold Correcting coefficient computed from above the threshold data for trade data below the threshold
Hungary PSIs below the threshold Correcting coefficient computed from above the threshold data for trade data below the threshold
Malta No exemption No estimation since both invoice and statistical values are collected
Netherlands All PSIs exempted Correcting coefficients derived from historical data.
Austria PSIs below the threshold No estimation, use of the invoice value
Poland PSIs below the threshold Correcting coefficient computed from above the threshold data for trade data below the threshold
Portugal PSIs below the threshold Correcting coefficient computed from above the threshold data for trade data below the threshold
Romania PSIs below the threshold Correcting coefficient computed from above the threshold data for trade data below the threshold
Slovenia PSIs below the threshold Correcting coefficient computed from above the threshold data for trade data below the threshold
Slovakia All PSIs exempted Estimation from invoice value to statistical value done by applying factors derived from a survey on ancillary costs
Finland All PSIs exempted Estimation from invoice value to statistical value done by applying factors derived from a survey made during 2008
Sweden All PSIs exempted Estimation from invoice value to statistical value done by applying factors derived from a survey
United Kingdom All PSIs exempted Delivery terms are collected from the largest traders. Estimation from invoice value to statistical value done by a model using ancillary cost information derived from a monthly survey.
Source: National quality reports transmitted by Member States

3 Accuracy
Quality report on European statistics on international trade in goods
Quality Report on International Trade in Goods Statistics
18
3.2.2 Quantity
The most common unit of measurement of quantity is net mass expressed in kilograms. This corresponds
to the weight of the goods without packaging.
For certain goods, a supplementary quantity is provided in addition to the net mass. This quantity is
expressed in a unit which adds useful information. Supplementary units are units other than kilograms,
e.g. litres, numbers of pieces, carats, terajoules or square metres. For each CN8 code, the Combined
Nomenclature indicates whether a supplementary quantity should be provided and, if so, in which
supplementary unit.
Under the provisions on intra-EU trade statistics, where there is a supplementary unit laid down for a
specific CN product code, it is not mandatory to request the specification of net mass from the PSIs.
Member States can decide whether the information about net mass is collected systematically for all CN8
codes or for some only. Under the EU legislation, the non-collected net mass shall be estimated by the
National Statistical Authority since 2010.
3.3 Data revisions
International trade in goods statistics, like many published statistics, must balance the need for timely
information with the accuracy of that information. Inevitably, the detailed data first sent for a month are
subject to the possibility of later revision, as a consequence of errors, omissions or — particularly with
the Intrastat system — late declarations by the providers of the statistical information. When monthly
results already transmitted to Eurostat are subject to revision, revised results shall be transmitted no later
than the month following their availability.
Data are revised frequently according to national needs and practices. However, Member States should
provide Eurostat with final detailed data at the latest by October following the reference year. At that time
data become 'final' and should not be revised anymore except in exceptional and well-justified cases.
Table 7 shows the impact of revisions by comparing the last values with the first ones. A minus symbol
indicates a higher first value and a positive figure a lower first value. In most cases, the values transmitted
first are underestimated. Underestimations in intra-EU trade are generally due to Intrastat declarations
not submitted in due time by PSIs. In particular, this was the reason of the exceptionally high revision
which occurred for Malta.
The average extent of the revisions is generally greater for intra-EU trade than for extra-EU trade and
greater for arrivals than for dispatches. The exceptionally high revision which occurred in extra-EU trade
for Greece was due to the resolution of issues in the processing of Customs declarations linked to
simplification provisions. The exceptionally high revision which occurred for the United Kingdom was
due to the integration of trade in non-monetary gold.

3 Accuracy
Quality report on European statistics on international trade in goods
Quality Report on International Trade in Goods Statistics
19
Table 7: Impact of revisions in intra- and extra-EU trade, 2012 (%)
Intra-EU trade Extra-EU trade
Arrivals Dispatches Imports Exports
EU-27 1.1 0.3 1.5 0.7
Belgium 1.7 -0.3 6.0 0.2
Bulgaria 0.7 -0.3 0.0 -0.4
Czech Republic 1.9 1.1 -0.3 -1.0
Denmark -1.1 -1.4 -4.6 -0.7
Germany -0.8 -0.8 0.4 0.8
Estonia -0.7 0.1 14.3 -0.7
Ireland 3.1 0.8 0.7 0.3
Greece 8.0 6.7 39.7 16.7
Spain 3.6 3.3 2.4 1.1
France -0.2 -0.9 1.2 0.6
Italy 1.1 0.5 -0.1 -0.2
Cyprus -0.2 -1.1 0.8 1.4
Latvia 4.9 2.1 -0.2 -0.8
Lithuania 2.2 0.0 -2.7 -0.1
Luxembourg 0.5 -2.7 1.0 0.2
Hungary 0.2 -0.1 -0.2 -0.5
Malta 9.4 22.0 0.0 0.0
Netherlands -0.6 -0.4 0.2 1.7
Austria 1.8 0.7 1.5 -0.3
Poland 4.8 3.2 0.1 -0.2
Portugal 1.6 1.4 1.6 -0.6
Romania 0.6 0.3 0.1 0.4
Slovenia 0.7 -0.2 0.1 -0.3
Slovakia 1.2 0.1 -0.1 -0.3
Finland 2.7 0.9 1.4 1.3
Sweden 1.5 0.2 1.2 0.3
United Kingdom 4.3 3.6 2.2 1.3
Note: Revision rate = (Last figure - First figure) / First figure * 100
Source: Eurostat calculations based on the first and last versions of detailed statistics transmitted by Member States
3.4 Confidentiality
The confidentiality impacts the data accuracy, in particular at the most detailed level, as some
characteristics of the trade are hidden.
There are two types of confidentiality:
partner confidentiality — In order to conceal the destination or the origin of the goods, the code of
the partner country is replaced by a ‘secret country’ code, different for intra- and extra-EU trade; and
product confidentiality — In order not to divulge the nature of the goods, all or part of the trade is
allocated to a confidential product code. Information about goods may be considered commercially
sensitive as regards value, quantity or value/quantity ratio (since this would give an indication of
price).

3 Accuracy
Quality report on European statistics on international trade in goods
Quality Report on International Trade in Goods Statistics
20
Tables 8 and 9 show the impact of confidentiality in intra- and extra-EU trade, in terms of number of
eight-digit product codes (CN8) affected, trade value and net mass. The impact varies considerably
depending on the type of trade, the flow and the Member State in question.
Table 8: Impact of confidentiality in intra-EU trade, 2012
Number of CN8 codes affected
Impact on trade value (%)
Impact on net mass (%)
Arrivals Dispatches Arrivals Dispatches Arrivals Dispatches
Belgium 31 94 0.7 1.4 0.2 1.8
Bulgaria
Czech Republic 720 431 1.5 0.5 4.8 0.4
Denmark 48 100 0.5 6.7 0.9 8.6
Germany 68 192 2.6 2.8 8.3 10.9
Estonia
Ireland 21 10 0.0 0.1 0.0 0.4
Greece 11 9 0.0 2.4 0.0 1.0
Spain 53 53 0.4 0.9 0.9 1.4
France 41 313 0.3 3.1 0.0 3.9
Italy 24 96 0.2 0.8 0.1 0.9
Cyprus 1 0.2 0.0
Latvia
Lithuania
Luxembourg 3 6 4.1 1.5 6.4 0.7
Hungary 60 51 0.4 0.4 0.0 0.1
Malta
Netherlands 236 413 2.5 8.1 2.3 18.6
Austria 117 261 2.7 6.0 12.0 11.7
Poland 1 0.0 0.0
Portugal
Romania 82 47 0.3 0.5 0.0 0.0
Slovenia 27 13 0.0 0.0 0.2 0.1
Slovakia
Finland 88 144 4.3 7.3 13.7 12.4
Sweden 14 43 0.1 1.7 0.2 0.7
United Kingdom 10 54 0.2 1.6 1.7 2.0
Source: Eurostat calculations based on detailed statistics transmitted by Member States

3 Accuracy
Quality report on European statistics on international trade in goods
Quality Report on International Trade in Goods Statistics
21
Table 9: Impact of confidentiality in extra-EU trade, 2012 (%)
Number of CN8 codes affected
Impact on trade value (%)
Impact on net mass (%)
Imports Exports Imports Exports Imports Exports
Belgium 36 93 2.0 2.5 0.6 3.3
Bulgaria
Czech Republic 360 196 0.4 0.6 0.2 0.5
Denmark 43 98 3.1 13.7 20.8 11.0
Germany 57 184 8.3 1.6 27.8 7.4
Estonia
Ireland
Greece 8 14 0.0 1.1 0.0 0.1
Spain 50 52 0.2 1.3 0.3 1.6
France 38 298 0.3 3.6 0.0 3.6
Italy 19 92 0.1 0.8 0.0 0.9
Cyprus 1 0.4 0.0
Latvia 5 0.6 0.3
Lithuania 1 0.6 0.4
Luxembourg 1 5 1.4 0.5 2.3 0.0
Hungary 63 61 0.9 0.5 0.0 0.2
Malta
Netherlands 602 761 4.9 3.1 4.7 2.2
Austria 105 249 12.8 8.0 46.7 7.6
Poland
Portugal
Romania 66 38 0.2 0.8 0.0 0.0
Slovenia 23 19 0.0 0.1 0.5 0.3
Slovakia
Finland 75 142 9.5 7.6 12.8 20.0
Sweden 17 45 0.3 4.2 0.5 1.1
United Kingdom 28 52 0.7 1.2 0.6 2.5
Source: Eurostat calculations based on detailed statistics transmitted by Member States
Table 10 indicates the number of CN8 codes according to the type of confidentiality: partner
confidentiality only, product confidentiality only or a combination of the two. For most of the Member
States, product confidentiality seems to affect dispatches/exports more than arrivals/imports. Also, some
Member States systematically use only one type of confidentiality.

3 Accuracy
Quality report on European statistics on international trade in goods
Quality Report on International Trade in Goods Statistics
22
Table 10: Number of CN8 codes according to the type of confidentiality, 2012
Intra-EU trade Extra-EU trade
Arrivals Dispatches Imports Exports
Secre
t p
rod
uct
Secre
t p
art
ner
Secre
t p
rod
uct
and
pa
rtne
r
Secre
t p
rod
uct
Secre
t p
art
ner
Secre
t p
rod
uct
and
pa
rtne
r
Secre
t p
rod
uct
Secre
t p
art
ner
Secre
t p
rod
uct
and
pa
rtne
r
Secre
t p
rod
uct
Secre
t p
art
ner
Secre
t p
rod
uct
and
pa
rtne
r
Belgium 31 94 26 10 84 9
Bulgaria
Czech Republic 720 431 360 196
Denmark 43 5 82 18 39 4 80 18
Germany 16 1 51 170 1 21 15 10 32 170 1 13
Estonia
Ireland 10 11 5 5
Greece 11 9 8 14
Spain 53 53 50 52
France 2 7 32 282 5 26 2 6 30 260 3 35
Italy 24 96 19 92
Cyprus 1 1
Latvia 5
Lithuania 1
Luxembourg 3 6 1 5
Hungary 60 51 63 61
Malta
Netherlands 169 67 358 55 535 67 717 44
Austria 53 8 56 163 16 82 47 8 50 159 15 75
Poland 1
Portugal
Romania 82 47 66 38
Slovenia 6 21 13 5 18 19
Slovakia
Finland 88 144 75 142
Sweden 14 43 17 45
United Kingdom 4 6 40 14 8 20 34 18
Source: Eurostat calculations based on detailed statistics transmitted by Member States

3 Accuracy
Quality report on European statistics on international trade in goods
Quality Report on International Trade in Goods Statistics
23
3.5 Control procedures
The primary responsibility for ensuring the accuracy of the published trade data rests with the Member
States, as they are responsible for data collection and compilation. The control procedures can be broadly
classified as:
controls of data validity: Data are invalid when they cause processing problems and must be
removed or corrected. Controls of data validity should in particular detect incorrect or missing
codes, missing indicators (e.g. value or quantity), character data in numeric field and vice versa. All
Member States use reference tables with an automatic process to check for invalid data;
controls of data credibility: data can be ‘valid’ but not plausible; therefore, they can be processed but
will distort the statistical analysis. Inconsistencies can be detected by cross-checking different
statistical variables (e.g. trade value and net mass) or by observing trends in time series; and
controls of data completeness: these are checks as to whether the reported trade data represent all the
operator’s trading activity. In intra-EU data, a close link with the VAT system allows Member
States to compare the statistical declarations with VAT returns or VIES data. In extra-EU trade, data
are collected through customs declarations, so they are considered to be complete. Additional
sources can be used, e.g. data from other statistical domains or mirror statistics.
In addition, data are validated by Eurostat before any dissemination to users. This mainly involves
controls of data validity. Data already uploaded in the Eurostat database undergo further credibility and
completeness checks on the basis of internal studies or user feedback.
It should be kept in mind that basic data consist of millions of detailed trade declarations each month and
it is impossible to achieve complete accuracy for the published statistics. As in all statistical work, a
balance has to be struck between the resources devoted to checking and the likely benefits. Therefore,
users should be aware of the margin of inaccuracy in the data used, at least as regards the most detailed
level of data. This applies particularly to intra-EU trade statistics, where not all traders are requested to
provide detailed information on their transactions.

4 Timeliness and Punctuality
Quality report on European statistics on international trade in goods
Quality Report on International Trade in Goods Statistics
24
4 Timeliness and punctuality
ESS DEFINITION
The timeliness of statistical outputs is the length of time between the event or phenomenon they describe and their availability.
Punctuality is the time lag between the release date of data and the target date on which they were scheduled for release as announced in an official release calendar, laid down by Regulations or previously agreed among partners.
First results (including estimates) on euro-area and EU trade balances are published around 46 days after
the reference month in the international trade euro-indicators news release. The latest supplied detailed
data (including revisions) are published in a monthly press release. Short-term indicators are also updated
on a monthly basis on the date of the press release. They include in particular all data published in the
euro-indicators news release. Long-term indicators are generally updated once a year, when final data are
available for the previous reference year.
Under the Intrastat legislation, Member States should provide Eurostat with intra-EU aggregated
statistics within 40 days of the reference month and with intra-EU detailed statistics within 70 days.
Under the Extrastat legislation, until 2009 Member States had to provide Eurostat with extra-EU
aggregated statistics within 40 days of the reference month and with extra-EU detailed statistics within
42 days. Since 2010, they have had to provide extra-EU detailed statistics only, but within 40 days.
Table 11 shows how often and to what extent the monthly 2012 intra- and extra-EU trade data were
delivered late. This indicator is based on the dates on which the first version was sent to Eurostat.

4 Timeliness and Punctuality
Quality report on European statistics on international trade in goods
Quality Report on International Trade in Goods Statistics
25
Table 11: Punctuality of detailed and aggregated data, 2012
Aggregated data Detailed data
Intra-EU trade Intra-EU trade Extra-EU trade
Number of delayed
data deliveries
Average delay
Number of delayed
data deliveries
Average delay
Number of delayed
data deliveries
Average delay
Belgium 1 1 day 2 1 day
Bulgaria
Czech Republic 1 1 day 1 1 day
Denmark
Germany 1 1 day 1 1 day
Estonia
Ireland 3 1 day 3 2 days
Greece
Spain
France
Italy
Cyprus 1 2 days 1 1 day 1 2 days
Latvia
Lithuania
Luxembourg 1 4 days 2 6 days
Hungary
Malta 2 1 day
Netherlands
Austria
Poland
Portugal 1 1 day
Romania
Slovenia
Slovakia
Finland
Sweden
United Kingdom

5 Accessibility and clarity
Quality report on European statistics on international trade in goods
Quality Report on International Trade in Goods Statistics
26
5 Accessibility and clarity
ESS DEFINITION
The accessibility of statistical outputs is the measure of the ease with which users can obtain the data. It is determined by the physical conditions by means of which users obtain data: where to go, how to order, delivery time, pricing policy, marketing conditions (copyright, etc.), availability of micro or macro data, various formats (paper, files, CD-ROM, internet, etc.).
The clarity of statistical outputs is the measure of the ease with which users can understand the data. It is determined by the information environment within which the data are presented, whether the data are accompanied by appropriate metadata, whether use is made of illustrations such as graphs and maps, whether information on data accuracy is available (including any limitations on use) and the extent to which additional assistance is provided by the producer.
All available dissemination channels are used: electronic and paper publications, predefined tables,
databases, DVDs and FTP addresses for bulk download. Data are disseminated simultaneously and free
of charge to all interested parties through Eurostat’s website. Annually, approximately 20 000 registered
users perform about two million extractions of trade in goods data.
In daily work, users can easily communicate their requests and needs by using tools directly geared to
dissemination. The requests are further managed by the Eurostat helpdesk.
The dissemination of ITGS is supported by a complete set of structural metadata making it possible easily
to identify, retrieve and browse the data. The reference metadata describing the contents and the data
quality are also exhaustive.

6 Coherence and comparability
Quality report on European statistics on international trade in goods
Quality Report on International Trade in Goods Statistics
27
6 Coherence and comparability
ESS DEFINITION
The coherence of two or more statistical outputs refers to the degree to which the statistical processes by which they were generated used the same concepts — classifications, definitions and target populations — and harmonised methods. Coherent statistical outputs have the potential to be validly combined and used jointly. Examples of joint use are where the statistical outputs refer to the same population, reference period and region but comprise different sets of data items (say, employment data and production data) or where they comprise the same data items (say, employment data) but for different reference periods, regions or domains.
Comparability is a special case of coherence and refers to the second example above, where the statistical outputs refer to the same data items and the aim of combining them is to make comparisons over time, or across regions, or across other domains.
6.1 Comparability over space
6.1.1 Community figures versus national figures
EU legislation serves as a basis for compiling the intra- and extra-EU trade statistics published by
Eurostat. However, Community statistics, which cover the EU as a whole, and the statistics published by
the Member States, are not always directly comparable. Member States may apply a different concept at
national level but they have to provide Eurostat with harmonised data according to the Community
concept.
The most common differences between the Community concept and the national concepts are as follows:
Use of the general trade system at national level while the Community statistics are compiled
according to the special trade system;
Exclusion from national statistics of ‘quasi-transit’, which means of
o goods imported from a non-EU country, cleared through customs and immediately
dispatched to another Member State (the Member State of final destination); or
o goods imported from another Member State (the Member State of actual export), cleared
through customs and immediately dispatched to a non-EU country.
The customs formalities distinguish between simple transit, which is not recorded in
Community statistics, and quasi-transit.
Inclusion of repairs in national statistics — these are excluded from the scope of Community
statistics from 2006; and
Country of origin vs. Member State of consignment — for Community statistics for intra-EU
imports, the partner country is the Member State of consignment but for national statistics it may be
the country of origin.
Table 12 shows conceptual differences between Community statistics and individual Member State’s
national statistics.

6 Coherence and comparability
Quality report on European statistics on international trade in goods
Quality Report on International Trade in Goods Statistics
28
Table 12: Conceptual differences between European statistics and national statistics, 2012
Ge
ne
ral
Tra
de
Sys
tem
Exc
lus
ion
of
qu
asi
tran
sit
Inc
lus
ion
of
rep
air
s
Co
un
try o
f
ori
gin
Oth
er
(1)
Belgium * *
Bulgaria * *
Czech Republic *
Denmark * *
Germany * *
Estonia *
Ireland * * *
Greece
Spain * * *
France * *
Italy
Cyprus *
Latvia *
Lithuania
Luxembourg * *
Hungary * *
Malta * * *
Netherlands *
Austria * * *
Poland * *
Portugal
Romania
Slovenia * *
Slovakia * * *
Finland *
Sweden
United Kingdom * * * *
(1) The other conceptual differences are the following:
Belgium: Returned goods are excluded from national statistics.
Germany: Additional statistical procedures are included in national statistics.
Estonia: Extra-EU imports at national level are by country of consignment.
Spain: Ceuta and Melilla are included in national statistics.
France: Goods delivered to vessels and aircraft are excluded from national statistics.
Hungary: Extra-EU imports at national level are by country of consignment.
Austria: Goods covered by Single Authorisation for Simplified Procedures (SASP) are included in national statistics.
Slovenia: Trade by non-residents, which is not connected with activity on the Slovenian market, is excluded from national statistics.
Slovakia: Import data are FOB.
United Kingdom: Extra-EU imports at national level are by country of consignment; non-monetary gold is excluded from national statistics.
Source: National quality reports transmitted by Member States
6.1.2 Asymmetries in extra-EU trade statistics
There are two main approaches for measuring international trade in goods: the general trade system and
the special trade system. EU ITGS use the latter, which means that goods from a non-EU country that are
received into customs warehouses are not recorded unless they subsequently go into free circulation in the

6 Coherence and comparability
Quality report on European statistics on international trade in goods
Quality Report on International Trade in Goods Statistics
29
Member State of receipt (or are placed under the customs procedures for inward processing). Similarly,
outgoing goods from customs warehouses are not recorded as exports. The general trade system, which is
used by most of the EU’s main partner countries, is broader, including all goods entering or leaving the
country.
Since intra-EU trade statistics are not directly linked to customs procedures, they are not compiled on a
general or special trade basis.
Comparing extra-EU trade statistics with the figures published by non-EU countries for the same trade
flows inevitably highlights some discrepancies. Besides the trade system and errors such as product or
partner misclassification, the most common reasons for asymmetries are:
Methodological differences: trade coverage (e.g. data collection thresholds, treatment of specific
goods or movements of goods), definition of partner country (e.g. country of re-export vs. country of
origin), definition of statistical territory, different valuation principles (e.g. FOB valuation for
exports and CIF valuation for imports);
Time lag: the same operation is recorded for a different reference period;
Statistical confidentiality: the goods movement is made confidential by one of the partners;
Different practices in the treatment of revisions; and
Problems of currency conversion.
Table 13 shows the mirror discrepancies in EU-27 trade with its top-10 trading partners.
Table 13: Asymmetries with the top-10 extra-EU partner countries, 2012 (%)
EU-27 imports (*) EU-27 exports (**)
USA -0.5 -3.4
China 11.1 -13.7
Russia -0.9 17.7
Switzerland 7.3 14.9
Norway -0.8 13.4
Japan 2.2 -15.3
Turkey 5.3 10.1
South Korea -1.9 -3.6
Brazil -2.1 -2.8
India -3.2 -9.1
(*) (EU imports - mirror exports) / Mirror flows average
(**) (EU exports - mirror imports) / Mirror flows average
Source: Eurostat calculations based on data transmitted by Member States and data available in the IMF database
6.1.3 Asymmetries in intra-EU trade statistics
In theory, intra-EU trade statistics should be less affected by asymmetries than extra-EU trade statistics as
issued from more harmonised rules. Dispatches from Member State A to Member State B, as reported by
A, should be almost equal to arrivals into B from A, as reported by B. Due to a different valuation
principle (CIF > FOB), arrivals should be slightly higher than dispatches.
However, since the Intrastat system came into operation, bilateral comparisons have revealed major and
persistent discrepancies in the intra-EU trade statistics. Therefore, comparisons based on intra-EU trade
statistics must be handled with caution and should take these into account. The main reasons for the
discrepancies are known and are partly the same as in the case of extra-EU trade. There are also factors
that are specific to intra-EU trade, such as estimates for non-collected data.

6 Coherence and comparability
Quality report on European statistics on international trade in goods
Quality Report on International Trade in Goods Statistics
30
Table 14 reports the asymmetries in trade values, expressed in relative terms. It is evident that the impact
varies considerably among the Member States. Many regularly carry out bilateral studies to find out at
detailed product level where the problems are and to resolve them. However, despite all the analysis, the
problems are not easily remedied.
Table 14: Intra-EU asymmetries, 2012 (%)
Arrivals (*) Dispatches (**)
EU-27 -2.4 2.4
Belgium 6.0 3.8
Bulgaria 2.9 2.8
Czech Republic 0.2 4.2
Denmark -0.5 2.5
Germany -3.3 2.0
Estonia -5.1 12.3
Ireland -13.2 -13.8
Greece -0.2 2.9
Spain 0.3 6.7
France -3.2 2.9
Italy -1.1 5.4
Cyprus -38.9 -90.0
Latvia 5.9 4.9
Lithuania 9.7 7.4
Luxembourg -4.9 -13.4
Hungary 3.3 7.3
Malta -1.5 -19.2
Netherlands -5.3 5.4
Austria -0.6 -0.8
Poland -7.5 4.8
Portugal 3.8 8.9
Romania 2.3 11.2
Slovenia 2.4 11.0
Slovakia -2.8 9.4
Finland -0.1 -5.2
Sweden 1.0 -4.8
United Kingdom -4.9 -2.6
(*) (Arrivals - mirror dispatches) / Mirror flows average
(**) (Dispatches - mirror arrivals) / Mirror flows average
Source: Eurostat calculations based on detailed statistics transmitted by Member States

6 Coherence and comparability
Quality report on European statistics on international trade in goods
Quality Report on International Trade in Goods Statistics
31
6.2 Comparability over time
Comparability over time is another important aspect of quality. Changes due to definitions, coverage or
methods and other changes will have an impact on the continuity of trade series. The most important
methodological changes or other events affecting ITGS in the past few years are listed in the table below.
Table 15: Changes affecting comparability over time
Type of trade
Event
2010
Intra- and extra-EU
Introduction of the concept of change in economic ownership to record the trade in ships and aircraft and to determine the partner country allocation for deliveries to ships and aircraft and sea products (based on the economic ownership of the ships/aircraft)
Intra- and extra-EU
Reporting Member State and partner country for goods delivered to and from offshore installations determined by the exclusive rights of a country to exploit seabed or subsoil of the area (exclusive economic zone) where the offshore installation is established
Intra-EU Estimates for non-collected net mass mandatory
2009 Intra-EU For arrivals, minimum coverage from collected data reduced from 97 % to 95 % of total trade value
2007
Intra- and extra-EU
Change in the definition of intra- and extra-EU trade due to EU enlargement (accession of Bulgaria and Romania on 1 January 2007)
Intra- and extra-EU
Combined Nomenclature impacted by the revision of the Harmonized System
2006
Extra-EU Repairs excluded from the scope of extra-EU trade
Intra-EU Collection of net mass in Intrastat no longer mandatory if a supplementary quantity is collected
2005
Intra-EU Repairs excluded from the scope of intra-EU trade
Intra-EU Collection of net mass in Intrastat no longer mandatory for a specific list of CN8 codes for which a supplementary quantity is collected
2004 Intra- and extra-EU
Change in the definition of intra- and extra-EU trade due to EU enlargement (accession of Czech Republic, Estonia, Cyprus, Latvia, Lithuania, Hungary, Malta, Poland, Slovenia and Slovakia on 1 May 2004)
A particular issue of comparability over time concerns product classifications. The most detailed statistics
are collected and published by eight-digit CN code. Some changes are made to the CN every year.
Eurostat maintains conversion tables between successive versions of the CN in order to improve
comparison over time. Table 16 gives an overview of changes affecting the CN8 codes in recent years.

6 Coherence and comparability
Quality report on European statistics on international trade in goods
Quality Report on International Trade in Goods Statistics
32
Table 16: Changes to CN8 codes over time
Year Creations Deletions Total Net change CN Codes
2012 907 818 1 725 +89 9 383
2011 132 281 413 -149 9 294
2010 180 306 486 -126 9 443
2009 127 257 384 -130 9 569
2008 75 96 171 -21 9 699
2007 917 1 039 1 956 -122 9 720
2006 486 740 1 226 -254 9 842
2005 97 175 272 -78 10 096
2004 273 503 776 -230 10 174
2003 19 15 34 +4 10 404
2002 780 654 1 434 +126 10 400
2001 50 90 140 -40 10 274
The impact of the various methodological and practical changes in recent years is difficult to assess
precisely. Nevertheless, a change from an administrative data source (Extrastat) to a purely statistical data
collection system (Intrastat) normally means a major break in the trade statistics time series.
6 Coherence and comparability
Quality report on European statistics on international trade in goods
Quality Report on International Trade in Goods Statistics
33
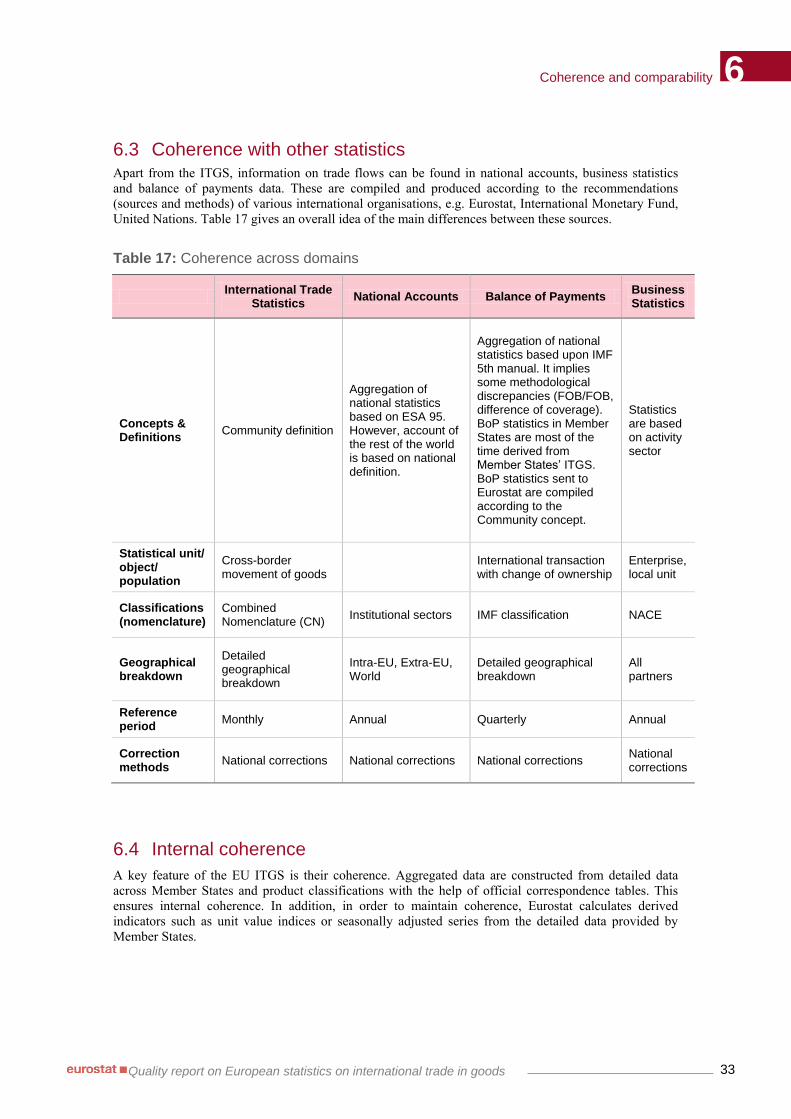
6.3 Coherence with other statistics Apart from the ITGS, information on trade flows can be found in national accounts, business statistics
and balance of payments data. These are compiled and produced according to the recommendations
(sources and methods) of various international organisations, e.g. Eurostat, International Monetary Fund,
United Nations. Table 17 gives an overall idea of the main differences between these sources.
Table 17: Coherence across domains
International Trade
Statistics National Accounts Balance of Payments
Business Statistics
Concepts & Definitions
Community definition
Aggregation of national statistics based on ESA 95. However, account of the rest of the world is based on national definition.
Aggregation of national statistics based upon IMF 5th manual. It implies some methodological discrepancies (FOB/FOB, difference of coverage). BoP statistics in Member States are most of the time derived from Member States’ ITGS. BoP statistics sent to Eurostat are compiled according to the Community concept.
Statistics are based on activity sector
Statistical unit/ object/ population
Cross-border movement of goods
International transaction with change of ownership
Enterprise, local unit
Classifications (nomenclature)
Combined Nomenclature (CN)
Institutional sectors IMF classification NACE
Geographical breakdown
Detailed geographical breakdown
Intra-EU, Extra-EU, World
Detailed geographical breakdown
All partners
Reference period
Monthly Annual Quarterly Annual
Correction methods
National corrections National corrections National corrections National corrections
6.4 Internal coherence
A key feature of the EU ITGS is their coherence. Aggregated data are constructed from detailed data
across Member States and product classifications with the help of official correspondence tables. This
ensures internal coherence. In addition, in order to maintain coherence, Eurostat calculates derived
indicators such as unit value indices or seasonally adjusted series from the detailed data provided by
Member States.

7 Trade-offs between output quality components
Quality report on European statistics on international trade in goods
Quality Report on International Trade in Goods Statistics
34
7 Trade-offs between output quality components
ESS HANDBOOK FOR QUALITY REPORTS
Output quality components are not mutually exclusive in the sense that there are relationships between the factors that contribute to them. There are cases where the factors leading to improvements with respect to one component result in deterioration with respect to another.
As there are a number of quality components, including some with subcomponents, the number of
possible trade-offs is considerable. However, not all of them are relevant for ITGS. Some of the most
significant trade-offs are considered below:
Trade-off between relevance and comparability over time
The most important methodological changes over the last few years are documented in section 6.2.
Some, such as the exclusion of repairs from the scope of statistics, were made in order to improve
the relevance of statistics. Similarly, product classifications are revised regularly to ensure that they
reflect changes in technology, trade patterns and user needs. Consequently, comparability over time
is affected.
Trade-off between accuracy and timeliness
Trade statistics consist of a huge volume of detailed declarations collected in two different systems:
Intrastat and Extrastat. As the time needed to transmit detailed intra-EU trade data is considerably
longer than that for detailed extra-EU trade data, aggregated intra-EU trade data must be reported
within 40 days for the purposes of macro-economic analysis.
Trade-off between accuracy and respondent burden
Although respondent burden is not an output quality component as such, it forms an important trade-
off with accuracy. The Intrastat system is constructed so that the smallest traders are exempted from
statistical reporting (see section 9.2). Consequently, fewer data are collected, which affects the
accuracy of the detailed intra-EU trade statistics.

8 Assessment of user needs and perceptions
Quality report on European statistics on international trade in goods
Quality Report on International Trade in Goods Statistics
35
8 Assessment of user needs and perceptions
ESS QUALITY DECLARATION: USER FOCUS
We provide our users with products and services that meet their needs. The articulated and non-articulated needs, demands and expectations of external and internal users will guide the ESS, its members, their employees and operations.
User needs are monitored regularly. At EU level, there are regular contacts with key institutional users
(Commission services and the European Central Bank) and with other main user groups such as trade
associations.
Eurostat undertook its last large-scale user satisfaction survey focusing on ITGS in 2007. The survey
found a very high level of satisfaction among users: 85 % were very or fairly satisfied with the data. This
high level of satisfaction has been confirmed by every general User Satisfaction Survey carried out by
Eurostat since then (in 2009, 2011, 2012 and 2013).
Recently, the most urgent user needs have concerned incomplete information on net mass (see
section 3.2.2) and statistics on enterprises involved in international trade in goods, particularly small and
medium-sized enterprises. On the former, provisions in force since 2010 stipulate the use of estimates if
net mass is not collected directly from the traders. On the latter, disseminated statistics on trade by
business characteristics cover reference year 2005 onwards.

9 Performance, cost and respondent burden
Quality report on European statistics on international trade in goods
Quality Report on International Trade in Goods Statistics
36
9 Performance, cost and respondent burden
EUROPEAN STATISTICS CODE OF PRACTICE
Principle 9: Resources must be effectively used.
Principle 10: Respondent burden should be proportional to the needs of users and not excessive for respondents. Respondent burden should be measured and targets set for its reduction over time.
9.1 Performance and cost
In order to improve performance and reduce the costs of data collection and processing, the use of IT
tools in data collection has been identified as a priority. Consequently, the proportion of paper
declarations has decreased over time. Around 90 % of all Intrastat declarations are now received in
electronic formats. Paper declarations for exports to non-EU countries have not been allowed since
July 2009. Also several measures have been taken to develop and promote common tools for data
validation.
9.2 Respondent burden
In order to reduce the burden on enterprises, particularly SMEs, the Intrastat system is designed so that
intra-EU traders’ workload varies according to the annual amount of trade in which they are involved. To
achieve this, Member States have each year to set thresholds for arrivals and dispatches that exempt
enterprises from providing statistical information or that limit the information collected. The thresholds
are expressed in terms of the annual value of intra-EU trade; there are three types:
Exemption threshold — Enterprises below the threshold do not have to declare their trade in
goods. When setting the threshold, Member States have to ensure that at least 97 % of their
dispatches and 95% of their arrivals are covered;
Simplification threshold — This allows enterprises with annual trade value above the exemption
threshold but below the simplification threshold to provide only a limited set of data or use a
simplified commodity code. The trade reported by these PSIs may cover at most 6 % of total trade.
Currently, four Member States apply the simplification threshold: France, Luxembourg, Portugal
and Slovakia; and
Statistical value threshold — Member States may collect the statistical value but only from some
of their enterprises. The threshold should be fixed in such a way that the statistical value is collected
only from the biggest PSIs, whose overall share of total trade may not exceed 70%.
Tables 18 to 20 show these thresholds in value terms and the share of traders that benefit from them.
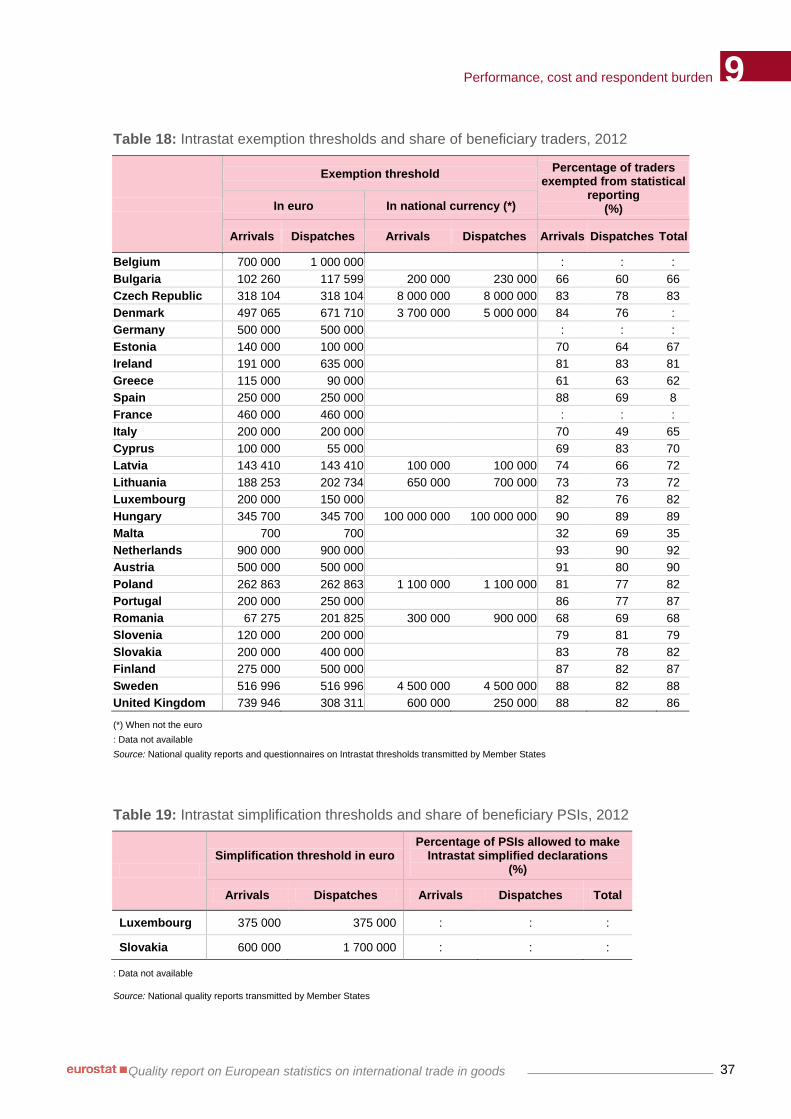
9 Performance, cost and respondent burden
Quality report on European statistics on international trade in goods
Quality Report on International Trade in Goods Statistics
37
Table 18: Intrastat exemption thresholds and share of beneficiary traders, 2012
Exemption threshold Percentage of traders
exempted from statistical reporting
(%) In euro In national currency (*)
Arrivals Dispatches Arrivals Dispatches Arrivals Dispatches Total
Belgium 700 000 1 000 000 : : :
Bulgaria 102 260 117 599 200 000 230 000 66 60 66
Czech Republic 318 104 318 104 8 000 000 8 000 000 83 78 83
Denmark 497 065 671 710 3 700 000 5 000 000 84 76 :
Germany 500 000 500 000 : : :
Estonia 140 000 100 000 70 64 67
Ireland 191 000 635 000 81 83 81
Greece 115 000 90 000 61 63 62
Spain 250 000 250 000 88 69 8
France 460 000 460 000 : : :
Italy 200 000 200 000 70 49 65
Cyprus 100 000 55 000 69 83 70
Latvia 143 410 143 410 100 000 100 000 74 66 72
Lithuania 188 253 202 734 650 000 700 000 73 73 72
Luxembourg 200 000 150 000 82 76 82
Hungary 345 700 345 700 100 000 000 100 000 000 90 89 89
Malta 700 700 32 69 35
Netherlands 900 000 900 000 93 90 92
Austria 500 000 500 000 91 80 90
Poland 262 863 262 863 1 100 000 1 100 000 81 77 82
Portugal 200 000 250 000 86 77 87
Romania 67 275 201 825 300 000 900 000 68 69 68
Slovenia 120 000 200 000 79 81 79
Slovakia 200 000 400 000 83 78 82
Finland 275 000 500 000 87 82 87
Sweden 516 996 516 996 4 500 000 4 500 000 88 82 88
United Kingdom 739 946 308 311 600 000 250 000 88 82 86
(*) When not the euro
: Data not available
Source: National quality reports and questionnaires on Intrastat thresholds transmitted by Member States
Table 19: Intrastat simplification thresholds and share of beneficiary PSIs, 2012
Simplification threshold in euro Percentage of PSIs allowed to make
Intrastat simplified declarations (%)
Arrivals Dispatches Arrivals Dispatches Total
Luxembourg 375 000 375 000 : : :
Slovakia 600 000 1 700 000 : : :
: Data not available
Source: National quality reports transmitted by Member States

9 Performance, cost and respondent burden
Quality report on European statistics on international trade in goods
Quality Report on International Trade in Goods Statistics
38
Table 20: Intrastat statistical value thresholds and share of beneficiary PSIs, 2012
Statistical value threshold Percentage of traders exempted from statistical
value reporting (%) In euro In national currency (*)
Arrivals Dispatches Arrivals Dispatches Arrivals Dispatches Total
Belgium All PSIs
exempted All PSIs
exempted 100 100 100
Bulgaria 2 045 200 4 857 350 4 000 000 9 500 000 : : :
Czech Republic All PSIs
exempted All PSIs
exempted 100 100 100
Denmark All PSIs
exempted All PSIs
exempted 100 100 100
Germany 30 000 000 42 000 000 : : :
Estonia 5 000 000 5 500 000 : : :
Ireland 5 000 000 34 000 000 : : :
Greece No
exemption No
exemption 0 0 0
Spain 6 000 000 6 000 000 : : :
France All PSIs
exempted All PSIs
exempted 100 100 100
Italy 20 000 000 20 000 000 : : :
Cyprus 1 850 000 5 200 000 : : :
Latvia 2 294 565 3 441 847 1 600 000 2 400 000 : : :
Lithuania 2 896 200 9 847 080 10 000 000 34 000 000 : : :
Luxembourg 4 000 000 8 000 000 : : :
Hungary 12 099 500 41 484 000 3 500 000 000 12 000 000 000 : : :
Malta No
exemption No
exemption 0 0 0
Netherlands All PSIs
exempted All PSIs
exempted 100 100 100
Austria 10 000 000 10 000 000 : : :
Poland 9 319 674 17 205 552 39 000 000 72 000 000 : : :
Portugal 5 000 000 6 500 000 : : :
Romania 2 242 500 4 485 000 10 000 000 20 000 000 : : :
Slovenia 4 000 000 9 000 000 : : :
Slovakia All PSIs
exempted All PSIs
exempted 100 100 100
Finland All PSIs
exempted All PSIs
exempted 100 100 100
Sweden All PSIs
exempted All PSIs
exempted 100 100 100
United Kingdom All PSIs
exempted All PSIs
exempted 100 100 100
(*) When not the euro
: Data not available
Source: National quality reports transmitted by Member States
In addition to value thresholds, Member States may apply other simplification measures, including
optional collection of net mass for CN8 codes with a supplementary unit or the use of simplified reporting
for specific goods such as industrial plants or parts of motor vehicles.

9 Performance, cost and respondent burden
Quality report on European statistics on international trade in goods
Quality Report on International Trade in Goods Statistics
39
Extra-EU trade statistics cover all commercial transactions reported to customs. However, transactions
where the value and net mass are below the statistical threshold do not have to be processed in detail.
This threshold is fixed at maximum EUR 1 000 and 1 000 kilograms.
Table 21: Extrastat statistical thresholds, 2012
Extrastat statistical threshold
Belgium No threshold
Bulgaria No threshold
Czech Republic No threshold
Denmark No threshold
Germany No threshold
Estonia No threshold
Ireland No threshold
Greece No threshold
Spain No threshold
France No threshold
Italy EUR 1 000
Cyprus No threshold
Latvia No threshold
Lithuania No threshold
Luxembourg No threshold
Hungary No threshold
Malta No threshold
Netherlands No threshold
Austria No threshold
Poland No threshold
Portugal No threshold
Romania No threshold
Slovenia No threshold
Slovakia No threshold
Finland No threshold
Sweden No threshold
United Kingdom EUR 1 000 or 1 000 kg
Source: National quality reports transmitted by Member States

Confidentiality, transparency and security 10
Quality report on European statistics on international trade in goods
Quality Report on International Trade in Goods Statistics
40
10 Confidentiality, transparency and security
EUROPEAN STATISTICS CODE OF PRACTICE
Principle 5: The privacy of data providers (households, enterprises, administrations and other respondents), the confidentiality of the information they provide and its use only for statistical purposes must be absolutely guaranteed.
Principle 6: Statistical authorities must produce and disseminate European statistics respecting scientific independence and in an objective, professional and transparent manner in which all users are treated equitably.
In ITGS, the principle of ‘passive confidentiality’ is applied, whereby data can be withheld only at the
request of an enterprise that feels that its interests would be harmed by the dissemination of its data.
Passive confidentiality is different from ‘active confidentiality’, where the National Statistical Authority
takes the initiative of withholding data automatically when certain criteria are met, without informing the
enterprises concerned.
The considerable amount of detail in trade data means that the potential for the creation of confidential
data at detailed level is extremely high. Passive confidentiality helps to minimise the loss of information
at detailed level.
Both the Intrastat and Extrastat Regulations provide for the application of passive confidentiality. They
also state that real trade values should be disseminated to all users at least at chapter (i.e. two-digit CN
code) level, except where this does not ensure confidentiality.
When receiving a request for confidentiality from an enterprise, the National Statistical Authority must
decide whether or not it should be granted. National rules and practices vary from sophisticated
decision-making systems to a case-by-case ‘common-sense’ sense approach.
Member States’ transmission of data to Eurostat follows the principle of a single entry point endorsed by
the Statistical Programme Committee (SPC). It uses eDAMIS (electronic Data files Administration and
Management Information System), an integrated environment of data transmission tools that allow highly
secure transmissions. At Eurostat, confidential data is stored in secure environments.

Annex
Quality report on European statistics on international trade in goods
Quality Report on International Trade in Goods Statistics
41
Annex — Data for 2011
Table A.1: Shares of collected and estimated data in intra-EU trade, 2011 (%)
Collected data
Estimated data
Below threshold Non response
Arrivals Dispatches Arrivals Dispatches Arrivals Dispatches
Belgium 95.3 97.7 2.7 0.9 2.0 1.4
Bulgaria 96.6 97.9 3.3 2.0 0.1 0.0
Czech Republic 96.0 98.0 3.7 1.7 0.3 0.3
Denmark 87.7 92.3
(*) 12.3 (*) 7.7
Germany 96.2 97.9 2.9 1.8 0.8 0.3
Estonia 93.0 94.3 3.0 1.9 3.9 3.8
Ireland 96.6 98.8 2.7 1.0 0.7 0.2
Greece 97.1 97.6 2.3 1.2 0.6 1.3
Spain 95.1 96.9 2.7 1.6 2.2 1.5
France 97.9 98.4 1.6 1.4 0.5 0.2
Italy 98.4 99.1 1.6 0.9 0.0 0.0
Cyprus 96.9 92.3 1.9 1.8 1.2 5.9
Latvia 91.1 93.9 3.6 2.7 5.3 3.4
Lithuania 96.1 97.9 3.6 2.0 0.3 0.1
Luxembourg 98.2 98.0 1.7 0.8 0.1 1.2
Hungary 90.9 95.5 4.8 2.7 4.3 1.8
Malta (**) 99.0 99.0 No est. No est. No est. No est.
Netherlands 87.6 93.1 4.8 2.1 7.6 4.8
Austria 95.0 97.6 4.2 1.8 0.8 0.7
Poland 97.9 98.6 1.6 1.1 0.5 0.3
Portugal 95.3 97.3 3.7 2.3 1.0 0.5
Romania 96.9 98.2 1.9 1.5 1.1 0.4
Slovenia 97.2 98.3 2.8 1.7 0.0 0.0
Slovakia 90.9 93.5 4.4 3.3 4.7 3.2
Finland 95.0 97.3 3.3 1.7 1.7 1.0
Sweden 95.5 97.9 3.6 1.8 0.8 0.3
United Kingdom 94.7 97.2 3.8 2.7 1.5 0.2
Note: The share of estimated data refers to the share in the final data transmitted to Eurostat. This is larger for first and intermediate data.
(*) Estimates both for trade below the exemption threshold and non-response.
(**) No estimate is compiled for trade below the exemption threshold and non-response.
Source: Eurostat calculations based on detailed statistics transmitted by Member States

Annex
Quality report on European statistics on international trade in goods
Quality Report on International Trade in Goods Statistics
42
Table A.3: Share of collected and estimated data in extra-EU trade, 2011 (%)
Collected data Estimated data
Standard category
Less detailed data (below statistical
threshold)
Delayed or incomplete records
Imports Exports Imports Exports Imports Exports
Belgium 100.0 100.0
Bulgaria 100.0 100.0
Czech Republic 100.0 100.0
Denmark 100.0 100.0 0.0
Germany 100.0 100.0
Estonia 100.0 100.0
Ireland 100.0 100.0
Greece 100.0 100.0
Spain 100.0 100.0
France 100.0 100.0
Italy 99.6 99.1 0.4 0.9
Cyprus 100.0 100.0
Latvia 100.0 100.0
Lithuania 100.0 100.0
Luxembourg 100.0 100.0
Hungary 100.0 100.0
Malta 100.0 100.0
Netherlands 99.6 100.0 0.4 0.0
Austria 100.0 100.0
Poland 100.0 100.0
Portugal 100.0 100.0
Romania 100.0 100.0
Slovenia 100.0 99.9 0.0 0.1
Slovakia 100.0 100.0
Finland 100.0 100.0
Sweden 100.0 100.0
United Kingdom 98.5 99.0 1.5 1.0
Source: Eurostat calculations based on detailed statistics transmitted by Member States

Annex
Quality report on European statistics on international trade in goods
Quality Report on International Trade in Goods Statistics
43
Table A.7: Impact of revisions in intra-and extra-EU trade, 2011 (%)
Intra-EU trade Extra-EU trade
Arrivals Dispatches Imports Exports
EU-27 1.1 0.5 3.1 2.1
Belgium 0.5 -0.1 5.8 0.3
Bulgaria 4.3 1.6 -0.2 1.1
Czech Republic 0.9 0.9 0.1 0.0
Denmark -3.4 -1.2 0.1 0.1
Germany -0.1 -0.1 0.5 0.2
Estonia -3.4 0.2 8.8 -0.8
Ireland 0.4 -1.4 0.3 0.0
Greece 10.9 12.9 63.3 15.5
Spain 4.9 5.6 3.2 0.6
France 0.6 -0.4 2.0 1.5
Italy 0.2 -0.1 -1.2 -0.2
Cyprus 0.5 2.5 1.6 -0.3
Latvia 6.7 0.9 -0.1 -0.6
Lithuania 2.9 -0.6 -1.2 0.2
Luxembourg 3.0 -3.9 1.6 2.8
Hungary 0.2 0.3 0.6 0.6
Malta 18.6 28.3 0.3 0.0
Netherlands -0.7 0.0 0.4 2.8
Austria 2.6 0.5 0.7 -1.5
Poland 6.4 2.6 -0.3 -0.2
Portugal 5.1 2.8 2.0 -1.4
Romania 1.0 0.8 0.0 0.7
Slovenia 1.0 0.1 0.1 -0.2
Slovakia 5.5 1.7 -0.3 -0.3
Finland 2.1 0.0 2.2 1.7
Sweden 1.3 -0.6 2.1 -0.2
United Kingdom 1.0 0.5 11.9 15.4
Note: Revision rate = (Last figure - First figure) / First figure * 100
Source: Eurostat calculations based on the first and last versions of detailed statistics transmitted by Member States

Annex
Quality report on European statistics on international trade in goods
Quality Report on International Trade in Goods Statistics
44
Table A.8: Impact of confidentiality in intra-EU trade, 2011
Number of CN8 codes affected
Impact on trade value (%)
Impact on net mass (%)
Arrivals Dispatches Arrivals Dispatches Arrivals Dispatches
Belgium 32 103 0.8 1.4 0.2 1.9
Bulgaria
Czech Republic 651 391 1.2 0.4 4.3 0.4
Denmark 45 101 0.5 7.0 1.7 10.5
Germany 65 197 2.4 2.6 8.2 9.4
Estonia
Ireland 11 6 0.0 0.1 0.0 0.4
Greece 11 11 0.0 2.8 0.0 1.0
Spain 53 52 0.4 0.8 0.7 1.6
France 38 316 0.3 3.2 0.0 3.8
Italy 23 101 0.2 0.7 0.2 1.0
Cyprus 1 0.8 0.0
Latvia
Lithuania
Luxembourg 3 6 3.9 1.7 8.4 0.7
Hungary 58 53 0.3 0.5 0.0 0.8
Malta
Netherlands 217 402 1.4 6.5 0.7 10.1
Austria 100 254 2.7 6.5 12.3 13.4
Poland 1 0.0 0.0
Portugal 131 2 0.0 0.0 0.0 0.0
Romania 81 52 0.3 0.5 0.0 0.0
Slovenia 27 12 0.0 0.0 0.2 0.1
Slovakia
Finland 78 137 1.3 7.1 11.9 12.1
Sweden 14 47 0.1 1.9 0.1 1.0
United Kingdom 12 62 0.3 1.7 1.9 1.9
Source: Eurostat calculations based on detailed statistics transmitted by Member States

Annex
Quality report on European statistics on international trade in goods
Quality Report on International Trade in Goods Statistics
45
Table A.9: Impact of confidentiality in extra-EU trade, 2011
Number of CN8 codes affected
Impact on trade value (%)
Impact on net mass (%)
Imports Exports Imports Exports Imports Exports
Belgium 39 99 2.3 2.9 0.6 3.5
Bulgaria
Czech Republic 242 195 0.3 0.5 0.1 0.5
Denmark 38 102 4.3 11.1 29.3 12.2
Germany 59 184 7.0 1.7 26.0 7.7
Estonia
Ireland
Greece 10 15 0.0 1.7 0.0 0.2
Spain 49 52 0.3 1.3 0.3 1.8
France 40 302 0.3 3.7 0.0 3.6
Italy 19 90 0.1 0.7 0.0 1.0
Cyprus 1 1.5 0.0
Latvia 5 1.1 0.5
Lithuania 1 0.4 0.2
Luxembourg 1 4 1.9 0.5 2.3 0.0
Hungary 59 63 0.5 0.7 0.0 1.3
Malta
Netherlands 410 724 4.3 5.0 3.1 1.9
Austria 88 247 12.4 8.0 45.4 7.4
Poland
Portugal 14 9 0.0 0.0 0.0 0.0
Romania 64 39 0.1 0.6 0.0 0.0
Slovenia 23 20 0.0 0.1 0.5 0.5
Slovakia
Finland 69 133 7.6 6.7 11.8 17.7
Sweden 19 51 0.3 4.7 0.5 1.4
United Kingdom 39 59 0.8 1.0 0.6 2.5
Source: Eurostat calculations based on detailed statistics transmitted by Member States

Annex
Quality report on European statistics on international trade in goods
Quality Report on International Trade in Goods Statistics
46
Table A.10: Number of CN8 codes affected according to type of confidentiality, 2011
Intra-EU trade Extra-EU trade
Arrivals Dispatches Imports Exports
Secre
t p
rod
uct
Secre
t p
art
ner
Secre
t p
rod
uct
and
pa
rtne
r
Secre
t p
rod
uct
Secre
t p
art
ner
Secre
t p
rod
uct
and
pa
rtne
r
Secre
t p
rod
uct
Secre
t p
art
ner
Secre
t p
rod
uct
and
pa
rtne
r
Secre
t p
rod
uct
Secre
t p
art
ner
Secre
t p
rod
uct
and
pa
rtne
r
Belgium 32 103 29 10 89 10
Bulgaria
Czech Republic 651 391 242 195
Denmark 38 7 81 20 31 7 82 20
Germany 16 4 45 175 1 21 15 11 33 172 1 11
Estonia
Ireland 11 6
Greece 11 11 10 15
Spain 53 52 49 52
France 2 6 30 282 4 30 2 6 32 261 4 37
Italy 23 101 19 90
Cyprus 1 1
Latvia 5
Lithuania 1
Luxembourg 3 6 1 4
Hungary 58 53 59 63
Malta
Netherlands 154 63 326 76 345 65 670 54
Austria 42 6 52 160 18 76 36 6 46 155 18 74
Poland 1
Portugal 131 2 14 9
Romania 81 52 64 39
Slovenia 5 22 12 5 18 20
Slovakia
Finland 37 41 11 126 34 35 11 122
Sweden 14 47 19 51
United Kingdom 6 6 47 15 9 30 39 20
Source: Eurostat calculations based on detailed statistics transmitted by Member States
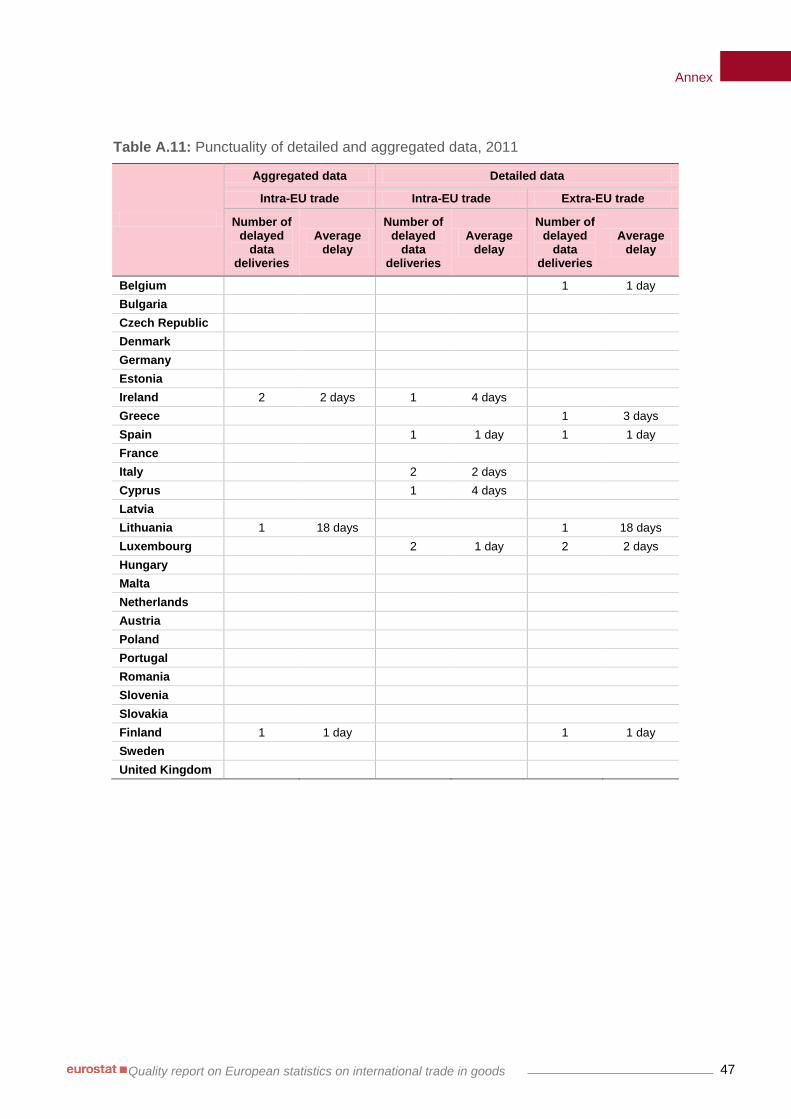
Annex
Quality report on European statistics on international trade in goods
Quality Report on International Trade in Goods Statistics
47
Table A.11: Punctuality of detailed and aggregated data, 2011
Aggregated data Detailed data
Intra-EU trade Intra-EU trade Extra-EU trade
Number of delayed
data deliveries
Average delay
Number of delayed
data deliveries
Average delay
Number of delayed
data deliveries
Average delay
Belgium 1 1 day
Bulgaria
Czech Republic
Denmark
Germany
Estonia
Ireland 2 2 days 1 4 days
Greece 1 3 days
Spain 1 1 day 1 1 day
France
Italy 2 2 days
Cyprus 1 4 days
Latvia
Lithuania 1 18 days 1 18 days
Luxembourg 2 1 day 2 2 days
Hungary
Malta
Netherlands
Austria
Poland
Portugal
Romania
Slovenia
Slovakia
Finland 1 1 day 1 1 day
Sweden
United Kingdom

Annex
Quality report on European statistics on international trade in goods
Quality Report on International Trade in Goods Statistics
48
Table A.13: Extra-EU asymmetries, 2011 (%)
EU-27 imports (*) EU-27 exports (**)
USA -1.1 -2.3
China 13.8 -10.7
Russia 20.9 36.7
Switzerland -3.1 19.5
Norway 0.1 13.3
Japan 2.3 -16.5
Turkey 8.1 11.0
South Korea -11.1 -4.7
Brazil 2.3 -2.5
India 0.5 1.0
(*) (EU imports - Mirror exports) / Mirror flows average
(**) (EU exports - Mirror imports) / Mirror flows average
Source: Eurostat calculations based on data transmitted by Member States and data available in the IMF database

Annex
Quality report on European statistics on international trade in goods
Quality Report on International Trade in Goods Statistics
49
Table A.14: Intra-EU asymmetries, 2011 (%)
Arrivals (*) Dispatches (**)
EU-27 -2.4 2.4
Belgium 5.0 5.4
Bulgaria 3.0 7.5
Czech Republic 0.0 3.5
Denmark -2.4 1.7
Germany -1.0 2.4
Estonia -2.7 3.6
Ireland -8.3 -17.2
Greece -2.2 5.8
Spain 0.5 7.3
France -5.1 1.2
Italy -1.1 5.9
Cyprus -35.1 -92.2
Latvia 6.3 -5.1
Lithuania 9.4 4.0
Luxembourg -6.8 -11.2
Hungary 2.2 7.9
Malta -13.3 -32.5
Netherlands -5.7 4.8
Austria -1.1 -0.2
Poland -8.1 4.6
Portugal 1.8 9.3
Romania 2.6 10.4
Slovenia 4.7 13.7
Slovakia -2.5 7.7
Finland -0.1 -3.8
Sweden 0.9 -3.8
United Kingdom -6.4 -3.6
(*) (Arrivals - mirror dispatches) / Mirror flows average
(**) (Dispatches - mirror arrivals) / Mirror flows average
Source: Eurostat calculations based on detailed statistics transmitted by Member States
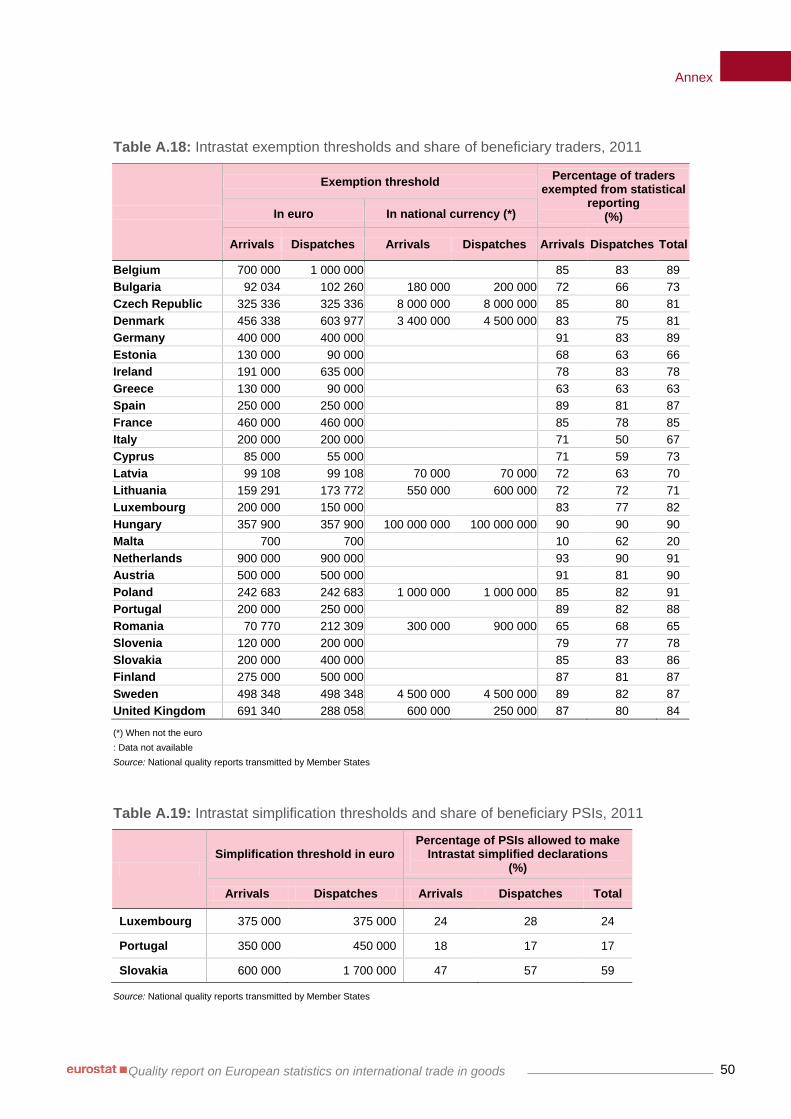
Annex
Quality report on European statistics on international trade in goods
Quality Report on International Trade in Goods Statistics
50
Table A.18: Intrastat exemption thresholds and share of beneficiary traders, 2011
Exemption threshold Percentage of traders
exempted from statistical reporting
(%) In euro In national currency (*)
Arrivals Dispatches Arrivals Dispatches Arrivals Dispatches Total
Belgium 700 000 1 000 000
85 83 89
Bulgaria 92 034 102 260 180 000 200 000 72 66 73
Czech Republic 325 336 325 336 8 000 000 8 000 000 85 80 81
Denmark 456 338 603 977 3 400 000 4 500 000 83 75 81
Germany 400 000 400 000
91 83 89
Estonia 130 000 90 000
68 63 66
Ireland 191 000 635 000
78 83 78
Greece 130 000 90 000
63 63 63
Spain 250 000 250 000
89 81 87
France 460 000 460 000
85 78 85
Italy 200 000 200 000
71 50 67
Cyprus 85 000 55 000
71 59 73
Latvia 99 108 99 108 70 000 70 000 72 63 70
Lithuania 159 291 173 772 550 000 600 000 72 72 71
Luxembourg 200 000 150 000
83 77 82
Hungary 357 900 357 900 100 000 000 100 000 000 90 90 90
Malta 700 700
10 62 20
Netherlands 900 000 900 000
93 90 91
Austria 500 000 500 000
91 81 90
Poland 242 683 242 683 1 000 000 1 000 000 85 82 91
Portugal 200 000 250 000
89 82 88
Romania 70 770 212 309 300 000 900 000 65 68 65
Slovenia 120 000 200 000
79 77 78
Slovakia 200 000 400 000
85 83 86
Finland 275 000 500 000
87 81 87
Sweden 498 348 498 348 4 500 000 4 500 000 89 82 87
United Kingdom 691 340 288 058 600 000 250 000 87 80 84
(*) When not the euro
: Data not available
Source: National quality reports transmitted by Member States
Table A.19: Intrastat simplification thresholds and share of beneficiary PSIs, 2011
Simplification threshold in euro Percentage of PSIs allowed to make
Intrastat simplified declarations (%)
Arrivals Dispatches Arrivals Dispatches Total
Luxembourg 375 000 375 000 24 28 24
Portugal 350 000 450 000 18 17 17
Slovakia 600 000 1 700 000 47 57 59
Source: National quality reports transmitted by Member States

Annex
Quality report on European statistics on international trade in goods
Quality Report on International Trade in Goods Statistics
51
Table A.20: Intrastat statistical value thresholds and share of beneficiary PSIs, 2011
Statistical value threshold Percentage of traders exempted from statistical
value reporting (%) In euro In national currency (*)
Arrivals Dispatches Arrivals Dispatches Arrivals Dispatches Total
Belgium All PSIs
exempted All PSIs
exempted 100 100 100
Bulgaria 1 738 420 3 834 750 3 400 000 7 500 000 86 90 87
Czech Republic All PSIs
exempted All PSIs
exempted 100 100 100
Denmark All PSIs
exempted All PSIs
exempted 100 100 100
Germany 30 000 000 42 000 000
95 96 96
Estonia 4 000 000 4 500 000
93 93 92
Ireland 5 000 000 34 000 000
88 91 :
Greece No
exemption No
exemption 0 0 0
Spain 6 000 000 6 000 000
99 97 98
France All PSIs
exempted All PSIs
exempted 100 100 100
Italy 20 000 000 20 000 000
: : :
Cyprus 1 500 000 3 500 000
93 96 93
Latvia 1 840 578 2 548 492 1 300 000 1 800 000 92 90 91
Lithuania 2 316 960 6 950 880 8 000 000 24 000 000 82 91 84
Luxembourg 4 000 000 8 000 000
83 88 84
Hungary 10 737 000 39 369 000 3 000 000 000 11 000 000 000 91 89 90
Malta No
exemption No
exemption 0 0 0
Netherlands All PSIs
exempted All PSIs
exempted 100 100 100
Austria 10 000 000 10 000 000
87 83 86
Poland 8 008 539 14 560 980 33 000 000 60 000 000 90 93 95
Portugal 5 000 000 6 500 000
82 83 83
Romania 2 358 990 4 717 980 10 000 000 20 000 000 89 83 88
Slovenia 4 000 000 9 000 000
91 90 91
Slovakia All PSIs
exempted All PSIs
exempted 100 100 100
Finland All PSIs
exempted All PSIs
exempted 100 100 100
Sweden All PSIs
exempted All PSIs
exempted 100 100 100
United Kingdom All PSIs
exempted All PSIs
exempted 100 100 100
(*) When not the euro
: Data not available
Source: National quality reports transmitted by Member States

Annex
Quality report on European statistics on international trade in goods
Quality Report on International Trade in Goods Statistics
52
Table A.21: Extrastat statistical thresholds, 2011
Extrastat statistical threshold
Belgium No threshold
Bulgaria No threshold
Czech Republic No threshold
Denmark No threshold
Germany No threshold
Estonia No threshold
Ireland No threshold
Greece No threshold
Spain No threshold
France No threshold
Italy EUR 1 000
Cyprus No threshold
Latvia No threshold
Lithuania No threshold
Luxembourg No threshold
Hungary No threshold
Malta No threshold
Netherlands No threshold
Austria No threshold
Poland No threshold
Portugal No threshold
Romania No threshold
Slovenia No threshold
Slovakia No threshold
Finland No threshold
Sweden No threshold
United Kingdom EUR 1 000 or 1 000 kg
Source: National quality reports transmitted by Member States

Glossary
Quality report on European statistics on international trade in goods
Quality Report on International Trade in Goods Statistics
53
Glossary
Arrivals Imports from another Member State (intra-EU imports).
Balance of payments The statistical system through which economic transactions between an economy and the rest of the world over specific time periods can be summarised in a systematic way. The fifth edition of the IMF Balance of Payments Manual (BPM5) provides conceptual guidelines for compiling balance of payments statistics according to international standards.
Combined Nomenclature A systematic list of goods descriptions based on the Harmonized System, used for the purposes of the Common Customs Tariff, external trade statistics and other Community policies (Article 1 of Regulation (EEC) No 2658/87, OJ L 256, 1987, p.1).
Country of origin The country where the goods originate. Goods that are wholly obtained or produced in a country originate in that country. Goods, the production of which involved more than one country, are deemed to originate in the country where they underwent their last, substantial, economically justified processing or processing resulting in the manufacture of a new product.
Customs declaration The act whereby a person indicates in the prescribed form and manner a wish to place goods under one of the customs procedures provided for by the Community Customs Code (Articles 4(17) and 59 to 78 CC).
Customs procedure The Community Customs Code provides for eight customs procedures: release for free circulation, transit, customs warehousing, inward processing, processing under customs control, temporary importation, outward processing, and exportation (Article 4(16) CC).
Dispatches Exports to another Member State (intra-EU exports).
Exports Goods leaving the statistical territory of a country.
Goods All movable property, including electric current.
Community goods (i) goods entirely obtained in the customs territory of the Community, without the addition of goods from non-EU countries or territories which are not part of the customs territory of the Community;
(ii) goods from non-EU countries or territories which are not part of the customs territory of the Community which have been released for free circulation in a Member State; and
(iii) goods obtained in the customs territory of the Community either exclusively from the goods referred to in point (ii) or from those referred to in points (i) and (ii);
Imports Goods which add to the stock of material resources of a country by entering its economic territory.

Glossary
Quality report on European statistics on international trade in goods
Quality Report on International Trade in Goods Statistics
54
National Statistical Authority (NSA)
Within the meaning of the Extrastat and Intrastat Regulations, the national statistical institutes and other bodies responsible in each Member State for producing international trade in goods statistics.
Provider of statistical information (PSI)
Any business, ‘institutional’ body (e.g. public and non-profit institution, school, hospital) or individual who provides statistical information.
Quantity of the goods The quantity of the goods can be expressed in two ways:
(a) as net mass, i.e. the actual mass of the goods excluding all packaging;
or
(b) in supplementary units, i.e. units measuring quantity other than net mass, as detailed in the annual Commission regulation updating the Combined Nomenclature.
Reference period The calendar year and month in which the goods are imported or exported. When the customs declaration is the source for records on imports and exports, the reference period indicates the calendar year and month when the declaration is accepted by customs authorities.
Statistical value The statistical value is based on the value of the goods at the time and place they cross the border of the Member State of destination on import or of the Member State of actual export on export. Statistical value includes the transport and insurance costs incurred in delivering the goods from the place of their departure to the border of the importing or exporting Member State.
VIES The VAT Information Exchange System (VIES) enables:
— companies rapidly to obtain confirmation of the VAT numbers of their intra-EU trading partners; and
— Tax administrations to monitor and control the flow of intra-EU trade to detect all kinds of irregularity.
HOW TO OBTAIN EU PUBLICATIONS
Free publications: • one copy:
via EU Bookshop (http://bookshop.europa.eu);
• more than one copy or posters/maps: from the European Union’s representations (http://ec.europa.eu/represent_en.htm); from the delegations in non-EU countries (http://eeas.europa.eu/delegations/index_en.htm); by contacting the Europe Direct service (http://europa.eu/europedirect/index_en.htm) or calling 00 800 6 7 8 9 10 11 (freephone number from anywhere in the EU) (*). (*) The information given is free, as are most calls (though some operators, phone boxes or hotels may charge you).
Priced publications: • via EU Bookshop (http://bookshop.europa.eu).

Exer in vu
lla faci blam
con
se euis n
ibh
el utat d
ip ex elestisim
R
ilis aug
iati siscilit venis n
im
2013
ed
ition
KS-TC-15-002-EN-N
doi:10.2785/648459