Embed Size (px)
Citation preview

AEAT - 4715 Issue 1
Quantification of the HealthEffects of Air Pollution in the UKfor the Review of the National AirQuality Strategy.
A report produced for The Department of theEnvironment, Transport and the Regions
John R StedmanEmma LinehanKatie King
January 1999

AEAT - 4715 Issue 1
Quantification of the HealthEffects of Air Pollution in the UKfor the Review of the National AirQuality Strategy.
A report produced for The Department of theEnvironment, Transport and the Regions
John R StedmanEmma LinehanKatie King
January 1999

AEAT - 4715 Issue 1
AEA Technology iiNETCEN
Title Quantification of the Health Effects of Air Pollution in the UK for theReview of the National Air Quality Strategy.
Customer The Department of the Environment, Transport and the Regions
Customer reference
File reference h:\health2.doc
Report number AEAT - 4715
Report status Issue 1
AEA TechnologyNational Environmental Technology CentreE5 CulhamABINGDONOX14 3DBTelephone 01235 463178Facsimile 01235 463817
AEA Technology is the trading name of AEA Technology plcAEA Technology is certificated to BS EN ISO9001:(1994)
Name Signature Date
Author John R StedmanEmma LinehanKatie King
Reviewed by Jacquie Berry
Approved by Geoff Dollard

AEAT - 4715 Issue 1
AEA Technology iiiNETCEN
Executive Summary
The UK National Air Quality Strategy (NAQS, DoE, 1997) sets objectives for reductions in theconcentrations of eight major pollutants to be achieved by the year 2005. The Department ofthe Environment, Transport and the Regions (DETR)-led Interdepartmental Group on Costsand Benefits (IGCB) was charged with the responsibility for carrying out an economic analysis ofthe additional measures that would be required to achieve the objectives and has prepared aninterim report (DETR, 1999). The purpose of the interim report, which forms part of the widerreview of the NAQS, was to explain how the IGCB have conducted the economic analysis ofthe NAQS objectives and to present preliminary results.
Air pollution damages health and one of the major purposes of the NAQS is to ensure a highdegree of protection against risks to public health from air pollution. An assessment of the healthbenefits that are likely to result from the reductions in air pollutant concentrations as a result ofthe implementation of existing policies is therefore an important component of an economicanalysis of the NAQS. In some instances it has also been possible to assess the health benefits thatcould be expected to result from additional measures on top of those that are expected to resultfrom current policies.
The health benefit calculations that are presented in the IGCB report (DETR, 1999) wereundertaken at the AEA Technology National Environmental Technology Centre (NETCEN)and this report provides additional details of the methods and assumptions underlying thesecalculations.

AEAT - 4715 Issue 1
AEA Technology ivNETCEN

AEAT - 4715 Issue 1
AEA Technology vNETCEN
Contents
1 Introduction 1
2 General Approach 2
2.1 INTRODUCTION 22.2 DOSE RESPONSE COEFFICIENTS 22.3 BASELINE RATES FOR DEATHS BROUGHT FORWARD AND RESPIRATORYHOSPITAL ADMISSIONS 32.4 POPULATION STATISTICS 4
3 Nitrogen Dioxide 4
3.1 POLLUTANT CONCENTRATION MAPS 43.2 HEALTH BENEFITS RESULTING FROM CURRENT POLICIES 53.3 HEALTH BENEFITS RESULTING FROM ADDITIONAL MEASURES 5
4 Particles 6
4.1 POLLUTANT CONCENTRATION MAPS 64.2 HEALTH BENEFITS RESULTING FROM CURRENT POLICIES 74.3 HEALTH BENEFITS RESULTING FROM ADDITIONAL MEASURES 8
5 Sulphur Dioxide 8
5.1 POLLUTANT CONCENTRATION MAPS 85.2 HEALTH BENEFITS RESULTING FROM CURRENT POLICIES 8
6 Ozone 9
6.1 INTRODUCTION 96.2 MODELLING PEAK CONCENTRATIONS IN 2010 106.3 MODELLING LONG TERM URBAN OZONE CONCENTRATIONS IN 2010 116.4 HEALTH BENEFITS FOR A 50 PPB THRESHOLD CALCULATION 116.5 HEALTH BENEFITS FOR A NO-THRESHOLD CALCULATION 12
7 Acknowledgement 13
8 References 13

AEAT - 4715 Issue 1
AEA Technology viNETCEN

AEAT - 4715 Issue 1
AEA Technology 1NETCEN
1 Introduction
The UK National Air Quality Strategy (NAQS, DoE, 1997) sets objectives for reductions in theconcentrations of eight major pollutants to be achieved by the year 2005. When the objectiveswere set, the Government gave a commitment to undertake a formal economic analysis of theadditional measures that would be required to achieve the objectives. The Department of theEnvironment, Transport and the Regions (DETR)-led Interdepartmental Group on Costs andBenefits (IGCB) was charged with the responsibility for fulfilling this commitment and hasprepared an interim report (DETR, 1999). The purpose of the interim report, which forms partof the wider review of the NAQS, was to explain how the IGCB has conducted the economicanalysis of the NAQS objectives and to present preliminary results.
Air pollution damages health and one of the major purposes of the NAQS is to ensure a highdegree of protection against risks to public health from air pollution. Healthy individuals are notthought to be at significant risk from current levels of air pollution in the UK, but studies haveindicated associations which persist at relatively low levels, between daily variations in levels ofsome pollutants and daily variations in mortality and hospital admissions for acute respiratoryconditions. In some cases the mechanisms are not yet known, but the Department of Health'sCommittee on the Medical Effects of Air Pollutants has advised that it would be imprudent notto regard the associations as causal. An assessment of the health benefits that are likely to resultfrom the reductions in air pollutant concentrations as a result of the implementation of existingpolicies is therefore an important component of an economic analysis of the NAQS. In someinstances it has also been possible to assess the health benefits that could be expected to resultfrom additional measures on top of those that are expected to result from current policies.
The health benefit calculations that are presented in the IGCB report (DETR, 1999) wereundertaken at the AEA Technology National Environmental Technology Centre (NETCEN)and this report provides additional details of the methods and assumptions underlying thesecalculations. Details of the methods that were used to calculate the maps of estimated pollutantconcentration for both current and future years that are required for the health benefitcalculations are given in the following NETCEN reports: Nitrogen Dioxide (NO2) - Stedman,Bush and King (1998), Particles (PM10) - Stedman, Linehan et al (1998) and SO2 - Abbott andVincent (1999). The methods that have been used to map summer ozone concentrations aredescribed in Stedman et al (1997).
Our general approach to estimating the magnitude of the health impacts of air pollutantconcentrations is given in section 2. Details of the health benefits calculations that have beencarried out for each pollutant for the review of the NAQS are described in subsequent sections.

AEAT - 4715 Issue 1
AEA Technology 2NETCEN
2 General Approach
2.1 INTRODUCTION
The approach that we have adopted in the health benefit calculations for the review of theNAQS is consistent with the approach adopted in the report published by the Department ofHealth's Committee on the Medical Effects of Air Pollutants early in 1998 (Quantification of theEffects of Air Pollution on Health in the United Kingdom, COMEAP, 1998). The results ofthis type of calculation are a refinement of the crude estimates that might be produced byassuming that all the population is exposed to some national average concentration of pollutants.A method that is equivalent to assessing the population weighted mean concentrations of airpollutants across the country is required because both the concentrations air pollutants and thepopulation density are variable across the country.
The method adopted by COMEAP (1998) can be summarised as follows.
1. The country has been divided into 1 km grid squares and the annual average concentration ofpollutants and resident population has been estimated for each square. The former has beenderived from the national mapping of the UK pollution climate undertaken at NETCEN andthe latter from census data .
2. A baseline level of the given health-related and pollution affected events e.g., daily deaths,hospital admissions for the treatment of respiratory diseases has been assigned to each gridsquare.
3. By combining the data from (1) and (2) and applying a coefficient linking pollutantconcentrations with the relevant effects the estimated health impact of each pollutant can becalculated for each grid square.
4. Summing the results obtained in (3) gives the relevant totals for the UK.
The results presented for particles, SO2 and NO2 by COMEAP were based on the population inurban areas only because the epidemiological studies on which the dose response coefficientswere based, were done in cities. The calculations for ozone included both the urban and ruralpopulations but were performed for the summer only. This was because ozone concentrationsare generally higher in rural than in urban areas and concentrations are also higher in the summer.The health benefit calculations for the review of the NAQS have followed these conventions.
2.2 DOSE RESPONSE COEFFICIENTS
The literature on the effects of air pollutants on health is extensive and was not reviewed for theIGCB report. This was felt to be unnecessary as the COMEAP report had examined therelevant evidence and had produced a series of dose-response coefficients linking concentrationsof three major pollutants with effects on health. The exposure (dose)-response coefficients usedin the current analysis are the same as those used by COMEAP (1998) and are presented inTable 2.1.
AEAT - 4715 Issue 1
AEA Technology 3NETCEN
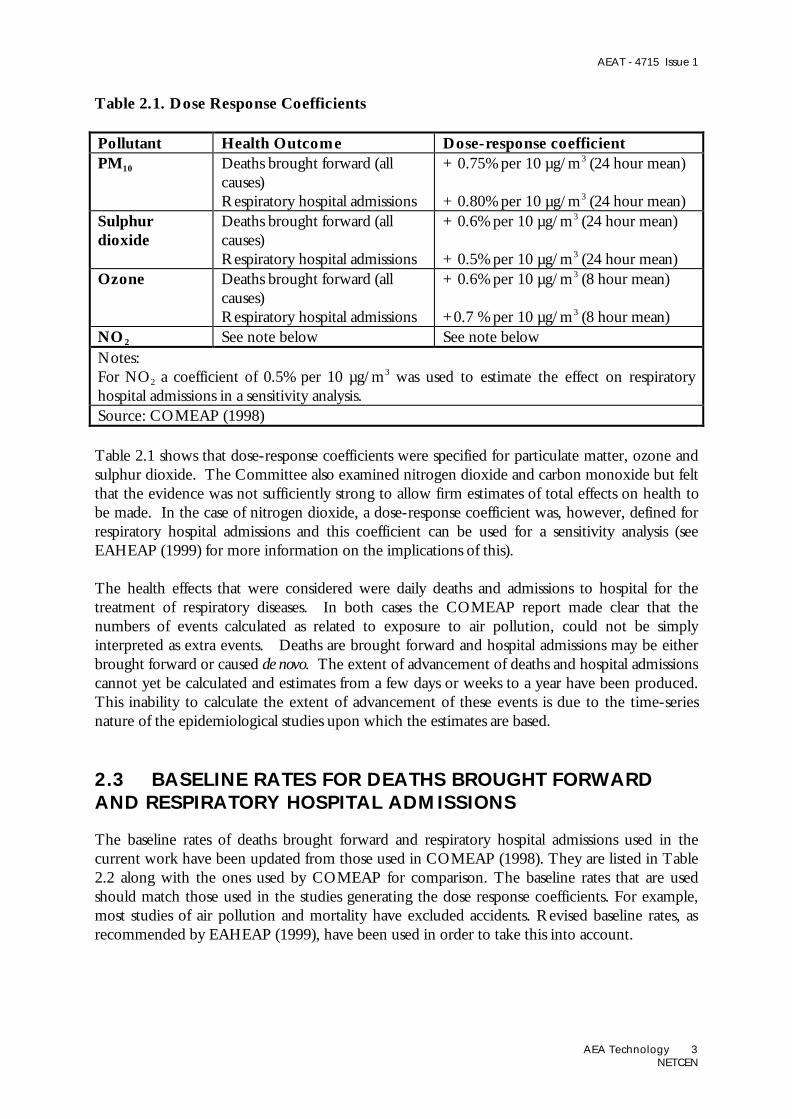
Table 2.1. Dose Response Coefficients
Pollutant Health Outcome Dose-response coefficientPM10 Deaths brought forward (all
causes)Respiratory hospital admissions
+ 0.75% per 10 µg/m3 (24 hour mean)
+ 0.80% per 10 µg/m3 (24 hour mean)Sulphurdioxide
Deaths brought forward (allcauses)Respiratory hospital admissions
+ 0.6% per 10 µg/m3 (24 hour mean)
+ 0.5% per 10 µg/m3 (24 hour mean)Ozone Deaths brought forward (all
causes)Respiratory hospital admissions
+ 0.6% per 10 µg/m3 (8 hour mean)
+0.7 % per 10 µg/m3 (8 hour mean)NO2 See note below See note belowNotes:For NO2 a coefficient of 0.5% per 10 µg/m3 was used to estimate the effect on respiratoryhospital admissions in a sensitivity analysis.Source: COMEAP (1998)
Table 2.1 shows that dose-response coefficients were specified for particulate matter, ozone andsulphur dioxide. The Committee also examined nitrogen dioxide and carbon monoxide but feltthat the evidence was not sufficiently strong to allow firm estimates of total effects on health tobe made. In the case of nitrogen dioxide, a dose-response coefficient was, however, defined forrespiratory hospital admissions and this coefficient can be used for a sensitivity analysis (seeEAHEAP (1999) for more information on the implications of this).
The health effects that were considered were daily deaths and admissions to hospital for thetreatment of respiratory diseases. In both cases the COMEAP report made clear that thenumbers of events calculated as related to exposure to air pollution, could not be simplyinterpreted as extra events. Deaths are brought forward and hospital admissions may be eitherbrought forward or caused de novo. The extent of advancement of deaths and hospital admissionscannot yet be calculated and estimates from a few days or weeks to a year have been produced.This inability to calculate the extent of advancement of these events is due to the time-seriesnature of the epidemiological studies upon which the estimates are based.
2.3 BASELINE RATES FOR DEATHS BROUGHT FORWARDAND RESPIRATORY HOSPITAL ADMISSIONS
The baseline rates of deaths brought forward and respiratory hospital admissions used in thecurrent work have been updated from those used in COMEAP (1998). They are listed in Table2.2 along with the ones used by COMEAP for comparison. The baseline rates that are usedshould match those used in the studies generating the dose response coefficients. For example,most studies of air pollution and mortality have excluded accidents. Revised baseline rates, asrecommended by EAHEAP (1999), have been used in order to take this into account.

AEAT - 4715 Issue 1
AEA Technology 4NETCEN
Table 2.2. Baseline death rates and respiratory hospital admissions rates per 100,000people (Figure in brackets are those used by COMEAP, 1998)
Pollutants Deaths Respiratory hospital admissionsParticles, SO2 (and NO2) 10741 (1106.4)5 8302 (1342.3)6
Ozone 491.83 (506.8)7 3604 (345)8
Notes1 deaths excluding external causes, per year, 19952 emergency respiratory admissions, per year, 1994/53 deaths excluding external causes, per summer (April to September 1995)4 emergency respiratory admissions, per summer (April to September 1995)5 deaths including external causes, per year, 19956 respiratory admissions, per year, 1994/57 deaths including external causes, per summer (April to September 1995)8 emergency respiratory admissions, per summer (April to September 1993)
2.4 POPULATION STATISTICS
The population statistics used in the COMEAP report were based on the 1981 census andincluded people living in Great Britain only. The urban population represented within thiscensus data was estimated by assigning areas as urban if the sum of urban and suburban land coverclasses within the Land Cover Map of Great Britain (Fuller et al, 1994) for a given 1 km squarewas greater than 20%. This gave an urban population of 42,500,000. We have used data from the1991 census for the whole of the UK for the calculations presented in this report and the urbanpopulation represented within this dataset is 40,700,000. The change in urban populationbetween the 1981 and 1991 based datasets may be due, at least in part, to differences in the waythat the census data has been aggregated from enumeration district to grid square totals.
3 Nitrogen Dioxide
3.1 POLLUTANT CONCENTRATION MAPS
Maps of estimated annual mean background NO2 concentration have been calculated for 1996and 2005. Full details of the methods used to calculate the 1996 map are given in Stedman(1998). A brief description of these methods is provided in Stedman, Bush and King (1998)along with a description of the methods used and assumption that have been made in order toproject this map forward to provide estimates for 2005.
Maps for 1996 were calculated from a combination of a map of rural NO2 concentration andestimates of low level NOx emissions on a 1 km square basis from the National AtmosphericEmissions Inventory (NAEI, Salway et al, 1997, Goodwin et al, 1997). The relationship between
AEAT - 4715 Issue 1
AEA Technology 5NETCEN
ambient annual mean NO2 concentration and emission rates was calibrated using data from theDETR national monitoring networks (Broughton et al, 1998).
A map for 2005 was then calculated for comparison with the NAQS annual mean objective forNO2 of 21 ppb. NO2 is a secondary pollutant and is therefore not expected to respond in asimple linear fashion to the reductions in urban road traffic NOx emissions that are expect toresult from the implementation of current policies. A non-linear relationship between thereductions in NOx emissions that are expected for this ‘business as usual’ scenario and theresulting ambient NO2 concentrations was therefore adopted, as suggested by Derwent (perscomm).
3.2 HEALTH BENEFITS RESULTING FROM CURRENT POLICIES
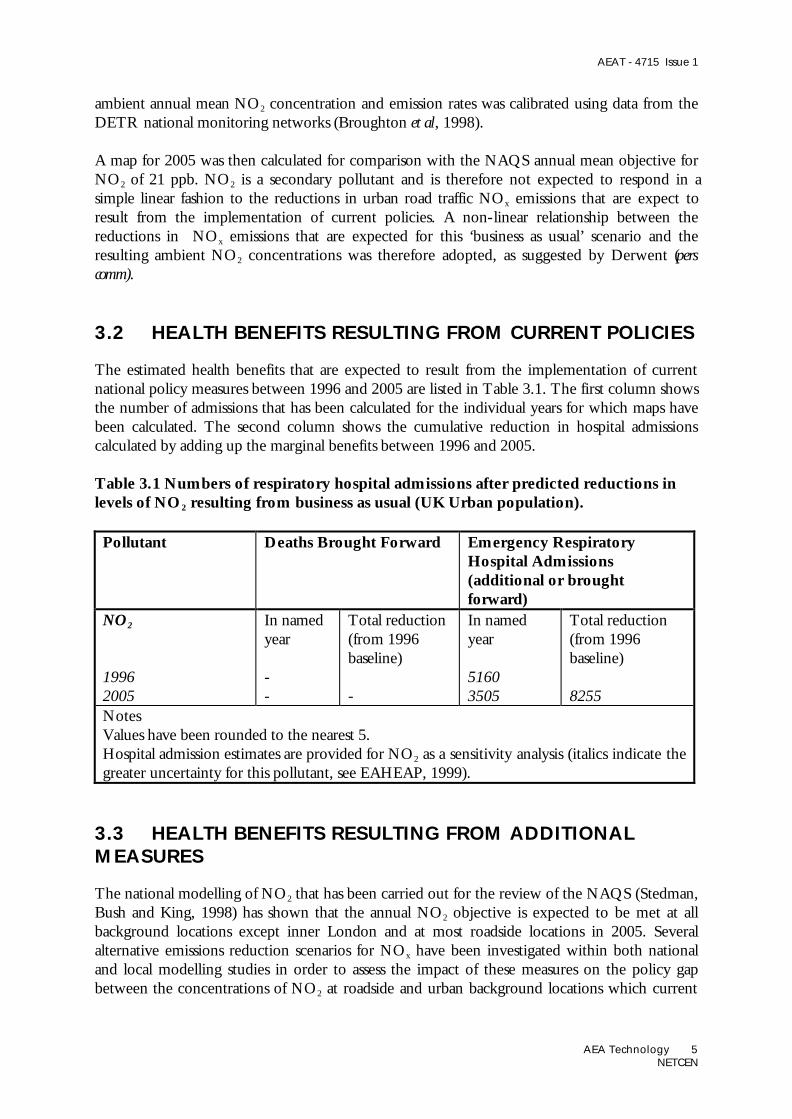
The estimated health benefits that are expected to result from the implementation of currentnational policy measures between 1996 and 2005 are listed in Table 3.1. The first column showsthe number of admissions that has been calculated for the individual years for which maps havebeen calculated. The second column shows the cumulative reduction in hospital admissionscalculated by adding up the marginal benefits between 1996 and 2005.
Table 3.1 Numbers of respiratory hospital admissions after predicted reductions inlevels of NO2 resulting from business as usual (UK Urban population).
Pollutant Deaths Brought Forward Emergency RespiratoryHospital Admissions(additional or broughtforward)
NO2
19962005
In namedyear
--
Total reduction(from 1996baseline)
-
In namedyear
51603505
Total reduction(from 1996baseline)
8255NotesValues have been rounded to the nearest 5.Hospital admission estimates are provided for NO2 as a sensitivity analysis (italics indicate thegreater uncertainty for this pollutant, see EAHEAP, 1999).
3.3 HEALTH BENEFITS RESULTING FROM ADDITIONALMEASURES
The national modelling of NO2 that has been carried out for the review of the NAQS (Stedman,Bush and King, 1998) has shown that the annual NO2 objective is expected to be met at allbackground locations except inner London and at most roadside locations in 2005. Severalalternative emissions reduction scenarios for NOx have been investigated within both nationaland local modelling studies in order to assess the impact of these measures on the policy gapbetween the concentrations of NO2 at roadside and urban background locations which current

AEAT - 4715 Issue 1
AEA Technology 6NETCEN
policies are likely to deliver and the NAQS objective. The marginal health benefits that areexpected to result from these additional reductions in emissions have also been calculated.
The alternative emissions reduction scenarios that have been examined are listed in Table 3.2.Marginal health benefits have been calculated for two scenarios for which emission reductions aretargeted to London and are listed in Table 3.3. The cumulative total additional health benefitslisted in Table 3.3 have been calculated on the basis of a linear additional reduction in admissionsbetween 1996 and 2005. If measures were fully implemented at the start of 2005, rather thanintroduced gradually over the period between 1996 and 2005, then there would be nocumulative health benefits over this period relative to business as usual. The additional healthbenefits would be limited to those in 2005 and subsequent years.
Table 3.2 Alternative emissions reduction scenarios for 2005 , relative to 2005business as usual
scenario emission reduction compared with business as usualhl 30% less emissions from road traffic in inner London
10% less emissions from road traffic in outer Londonbusiness as usual in the rest of the country
il 30% less emissions from cars in inner London10% less emissions from cars in outer Londonbusiness as usual in the rest of the country
Table 3.3. The impact of additional emissions reduction measures on additional andbrought forward hospital admissions attributable to NO2.
scenario Marginal benefit in 2005 cumulative total benefit relative to business as usualhl 62 310il 19 95
4 Particles
4.1 POLLUTANT CONCENTRATION MAPS
Maps of estimated annual mean background PM10 concentration have been calculated for 1995,1996, 2000, 2004 and 2005. Details of the methods used to calculate these maps are given inStedman, Linehan et al (1998).
While maps of current annual mean PM10 concentrations have been previously presented byStedman (1998), maps of annual means and number of exceedance days, for comparison with theexisting PM10 NAQS objective and European Union ‘Daughter Directive’ 24-hour and annuallimit values for both current and future years have been calculated by Stedman, Linehan et al

AEAT - 4715 Issue 1
AEA Technology 7NETCEN
(1998). The daily PM10 receptor modelling methods developed for the Airborne Particles ExpertGroup report (APEG, 1999) and annual mean mapping methods of Stedman (1998) have beencombined to produce daily maps of background PM10 concentrations.
Daily mean maps for the UK were calculated every day for both 1995 and 1996 by combiningmaps of secondary particles (derived from interpolated daily rural sulphate data), coarse particlemaps (derived from an interpolation of the daily estimates of coarse particles at urban sites) andprimary particle maps consisting of both long range transported primary particles and localprimary particles (derived from black smoke measurements and emissions data). The daily mapswere then summed to produce an annual mean map for both 1995 and 1996. Projections to2000, 2004, and 2005 were undertaken, on the basis of current policies, using both of these yearsas a starting point, in order to assess the influence of different types of meteorology on futureconcentrations.
4.2 HEALTH BENEFITS RESULTING FROM CURRENT POLICIES
The estimated health benefits that are expected to result from the implementation of currentnational policy measures between 1995/1996 and 2005 are listed in Table 4.1. The first columnshows the number of deaths or admissions that has been calculated for the individual years forwhich maps have been calculated. The second column shows the cumulative reduction in deathshospital admissions calculated by adding up the marginal benefits between 1996 and 2005.Cumulative benefits were calculated by assuming linear changes in health outcomes between1995/1996 and 2000 and between 2000 and 2005. The benefits in each year relative to1995/1996 were then summed to give the total benefit over the period.
Table 4.1 Numbers of deaths and respiratory hospital admissions after predictedreductions in levels of PM10 resulting from business as usual (UK Urban population).
Pollutant Deaths Brought Forward Emergency RespiratoryHospital Admissions(additional or broughtforward)
PM10
Baseline 19951995200020042005
Baseline 19961996200020042005
In namedyear
7060657062506170
7390691065856480
Total reduction(from 1995 or1996 baseline)
5120
4860
In namedyear
5820541551505090
6090569554105345
Total reduction(from 1995 or1996 baseline)
4225
4015Notes

AEAT - 4715 Issue 1
AEA Technology 8NETCEN
Values have been rounded to the nearest 5.
4.3 HEALTH BENEFITS RESULTING FROM ADDITIONALMEASURES
The marginal health benefits due to reductions is PM10 concentration have also been calculatedfor the alternative emissions reduction scenarios listed in Table 3.2 and the results are listed inTable 4.2. Once again the cumulative total benefits have been calculated on the assumption thatthe additional emission reduction measures are introduced gradually over the period between1996 and 2005.
Table 4.2. The impact of additional emissions reduction measures on deaths andhospital admissions attributable to PM10.
scenario Marginal benefit in named year cumulative total benefit relative tobusiness as usual
deaths admissions deaths admissionshl 28 23 140 115il 9 8 45 40NotesMarginal benefits in 2005 and cumulative marginal benefits between 1996 and 2005 comparedwith 2005 business as usual scenario.Base year is 1996 for all calculations
5 Sulphur Dioxide
5.1 POLLUTANT CONCENTRATION MAPS
Maps of estimated annual mean background SO2 concentration in Great Britain have beencalculated for 1996 and 2005. Full details of the methods used to calculate these maps are givenin Abbott and Vincent (1999).
Maps for 1996 were calculated from a combination of dispersion modelling of major pointsources (Part A emissions), box modelling of local low level sources and interpolation of theresidual rural concentration. A business as usual scenario has been examined for 2005: theemissions projections in this scenario assume a complete upgrade of Part A processes and theimplementation of the ‘Sulphur content of liquid fuels’ EU Directive.

AEAT - 4715 Issue 1
AEA Technology 9NETCEN
5.2 HEALTH BENEFITS RESULTING FROM CURRENT POLICIES
The estimated health benefits that are expected to result from the implementation of currentnational policy measures are listed in Table 5.1. The first column shows the number of deaths oradmissions that has been calculated for the individual years for which maps have been calculated.The second column shows the cumulative reduction in deaths or hospital admissions calculatedby adding up the marginal benefits between 1996 and 2005. Estimates are shown for both of thescenarios for 2005.
Table 5.1 Numbers of deaths and respiratory hospital admissions after predictedreductions in levels of SO2 (Great Britain Urban population).
Pollutant Deaths Brought Forward Emergency RespiratoryHospital Admissions(additional or broughtforward)
SO2
19962005a
In namedyear
33051370
Total reduction(from 1996baseline)
9675
In namedyear
2125880
Total reduction(from 1996baseline)
6230NotesValues have been rounded to the nearest 5.Sulphur dioxide maps exclude Northern Ireland.
6 Ozone
6.1 INTRODUCTION
The health benefits calculations that been carried out within the review of the NAQS for ozoneare less complete than for the other pollutants because there are a number of complicating factorswhich are unique to this pollutant.
• The health outcome calculations in the COMEAP quantification report (COMEAP, 1998)were calculated using two different approaches:
• a threshold for health impact of 50 ppb• no threshold
• peak ozone concentrations during photochemical episodes are expected to reduce in futureyears due to reductions in emissions of the precursors of ozone on European scale.
• long term mean ozone concentrations in cities are expected to increase in future years asurban NOx emissions reduce.
AEAT - 4715 Issue 1
AEA Technology 10NETCEN
The methods that have been used previously to map daily ozone concentrations and calculatethe resulting health impacts for the summer of 1995 are described in COMEAP (1998) and insome detail in Stedman et al (1997). Maps of maximum running 8-hour mean were calculatedfor each day during the summer of 1995 and health impacts for ozone concentrations greaterthan a 50 ppb threshold for the GB population were then calculated. A map of the summermean of the daily maximum of running 8-hour mean ozone concentration for 1995 was alsocalculated and used for the no-threshold health impact calculation (this is mathematically thesame as carrying out the no-threshold calculation on a daily basis and summing the results). Theestimated health impacts due to ozone during the summer of 1995 calculated for the review ofthe NAQS used the same maps of ozone concentrations as used by COMEAP (1998) andStedman et al (1997), the baseline rates listed in Table 2.2 and 1991 UK census data. Theresulting numbers of deaths and hospital admissions in 1995 due to ozone are therefore differentfrom those published previously.
The modelling work that has been undertaken to quantify the likely effects of emissionreductions on peak and long term mean ozone concentrations is briefly described in sections 6.2and 6.3. The results of the modelling work for peak ozone concentrations has enabled 50 ppbthreshold health benefit calculations to be completed for a range of different scenarios and theseresults are listed in section 6.4. Health benefit calculations for the no-threshold case have notbeen completed and the reasons why this has not been done are given in section 6.5.
6.2 MODELLING PEAK CONCENTRATIONS IN 2010
Modelling of ozone concentrations on a European scale is currently being carried out in theUNECE, as part of the preliminary stages of the negotiations on the so-called Multi-Protocol,and within the EU as part of the development of the combined ozone and acidification strategiesand the draft ozone directive. The emissions from each Member State which deliver theenvironmental goals of the strategies will be embodied in the National Emissions CeilingsDirective, a draft of which the Commission intends to produce in February 1999. Themodelling is being carried out by IIASA in both fora, using the integrated assessment model,RAINS, which incorporates the EMEP atmospheric models transfer matrices, abatement costand efficiency information, and critical loads and levels data for the ecosystems in the countriesconcerned. As well as this European scale modelling, more detailed modelling of ozone is beingcarried out for DETR by the Meteorological Office and the Universities of Edinburgh andLancaster. This latter modelling is concentrating on ozone in the UK at a more detailed spatiallevel than the RAINS model is currently capable of handling. It deals with regional scale ozoneconcentrations in the UK, at a spatial resolution of 100 km.
The results of the European and UK scale modelling studies have been combined to produceTable 6.1, which lists the ozone reduction factors that each scenario is likely to deliver on dayswith photochemical ozone episodes (current ozone concentrations greater 40 ppb). Thereference scenario refers to the expected emissions in 2010 resulting from the implementation ofcurrent policies. The F1 scenario is a set of emission ceilings for the EU-15 following the costoptimal attainment of environmental targets for acidification and ozone across the EU.
Table 6.1 Photochemical ozone reduction factors relative to 1995 concentrations.

AEAT - 4715 Issue 1
AEA Technology 11NETCEN
scenario description factor1995 1.0002010 reference current policies 0.7992010 F1 0.7742010 MFR Maximum feasible reductions 0.662
6.3 MODELLING LONG TERM URBAN OZONECONCENTRATIONS IN 2010
Unlike the European scale modelling referred to above, UK modelling has begun the moredifficult task of estimating ozone concentrations in urban areas, at a spatial resolution of 1 km.Preliminary results for London (Derwent, pers comm, 1998) suggest that for reductions in NOx
emissions of 50-60%, annual mean ozone concentrations will increase by about 3-4 ppb fromcurrent levels of around 10-15 ppb. The functions listed in Table 6.2 have been suggested forpredicting the change in annual mean ozone concentration for 60% NOx control (which isroughly business as usual for 2010, relative to 1995).
Table 6.2 Function for predicting change in annual mean ozone concentration(Derwent, pers comm, 1998)
ozone concentration in 1995 ozone concentration in 2010< 10 ppb add 4.2 ppb10 - 26 ppb add 4.2 - (0.25*(ozone - 10))> 26 ppb no change
6.4 HEALTH BENEFITS FOR A 50 PPB THRESHOLDCALCULATION
The ozone reduction factors listed in Table 6.1 have been used to scale the daily maps of ozoneconcentrations for the summer of 1995 and the resulting health benefits for each scenario arelisted in Table 6.3. A linear reduction in deaths and admissions between 1995 and 2010 has beenassumed in the calculations of the cumulative benefits.
Table 6.3 Numbers of deaths and respiratory hospital admissions due to ozone for arange of scenarios UK Urban and Rural population, 50 ppb threshold).
Pollutant Deaths Brought Forward Emergency RespiratoryHospital Admissions(additional or broughtforward)
ozone
1995
In namedyear
720
Total reduction(from 1995baseline)
In namedyear
615
Total reduction(from 1995baseline)

AEAT - 4715 Issue 1
AEA Technology 12NETCEN
2010 reference2010 F12010 MFR
23519025
389042505550
20016020
332036254745
NotesValues have been rounded to the nearest 5.
6.5 HEALTH BENEFITS FOR A NO-THRESHOLD CALCULATION
The calculation of the numbers of deaths and hospital admissions due to ozone for the no-threshold case is relatively straight forward for 1995 and the results are listed in Table 6.4.
Table 6.4 Numbers of deaths and respiratory hospital admissions due to ozone for ano-threshold calculation (UK Urban and Rural population).
Pollutant Deaths Brought Forward Emergency RespiratoryHospital Admissions(additional or broughtforward)
ozone
1995
2010 effect of reductionin peak concentration
2010 effect of increase inmean concentrations inurban areas
In namedyear
12240
11455
12600
differencerelative to 1995
-790
+360
In namedyear
10455
9780
10760
difference relativeto 1995
-675
+305
NotesValues have been rounded to the nearest 5.Italics indicate the greater uncertainty associated with these values
For 2010 it is expected that peak concentrations will reduce relative to 1995 but non-episodeconcentrations in urban areas are likely to increase. Current modelling methods are notsufficiently advanced to enable a full no-threshold calculation of the health outcomes in 2010.The influences of the changes in peak and changes in urban ozone concentrations between 1995and 2010 have been calculated separately.
For the reduction in peak values we have applied an ozone reduction factor for the referencescenario listed in Table 6.1 on a daily basis to 8-hour ozone concentrations greater than 40 ppb(values above 50 ppb were multiplied by 0.799 and values between 40 and 50 were set to 40ppb). This results in the reductions in numbers of deaths and admissions which are listed in thesecond row of Table 6.4.

AEAT - 4715 Issue 1
AEA Technology 13NETCEN
In order to apply the function for predicting changes in annual mean ozone to the dailymaximum of running 8-hour ozone concentrations we calculated a map of the summer mean ofthe daily maximum of running 8-hour ozone for 1995 and examined the relationship betweenthis statistic and annual mean:
summer mean of daily maximum of running 8-hour ozone = 0.884 * annual mean + 16.328(r2 = 0.78).
This relationship was then used to calculate a map of predicted summer mean of the dailymaximum of running 8-hour ozone for 2010 in which the concentrations have been adjusted totake the likely changes in long term mean ozone concentrations in urban areas into account. Thisresults in the increases in numbers of deaths and admissions as listed in the third row of Table6.4.
Thus the likely reduction in admissions and deaths due to reducing peak levels of ozone is largerthan the likely increase due to increases in urban areas. The results of this preliminary calculationare not very robust and firm conclusions will need to await more detailed analysis of thecombined effects the emissions changes on future ozone concentrations. It is reasonable to note,however, that the likely reductions in health effects due to the reduction in peak ozone may beoffset by the increase in urban ozone for a no-threshold calculation.
7 Acknowledgement
This work was funded by the UK Department of the Environment, Transport and the Regionsas part of their Air Quality Research Programme.
8 References
Abbott J and Vincent K (1999). Dispersion modelling of SO2 concentrations in Great Britain forcomparison with the National Air Quality Strategy. AEA Technology Environment, NationalEnvironmental Technology Centre.
APEG (1998). Source Apportionment of Airborne Particulate Matter in the United Kingdom.Airborne Particles Expert Group.
Broughton GFJ, Bower JS, Clark H and Wills P (1998). Air Pollution in the UK: 1996. AEATechnology Environment, National Environmental Technology Centre. AEAT- 2238.

AEAT - 4715 Issue 1
AEA Technology 14NETCEN
COMEAP (1998). Quantification of the effects of air pollution on health in Great Britain.Department of Health Committee on the Medical Effects of Air Pollutants. The StationaryOffice. ISBN 0-11-322102-9
DoE (1997) Department of the Environment. The United Kingdom National Air QualityStrategy. The Stationary Office, March 1997, CM 3587.
Derwent R G. Meteorological Office, Bracknell. Personal communication (1998).
DETR (1999). Interdepartmental Group on Costs and Benefits- Interim Report.
EAHEAP (1999). Department of Health Ad-Hoc Group on the Economic Appraisal of theHealth Effects of Air Pollution "Economic Appraisal of the Health Effects of Air Pollution"London: The Stationery Office.
Fuller R. M., Groom, G. B. and Jones, A. R. (1994). An automated classification of LandsatThematic mapper data. Photogrammetric Engineering and Remote Sensing 60, No 5, 553-562
Goodwin, J. W. L., Eggleston, H. S. and Stedman, J. R. (1997). Atmospheric EmissionInventory 1995: Detailed spatial emission estimates and method. AEA Technology, NationalEnvironmental Technology Centre. Report AEA/RAMP/20090001. AEAT-1835.
Salway, A. G., Eggleston, H. S. Goodwin, J. W. L and Murrells, T. P. (1997) UK Emissions ofAir Pollutants 1970-1995. National Atmospheric Emissions Inventory, AEA Technology,National Environmental Technology Centre. Report AEAT-1746.
Stedman J R, Anderson H R, Atkinson, W A and Maynard R L. (1997). Emergency Hospitaladmissions for respiratory disorders attributable to summertime ozone episodes in Great Britain.Thorax 52 958-963.
Stedman JR, Bush T and King K (1998). An empirical model for estimating roadside nitrogendioxide concentrations in the UK. AEA Technology Environment, National EnvironmentalTechnology Centre. Report AEAT-4291.
Stedman , JR, Linehan E, Espenhahn S, Conlan B, Bush T and Davies T (1998). PredictingPM10 concentrations in the UK. AEA Technology Environment, National EnvironmentalTechnology Centre. Report AEAT-4630.

AEAT - XXXX Issue 1
AEA TechnologyNETCEN
Appendices
CONTENTS
Appendix 1Appendix 2Appendix 3

AEAT - XXXX Issue 1
AEA TechnologyNETCEN
Appendix 1Title
CONTENTS

AEAT - XXXX Issue 1
AEA TechnologyNETCEN
Appendix 2Title
CONTENTS

AEAT - XXXX Issue 1
AEA TechnologyNETCEN
Appendix 3Title
CONTENTS

AEAT - XXXX Issue 1
AEA TechnologyNETCEN
Section 1Title of section
CONTENTS
2.1 INTRODUCTION 12.2 PROJECT MANAGEMENT 22.3 PROJECT PLANNING 8
2.3.1 Elements of control 192.3.2 Project injection 252.3.3 Developing the project plan 36
2.4 Operation and monitoring 452.4.1 Risk management 48
2.4.1.1 Control of risks 492.4.1.2 Risks 56
2.5 Finalisation and handover 622.6 Conclusion 71
This is an example of how a section page for reportsthat are split into sections using dividers shouldlook