Embed Size (px)
Citation preview
Quantifying Benefits of the New York Declaration on Forests
September 23, 2014
Michael Wolosin, Ph.D. Managing Director, Research and Policy [email protected]

2
Quantifying Benefits of the New York Declaration on Forests This paper analyzes the main measurable outputs of the New York Declaration on Forests, by quantifying the total emissions reduced or avoided, and total area of forest conserved or restored, that would be achieved by the combined measures included in the Declaration. It attempts to frame the analytical question appropriately given the form of the Declaration; simplify the analysis to allow quantification of outputs without sacrificing accuracy; gather available high-quality estimates; synthesize available estimates into a consistent set of summary ranges for the outputs; and address the quality of the outputs by assessing strengths and weaknesses of data sources and analyzing sensitivity to key assumptions. I. Defining the Question a. Geographic Scope In order to estimate the benefits of the Declaration, it is critical to determine the geographic scope of the analysis: should it be broad at a global scale, narrow and limited only to areas under direct control of the Declaration’s signers or somewhere in between? There are several reasons to pursue the analysis at the global scale, including both broad interpretive and technical considerations. The Declaration is a commitment among signers to “do [their] part to achieve” a set of outcomes “in partnership” that are global in scope. The signers include nations, companies, company associations, non-governmental organizations, indigenous peoples associations, and others, with “varying mandates, capabilities, and circumstances.” This group of signers will collectively have influence over forest and land use globally through direct governance, purchasing, foreign policy and foreign assistance, consensus-driven international conventions, and many other levers; and they are committing to specific goals and action items that will slow, halt, and reverse global forest loss. As such, the ambitious Declaration goals will be pursued and will impact global forests beyond those within the boundaries or direct control of signatories. From the technical standpoint, an analysis of the outputs at a more limited scope would need to:
• Address uncertainty in the list of signers. The Declaration is a living document, with active recruitment of signatories intended to continue through the Paris COP. It is not technically feasible to analyze all potential signers from the start,
3
nor is it feasible or helpful to adjust and update the analysis each time the signatory group expands.
• Explicitly assess the scope of influence of signers. Country signatories could be judged to have control (or not) only within their borders, on deforestation commodities purchased directly by the government, commodities that enter their borders, etc. It is unclear how to assess scope if a signer provides finance to non-signers. There are similar uncertainties in defining the scope of company signers: whether to count only land areas under direct operational control of companies, the land areas that produce all the goods purchased or traded by signers, the area under control by all companies that are trading partners of signers, etc. It is neither technically nor politically feasible to draw these boundaries in a consistent way.
• Explicitly determine how to treat goals that will be delivered by non-signers. Some of the goals within the Declaration reflect existing agreements on deforestation that countries not covered by this effort have signed on to. For example, the Bonn Challenge of restoring 150 million hectares by 2020 is restated in this Declaration. As a result, countries signed up to the Bonn Challenge who are not signing the Declaration will help deliver some of this restoration area.
• Access data that is not publicly available – or not available at all. Completely transparent and traceable supply chains are not yet a reality, and companies treat their purchasing data as proprietary. Any attempt to limit the analysis of commodity goals to only those companies signing the Declaration would require estimates of how much they purchase of each relevant commodity, and from where. It is not feasible to require detailed purchasing data from all company signatories.
With these considerations, it seems clear that a global scope is both the right approach in terms of intent, and the more feasible approach analytically. b. Analytical Simplification There are ten goals listed in the New York Declaration. These are:
1. At least halve the rate of loss of natural forests globally by 2020 and strive to end natural forest loss by 2030.
2. Support and help meet the private-sector goal of eliminating deforestation from the production of agricultural commodities such as palm oil, soy, paper and beef products by no later than 2020, recognizing that many companies have even more ambitious targets.
3. Significantly reduce deforestation derived from other economic sectors by 2020.
4
4. Support alternatives to deforestation driven by basic needs (such as subsistence farming and reliance on fuel wood for energy) in ways that alleviate poverty and promote sustainable and equitable development.
5. Restore 150 million hectares of degraded landscapes and forestlands by 2020 and significantly increase the rate of global restoration thereafter, which would restore at least an additional 200 million hectares by 2030.
6. Include ambitious, quantitative forest conservation and restoration targets for 2030 in the post-2015 global development framework, as part of new international sustainable development goals.
7. Agree in 2015 to reduce emissions from deforestation and forest degradation as part of a post-2020 global climate agreement, in accordance with internationally agreed rules and consistent with the goal of not exceeding 2°C warming.
8. Provide support for the development and implementation of strategies to reduce forest emissions.
9. Reward countries and jurisdictions that, by taking action, reduce forest emissions—particularly through public policies to scale-up payments for verified emission reductions and private-sector sourcing of commodities.
10. Strengthen forest governance, transparency and the rule of law, while also empowering communities and recognizing the rights of indigenous peoples, especially those pertaining to their lands and resources.
The first and fifth goals dominate this analysis. These goals are hereafter referred to as the forest loss goal (goal #1), and the restoration goal (goal #5). Other goals in the Declaration can generally be considered as subsets or subordinate to these two goals for the purposes of this analysis for the following reasons. Goal #2, “Support and help meet the private-sector goal of eliminating deforestation from … agricultural commodities … no later than 2020,” can be viewed primarily as a subset of the forest loss goal (goal #1) with two caveats. First, this goal suggests eliminating all deforestation for agricultural commodities rather than just loss of “natural forests.” The conversion of existing plantation forests (as opposed to natural forests) to non-forest agricultural production, which would be eliminated by 2020 under the commodity goal (goal #2) but is not explicitly addressed in the forest loss goal (goal #1), is a minor consideration.1 Ignoring this consideration may slightly underestimate the quantitative benefits achieved by the Declaration. Second, the commodity goal (goal #2) may suggest a more rapid decrease than that put forth by the forest loss goal (goal #1). Two recent papers have estimated the proportion of commercial agriculture-driven forest loss by area to be around 50 percent2 or as high as 71 percent.3 Another study estimates net forest loss emissions from conversion to pasture or croplands, and draining and burning of peatlands together at around 60 percent,4 which includes some non-commercial agriculture and is influenced by the high emissions of peatland
1 The FAO FRA 2010 estimates that only 7% of global forest area is planted forests. Forest plantations are rarely cleared for conversion to non-forest agriculture. 2 Hosonuma et al 2012. 3 Forest Trends 2014. 4 Houghton 2012.
5
burning. To be conservative (i.e., to err in the direction of lower estimates), for our core analysis, we assume that the commodity objective does not imply reducing forest loss beyond the 2020 goal of halving forest loss. Goal #3, “Significantly reduce deforestation derived from other economic sectors by 2020” could be interpreted as seeking to address deforestation from activities such as mining, infrastructure, and urban expansion, which together make up about 15 percent of forest area clearing.5 It is debatable whether this goal is intended to include clearing for local or subsistence agriculture, which is clearly economic and is about 30 percent of forest loss, or the various economic drivers of forest degradation and clearing that may not immediately lead to conversion of forests to other land uses (such as livestock grazing in forests or fuel wood gathering), or those activities that involve forest clearing followed by natural forest regeneration (such as timber and logging operations). Considering the uncertainty around which economic activities are included in this goal, and given that the goal is stated without a numeric target, it is difficult to quantify the outcome of achieving this objective. The “agricultural commodities” goal (goal #2) and the “other economic sectors” goal (goal #3) together may suggest a more rapid decrease in deforestation by 2020 than that proposed by the forest loss goal (goal #1). We address the potential for more rapid reductions in Section III, which includes a sensitivity analysis that accelerates forest protection to achieve a 75 percent reduction by 2020. Goal #6, which provides a commitment to “Include ambitious, quantitative forest conservation and restoration targets for 2030 in the post-2015 global development framework…” should not restrain the analysis. The forest targets that emerge with international consensus from the SDG process are unlikely to be more ambitious than the forest loss goal and the restoration goal in the New York Declaration (goals #1 and #5), which serves as a statement of ambition from global leaders on these issues. All the other commitments (goals #4 and #7-10) in the Declaration are essentially procedural or co-benefit targets, and will not in and of themselves achieve additional quantitative benefits in terms of emissions or land area. We therefore collapse the analysis to just the forest loss goal and the restoration goal (goals #1 and #5). c. Conclusion: The Analytical Questions Together, the above considerations lead to a well-defined, limited, and analytically feasible set of estimates. These include six distinct numbers: the tons CO2 emissions removed by restoring 150 million hectares of deforested and degraded lands by 2020; 5 Hosonuma et al 2012.

6
the tons CO2 emissions removed by restoring another 200 million hectares of deforested and degraded lands by 2030; the tons CO2 emissions avoided and the hectares of forest conserved by halving the rate of natural forest loss globally by 2020; and the tons CO2 emissions avoided and the hectares of forest conserved by halting forest loss globally by 2030. The remainder of this brief presents an analysis of these numbers. The results of the analysis will give estimates of the Declaration’s outputs in the form of: “If the goals of the Declaration were met, they would together remove or avoid CO2 emissions of [X-Y] gigatons and conserve or restore [X-Y] million hectares of forest area.”
II. Quantitative Analysis a. Forest Loss Goal (goal #1) The forest loss goal to “At least halve the rate of loss of natural forests globally by 2020 and strive to end natural forest loss by 2030,” embeds the forest component of the 5th Aichi biodiversity target for 20206 and extends and strengthens the target to eliminate forest loss by 2030. Estimation of both the forest area conserved and the tons CO2 emissions avoided are required. Key factors in this analysis include:
• How the term “natural forest” is interpreted vis-à-vis existing data sources on forest area and forest loss.
• Inclusion or exclusion of soil and peat carbon in addition to above-ground biomass in estimates of CO2 emissions from clearing.
• The approach to a baseline or business-as-usual scenario, and which period is used if an historical baseline is preferred.
• The assumed timing of deforestation reductions across the time period.
• Tons of CO2 emissions avoided per hectare per year for various land use transitions and forest types.
• Geographic scope of available estimates (global versus tropical).
• The treatment of forest clearing followed by natural regeneration.
• The treatment of forest carbon loss in standing forests (degradation).
• The assumption that forests will maintain their capacity to grow and sequester carbon at historical rates through 2030 even in a changing climate.
6 “By 2020, the rate of loss of all natural habitats, including forests, is at least halved and where feasible brought close to zero, and degradation and fragmentation is significantly reduced.”
7
There is an extensive and rapidly evolving literature available with estimates of historical forest area loss and of emissions from such loss. We limit the scope of this analysis to compiling estimates of historical forest area and forest carbon loss that most closely match the forest loss goal’s scope. There is a preference for studies with more recent baselines, global geographic scope and globally consistent methodologies, estimates of both area and emissions, and inclusion of soil and peat emissions. When using studies that take a land use perspective, we omit forest degradation, which from a land-use perspective is not generally considered to be a “loss of forest”. However, we do include in the analysis data that take the land cover approach rather than the land use approach, in which case forest degradation and deforestation are more difficult to distinguish. We omit studies that include only net forest area loss or emissions, as they mask the amount of forest loss by cancelling it out with regrowth elsewhere.7 We briefly explain how well known sources differ, and why they may be appropriate or inappropriate estimators for our purposes. For the primary analyses, we use an historical baseline – assuming that annual forest loss area and emissions through 2030 would match recent historical losses.8 We also assume that forest loss reduction is achieved at a constant rate over the analysis period – i.e., that if 10 million hectares of forest loss per year is the historical rate, and we halve that rate to 5 million hectares by 2020, the area of forest loss decreases linearly over the period 2011 to 2020. For our first analysis, we use low and high estimates for both global gross forest area loss and global average carbon biomass per hectare from the FAO from the most recently available global analyses and time periods. At the lower end, we use the gross forest area loss from the survey method estimated at 13 million hectare per year average from 2000-2009 (FAO 2010), while at the higher end we use the estimate of 13.5 million hectare per year average from 2000-2004 from the remote sensing survey (FAO & JRC 2012). For the lower end estimate of carbon, we apply the global average of carbon stock in biomass in 2009 (71.6 tons C/ha), while at the higher end we add in another 17.8 tons C/ha of deadwood carbon. We leave out soil carbon for this analysis, which averages another 72.3 tons C/ha. While some soil carbon is lost when forests on mineral soils are cleared – about 25 percent by some estimates – the losses are less 7 We do not include IPCC estimates in the core analysis, as the IPCC focused its historical analysis on net land use and land use change emissions and did “… not assess individual gross fluxes that sum up to make the net land use change CO
2 emission” (WGI Chapter 6.3.2.2 and Table 6.2). However, we do
compare our estimates of forest area change and emissions through 2030 to the IPCC scenarios (see below in Section III). 8 The IPCC WGIII report admits a large range of uncertainty in both the baseline AFOLU emissions and in the base case projections. This is because dramatically different forest and land use patterns are possible, both to meet particular transformation pathways and even in the baseline scenarios (11.9.2). For example, there are tradeoffs between using land for bioenergy to displace fossil fuels, versus maintaining and/or expanding forests as carbon sinks. However, the ensemble average for the baseline models (Section 6.3.1.5) does suggest a decline in AFOLU emissions of about 25% from 2010 to 2030 (Figure 6.5), so we include in the Section III a sensitivity analysis with a similar baseline applied to deforestation emissions.
8
rapid and less well studied; we assume that the underestimation error in omitting soil carbon is somewhat offset by the overestimation error in assuming that all biomass and deadwood carbon is emitted rapidly. In 2012, two research groups published estimates of emissions from tropical deforestation that seemed to differ substantially, based on very different methodologies and data sources. Surprisingly, a careful assessment later in the year9 found a “consensus within the scientific community that emissions from tropical deforestation between 2000 and 2005 were 3.0 ± 1.1 Gt CO2 yr-1.” This summary estimate and uncertainty bounds exclude emissions from mineral soils after forest loss and from peat draining and fire, which are estimated at an additional 0.3 Gt and 1.0 Gt CO2 yr-1, respectively. Forest degradation – the net change in carbon stocks due to shifting cultivation and fuelwood harvest – is estimated by Baccini et al. to be another gigaton or so, but we omit degradation as discussed above. While these studies are incomplete geographically – including only the tropics – most gross forest loss over the period studied took place in the tropics. Other strengths also make these estimates a useful input to our analysis. Both source papers also estimate average forest area losses over the period 2000—2005 at about 8.5 million hectares (Winrock) and 9.7 million hectares (WHRC). For this second analysis, we use as a lower bound the Winrock area estimate, along with a low-end emissions estimate of 3.2 Gt CO2 yr-1, which is equal to the lower-bound emissions from forests (3.0 – 1.1 Gt) plus the estimates of peat and soil emissions (0.3 + 1.0 Gt). At the higher end, we use the WHRC area and the higher bound estimate of emissions including all three sources, 5.4 Gt CO2 yr-1. As the third source, we use estimates from the most comprehensive, consistent, and high-resolution global analysis of forest cover available to date. Published in 2013, the Hansen et al. dataset has quickly become the go-to source for deforestation data. For the purposes of this paper, there is a critical difference between this source and others: it takes a land cover perspective rather than a land use perspective. In other words, the Hansen et al. data include as “forest loss” any clearing of forests – including harvesting of forest plantations, insect infestations, fires, etc. – even if the area will be left to regrow. In other words, the data include forest “churn” on both the deforestation and reforestation side, so should be interpreted as maxima. This source also, by itself, does not include emissions values. Regardless, we include two global estimates from this source. At the low end, we use the estimate of global gross forest loss from 2000-2012 minus the area of land that experiences both loss and subsequent regrowth by 2012; at the higher end, we use global gross forest loss from 2000-2012 without adjusting for regrowth. For emissions we multiply both area estimates by the biomass per hectare estimate from FRA (2010). 9 Winrock (Harris et al 2012) and Woods Hole (Baccini et al 2012) were synthesized in Harris et al 2012b.
9
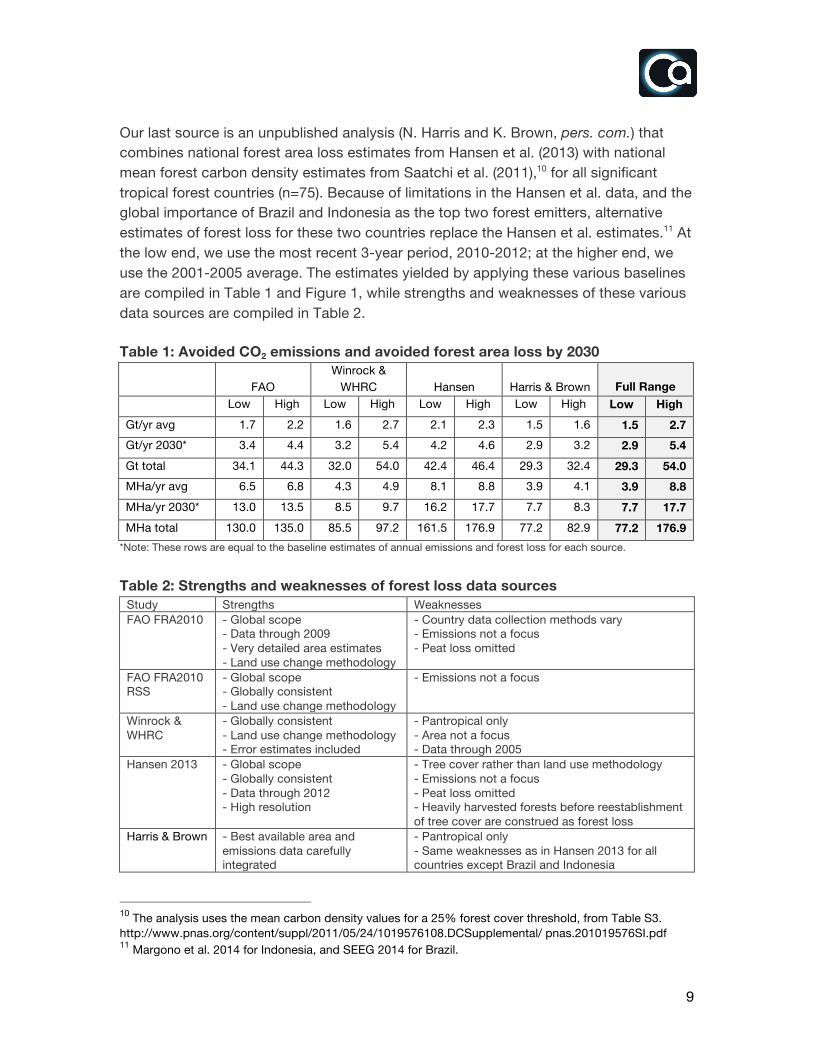
Our last source is an unpublished analysis (N. Harris and K. Brown, pers. com.) that combines national forest area loss estimates from Hansen et al. (2013) with national mean forest carbon density estimates from Saatchi et al. (2011),10 for all significant tropical forest countries (n=75). Because of limitations in the Hansen et al. data, and the global importance of Brazil and Indonesia as the top two forest emitters, alternative estimates of forest loss for these two countries replace the Hansen et al. estimates.11 At the low end, we use the most recent 3-year period, 2010-2012; at the higher end, we use the 2001-2005 average. The estimates yielded by applying these various baselines are compiled in Table 1 and Figure 1, while strengths and weaknesses of these various data sources are compiled in Table 2. Table 1: Avoided CO2 emissions and avoided forest area loss by 2030
FAO
Winrock & WHRC Hansen Harris & Brown Full Range
Low High Low High Low High Low High Low High Gt/yr avg 1.7 2.2 1.6 2.7 2.1 2.3 1.5 1.6 1.5 2.7 Gt/yr 2030* 3.4 4.4 3.2 5.4 4.2 4.6 2.9 3.2 2.9 5.4 Gt total 34.1 44.3 32.0 54.0 42.4 46.4 29.3 32.4 29.3 54.0 MHa/yr avg 6.5 6.8 4.3 4.9 8.1 8.8 3.9 4.1 3.9 8.8 MHa/yr 2030* 13.0 13.5 8.5 9.7 16.2 17.7 7.7 8.3 7.7 17.7 MHa total 130.0 135.0 85.5 97.2 161.5 176.9 77.2 82.9 77.2 176.9
*Note: These rows are equal to the baseline estimates of annual emissions and forest loss for each source.
Table 2: Strengths and weaknesses of forest loss data sources
Study Strengths Weaknesses FAO FRA2010 - Global scope
- Data through 2009 - Very detailed area estimates - Land use change methodology
- Country data collection methods vary - Emissions not a focus - Peat loss omitted
FAO FRA2010 RSS
- Global scope - Globally consistent - Land use change methodology
- Emissions not a focus
Winrock & WHRC
- Globally consistent - Land use change methodology - Error estimates included
- Pantropical only - Area not a focus - Data through 2005
Hansen 2013 - Global scope - Globally consistent - Data through 2012 - High resolution
- Tree cover rather than land use methodology - Emissions not a focus - Peat loss omitted - Heavily harvested forests before reestablishment of tree cover are construed as forest loss
Harris & Brown - Best available area and emissions data carefully integrated
- Pantropical only - Same weaknesses as in Hansen 2013 for all countries except Brazil and Indonesia
10 The analysis uses the mean carbon density values for a 25% forest cover threshold, from Table S3. http://www.pnas.org/content/suppl/2011/05/24/1019576108.DCSupplemental/ pnas.201019576SI.pdf 11 Margono et al. 2014 for Indonesia, and SEEG 2014 for Brazil.

10
b. Restoration Goal (goal #5) The restoration goal embeds the Bonn Challenge target to “restore 150 million hectares of deforested and degraded lands by 2020,” and increases the target in the following decade, as it will “strive to restore at least another 200 million hectares by 2030.” For a sense of scale, 15 to 20 million hectares of restoration per year would seek to double or more the historical rate of afforestation and natural forest expansion, estimated to be 7-8 million hectares per year globally.12 With these targets stated in hectares, the analysis need only assess tons CO2 removed for a given area of global restoration. Key factors in such an analysis include:
• Distribution of restoration actions across geographic regions, current land statuses, and fully restored land statuses.
• Tons of additional CO2 removed from the atmosphere per hectare per year by a restored landscape compared to the unrestored state.
• Timing of restoration actions over the goal period. Additional factors that could influence the outcomes include:
• Failure rate of restoration actions. • Use or removals of post-restoration lands, for example if degraded lands are
restored to short-rotation plantation forests. The most complex of these factors are the first two – as both the carbon storage potential of degraded lands and that of restored lands vary substantially. For example, the average carbon stock of the mostly dry forests of Mozambique in East Africa is 43 tons of carbon (C) per hectare, while that of the mostly wet forests in Cote d’Ivoire is four times higher – 177 tons C per hectare.13 If rewetting of peat lands is included as a target type of restoration, the difference in carbon stock between degraded and restored lands can jump by an order of magnitude. Forest restoration failure rates can be very high – especially if pursued on inappropriate land or with the wrong mix of species.14 For this analysis, we assume that restoration targets are met with successful projects – that appropriate areas and species are selected, that restoration attempts are inflated by reasonable failure rates, and/or that failed plantings are replaced within the time frame, leading to 350 million hectares of successfully restored area by 2030. 12 FAO (2010) estimates gross forest loss of 13m ha/yr for 2000-2010 and 5.2m ha/yr of net forest area loss, suggesting 7.8m ha/yr average forest gain. FAO & JRC (2012) estimates 7.3m ha/yr of forest gain. 13 FAO (2010). Global Tables, Table 11. 14 For example, one study of efforts to reduce desertification in China through afforestation cites an 85% failure rate (Cao et al. 2011), while a study of efforts in Brazil (Wuethrich, 2007) found that non-diverse tree plantings in publicly funded reforested areas in Brazil yielded only 2% successful establishment.

11
A very rough first cut analysis makes assumptions about the timing and averages the first and second factors above by applying a simple global average CO2 uptake of restored land per hectare per year. A reasonable range from the literature is 6-9 tons CO2 per hectare per year.15 If the distribution of restoration action is even from 2011-2020 and 2021 through 2030,16 then sequestration reaches 2.1-3.2 gigatons (Gt) CO2 per year in 2030 when the full target is reached, averaging 1-1.5 Gt CO2 sequestered per year over the whole period, for a total over the period of 21-31 Gt CO2 (see Table 3). Two additional sources provide more sophisticated assessments of the greenhouse gas sequestrations that would likely be achieved by restoration targets. The first (Verdone et al., in review) estimates sequestration achieved by meeting the Bonn Challenge objectives, accounting for likely distribution of restoration across biome (temperate, humid tropics, and dry tropics) and across restoration type (planted forests, naturally regenerated forests, and agroforestry). The results suggest that restoring 150 million hectares through 2020 would sequester about 53 Gt CO2eq over 50 years, or about 1 Gt annually. To apply the Verdone et al. estimates to a different time period (20 years instead of 50 years), and to an expanded target (150 million hectares by 2020 plus another 200 million hectares by 2030), we assume that the 200 million hectares of additional restoration through 2030 would be achieved with the same distribution across biomes and restoration methods as the first 150 million hectares, and take two different approaches to recalculation. First, we account for an equally distributed amount of restored area over the period (e.g., assuming that 15 million hectares is restored per year from 2010-2020 in Verdone’s model) but treat the amount of sequestered carbon per hectare per year as constant over the full period modeled for any given hectare restored. This analysis yields estimates of 1.3 Gt CO2 sequestered per year on average, reaching 2.8 Gt per year in 2030, and totaling 25.8 Gt over the period 2011-2030. This is likely an overestimate as carbon sequestration rates are not constant from the time of restoration, but rather increase over a period of time and then flatten out, in an approximately logistic shape. 15 Estimates in this range were used, for example, in Houghton (2012) and Houghton (2013) (RA Houghton, 2014, pers. com.). Watson et al (2000) cite ranges for afforestation and reforestation that could indicate higher values (1.5-4.4 tCO
2/ha/yr for the boreal zone, 5.5-16.5 for temperate, and 15-29 for tropical). An
average of these estimates weighted by forest biome area is 12.66 tCO2/ha, still over the 6-9 tCO
2/ha/yr
range we use. However, these estimates are multi-decade averages rather than averages for the first decade or two after restoration. If adjusted to account for a 10-year linear ramp-up in sequestration per hectare, a hectare restored in the first year of a 20-year period will average 9.8 tCO
2/yr, and one restored in
the tenth year will average 7.5 tCO2/yr. These averages would need to be further adjusted downward, as
they exclude lower-carbon restoration such as agroforestry, which is modeled by Verdone et al as 1/3 of the expected total. 16 15m ha restored per year from 2011 through 2020 (for a total of 150m ha), and 20m ha per year through 2030 (another 200m ha).
12
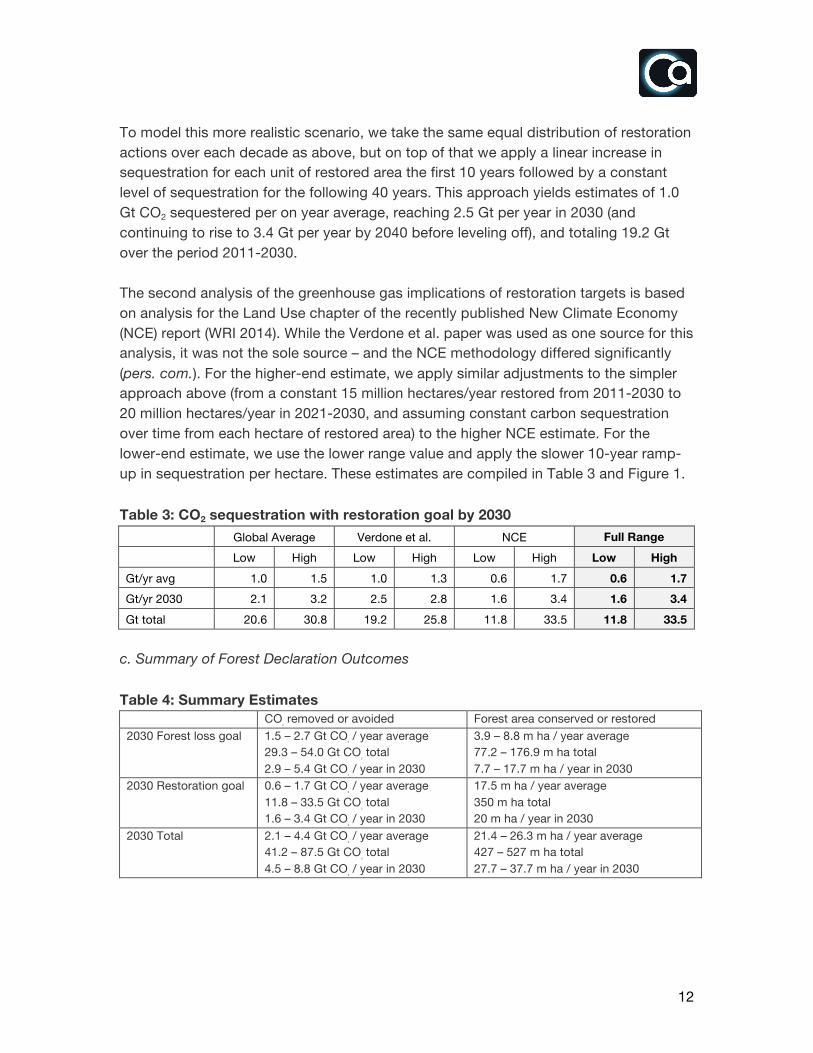
To model this more realistic scenario, we take the same equal distribution of restoration actions over each decade as above, but on top of that we apply a linear increase in sequestration for each unit of restored area the first 10 years followed by a constant level of sequestration for the following 40 years. This approach yields estimates of 1.0 Gt CO2 sequestered per on year average, reaching 2.5 Gt per year in 2030 (and continuing to rise to 3.4 Gt per year by 2040 before leveling off), and totaling 19.2 Gt over the period 2011-2030. The second analysis of the greenhouse gas implications of restoration targets is based on analysis for the Land Use chapter of the recently published New Climate Economy (NCE) report (WRI 2014). While the Verdone et al. paper was used as one source for this analysis, it was not the sole source – and the NCE methodology differed significantly (pers. com.). For the higher-end estimate, we apply similar adjustments to the simpler approach above (from a constant 15 million hectares/year restored from 2011-2030 to 20 million hectares/year in 2021-2030, and assuming constant carbon sequestration over time from each hectare of restored area) to the higher NCE estimate. For the lower-end estimate, we use the lower range value and apply the slower 10-year ramp-up in sequestration per hectare. These estimates are compiled in Table 3 and Figure 1. Table 3: CO2 sequestration with restoration goal by 2030
Global Average Verdone et al. NCE Full Range
Low High Low High Low High Low High
Gt/yr avg 1.0 1.5 1.0 1.3 0.6 1.7 0.6 1.7 Gt/yr 2030 2.1 3.2 2.5 2.8 1.6 3.4 1.6 3.4 Gt total 20.6 30.8 19.2 25.8 11.8 33.5 11.8 33.5
c. Summary of Forest Declaration Outcomes Table 4: Summary Estimates
1. 2. CO2 removed or avoided 3. Forest area conserved or restored
4. 2030 Forest loss goal 5. 1.5 – 2.7 Gt CO2 / year average
6. 29.3 – 54.0 Gt CO2 total
7. 2.9 – 5.4 Gt CO2 / year in 2030
8. 3.9 – 8.8 m ha / year average 9. 77.2 – 176.9 m ha total 10. 7.7 – 17.7 m ha / year in 2030
11. 2030 Restoration goal 12. 0.6 – 1.7 Gt CO2 / year average
13. 11.8 – 33.5 Gt CO2 total
14. 1.6 – 3.4 Gt CO2 / year in 2030
15. 17.5 m ha / year average 16. 350 m ha total 17. 20 m ha / year in 2030
18. 2030 Total 19. 2.1 – 4.4 Gt CO2 / year average
20. 41.2 – 87.5 Gt CO2 total
21. 4.5 – 8.8 Gt CO2 / year in 2030
22. 21.4 – 26.3 m ha / year average 23. 427 – 527 m ha total 24. 27.7 – 37.7 m ha / year in 2030

13
d. Example Summary Statements
• “Achieving the outcomes of the New York Declaration on Forests would conserve or restore more than 425 million hectares of forest total by 2030.”
• “If achieved, the commitments in the New York Declaration on Forests together are estimated to remove or avoid at least 40 gigatons of CO2 emissions by 2030.”
• “Together, the outcomes of the New York Declaration on Forests if achieved are estimated to reduce CO2 in the atmosphere by 4.5 to 8.8 billion tons per year by 2030.”
• “If the goals of the New York Declaration on Forests were achieved, they could together remove or avoid CO2 emissions of 2.1 to 4.4 gigatons per year and conserve or restore 21 to 26 million hectares of forest area per year, on average through 2030.”
Figure 1: Emissions impact of the New York Declaration on Forests through 2030
0"
20"
40"
60"
80"
100"
120"
140"
160"
180"
200"
0"
1"
2"
3"
4"
5"
6"
7"
8"
9"
10"
FAO"
Winrock"&"
"WHRC"
Hansen"
Harris"&""
Brown"
Full""
Range"
Global""
Average"
Verdone""
et"al."
NCE"
Full""
Range"
Total"
Gigatons"CO
2"(total)"
Gigatons"CO
2"(per"year)"
Gt/yr"average" Gt/yr"2030"
Restora(on*Goal*Forest*Loss*Goal* Total*
(leQ"axis)" (leQ"axis)" (right"axis)"
Gt"total"

14
III. Quality Assessment Impact estimates using different methodologies and different data sources converge on similar ranges, but the ranges are wide. Ranges or minima should be used, as global estimates of forest loss and emissions from forest loss have significant error bounds. The estimates also require making assumptions that can drive additional variance across sources, as discussed above. However, none of these sources of variance prevent estimation of reliable ranges and minima, and the analysis above is in line with other recent syntheses of the emissions potential from the forest and land use sectors. a. Comparison With Other Syntheses For example, a recent paper in Carbon Management (Houghton 2013) estimated annual CO2 sequestration potential from the forest sector alone at 11 – 18 Gt CO2/year. This estimate included 500 million hectares of reforestation to achieve 3.7 Gt/yr; halting both deforestation and forest degradation to achieve another 5 Gt/yr; and allowing secondary forests to fully regrow to achieve another 3.7 to 10 Gt/yr. The first two added together are similar to our high-end total (8.7 vs. 8.8 Gt), although our area of restoration is lower by 40 percent (about 1 Gt difference), excludes forest degradation (another 1 Gt difference) and includes peat emissions, which Houghton excludes from this estimate (another 1 Gt, in the opposite direction). Our estimates also lie within the expected mitigation ranges in the IPCC AR5 WGIII report. For example, the 2010-2030 cumulative global land-related emissions change in the ensemble of transformation pathways, versus the base scenario, ranged from -20 to 281 Gt CO2 for the 550ppm pathways, and from -20 to 287 Gt CO2 for the 450ppm pathways (WGIII, Table 11.10). While these totals include mitigation from bioenergy and agriculture as well as forests, our estimated range of cumulative mitigation from forests over the same period (41 to 87.5 Gt CO2) lies comfortably within the IPCC range, with our high-end estimate from forests representing just 30 percent of the IPCC maximum from all AFOLU. Forests are currently closer to 50 percent of AFOLU emissions. Another source of comparison between our estimates and the IPCC report comes from the land cover change estimates for the transformation pathways. The three core models used by the IPCC vary wildly in their forecast of land cover change from 2005-2030 (WGIII, Figure 11.19). One of the models (GCAM) suggests that, for a 450ppm scenario, there would be 800-850 million hectares of additional forest protection and expansion compared to the baseline. This is well over our high-end estimate of 527 million hectares. The two other models allow much greater forest loss than the goals of New York Declaration would allow, suggesting only slight forest gains (IMAGE), or even significant

15
forest losses (REMIND-MAgPIE). Finally, there are estimates of economically viable abatement potential from the forest sector, including reduced deforestation, forest management, afforestation, and agro‐forestry (WGIII Table 11.8). They are estimated to contribute 0.11 – 9.5 Gt CO2/yr of abatement in 2030 at carbon prices up to 50 USD/tCO2eq, and 0.2 – 13.8 Gt CO2/yr at prices up to 100 USD/t CO2eq. Our emissions abatement estimates for 2030 from the New York Declaration goals range from 4.5 – 8.8 Gt CO2/yr, which fall well within the economic potential mitigation. b. Forest Loss Sensitivity Analyses To ensure that our estimates are not overly impacted by several key assumptions, we undertake a number of sensitivity analyses. These analyses start with the same suite of historical estimates as in Table 1, but apply them to the New York Declaration in different ways as follows:
• Increasing 2020 forest loss target to 75 percent: If we assume that forest loss from commercial agriculture is around 60 percent, and loss from other commercial activities such as mining, infrastructure, and urban expansion is another 15 percent, then the goals in the Forest Declaration may suggest a more rapid decline in forest loss by 2020 than the 50 percent suggested in the forest goal. We estimate emissions abatement and forest area impacts if forest loss is cut by 75 percent by 2020 rather than by 50 percent, with all other things being equal (Table 5 and Figure 2, SA1).
• Assuming a declining forest loss baseline: The set of base case models in IPCC WG3 Chapter 6 suggest that net forest emissions may fall through 2030 by about 25 percent with no intervention. We thus assess the impact on our estimates of adjusting from a strictly historical baseline, to a baseline that declines by 12.5 percent by 2020 and by 25 percent by 2030 (Table 5 and Figure 2, SA2).
• Achieving less than targeted in 2030: We assess the impacts of assuming only a 90 percent rather than a 100 percent cut in deforestation by 2030 to acknowledge that the language of the goal includes some wiggle room with the word “strive” (Table 5 and Figure 2, SA3).
• Earlier and later start dates: We also assess the impacts of adjusting the time period for achieving the 2020 goal in two ways. First, we change the first year of action from 2011 to 2006, recognizing that Brazil’s achievement reducing deforestation from 2004 to 2010 is not captured by some of the baseline estimates (Table 5 and Figure 2, SA4). Second, and lastly, we delay the first year of deforestation reduction to 2016 rather than 2011 (Table 5 and Figure 2, SA5).

16
Table 5: Forest Loss Sensitivity Analyses
SA1: 75% cut
in 2020 SA2: Declining
baseline SA3: 90% cut
in 2030 SA4: 2006 start SA5: 2016 start Low High Low High Low High Low High Low High Gt/yr avg 1.8 3.4 1.1 2.0 1.4 2.6 1.3 2.4 1.7 3.2 Gt/yr 2030* 2.9 5.4 2.2 4.1 2.6 4.9 2.9 5.4 2.9 5.4 Gt total 36.7 67.5 22.0 40.5 27.9 51.3 33.0 60.8 25.7 47.3 MHa/yr avg 4.8 11.1 2.9 6.6 3.7 8.4 3.5 8.0 4.5 10.3 MHa/yr 2030* 7.7 17.7 5.8 13.3 6.9 15.9 7.7 17.7 7.7 17.7 MHa total 96.5 221.2 57.9 132.7 73.3 168.1 86.8 199.0 67.5 154.8
Figure 2: Forest Loss Sensitivity Analyses
The full range of estimates for the sensitivity analyses are compared to the core analysis in Table 6, along with estimates of the combined restoration and forest loss goals that substitute the wider ranges from the sensitivity analyses: Table 6: Summary of Core and Sensitivity Analysis
Forest Loss Goal: Core Analysis
Forest Loss Goal: Sensitivity Analyses Restoration Goal
Summary Estimates: Sensitivity Analyses
Low High Low High Low High Low High
Gt/yr avg 1.5 2.7 1.1 3.4 0.6 1.7 1.7 5.0
Gt/yr 2030 2.9 5.4 2.2 5.4 1.6 3.4 3.8 8.8
Gt total 29.3 54.0 22.0 67.5 11.8 33.5 33.8 101.0
MHa/yr avg 3.9 8.8 2.9 11.1 17.5 20.4 28.6
MHa/yr 2030 7.7 17.7 5.8 17.7 20 25.8 37.7
MHa total 77.2 176.9 57.9 221.2 350 407.9 571.2
0"
20"
40"
60"
80"
100"
120"
140"
0"
1"
2"
3"
4"
5"
6"
7"
SA1:%75%
%%cut%in%2020%
SA2:%Declin
ing%
baselin
e%
SA3:%90%
%%cut%in%2030%
SA4:%2006%%
start%
SA5:%2016%%
start%
Baselin
e%
Gigatons"CO
2"(total)"
Gigatons"CO
2"(pe
r"year)"
Gt/yr"average" Gt/yr"2030"

17
Sources Baccini, A., S. J. Goetz, W. S. Walker, N. T. Laporte, M. Sun, et al. 2012. Estimated carbon dioxide emissions from tropical deforestation improved by carbon-density maps. Nature Climate Change 2:182-185. Cao, S., Chen, L., Shankman, D., Wang, C., Wang, X., & Zhang, H. (2011). Excessive reliance on afforestation in China's arid and semi-arid regions: Lessons in ecological restoration. Earth-Science Reviews, 104(4), 240-245. FAO. 2010. Global Forest Resources Assessment 2010 Main Report. FAO. FAO & JRC. 2012. Global forest land-use change 1990–2005, by E.J. Lindquist et al. FAO Forestry Paper No. 169. Food and Agriculture Organization of the United Nations and European Commission Joint Research Centre. Rome, FAO. Forest Trends. Consumer Goods and Deforestation: An Analysis of the Extent and Nature of Illegality in Forest Conversation for Agriculture and Timber Plantations. September 2014. Hansen, M.C., P.V. Potapov, R. Moore, M. Hancher, S.A. Turubanova, A. Tyukavina, D. Thau, S.V. Stehman, S.J. Goetz, T.R. Loveland, A. Kommareddy, A. Egorov, L. Chini, C.O. Justice, and J.R.G. Townshend. 2013. “High-resolution global maps of 21st-century forest cover change.” Science 342:850-853. Harris, N. and K. Brown. Unpublished analysis. April 2014. Harris, N., S. Brown, S.C. Hagen, A. Baccini, and R.A. Houghton. 2012. Progress toward a consensus on carbon emissions from tropical deforestation. Policy Brief. Winrock International, Woods Hole Research Center & Meridian Institute. Harris, N.L., S. Brown, S. C. Hagen, S. S. Saatchi, S. Petrova, et al. 2012. Baseline map of carbon emissions from deforestation in tropical regions. Science 336:1573-1575. Hosonuma, N., Herold, M., De Sy, V., De Fries, R. S., Brockhaus, M., Verchot, L., ... & Romijn, E. (2012). An assessment of deforestation and forest degradation drivers in developing countries. Environmental Research Letters,7(4), 044009. Houghton, R.A. 2012. Carbon emissions and the drivers of deforestation and forest degradation in the tropics. Current Opinion in Environmental Sustainability 4:597-603. Houghton, R.A. 2013. The emissions of carbon from deforestation and degradation in the tropics: past trends and future potential. Carbon Management 4(5):539-546. IPCC AR5 WGI and WGIII. Watson, R.T., et al. (Eds.). (2000). Land Use, Land Use Change, and Forestry. IPCC. Cambridge University Press, UK. Margono, B. A., Potapov, P. V., Turubanova, S., Stolle, F., & Hansen, M. C. (2014). Primary forest cover loss in Indonesia over 2000-2012. Nature Climate Change. Observatorio do Clima: Sistema de Estimativa de Emissões de Gases de Efeito Estufa (SEEG). 2014. General Table of Emissions 2013. http://seeg.observatoriodoclima.eco.br /index.php/page/30-Tabela-Geral-de-Emiss%25C3%25B5es Saatchi, S.S., N.L. Harris, S. Brown, M. Lefsky, E.T.A. Mitchard, W. Salas, B.R. Zutta, W. Buermann, S.L. Lewis, S. Hagen, S. Petrova, L. White, M. Silman, and A. Morel. 2011. Benchmark map of forest carbon stocks in tropical regions across three continents. Proceedings of the National Academy of Sciences 108:9899-9904. Verdone, M., S. Maginnis, and A. Seidl. Re-examining the role of landscape restoration in REDD+. IUCN publication. In review. World Resources Institute. 2014. Better Growth, Better Climate: The New Climate Economy Report. Wuethrich, B. 2007. Reconstructing Brazil's Atlantic Rainforest. Science, 315(5815), 1070-1072.
Acknowledgements The author thanks the following individuals for their many contributions to this analysis: Doug Boucher, Christopher Delgado, Craig Hanson, Nancy Harris, Richard Houghton, and several additional expert reviewers, along with Maria Belenky, Andreas Dahl-Joergensen, and Claire Langley of Climate Advisers. All errors remain the author's.