Embed Size (px)
Citation preview

Quantifying Damages in Construction Claims
James L McGovern

Types of Claims
• Delay
• Acceleration
• Changed or Differing Site Conditions
• Defective Plans or Specs
• Disruption
• Extra Work
• Deletions of Work

Potential Damages
• Lost Productivity/Added Labor
• Overtime Premiums
• Wage Escalation
• Excess Material & Equipment
• Price Escalation

Potential Damages
• Extended Project Management
• Extended Jobsite Overhead
• Extended Warranty
• Extended/Unabsorbed Overhead
• Interest

Measurement Approaches
– Total Cost
– Modified Total Cost
– Industry Studies
– “Measured Mile”
– Specific Allocation

Total Cost Method
Total Hours Incurred 4,688
Less Hours Estimated (3,600)
Excess Hours 1,088
Average Labor Rate 50$
Total Claimed 54,400$
Modified Total Cost Total Hour Incurred 4,688
Less Hours Estimated (3,600)
Excess Hours 1,088
Less: Change Orders (100)
Hours Under Bid (150)
Less XYZ's Errors (75)
Net Excess Hours 763
Average Labor Rate 50$
Total Claimed 38,150$

Industry Studies Month Hours Inefficiency % 1 Excess Hours
Jan '02 200 5% 10.0
Feb '02 250 5% 12.5
Mar '02 400 10% 40.0
Apr '02 480 20% 96.0
May '02 460 20% 92.0
June '02 500 25% 125.0
Total Excess Hours 375.5
Average Rate 60.00$
Total Claimed 22,530.00$
1 Per XYZ Association Study, Stacking of Trades typically
results in inefficiencies in the range of 5% to 25%

Measured Mile Unimpacted Period
Jan thru March '02
Total Hours Incurred 2,400.00
Feet of Pipe Run 10,000.00
Hours per Foot 0.24
Impacted Period
April through December
Total Hours Incurred 12,000.00
Feet of Pipe Run 30,000.00
Hours Per Foot 0.40
Excess Hours Per Foot During Impacted Period 0.16
# of Impacted Feet Run 30,000.00
Excess Labor Hours 4,800.00
Average Labor Rate 55.00$
264,000.00$

Earned Value Measures of
Productivity
Earned Value analysis is a method for measuring
project performance. It indicates how much of
the budget should have been spent in view of
the amount of work done so far and the baseline
costs for the tasks, assignments, or resources

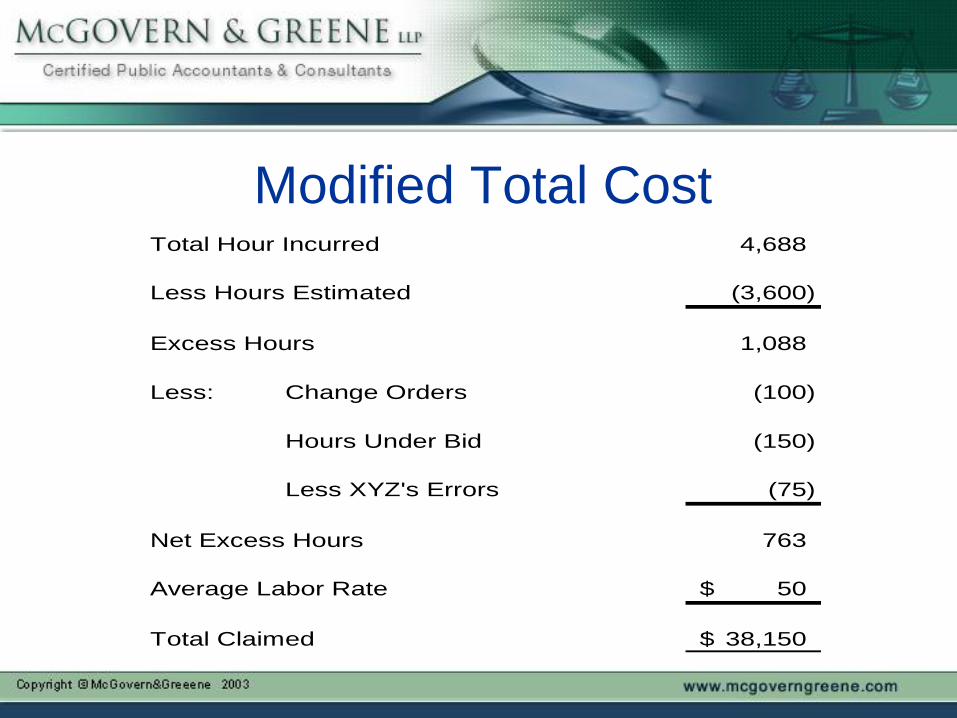
Most Common Measurements: • Schedule Variance is a subjective indicator that does not
reveal the critical path. A positive schedule variance is an indication that work in process is ahead of schedule.
• Cost Variance is an objective indicator stating the value of what was accomplished for the resources expended. A positive cost variance indicates that work was accomplished with less resources than planned

Most Common Measurements: • Cost Variance:
CV = Budget Cost of Work Performed (BCWP)
- Actual Cost of Work Performed (ACWP)
• Cost Performance Index:
CPI = BCWP/ACWP
• Cost Variance Percentage:
CV% = (BCWP – ACWP) / BCWP

Most Common Measurements: • Schedule Variance:
SV = Budget Cost of Work Performed (BCWP)
- Budget Cost of Work Scheduled (BCWS)
• Schedule Performance Index:
SPI = BCWP/BCWS
• Schedule Variance Percentage:
SV% = (BCWP – BCWS) / BCWS
Schedule and Cost Variances
Time
Do
lla
rs (
La
bo
r H
ou
rs)
Schedule Variance
Cost Variance
Sc
he
du
le V
ari
an
ce
In T
ime
Un
its
Today
Performed
Scheduled
Actuals

Earned Value Measurement of Lost
Labor Productivity:
• Unimpacted Period Sample Data:
Budgeted Cost of Work Scheduled = $80,000
Budgeted Cost of Work Performed = $92,000
Actual Cost of Work Performed = $90,000
• Schedule Performance Index:
SPI = $92,000/$80,000 = 1.15 (ahead of schedule)
• Labor Cost Performance Index:
CPI = $92,000/$90,000 = 1.02

Earned Value Measurement of Lost
Labor Productivity:
• Impacted Period Sample Data:
Budgeted Cost of Work Scheduled= $160,000
Budgeted Cost of Work Performed = $150,000
Actual Cost of Work Performed = $180,000
• Schedule Performance Index:
SPI = $150,000/$160,000 = 0.94 (behind schedule)
• Labor Cost Performance Index:
CPI = $150,000/$180,000 = 0.83

Earned Value Measurement of Lost
Labor Productivity:
• Unimpacted versus Impacted Period Comparison:
Unimpacted Cost Performance Index = 1.02
Less
Impacted Cost Performance Index = 0.83
Lost Productivity 0.19
• Lost Labor Productivity Cost:
0.19 x $180,000 = $34,200

Labor Productivity Measurement
Time
Do
lla
rs (
La
bo
r H
ou
rs)
Performed
Scheduled
Actuals
Unimpacted
Period
Impacted Period
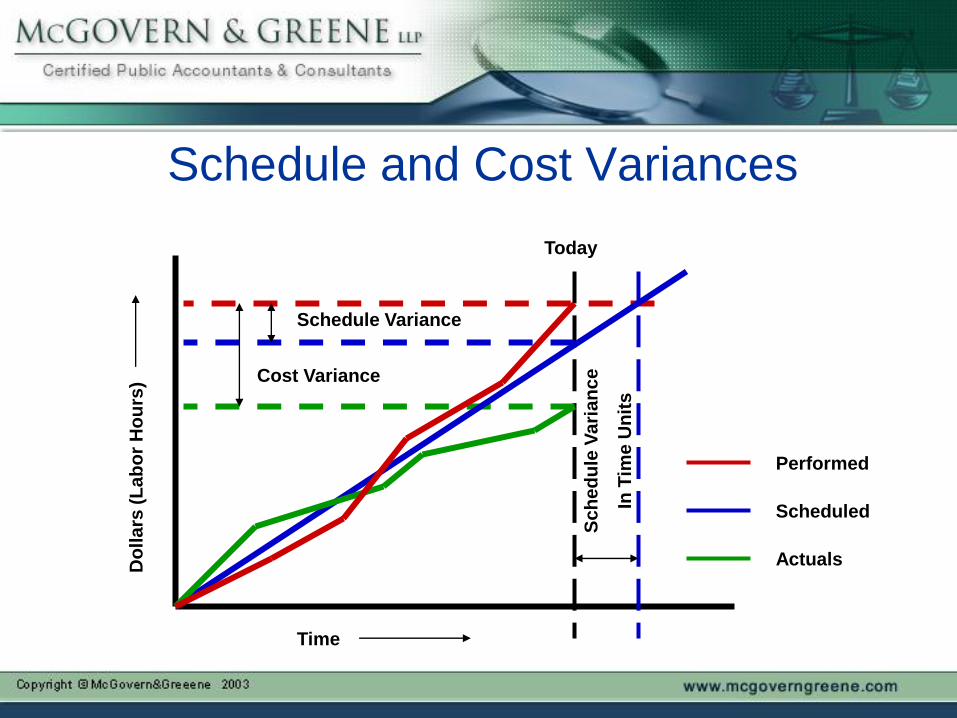
Specific Allocation Issues Requiring System Specialist Time Beyond Scope
Expanded Fuel Oil Wiring 30.00 hrs 1
Incorrectly Installed Return Isolation Dampers 18.00 hrs 2
Open & Close Floor to Install Sensors 516.00 hrs 3
Manually Opening Cooling Control Valves 54.00 hrs 4
Out of Sequence Installation of VAV's & FPB's on Floors 2-6 60.00 hrs 5
Low Voltage at Panels in areas B & C on Floors 3, 4, & 5 30.00 hrs 6
Total Excess System Specialist Hours 708.00 hrs
Hourly Rate 7 81.00$
Total Excess System Specialist Labor 57,348.00$

Wage Escalation
Mechanics Year 2000 Year 2001 Year 2002 Year 2003 Total Total Labor
1st half 2nd half 1st half 2nd half 1st half 2nd half 1st half 2nd half Hours Cost
Effective Labor Rates 55.10$ 56.08$ 63.25$ 67.09$ 69.05$ 70.01$ 70.64$ 71.76$
Actual Hours 606 585 706 400 25 2,322 160,528$
Proforma Actual Hrs in Planned Period 111 297 1,914 2,322 153,421$
As-Planned Budgeted Hours 95 254 1,638 1,987
Escalation 7,107$
Electricians Year 2000 Year 2001 Year 2002 Year 2003 Total Total Labor
1st half 2nd half 1st half 2nd half 1st half 2nd half 1st half 2nd half Hours Cost
Effective Labor Rates 34.10$ 36.30$ 38.50$ 40.20$ 43.10$ 46.40$
Actual Hours 43 21 545 1,208 296 2,113 90,078$
Proforma Actual Hrs in Planned Period 1,101 1,012 2,113 74,281$
As-Planned Budgeted Hours 1,087 1,000 2,087
Escalation 15,797$

Extended Job Site Overhead Analysis of Extended Site Costs
Costs Per
Month
Trailers 600$
Phones 350
Supplies 300
Clerical Support 1,600
Special Tools 1,037
Bond 1,154
Total 5,041$
Extended period (06/01/01 through 10/31/01) 5 months 5
Extended site cost 25,205$

Material Escalation/Extended Warranty Extended Extended
Material Escalation Escalation Warranty Warranty
Purchases1
Factor2
Amount3
Factor4
Amount
Total @ December 2001 122,607$ 4.500% 5,517$
January 2002 3,073$ 0.167% 5$ 4.500% 138$
February 2002 11,843$ 0.333% 39$ 4.500% 533$
March 2002 78,637$ 0.500% 393$ 4.500% 3,539$
April 2002 23,364$ 0.667% 156$ 4.500% 1,051$
May 2002 17,509$ 0.833% 146$ 4.500% 788$
June 2002 62,602$ 1.000% 626$ 4.500% 2,817$
July 2002 1,751$ 1.167% 20$ 4.167% 73$
August 2002 13,476$ 1.333% 180$ 3.833% 517$
September 2002 51,592$ 1.500% 774$ 3.500% 1,806$
October 2002 19,177$ 1.667% 320$ 3.167% 607$
November 2002 752$ 1.833% 14$ 2.833% 21$
December 2002 33,210$ 2.000% 664$ 2.500% 830$
January 2003 1,455$ 2.167% 32$ 2.167% 32$
Total Actual 441,048$ 3,369$ 18,269$

Extended/Unabsorbed Overhead Extended Branch and Home Office Overhead -Eichleay Formula
1
Contract Billings A2
2,195,609$
Total Billings During Contract Period B3
175,868,000$
Total Overhead During Contract Period C3,4
29,929,000$
Overhead Allocable to Contract D 373,646$ (A/B)*C
Days of Contract Performance E5
1,156
Daily Rate F 323$ D/E
Days of Delay/Extension G 315
Gross Extended Overhead H 101,815$ F*G
Less O/H Claimed Elsewhere I 25,320$
Total Net Extended Overhead 76,495$

Extended/Unabsorbed Overhead Excess Overhead due to Delay - Manshul Formula
1
Base Contract Billings 2,200,000$
Revenue as of 6/30/02 824,420$
Unearned Revenue2
1,375,580$
Net of Overhead and Profit @ 100/122.44 3
1,123,473$
Excess Overhead @ 11.13%4
125,043$
Less Overhead on Added Direct Cost5
11,454$
Net Excess Overhead 113,588$
Profit @ 10% 9,087$
Total Excess Overhead and Profit 122,675$


![Disposition and metabolism of [ c]- levomilnacipran, a ... · 1 hour, 2 hours, 2.5 hours, 3 hours, 3.5 hours, 4 hours, 5 hours, 6 hours, 8 hours, 10 hours, 12 hours, 24 hours, 48](https://img.pdfslide.net/doc/110x75/5f73b26d02e65a52de6394cc/disposition-and-metabolism-of-c-levomilnacipran-a-1-hour-2-hours-25.jpg)