Embed Size (px)
Citation preview
INDEPENDENT AGRONOMY ADVICE + CUTTING EDGE RESEARCH
Quantifying herbicide resistance in modern farming systems GRDC Fast track project Griffith 2012/2013
2Ag Grow Agronomy & Research | Quantifying herbicide resistance in modern farming systems
backgroundherbicide resistance in annual ryegrass (Lolium rigidum) and common sow thistle (Sonchus oleraceus) in the Western Riverina region of NSW has elevated significantly in recent years.
The nature of the cropping and pasture rotations in the region have made managing herbicide resistance extremely difficult, and recent random herbicide resistance surveys funded by GRDC have included only limited samples from this region.
The majority of the region is marginal dryland winter cropping (2 t/ha average), where no till farming adoption has elevated to over 75% (source - Ag Grow crop benchmarking 2013). Spending money on expensive alternative herbicides is difficult as farm sizes are large (>3500ha) and returns are often low and variable.
On the other hand is the highly intensive irrigation cropping systems, where tight rotations (including
horticulture), high herbicide inputs and large areas of channels and roads have led to extremely high perceived levels of herbicide resistance.
Widespread flooding in the region in March 2012 caused significant seed dispersal across large areas, and growers and advisors felt unarmed with the appropriate knowledge to choose the right herbicides for effective weed control, particularly for ryegrass and sow thistle.
This was raised as an issue with GRDC and as such a fast track project was established to provide growers and advisors with the necessary information to manage the problem.
It is important to note that this project was originally established between NSW DPI and GRDC, however as a result of structural changes in NSW DPI, Ag Grow Agronomy and Research was contracted to complete the project.
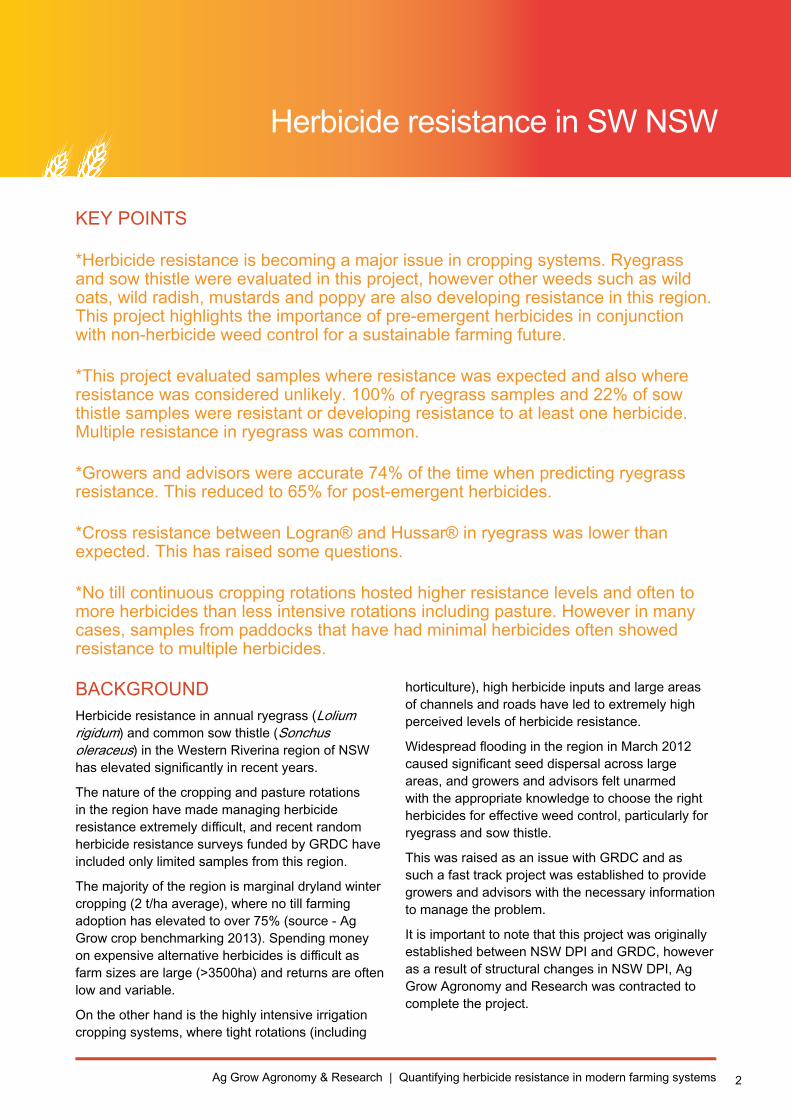
Herbicide resistance in SW NSW
key POINTS
*Herbicide resistance is becoming a major issue in cropping systems. Ryegrass and sow thistle were evaluated in this project, however other weeds such as wild oats, wild radish, mustards and poppy are also developing resistance in this region. This project highlights the importance of pre-emergent herbicides in conjunction with non-herbicide weed control for a sustainable farming future.
*This project evaluated samples where resistance was expected and also where resistance was considered unlikely. 100% of ryegrass samples and 22% of sow thistle samples were resistant or developing resistance to at least one herbicide. Multiple resistance in ryegrass was common.
*Growers and advisors were accurate 74% of the time when predicting ryegrass resistance. This reduced to 65% for post-emergent herbicides.
*Cross resistance between Logran® and Hussar® in ryegrass was lower than expected. This has raised some questions.
*No till continuous cropping rotations hosted higher resistance levels and often to more herbicides than less intensive rotations including pasture. However in many cases, samples from paddocks that have had minimal herbicides often showed resistance to multiple herbicides.
3Ag Grow Agronomy & Research | Quantifying herbicide resistance in modern farming systems
AIM OF THe PROjeCTThe aim of this project was to capture the current resistance status of a large sample of ryegrass and sow thistle to key pre-emergent and post-emergent herbicides in the Western Riverina region of South Western NSW.
In addition, the project aimed to measure the risks of herbicide resistance according to the rotational history and farming practices, as well as the ability of growers and advisors to predict the resistance status of each sample.
methodoLogy
sampling101 annual ryegrass and 31 sow thistle samples were collected by growers and advisors during harvest in 2012.
Samples were taken from either a known resistant population or non-resistant population.
An A4 envelope of seed was required following weed maturity, and samples taken at every 5 to 10 paces aiming to avoid bias towards single populations.
Samples were appropriately identified, GPS referenced, and submitted with the appropriate questionnaire sheet.
This sheet requested information about the history of the paddock, the current farming system and the expected resistance status of the sample.
testingThe resistance screening took place between February and june 2013. For each of the 102 ryegrass samples 0.2 g of seed was planted in plastic punnet trays (330 mm x 280 mm x 60 mm). each tray contained 14 different samples sown in rows 25 mm apart and 5 mm deep and then covered.
The trays were filled with either a 50:50 peat:sand mix or a soil mix (50:50 loam:river wash sand) depending upon the herbicide to be applied. Two weeks after sowing all samples screened to post-emergent herbicides were counted and thinned to a maximum of 20 plants per sample.
The sow thistle samples were sown in February 2013. Approximately 50 seeds from each of the samples were planted in plastic trays (150 mm x
100 mm x 60 mm). The trays were filled with either a 50:50 peat:sand mix or a soil mix (50:50 loam:river wash sand), depending upon the herbicide to be applied.
trays were maintained in a temperature controlled glasshouse (10oC minimum, 25oC maximum) without supplementary lighting and were watered and fertilised as required. Three replicates were sown for all samples, except where seed numbers were limited.
Pre-emergent herbicides
herbicides were selected as per current australian registrations. Ryegrass samples were screened with four herbicides, triasulfuron, trifluralin, prosulocarb + S-metolachlor and pyroxasulfone. For all pre-emergent herbicide treatments, seeds were sown in the soil mix for ease of herbicide incorporation.
For triasulfuron the seeds were sown in the rows, covered with 5 mm of the soil mix, sprayed with the herbicide and the herbicide watered in. For the trifluralin and prosulocarb + S-metolachlor treatments, the trays were sprayed, raked lightly to incorporate the herbicide, and seed was sown in rows on top of the herbicide and covered with 5 mm of soil.
For pyroxasulfone the seeds were sown in the rows, sprayed with the herbicide then covered with 5 mm of the soil mix and the herbicide watered in.
Post-emergent herbicidesherbicides were selected as per current australian registrations. Ryegrass samples were screened with diclofop-methyl, haloxyfop-R, clethodim, pinoxaden + cloquintocet-mexyl, imazamox + imazapyr, iodosulfuron-methyl-sodium and glyphosate. Sow thistle samples were screened with metsulfuron-methyl, iodosulfuron-methyl-sodium, MCPA + imazapyr + imazapic, clopyralid, MCPA and glyphosate (Table 1).
Samples were sown in the peat:sand mix for diclofop-methyl, haloxyfop-R, clethodim, pinoxaden + cloquintocet-mexyl, MCPA and glyphosate, with the other herbicides sown in the soil mix.
After assessment of the post-emergent herbicides, the screening for samples with poor germination or inconsistent results across the three replicates was repeated using the same methodology.
The herbicide resistance testing protocol utilised was adopted from Broster and Pratley (2006), although for this experiment herbicides were only applied at
4Ag Grow Agronomy & Research | Quantifying herbicide resistance in modern farming systems
the label recommended rate (Table 1). All herbicides were applied using an automated laboratory-sized cabinet sprayer with a moving boom applying a water volume of 77 L ha-1 equivalent from a flat fan nozzle at 300 kPa pressure and travelling at 6.6 kph.Adjuvants were added to herbicides as per label requirements (Table 1).
a standard susceptible biotype and a known resistant biotype, where available, were included with each cohort of samples. Due to limited seed availability, for some samples, not all of the samples were screened with all herbicides.
Herbicide evaluationAll samples were assessed between 21 and 28 days after treatment. Seedlings in post-emergent treatments were counted before and after treatment to enable survival percentages to be calculated.
Samples sprayed pre-emergent were rated visually from 0 (no germination) to 10 (no visual difference from susceptible control).
Samples were classified as resistant if the mean survival percentage for all replicates was greater than 20% for post-emergent herbicides or if a visual score of greater than 2.0 was observed for pre-emergent herbicides, except for triasulfuron where the threshold was 3.5.
Samples with survival percentages of between 10 and 19% for post-emergent herbicides or a visual score of between 1.0 and 2.0 for pre-emergent herbicides, except for triasulfuron where it was 2.5 to 3.5, were classed as developing resistance.
Samples were classed as susceptible if survival was less than 10%, a visual score of 2.5 for triasulfuron or for the other pre-emergent herbicides a visual score of below 1.0.
resuLtsThe results of the herbicide resistance testing were quite remarkable and some-what unexpected.
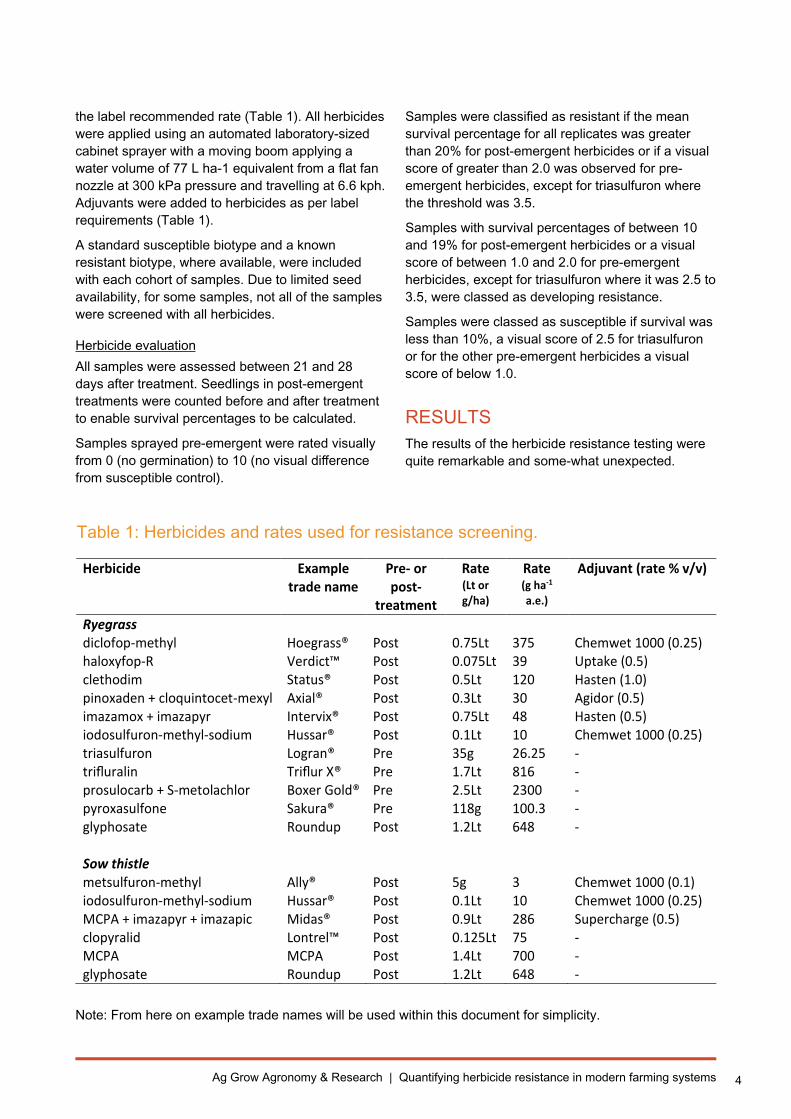
Table 1: Herbicides and rates used for resistance screening.
Note: From here on example trade names will be used within this document for simplicity.
Herbicide Example trade name
Pre- or post-
treatment
Rate (Lt or g/ha)
Rate (g ha-1 a.e.)
Adjuvant (rate % v/v)
Ryegrass diclofop-methyl Hoegrass® Post 0.75Lt 375 Chemwet 1000 (0.25) haloxyfop-R Verdict™ Post 0.075Lt 39 Uptake (0.5) clethodim Status® Post 0.5Lt 120 Hasten (1.0) pinoxaden + cloquintocet-mexyl Axial® Post 0.3Lt 30 Agidor (0.5) imazamox + imazapyr Intervix® Post 0.75Lt 48 Hasten (0.5) iodosulfuron-methyl-sodium Hussar® Post 0.1Lt 10 Chemwet 1000 (0.25) triasulfuron Logran® Pre 35g 26.25 - trifluralin Triflur X® Pre 1.7Lt 816 - prosulocarb + S-metolachlor Boxer Gold® Pre 2.5Lt 2300 - pyroxasulfone Sakura® Pre 118g 100.3 - glyphosate Roundup Post 1.2Lt 648 - Sow thistle metsulfuron-methyl Ally® Post 5g 3 Chemwet 1000 (0.1) iodosulfuron-methyl-sodium Hussar® Post 0.1Lt 10 Chemwet 1000 (0.25) MCPA + imazapyr + imazapic Midas® Post 0.9Lt 286 Supercharge (0.5) clopyralid Lontrel™ Post 0.125Lt 75 - MCPA MCPA Post 1.4Lt 700 - glyphosate Roundup Post 1.2Lt 648 -
5Ag Grow Agronomy & Research | Quantifying herbicide resistance in modern farming systems
The results can be analysed broadly whereby trends are linked to each herbicide, and also individually where specific background information linked to each sample allows a detailed interpretation of the reasoning why a sample may be resistant to a particular herbicide.
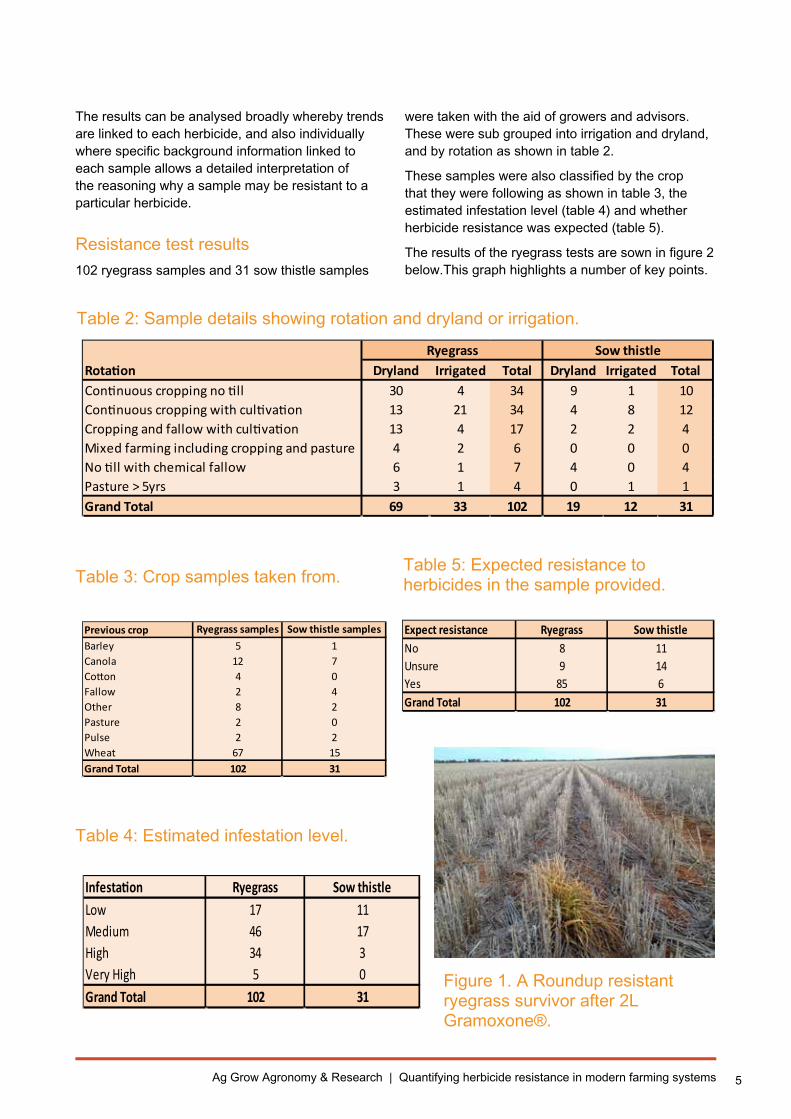
resistance test results102 ryegrass samples and 31 sow thistle samples
were taken with the aid of growers and advisors. These were sub grouped into irrigation and dryland, and by rotation as shown in table 2.
These samples were also classified by the crop that they were following as shown in table 3, the estimated infestation level (table 4) and whether herbicide resistance was expected (table 5).
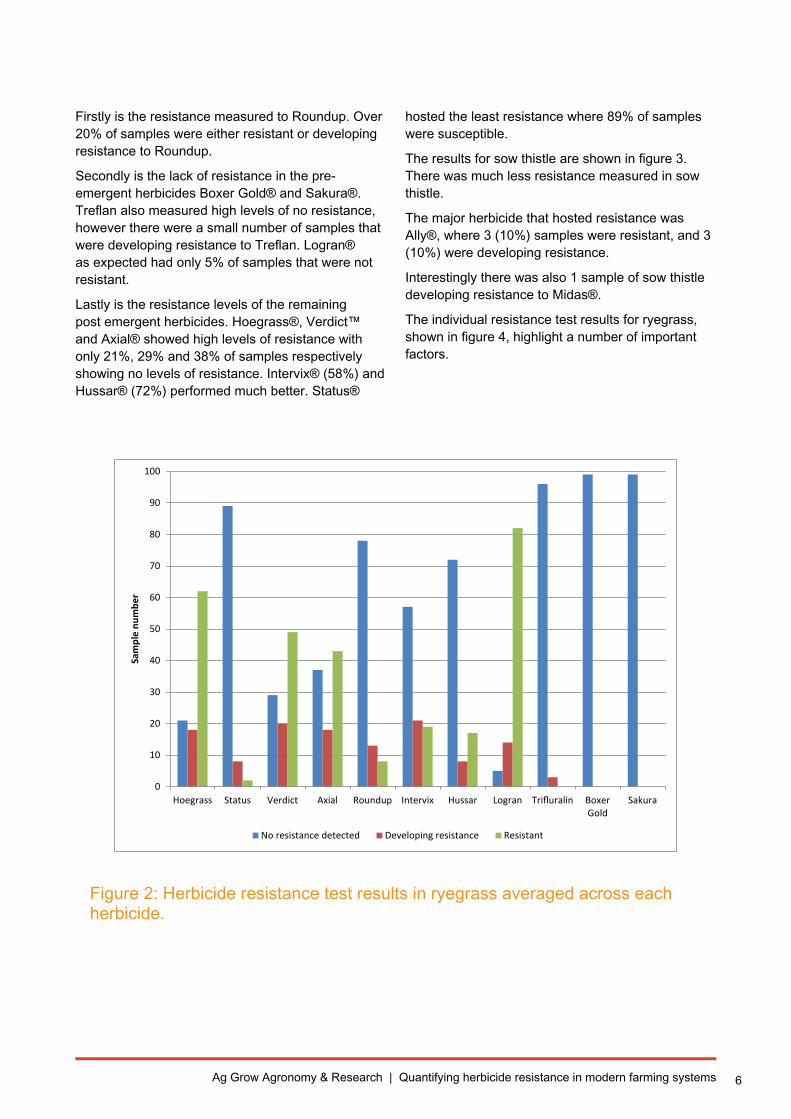
The results of the ryegrass tests are sown in figure 2 below.This graph highlights a number of key points.
Table 2: Sample details showing rotation and dryland or irrigation.
Table 3: Crop samples taken from.
Table 4: estimated infestation level.
Table 5: expected resistance to herbicides in the sample provided.
Figure 1. A Roundup resistant ryegrass survivor after 2L Gramoxone®.
Rotation Dryland Irrigated Total Dryland Irrigated TotalContinuous cropping no till 30 4 34 9 1 10Continuous cropping with cultivation 13 21 34 4 8 12Cropping and fallow with cultivation 13 4 17 2 2 4Mixed farming including cropping and pasture 4 2 6 0 0 0No till with chemical fallow 6 1 7 4 0 4Pasture > 5yrs 3 1 4 0 1 1Grand Total 69 33 102 19 12 31
Sow thistleRyegrass
Previous crop Ryegrass samples Sow thistle samplesBarley 5 1Canola 12 7Cotton 4 0Fallow 2 4Other 8 2Pasture 2 0Pulse 2 2Wheat 67 15Grand Total 102 31
Infestation Ryegrass Sow thistleLow 17 11Medium 46 17High 34 3Very High 5 0Grand Total 102 31
Expect resistance Ryegrass Sow thistleNo 8 11Unsure 9 14Yes 85 6Grand Total 102 31
6Ag Grow Agronomy & Research | Quantifying herbicide resistance in modern farming systems
Firstly is the resistance measured to Roundup. Over 20% of samples were either resistant or developing resistance to Roundup.
Secondly is the lack of resistance in the pre-emergent herbicides Boxer Gold® and Sakura®. Treflan also measured high levels of no resistance, however there were a small number of samples that were developing resistance to Treflan. Logran® as expected had only 5% of samples that were not resistant.
Lastly is the resistance levels of the remaining post emergent herbicides. Hoegrass®, Verdict™ and Axial® showed high levels of resistance with only 21%, 29% and 38% of samples respectively showing no levels of resistance. Intervix® (58%) and Hussar® (72%) performed much better. Status®
hosted the least resistance where 89% of samples were susceptible.
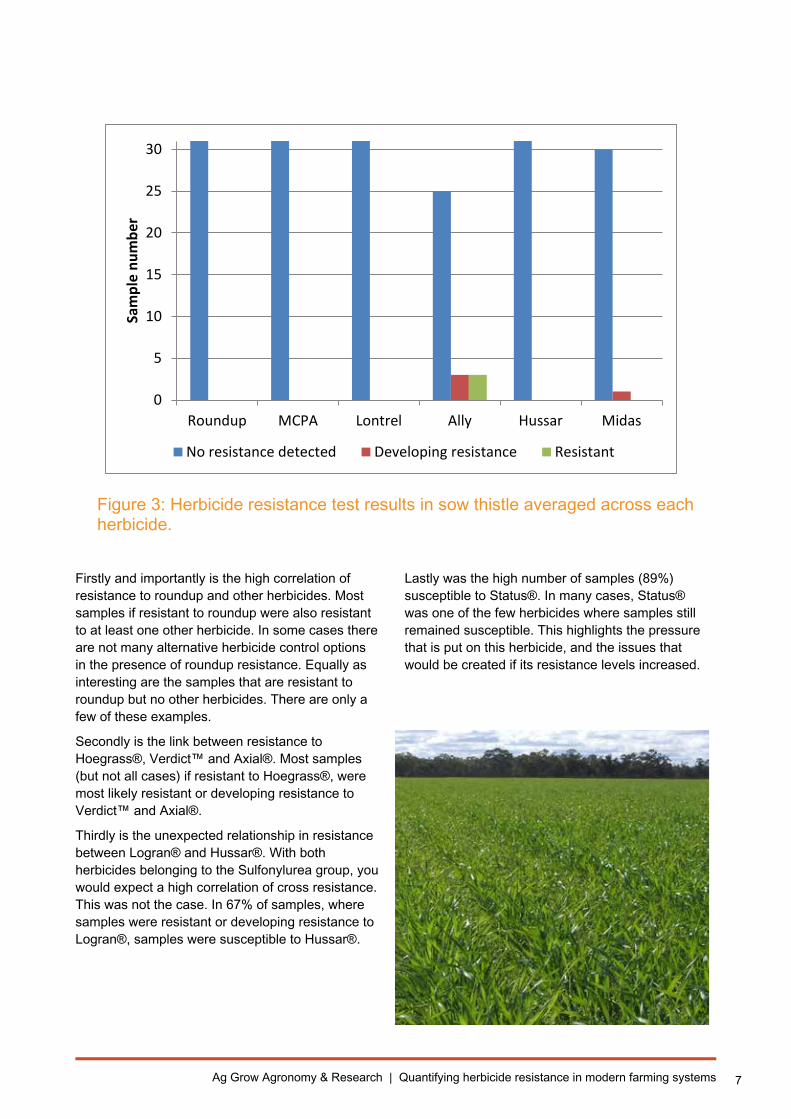
The results for sow thistle are shown in figure 3. There was much less resistance measured in sow thistle.
The major herbicide that hosted resistance was Ally®, where 3 (10%) samples were resistant, and 3 (10%) were developing resistance.
Interestingly there was also 1 sample of sow thistle developing resistance to Midas®.
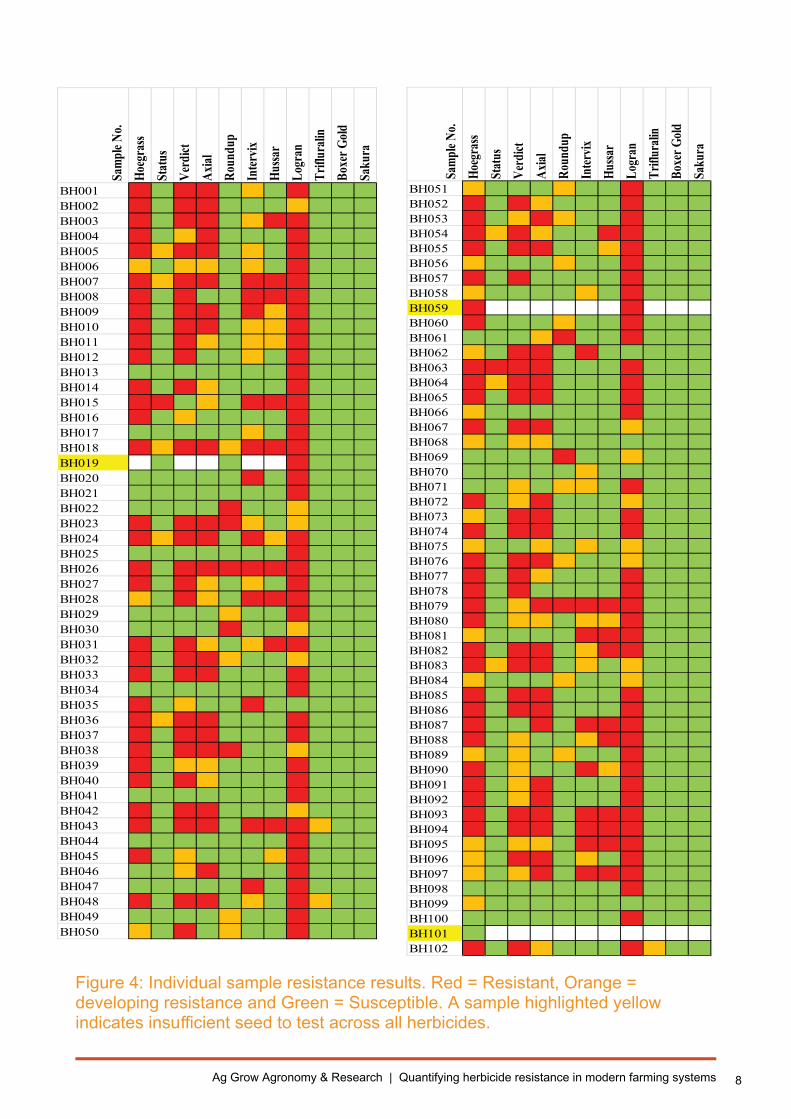
The individual resistance test results for ryegrass, shown in figure 4, highlight a number of important factors.
0
10
20
30
40
50
60
70
80
90
100
Hoegrass Status Verdict Axial Roundup Intervix Hussar Logran Trifluralin BoxerGold
Sakura
Sam
ple
num
ber
No resistance detected Developing resistance Resistant
Figure 2: Herbicide resistance test results in ryegrass averaged across each herbicide.
7Ag Grow Agronomy & Research | Quantifying herbicide resistance in modern farming systems
Firstly and importantly is the high correlation of resistance to roundup and other herbicides. Most samples if resistant to roundup were also resistant to at least one other herbicide. In some cases there are not many alternative herbicide control options in the presence of roundup resistance. equally as interesting are the samples that are resistant to roundup but no other herbicides. There are only a few of these examples.
Secondly is the link between resistance to Hoegrass®, Verdict™ and Axial®. Most samples (but not all cases) if resistant to Hoegrass®, were most likely resistant or developing resistance to Verdict™ and Axial®.
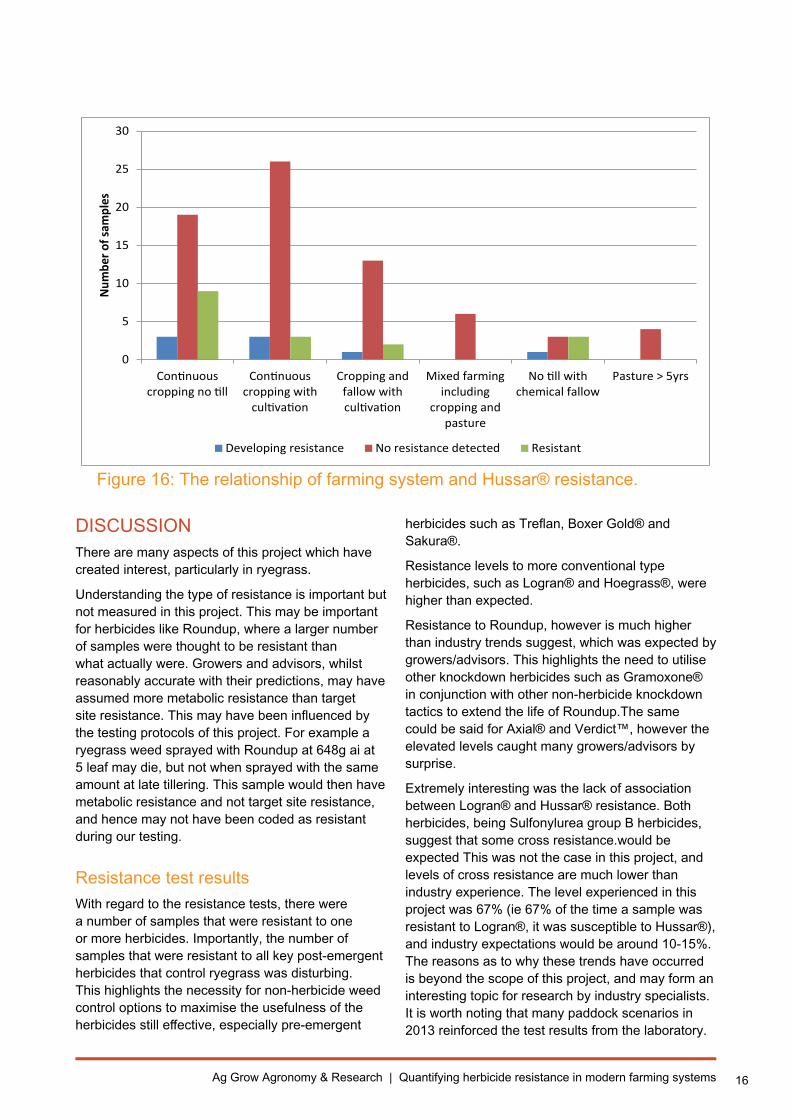
Thirdly is the unexpected relationship in resistance between Logran® and Hussar®. With both herbicides belonging to the Sulfonylurea group, you would expect a high correlation of cross resistance. This was not the case. In 67% of samples, where samples were resistant or developing resistance to Logran®, samples were susceptible to Hussar®.
Lastly was the high number of samples (89%) susceptible to Status®. In many cases, Status® was one of the few herbicides where samples still remained susceptible. This highlights the pressure that is put on this herbicide, and the issues that would be created if its resistance levels increased.
0
5
10
15
20
25
30
Roundup MCPA Lontrel Ally Hussar Midas
Sam
ple
num
ber
No resistance detected Developing resistance Resistant
Figure 3: Herbicide resistance test results in sow thistle averaged across each herbicide.
8Ag Grow Agronomy & Research | Quantifying herbicide resistance in modern farming systems
Sam
ple N
o.Ho
egra
ssSt
atus
Verd
ictAx
ialRo
undu
pIn
tervix
Hussa
rLo
gran
Trifl
urali
nBo
xer G
oldSa
kura
BH001BH002BH003BH004BH005BH006BH007BH008BH009BH010BH011BH012BH013BH014BH015BH016BH017BH018BH019BH020BH021BH022BH023BH024BH025BH026BH027BH028BH029BH030BH031BH032BH033BH034BH035BH036BH037BH038BH039BH040BH041BH042BH043BH044BH045BH046BH047BH048BH049BH050
Sam
ple N
o.Ho
egra
ssSt
atus
Verd
ictAx
ialRo
undu
pIn
tervix
Hussa
rLo
gran
Trifl
urali
nBo
xer G
oldSa
kura
BH051BH052BH053BH054BH055BH056BH057BH058BH059BH060BH061BH062BH063BH064BH065BH066BH067BH068BH069BH070BH071BH072BH073BH074BH075BH076BH077BH078BH079BH080BH081BH082BH083BH084BH085BH086BH087BH088BH089BH090BH091BH092BH093BH094BH095BH096BH097BH098BH099BH100BH101BH102
Figure 4: Individual sample resistance results. Red = Resistant, Orange = developing resistance and Green = Susceptible. A sample highlighted yellow indicates insufficient seed to test across all herbicides.
9Ag Grow Agronomy & Research | Quantifying herbicide resistance in modern farming systems
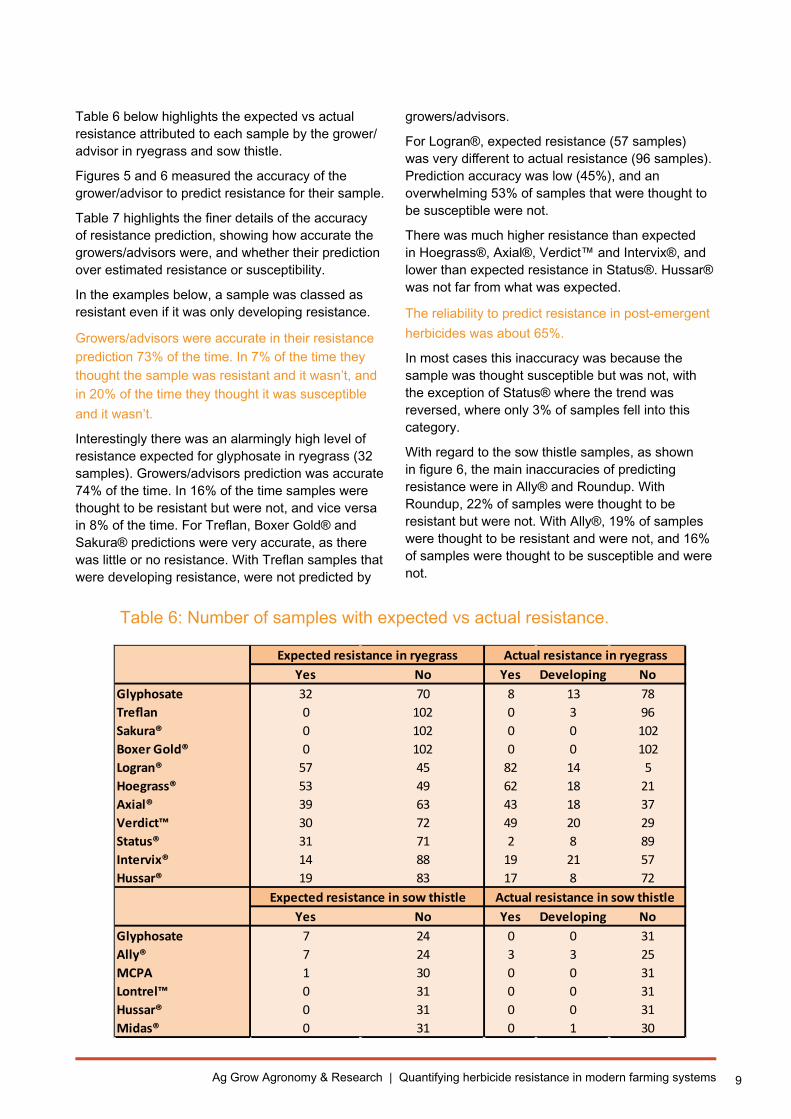
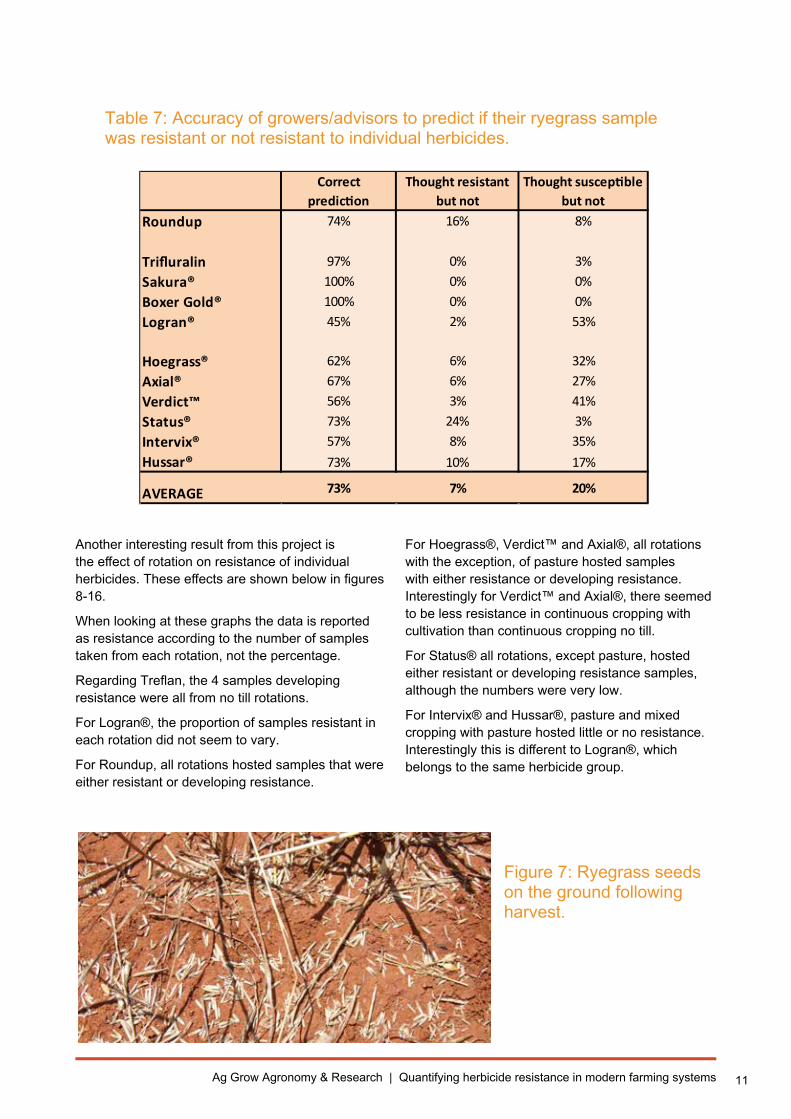
Table 6 below highlights the expected vs actual resistance attributed to each sample by the grower/advisor in ryegrass and sow thistle.
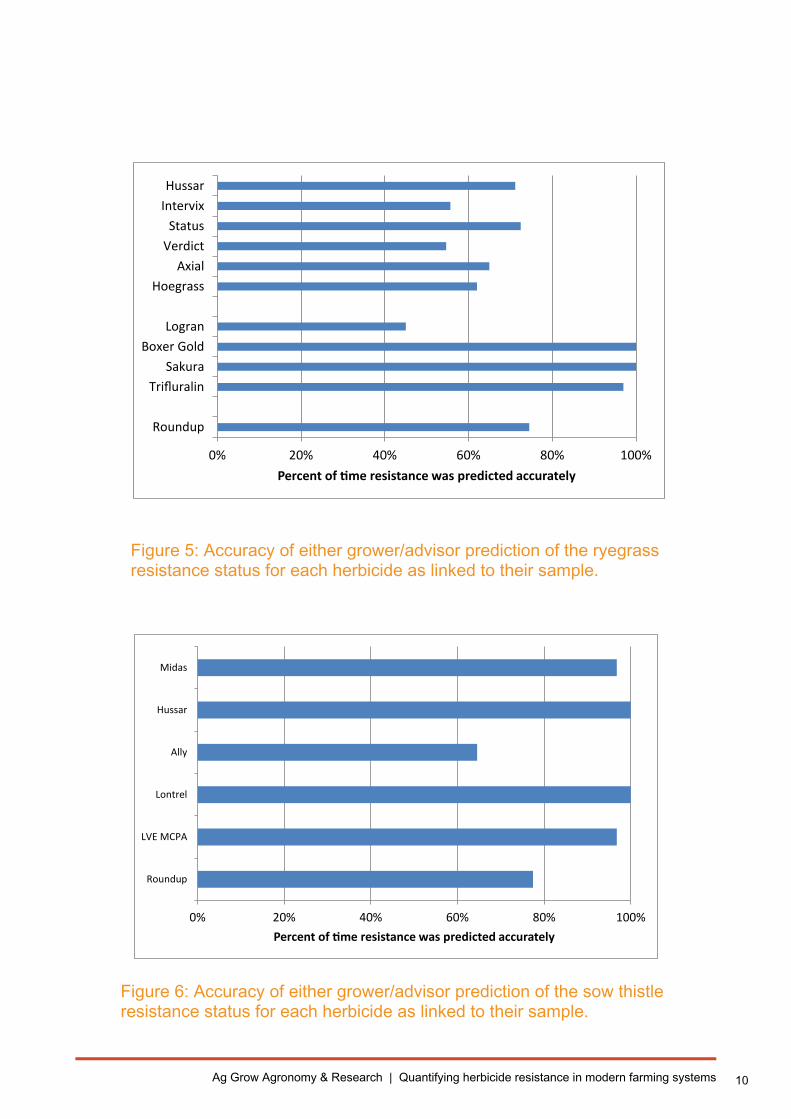
Figures 5 and 6 measured the accuracy of the grower/advisor to predict resistance for their sample.
Table 7 highlights the finer details of the accuracy of resistance prediction, showing how accurate the growers/advisors were, and whether their prediction over estimated resistance or susceptibility.
In the examples below, a sample was classed as resistant even if it was only developing resistance.
Growers/advisors were accurate in their resistance prediction 73% of the time. In 7% of the time they thought the sample was resistant and it wasn’t, and in 20% of the time they thought it was susceptible and it wasn’t.
Interestingly there was an alarmingly high level of resistance expected for glyphosate in ryegrass (32 samples). Growers/advisors prediction was accurate 74% of the time. In 16% of the time samples were thought to be resistant but were not, and vice versa in 8% of the time. For Treflan, Boxer Gold® and Sakura® predictions were very accurate, as there was little or no resistance. With Treflan samples that were developing resistance, were not predicted by
growers/advisors.
For Logran®, expected resistance (57 samples) was very different to actual resistance (96 samples). Prediction accuracy was low (45%), and an overwhelming 53% of samples that were thought to be susceptible were not.
There was much higher resistance than expected in Hoegrass®, Axial®, Verdict™ and Intervix®, and lower than expected resistance in Status®. Hussar® was not far from what was expected.
The reliability to predict resistance in post-emergent herbicides was about 65%.
In most cases this inaccuracy was because the sample was thought susceptible but was not, with the exception of Status® where the trend was reversed, where only 3% of samples fell into this category.
With regard to the sow thistle samples, as shown in figure 6, the main inaccuracies of predicting resistance were in Ally® and Roundup. With Roundup, 22% of samples were thought to be resistant but were not. With Ally®, 19% of samples were thought to be resistant and were not, and 16% of samples were thought to be susceptible and were not.
Table 6: Number of samples with expected vs actual resistance.
Yes No Yes Developing NoGlyphosate 32 70 8 13 78Treflan 0 102 0 3 96Sakura® 0 102 0 0 102Boxer Gold® 0 102 0 0 102Logran® 57 45 82 14 5Hoegrass® 53 49 62 18 21Axial® 39 63 43 18 37Verdict™ 30 72 49 20 29Status® 31 71 2 8 89Intervix® 14 88 19 21 57Hussar® 19 83 17 8 72
Yes No Yes Developing NoGlyphosate 7 24 0 0 31Ally® 7 24 3 3 25MCPA 1 30 0 0 31Lontrel™ 0 31 0 0 31Hussar® 0 31 0 0 31Midas® 0 31 0 1 30
Expected resistance in ryegrass
Expected resistance in sow thistle
Actual resistance in ryegrass
Actual resistance in sow thistle
10Ag Grow Agronomy & Research | Quantifying herbicide resistance in modern farming systems
0% 20% 40% 60% 80% 100%
Roundup
TrifluralinSakura
Boxer GoldLogran
HoegrassAxial
VerdictStatus
IntervixHussar
Percent of time resistance was predicted accurately
0% 20% 40% 60% 80% 100%
Roundup
LVE MCPA
Lontrel
Ally
Hussar
Midas
Percent of time resistance was predicted accurately
Figure 5: Accuracy of either grower/advisor prediction of the ryegrass resistance status for each herbicide as linked to their sample.
Figure 6: Accuracy of either grower/advisor prediction of the sow thistle resistance status for each herbicide as linked to their sample.
11Ag Grow Agronomy & Research | Quantifying herbicide resistance in modern farming systems
Table 7: Accuracy of growers/advisors to predict if their ryegrass sample was resistant or not resistant to individual herbicides.
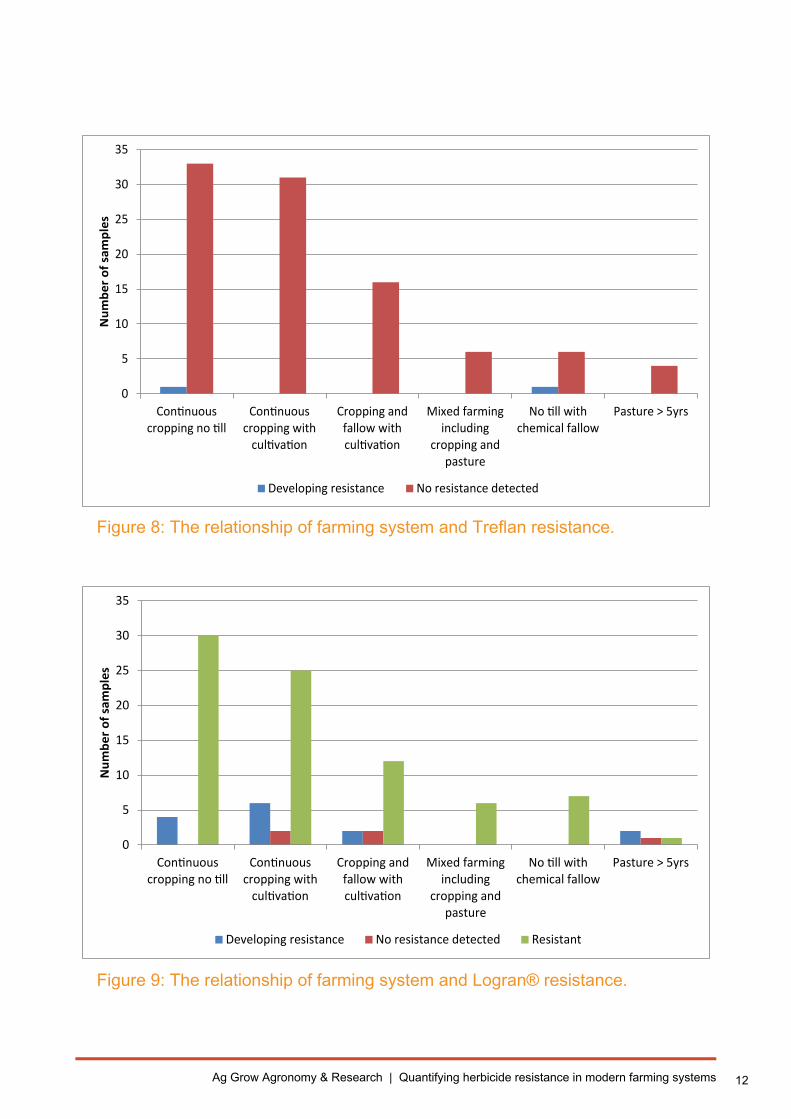
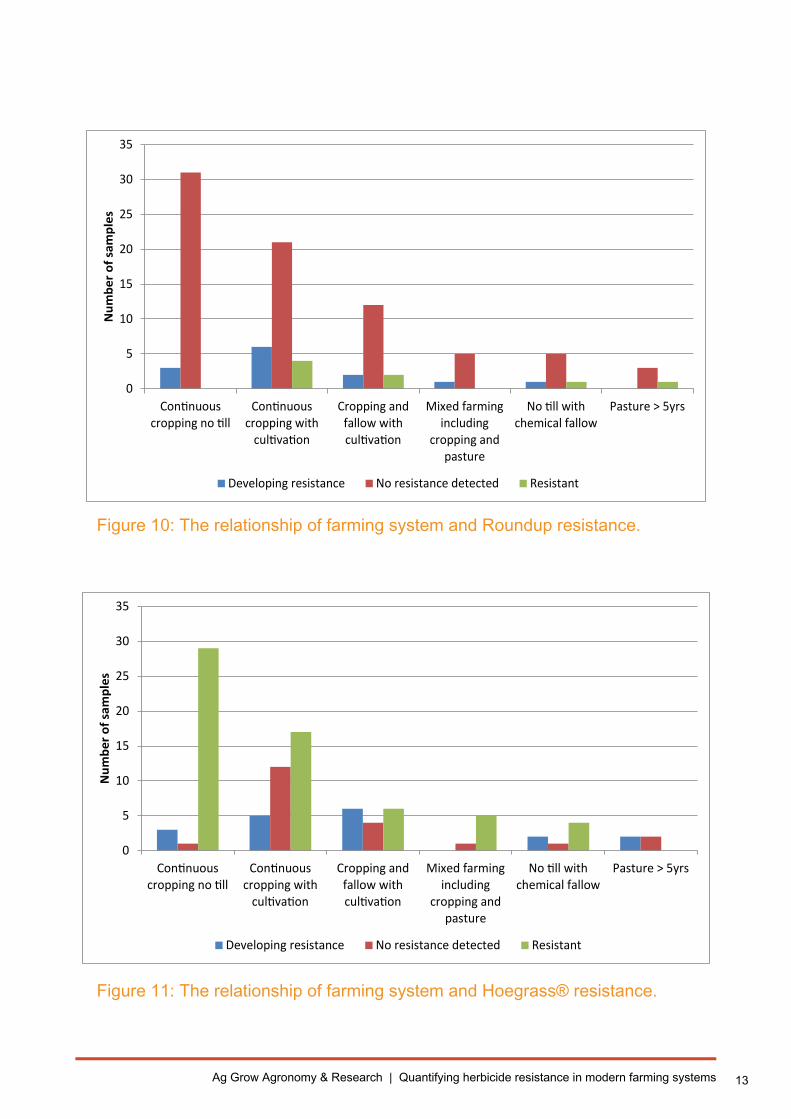
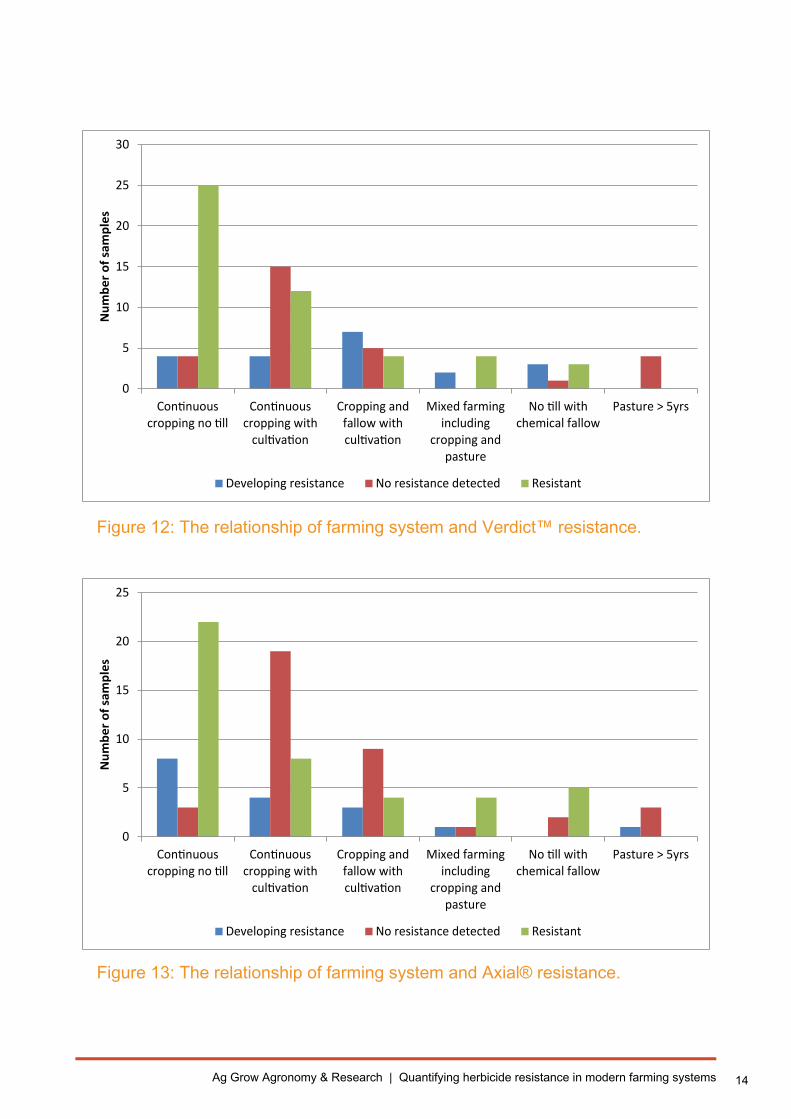
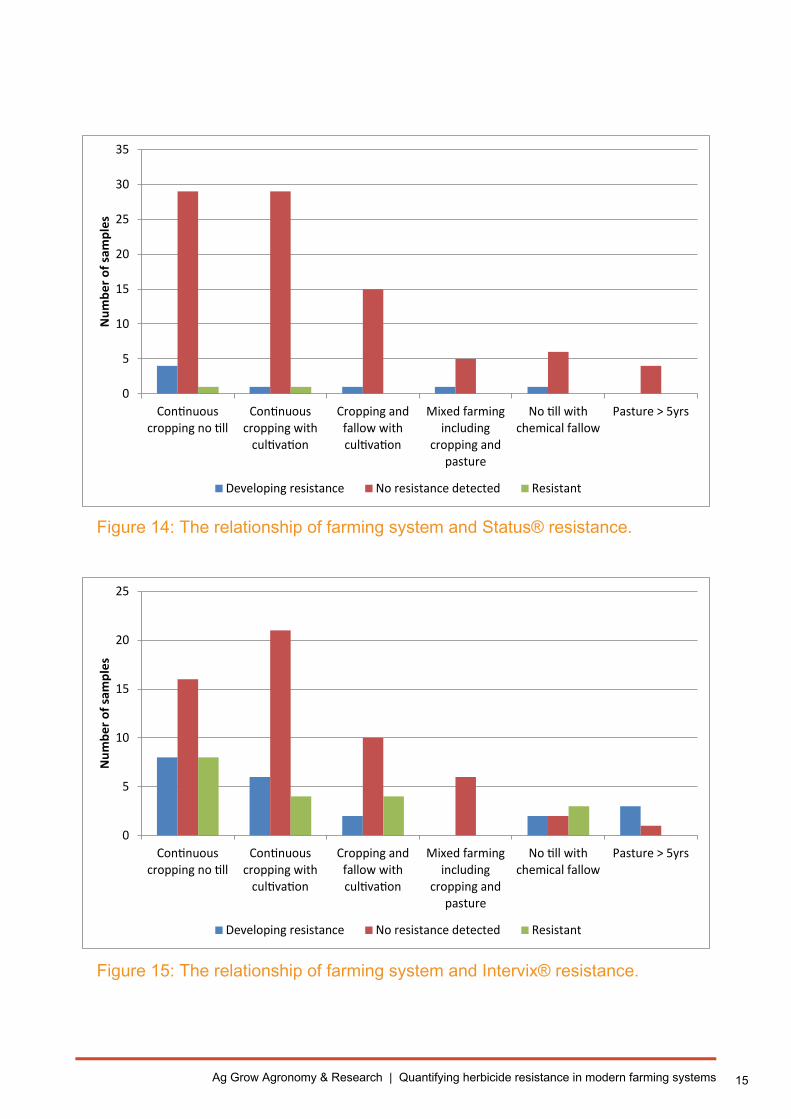
Another interesting result from this project is the effect of rotation on resistance of individual herbicides. These effects are shown below in figures 8-16.
When looking at these graphs the data is reported as resistance according to the number of samples taken from each rotation, not the percentage.
Regarding Treflan, the 4 samples developing resistance were all from no till rotations.
For Logran®, the proportion of samples resistant in each rotation did not seem to vary.
For Roundup, all rotations hosted samples that were either resistant or developing resistance.
For Hoegrass®, Verdict™ and Axial®, all rotations with the exception, of pasture hosted samples with either resistance or developing resistance. Interestingly for Verdict™ and Axial®, there seemed to be less resistance in continuous cropping with cultivation than continuous cropping no till.
For Status® all rotations, except pasture, hosted either resistant or developing resistance samples, although the numbers were very low.
For Intervix® and Hussar®, pasture and mixed cropping with pasture hosted little or no resistance. Interestingly this is different to Logran®, which belongs to the same herbicide group.
Figure 7: Ryegrass seeds on the ground following harvest.
Correct prediction
Thought resistant but not
Thought susceptible but not
Roundup 74% 16% 8%
Trifluralin 97% 0% 3%Sakura® 100% 0% 0%Boxer Gold® 100% 0% 0%Logran® 45% 2% 53%
Hoegrass® 62% 6% 32%Axial® 67% 6% 27%Verdict™ 56% 3% 41%Status® 73% 24% 3%Intervix® 57% 8% 35%Hussar® 73% 10% 17%
AVERAGE 73% 7% 20%
12Ag Grow Agronomy & Research | Quantifying herbicide resistance in modern farming systems
Figure 8: The relationship of farming system and Treflan resistance.
Figure 9: The relationship of farming system and Logran® resistance.
0
5
10
15
20
25
30
35
Continuouscropping no till
Continuouscropping with
cultivation
Cropping andfallow withcultivation
Mixed farmingincluding
cropping andpasture
No till withchemical fallow
Pasture > 5yrs
Num
ber o
f sam
ples
Developing resistance No resistance detected Resistant
0
5
10
15
20
25
30
35
Continuouscropping no till
Continuouscropping with
cultivation
Cropping andfallow withcultivation
Mixed farmingincluding
cropping andpasture
No till withchemical fallow
Pasture > 5yrs
Num
ber o
f sam
ples
Developing resistance No resistance detected
13Ag Grow Agronomy & Research | Quantifying herbicide resistance in modern farming systems
Figure 10: The relationship of farming system and Roundup resistance.
Figure 11: The relationship of farming system and Hoegrass® resistance.
0
5
10
15
20
25
30
35
Continuouscropping no till
Continuouscropping with
cultivation
Cropping andfallow withcultivation
Mixed farmingincluding
cropping andpasture
No till withchemical fallow
Pasture > 5yrs
Num
ber o
f sam
ples
Developing resistance No resistance detected Resistant
0
5
10
15
20
25
30
35
Continuouscropping no till
Continuouscropping with
cultivation
Cropping andfallow withcultivation
Mixed farmingincluding
cropping andpasture
No till withchemical fallow
Pasture > 5yrs
Num
ber o
f sam
ples
Developing resistance No resistance detected Resistant
14Ag Grow Agronomy & Research | Quantifying herbicide resistance in modern farming systems
Figure 12: The relationship of farming system and Verdict™ resistance.
Figure 13: The relationship of farming system and Axial® resistance.
0
5
10
15
20
25
30
Continuouscropping no till
Continuouscropping with
cultivation
Cropping andfallow withcultivation
Mixed farmingincluding
cropping andpasture
No till withchemical fallow
Pasture > 5yrs
Num
ber o
f sam
ples
Developing resistance No resistance detected Resistant
0
5
10
15
20
25
Continuouscropping no till
Continuouscropping with
cultivation
Cropping andfallow withcultivation
Mixed farmingincluding
cropping andpasture
No till withchemical fallow
Pasture > 5yrs
Num
ber o
f sam
ples
Developing resistance No resistance detected Resistant
15Ag Grow Agronomy & Research | Quantifying herbicide resistance in modern farming systems
Figure 14: The relationship of farming system and Status® resistance.
Figure 15: The relationship of farming system and Intervix® resistance.
0
5
10
15
20
25
30
35
Continuouscropping no till
Continuouscropping with
cultivation
Cropping andfallow withcultivation
Mixed farmingincluding
cropping andpasture
No till withchemical fallow
Pasture > 5yrs
Num
ber o
f sam
ples
Developing resistance No resistance detected Resistant
0
5
10
15
20
25
Continuouscropping no till
Continuouscropping with
cultivation
Cropping andfallow withcultivation
Mixed farmingincluding
cropping andpasture
No till withchemical fallow
Pasture > 5yrs
Num
ber o
f sam
ples
Developing resistance No resistance detected Resistant
16Ag Grow Agronomy & Research | Quantifying herbicide resistance in modern farming systems
Figure 16: The relationship of farming system and Hussar® resistance.
discussionThere are many aspects of this project which have created interest, particularly in ryegrass.
Understanding the type of resistance is important but not measured in this project. This may be important for herbicides like Roundup, where a larger number of samples were thought to be resistant than what actually were. Growers and advisors, whilst reasonably accurate with their predictions, may have assumed more metabolic resistance than target site resistance. This may have been influenced by the testing protocols of this project. For example a ryegrass weed sprayed with Roundup at 648g ai at 5 leaf may die, but not when sprayed with the same amount at late tillering. This sample would then have metabolic resistance and not target site resistance, and hence may not have been coded as resistant during our testing.
resistance test resultsWith regard to the resistance tests, there were a number of samples that were resistant to one or more herbicides. Importantly, the number of samples that were resistant to all key post-emergent herbicides that control ryegrass was disturbing. This highlights the necessity for non-herbicide weed control options to maximise the usefulness of the herbicides still effective, especially pre-emergent
herbicides such as Treflan, Boxer Gold® and Sakura®.
Resistance levels to more conventional type herbicides, such as Logran® and Hoegrass®, were higher than expected.
Resistance to Roundup, however is much higher than industry trends suggest, which was expected by growers/advisors. This highlights the need to utilise other knockdown herbicides such as Gramoxone® in conjunction with other non-herbicide knockdown tactics to extend the life of Roundup.The same could be said for Axial® and Verdict™, however the elevated levels caught many growers/advisors by surprise.
extremely interesting was the lack of association between Logran® and Hussar® resistance. Both herbicides, being Sulfonylurea group B herbicides, suggest that some cross resistance.would be expected This was not the case in this project, and levels of cross resistance are much lower than industry experience. The level experienced in this project was 67% (ie 67% of the time a sample was resistant to Logran®, it was susceptible to Hussar®), and industry expectations would be around 10-15%. The reasons as to why these trends have occurred is beyond the scope of this project, and may form an interesting topic for research by industry specialists. It is worth noting that many paddock scenarios in 2013 reinforced the test results from the laboratory.
0
5
10
15
20
25
30
Continuouscropping no till
Continuouscropping with
cultivation
Cropping andfallow withcultivation
Mixed farmingincluding
cropping andpasture
No till withchemical fallow
Pasture > 5yrs
Num
ber o
f sam
ples
Developing resistance No resistance detected Resistant
17Ag Grow Agronomy & Research | Quantifying herbicide resistance in modern farming systems
Grower/advisor ability to predict resistanceAnother point of discussion was the ability of the grower/advisor that submitted the samples to predict if resistance was going to be present or not.
The accuracy averaged across all herbicides was 74%, however for post-emergent herbicides was around 65%. This is concerning, as most growers/advisors that presented samples were highly experienced and familiar with the issues they were facing with resistance on their farms.
In 26% of samples, growers/advisors thought that it was susceptible, when in fact it was resistant. This may explain the level of failed herbicide applications which commonly occurs in the farming system.
effect of rotation on resistance levelsLastly, was the effect of cropping rotation on resistance. It is obvious that the higher the cropping intensity, the greater the resistance to a wider number of resistant herbicides.
Interestingly, however was the level of resistance measured in samples with no expected resistance. In many cases, these paddocks had never had an application of the herbicide to which it was resistant. In some cases, the paddocks had never had any herbicides applied to them at all, however they still hosted resistance to at least one herbicide. experience in the field has also shown this to be true.
This suggests either the populations were naturally resistant to that herbicide type, or resistance has crept into the population either by seed movement in wind, water, stock, wild animals etc, or other means such as pollen movement (as ryegrass is a cross pollinating weed). The latter explanation is unlikely, however in some cases the only reasonable answer. Industry experts suggest that pollen movement most commonly occurs only over short distances (eg 10-20m), and the details behind pollen movements over greater distances and the effects of this on herbicide resistance are beyond the scope of this project.
ACkNOWLeDGeMeNTS This project would not have been initiated without the involvement of NSW DPI District Agronomists and management staff.
The technical expertise in establishing collection and testing protocols, and resistance testing was performed by john Broster, Graham Centre.
AgGrow Agronomy and Research would like to formally acknowledge all farmers involved in the project, and agronomists john Ronan and Heath McWhirter (elders), Peter Hill and Thane Pringle (yenda Producers Coop), Chris Lvitzke (Landmark), Allan jones (Agronomic Business Solutions) and Pat Connell (PC Agronomy) for submitting samples and being involved in the extension of the project.
further contactsBarry Haskins, Ag Grow Agronomist [email protected]
Mat Ryan, Ag Grow Agronomist
Rachael Whitworth, Ag Grow Research Manager [email protected]
john Broster, Research Agronomist Graham Centre [email protected]
18Ag Grow Agronomy & Research | Quantifying herbicide resistance in modern farming systems
Figure 17: effect of boxer gold® on ryegrass establishment.
Figure 18: effect of sakura® on ryegrass establishment.
Figure 19: effect of Treflan on ryegrass establishment. Note some samples still established.
19Ag Grow Agronomy & Research | Quantifying herbicide resistance in modern farming systems
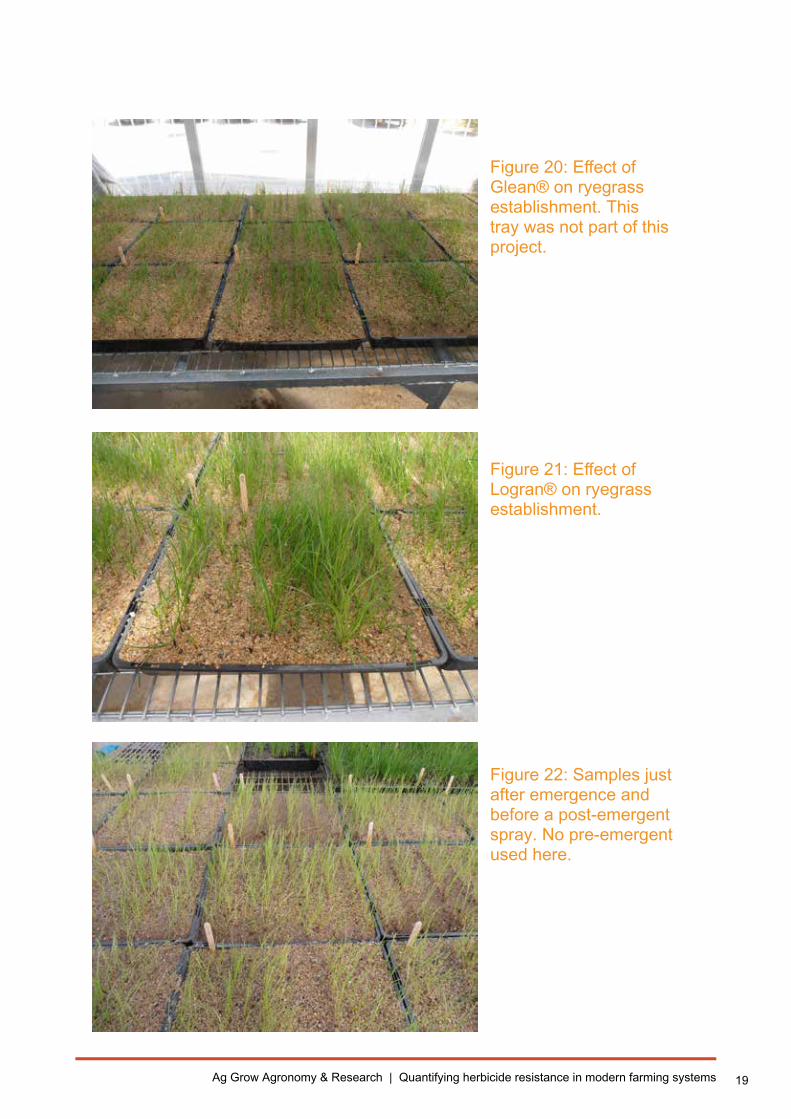
Figure 20: effect of glean® on ryegrass establishment. This tray was not part of this project.
Figure 21: effect of Logran® on ryegrass establishment.
Figure 22: Samples just after emergence and before a post-emergent spray. No pre-emergent used here.
20Ag Grow Agronomy & Research | Quantifying herbicide resistance in modern farming systems
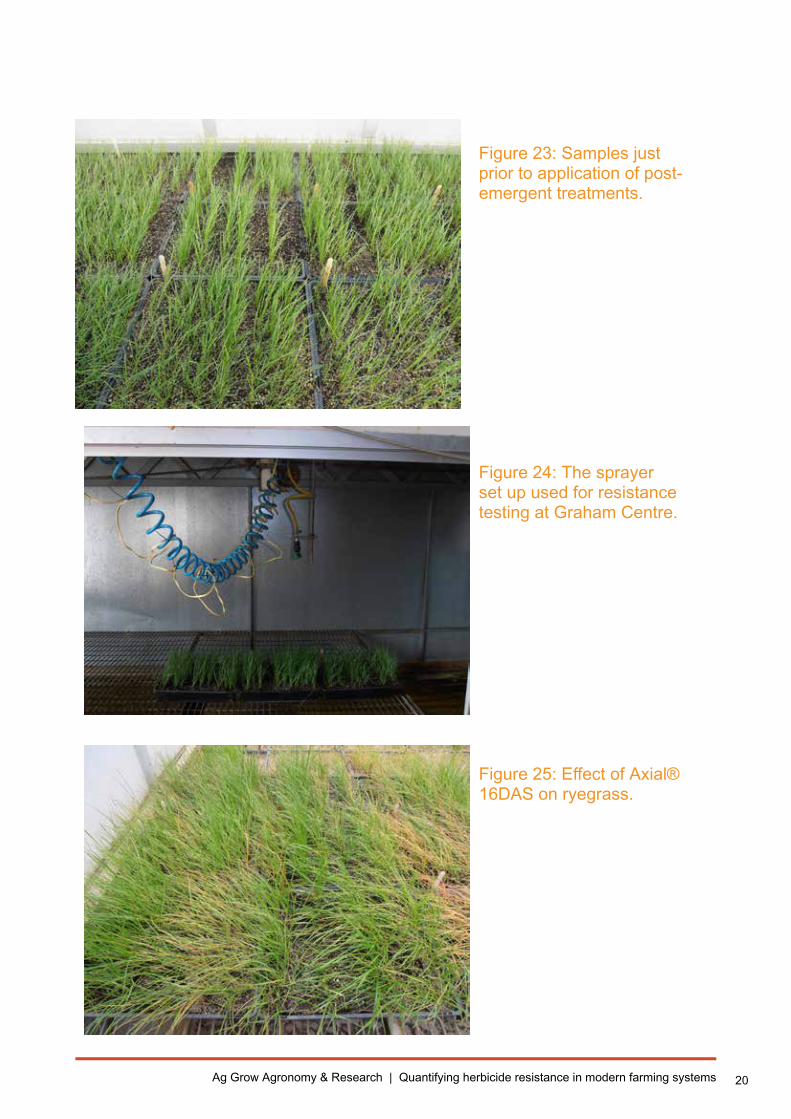
Figure 23: Samples just prior to application of post-emergent treatments.
Figure 24: The sprayer set up used for resistance testing at Graham Centre.
Figure 25: effect of Axial® 16DAS on ryegrass.
21Ag Grow Agronomy & Research | Quantifying herbicide resistance in modern farming systems
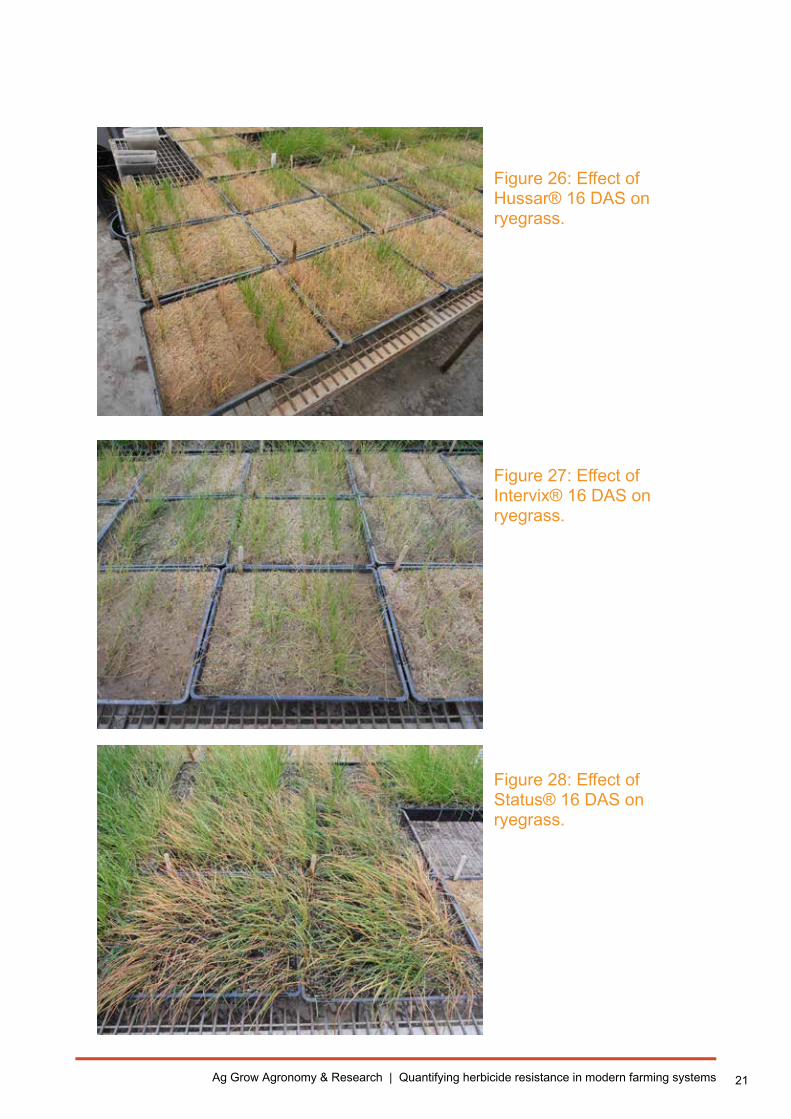
Figure 26: effect of Hussar® 16 DAS on ryegrass.
Figure 27: effect of Intervix® 16 DAS on ryegrass.
Figure 28: effect of Status® 16 DAS on ryegrass.
22Ag Grow Agronomy & Research | Quantifying herbicide resistance in modern farming systems
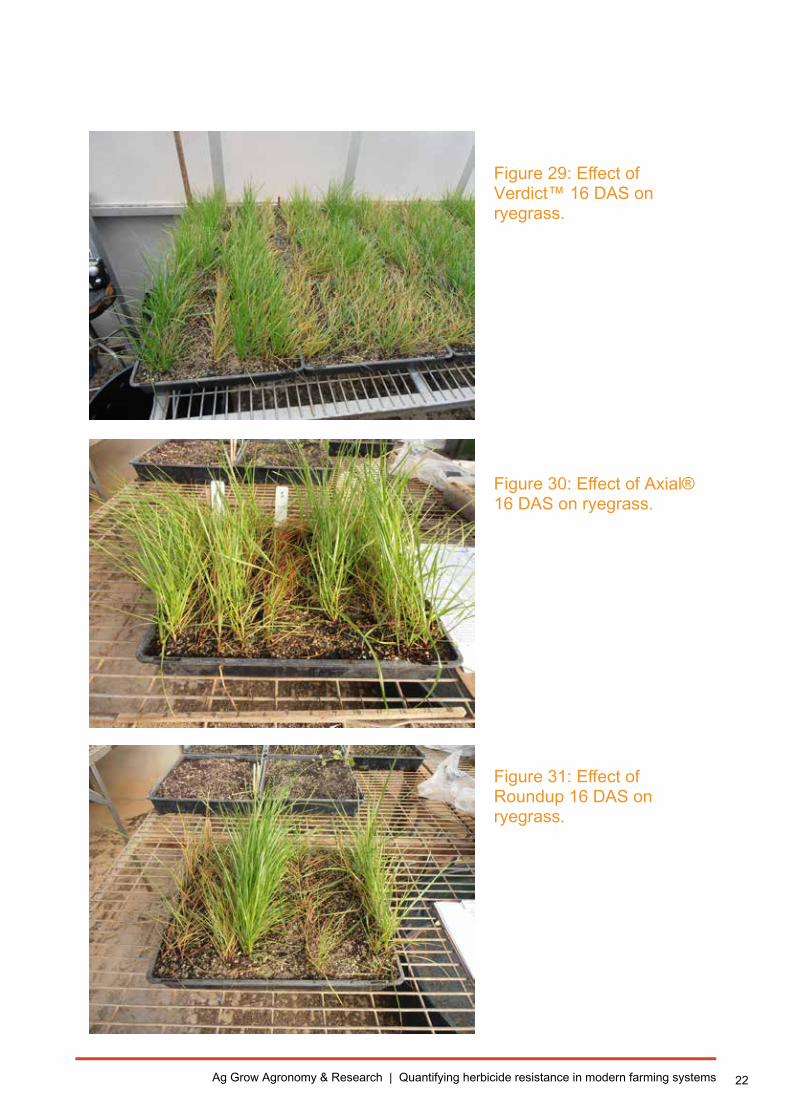
Figure 29: effect of Verdict™ 16 DAS on ryegrass.
Figure 30: effect of Axial® 16 DAS on ryegrass.
Figure 31: effect of Roundup 16 DAS on ryegrass.