Embed Size (px)
Citation preview

Quantifying Market Access in Services
Joseph Francois WTI University of Bern, CEPR, TPRN, CESifo (joint work with:
Bernard Hoekman, EUI Florence, CEPR, TPRN
Miriam Manchin, UCL, TPRN)
This project has received funding from the European Union’s Seventh Framework Programme for research, technological development and demonstration under grant agreement no. 613504
Tokyo, January 2017
Overview
¡ Challenges to quantifying policy ¡ Basic trade and investment data (eBOPs & FATS).
¡ Policy data
¡ Isolating discrimination
¡ Mode overlap
¡ Policy bindings vs actual policy
¡ PRONTO: services data ¡ Updated TSD data
¡ Mapping of TSD data to policy indexes
¡ Gravity based estimates
¡ TiVA based NTB impact indexes

Challenges to quantifying policy
Challenges: targets (what do we want to measure?)
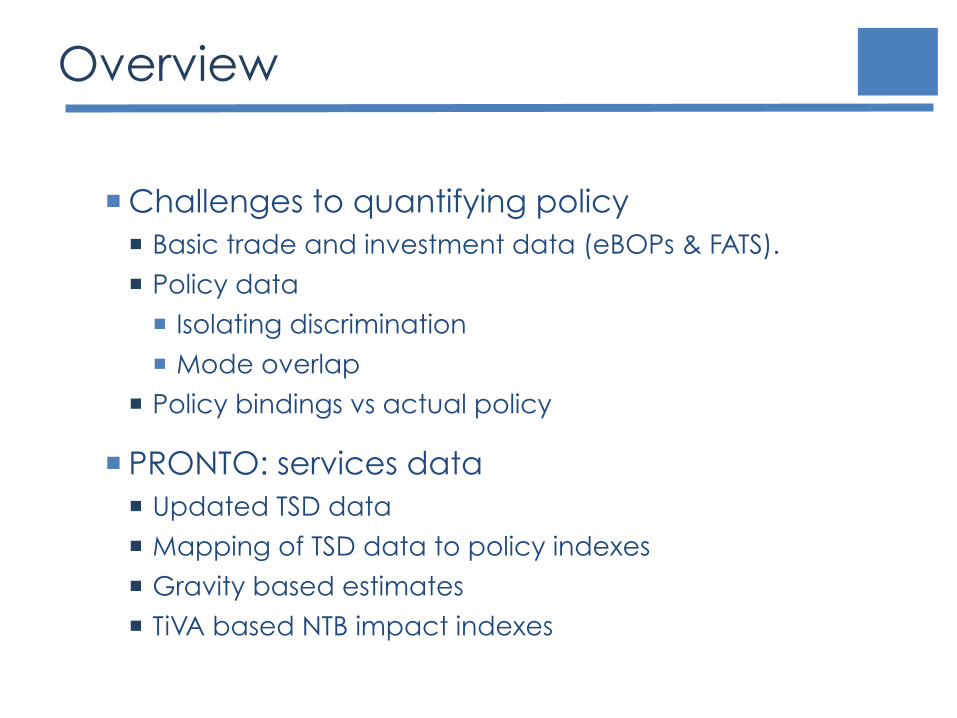
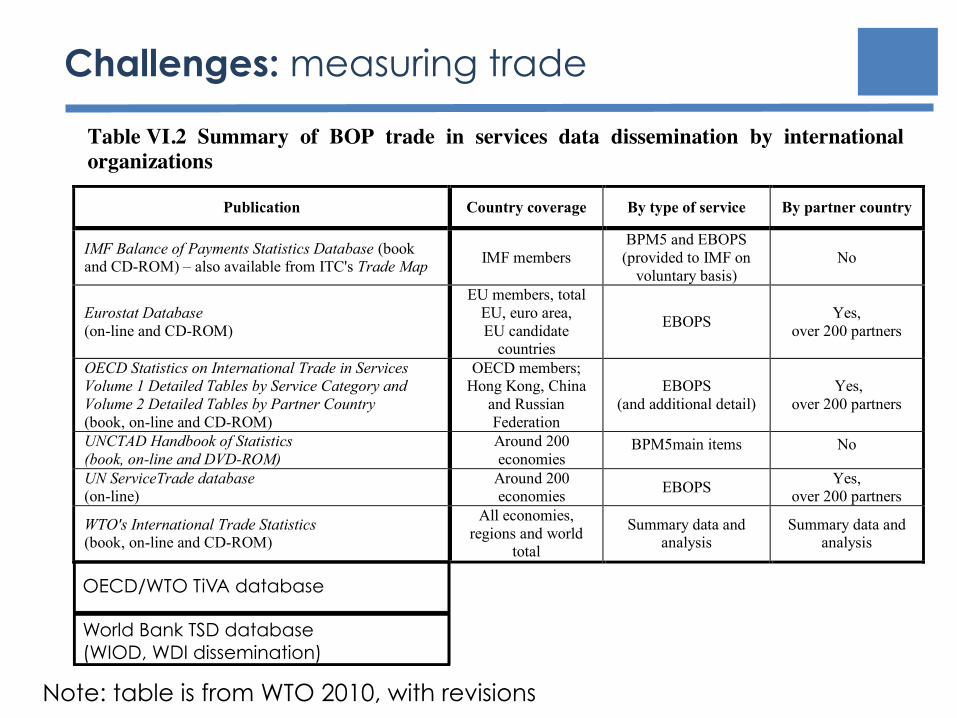
¡ Modes of Delivery and transaction data -- 1,3 Cross border, establishment exports -- 2,4 Movement of persons, factor -- 5 establishment for re-importing
¡ Measurement of barriers -- Firm surveys -- Price comparisons -- Indexes -- Gravity-based inference
¡ How transactions are measured -- FATS (modes 1,3,5) -- FDI data (mode 2) -- BOP based (mode 1)
¡ Market parameters: elasticities, market power
Challenges: measuring trade
Measuring trade in services, a training module for the World Bank
© World Trade Organization 34
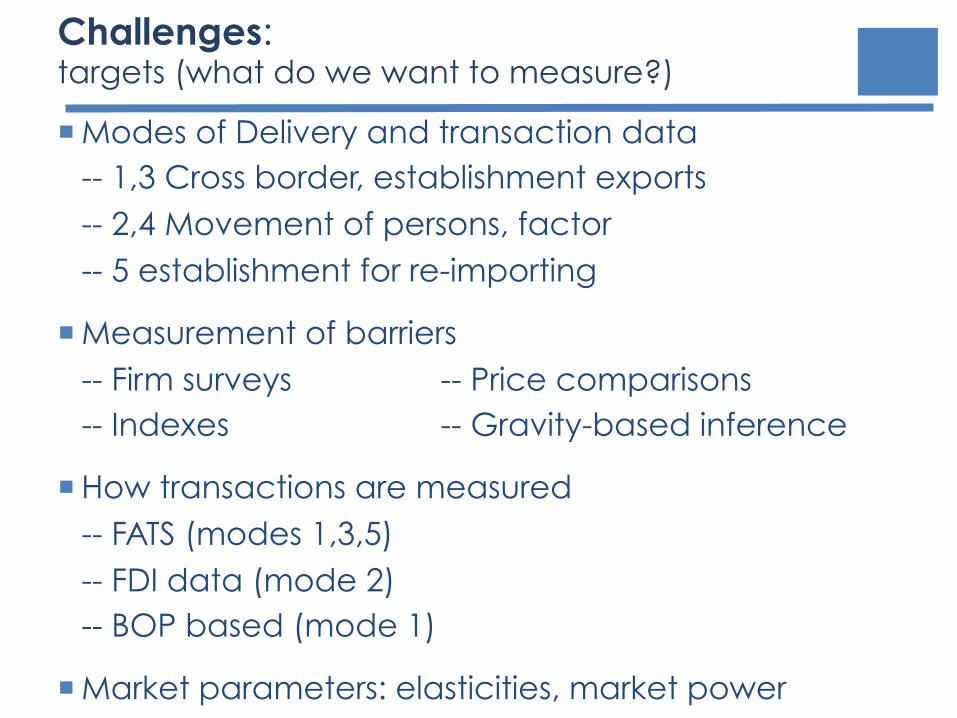
With respect to geographical breakdown, Eurostat and the OECD collect and disseminate data broken down by partner country mainly for their members. The UN also publishes trade in services data, as part of its worldwide collection of data broken down geographically. These data sets make it possible to partially estimate non-reporting countries‟ exports and imports of services by partner on the basis of bilateral (“mirror”) data.
Table VI.2 Summary of BOP trade in services data dissemination by international organizations
Publication Country coverage By type of service By partner country
IMF Balance of Payments Statistics Database (book and CD-ROM) – also available from ITC's Trade Map IMF members
BPM5 and EBOPS (provided to IMF on
voluntary basis) No
Eurostat Database (on-line and CD-ROM)
EU members, total EU, euro area, EU candidate
countries EBOPS Yes,
over 200 partners
OECD Statistics on International Trade in Services Volume 1 Detailed Tables by Service Category and Volume 2 Detailed Tables by Partner Country (book, on-line and CD-ROM)
OECD members; Hong Kong, China
and Russian Federation
EBOPS (and additional detail)
Yes, over 200 partners
UNCTAD Handbook of Statistics (book, on-line and DVD-ROM)
Around 200 economies
BPM5main items No
UN ServiceTrade database (on-line)
Around 200 economies EBOPS Yes,
over 200 partners WTO's International Trade Statistics (book, on-line and CD-ROM)
All economies, regions and world
total Summary data and
analysis Summary data and
analysis
3. COMMERCIAL PRESENCE: INFORMATION AVAILABLE Compared with trade in services in BOP, FATS are still at an early stage of development. Nevertheless, their collection and dissemination are taking an increasing importance at Eurostat, OECD and UNCTAD, fuelled by the growth in national activity in this area. When countries do not yet collect FATS, FDI statistics can provide a useful indication of commercial presence.21 The international and regional organizations are working together to co-ordinate data collection, to improve consistency of data, to avoid duplication of effort and to reduce reporting burdens on countries.
a) Availability and dissemination of FATS Eurostat and OECD use FATS questionnaires inquiring their member countries both inward and outward FATS information, by activity (40-50 services categories of the ISIC Rev.3 classification) and by country of origin/destination of investment. Table VI.3, derived from OECD and Eurostat with additional information available to WTO, shows the relatively good coverage of inward FATS statistics compared to the outward situation which is due to the difficulty for national agencies to collect statistics on operations performed outside the country territory or jurisdiction.22
Many countries cannot provide all requested data. The results of these surveys are published in Measuring Globalisation: The Role of Multinationals in OECD Economies, Volume II: Services. Eurostat has also several publications in the Statistics in Focus series, and publishes available FATS in its reference online database. These data are also collected and used by UNCTAD and WTO. UNCTAD also collects data on FDI (see below) and conducts a direct
21 See Section III. 22 It should be noted that FATS figures, at the detailed activity/geographical breakdown level, are not disseminated due to the requirement in most countries to protect the confidentiality of individual firms’ data (e.g.. when it only concerns a small number of firms or when a small number of firms account for a significant part (e.g. 75%) of the figure).
Note: table is from WTO 2010, with revisions
OECD/WTO TiVA database World Bank TSD database (WIOD, WDI dissemination)
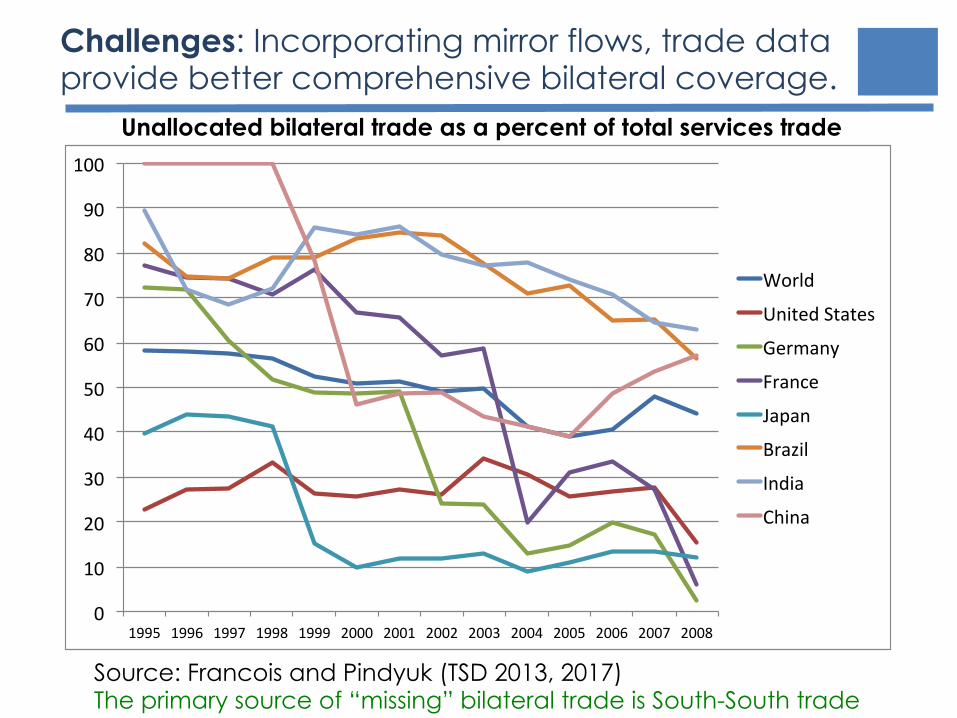
Challenges: Incorporating mirror flows, trade data provide better comprehensive bilateral coverage.
OverviewFirm level perspectives: modes of delivery
Industry and macro perspectivesPolicy Analysis
Data Challenges and Research Challenges
a�liate role in services tradeDirect Tradelinkages and indirect trade
Commercial Services: Share of Unallocated Bilateral Trade
0"
10"
20"
30"
40"
50"
60"
70"
80"
90"
100"
1995" 1996" 1997" 1998" 1999" 2000" 2001" 2002" 2003" 2004" 2005" 2006" 2007" 2008"
World"
United"States"
Germany"
France"
Japan"
Brazil"
India"
China"
source: Francois and Pindyuck 2012
Francois: MiDi Workshop Understanding Cross-Border Service Transactions November 2012 20 / 38
Source: Francois and Pindyuk (TSD 2013, 2017)
Unallocated bilateral trade as a percent of total services trade
The primary source of “missing” bilateral trade is South-South trade
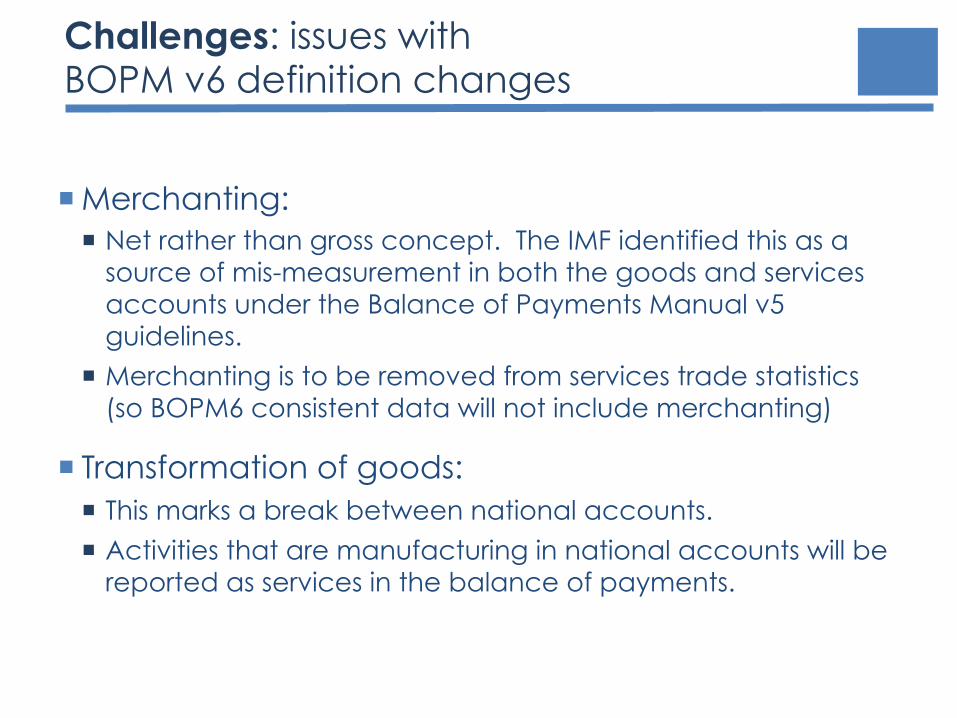
Challenges: issues with BOPM v6 definition changes
¡ Merchanting: ¡ Net rather than gross concept. The IMF identified this as a
source of mis-measurement in both the goods and services accounts under the Balance of Payments Manual v5 guidelines.
¡ Merchanting is to be removed from services trade statistics (so BOPM6 consistent data will not include merchanting)
¡ Transformation of goods: ¡ This marks a break between national accounts.
¡ Activities that are manufacturing in national accounts will be reported as services in the balance of payments.
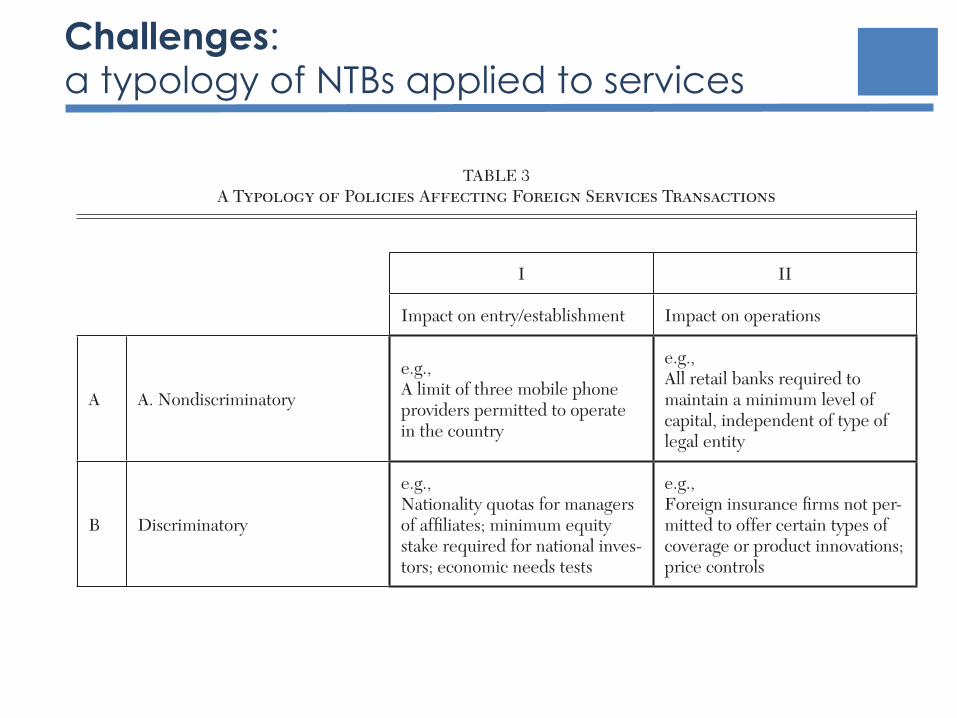
Challenges: a typology of NTBs applied to services Journal of Economic Literature, Vol. XLVIII (September 2010)658
The offshoring of services that is analyzed in these papers mostly concerns so-called business process outsourcing that occurs via mode 1, for which there often may be little in the way of policy restrictions. This is not the case for some of the other major modes of supply, especially modes 3 and 4. A sig-nificant effort has been made in recent years to characterize prevailing policies and their effects, to which we turn next.
4.2 Measuring Openness in Services
Two different approaches have been taken in the recent literature to assess the magni-tude and impact of policy barriers to trade in services. The first involves collection of information on applied policies, converting these into coverage/frequency indicators and using the resulting indices as regressors to explain observed measures of prices or costs (often the price–cost margin is the focus of estimation).18 The second approach is to rely on indirect methods, such as calculation of price–cost margins by sector across countries or gravity regressions to estimate what trade
flows “should be” and back out an estimate of the tariff equivalent of policies from the difference between estimated and observed flows. A well-known problem with indirect approaches is that it is not possible to attri-bute price–cost margins or differences in trade volumes to specific policies. Other fac-tors such as the business cycle and natural barriers to trade/contestability will also play a role. Most of the literature has therefore pursued the first approach, although more use is being made of gravity regressions as more comprehensive data on bilateral trade in services have become available.
As measurement efforts have progressed, it has become clear that there are policies that impact on mercantile aspects of market potential, while not necessarily being dis-criminatory. Related to this, policies can also impact market potential by serving as barriers
TABLE 3A Typology of Policies Affecting Foreign Services Transactions
I II
Impact on entry/establishment Impact on operations
A A. Nondiscriminatory
e.g., A limit of three mobile phone providers permitted to operate in the country
e.g., All retail banks required to maintain a minimum level of capital, independent of type of legal entity
B Discriminatory
e.g., Nationality quotas for managers of affiliates; minimum equity stake required for national inves-tors; economic needs tests
e.g., Foreign insurance firms not per-mitted to offer certain types of coverage or product innovations; price controls
18 Price comparisons of services across countries are generally inappropriate given the characteristics of services—the use of local inputs, extensive product differ-entiation and heterogeneity, etc.
��B)UDQFRLVB����LQGG������ ����������������$0
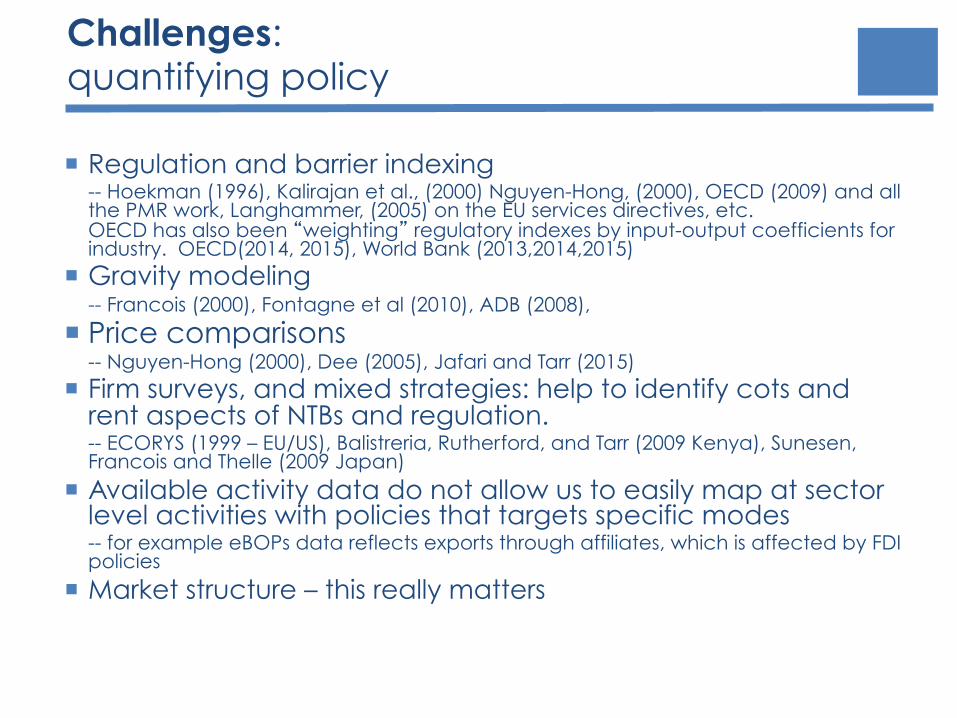
Challenges: quantifying policy ¡ Regulation and barrier indexing
-- Hoekman (1996), Kalirajan et al., (2000) Nguyen-Hong, (2000), OECD (2009) and all the PMR work, Langhammer, (2005) on the EU services directives, etc. OECD has also been “weighting” regulatory indexes by input-output coefficients for industry. OECD(2014, 2015), World Bank (2013,2014,2015)
¡ Gravity modeling -- Francois (2000), Fontagne et al (2010), ADB (2008),
¡ Price comparisons -- Nguyen-Hong (2000), Dee (2005), Jafari and Tarr (2015)
¡ Firm surveys, and mixed strategies: help to identify cots and rent aspects of NTBs and regulation. -- ECORYS (1999 – EU/US), Balistreria, Rutherford, and Tarr (2009 Kenya), Sunesen, Francois and Thelle (2009 Japan)
¡ Available activity data do not allow us to easily map at sector level activities with policies that targets specific modes -- for example eBOPs data reflects exports through affiliates, which is affected by FDI policies
¡ Market structure – this really matters
Challenges: NTBs applied to services overlapping modes
¡ Overlap of modes -- Policy restrictions on affiliates and impact on exports on a BOP basis
-- Extent of sales through affiliates is vaguely measured at best
-- Importance of concentration (market structure) will impact on choice of modes and effectiveness of policy (competition policy, regulation matter)
AUSCAN
CHL
COL
CRI
EUN JPNKOR
MEXMUS
NZL
PAK
PAN
PERTUR
USA
CHN
MYSPHL
THAVNM
020
4060
80tra
de c
ost a
d va
lore
m e
quiva
lent
(% A
VE)
9 65applied STRI
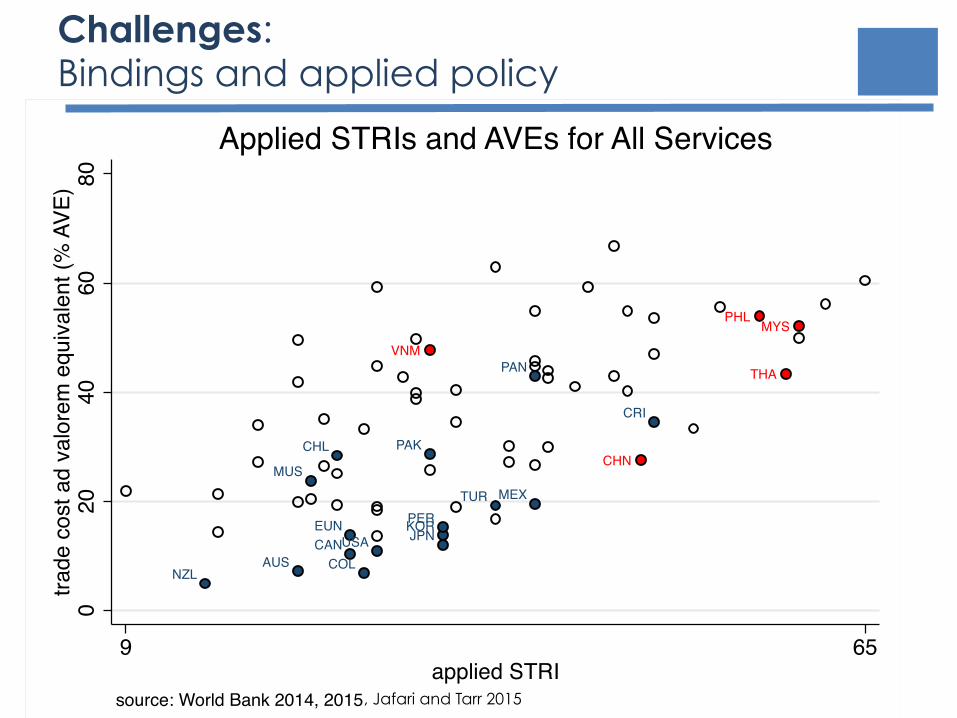
source: World Bank 2014, 2015
Applied STRIs and AVEs for All Services
Challenges: Bindings and applied policy
, Jafari and Tarr 2015
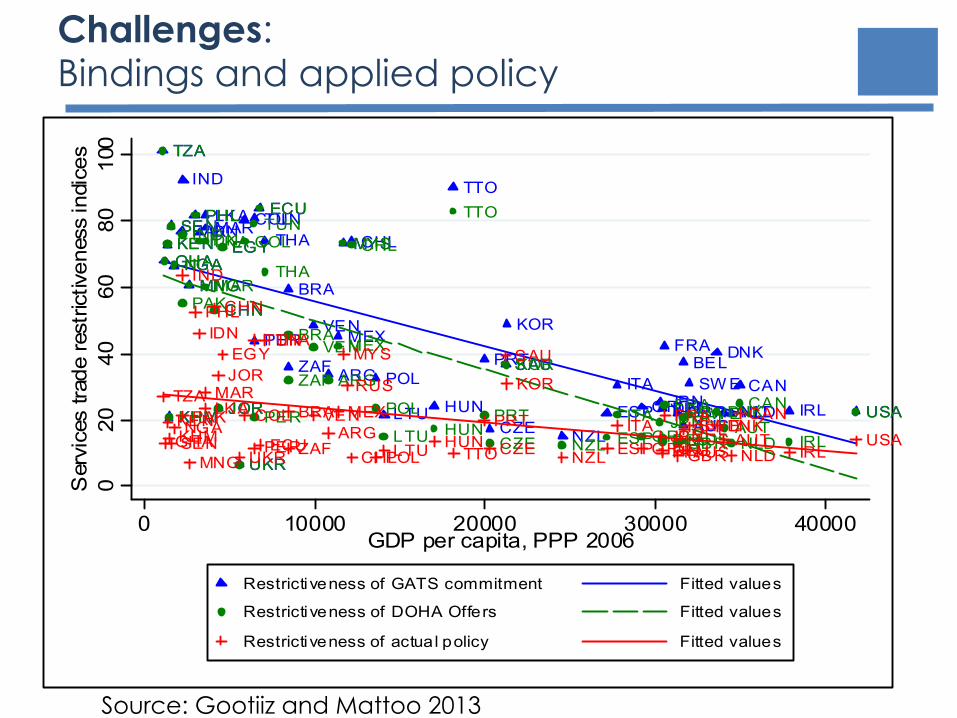
Source: Gootiiz and Mattoo 2013
Figure 5: Restrictiveness of GATS (UR) commitments, Doha offers and actual policy by country
CHN
IND
MYSPAK
PHLIDN THA
KHM
LKA
MNG
ARG
BRA
CHLCOLECU
MEXPERVEN
TTO
JOR
EGYMAR
SAU
TUN
ZAF
NGA
TZA
SEN
GHAKEN
USA
CAN
AUSNZL
JPN
KOR
AUT
BEL
DEU
DNK
GRCFIN
FRA
IRL
ITA
NLD
SW E
GBRESPLTU
PRT
HUN
POL
CZE
UKR
CHN
IND MYS
PAK
PHLIDN
THA
KHM
LKA
MNG
ARG
BRA
CHLCOL
ECU
MEX
PER
VEN
TTO
JOR
EGY
MAR
SAU
TUN
ZAF
NGA
TZA
SEN
GHAKEN
USACAN
AUSNZLJPN
KOR
AUTBELDEU
DNKGRCFIN
FRA
IRL
ITA
NLD
SW E
GBRESPLTUPRT
HUNPOL
CZEUKR
CHN
IND
MYS
PAK
PHLIDN THA
KHM
LKA
MNG
ARGBRA
CHL
COL
ECU
MEX
PER
VEN
TTO
JOREGY
MAR
SAUTUN
ZAFNGA
TZA
SENGHAKEN
USA
CAN
AUSNZLJPN
KOR
AUTBELDEU
DNKGRCFIN
FRA
IRL
ITA
NLD
SW E
GBRESPLTU
PRTHUN
POL CZE
RUS
UKR
8060
4020
010
0S
ervi
ces
trade
rest
rictiv
enes
s in
dice
s
0 10000 20000 30000 40000GDP per capita, PPP 2006
Restrictiveness of GATS commitment Fitted values
Restrictiveness of DOHA Offers Fitted values
Restrictiveness of actual policy Fitted values
At the regional level: -African countries have actual policies that are significantly more liberal than their UR commitments, and comparable to those of OECD countries. Four of the six African countries considered here (Nigeria, Ghana, Senegal, and Tanzania) did not submit Doha offers. The offers of the other two countries, Kenya and South Africa, did not make a significant improvement over their UR commitments in the sectors covered in this survey. During the Uruguay round, most low-income countries did not schedule commitments in their major sectors. For example, Tanzania scheduled only the tourism sector. -Eastern European countries have actual policies, UR commitments, and Doha offers that are much more liberal than those of the other regions. The gap between their commitments and policies, and the gap between their offers and policies is not large. This is because the initial commitments of the ECA countries were quite liberal and ambitious (see for example the accession schedule of Ukraine). In the Doha Round, Poland, Hungary, Czech Republic, and Lithuania did not make independent offers, but were covered by the offer of the European Community (EC). -The OECD countries and those in the LAC region have actual policies which are more liberal than their Uruguay Round commitments. Their Doha offers improve somewhat on their UR commitments and narrow the gap with actual policies. The offer gap in the LAC region remains very large, while the offer gap is small for the OECD.
9
Challenges: Bindings and applied policy
Challenges: firm demographics and market structure
010
020
030
040
0Fr
eque
ncy
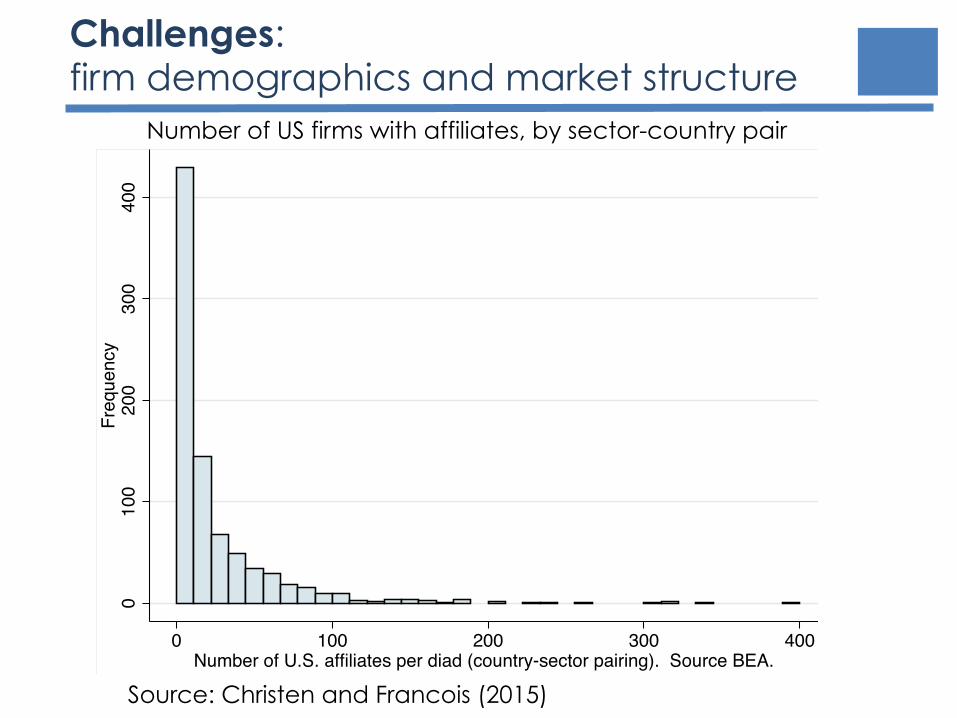
0 100 200 300 400Number of U.S. affiliates per diad (country-sector pairing). Source BEA.
Number of US firms with affiliates, by sector-country pair
Source: Christen and Francois (2015)
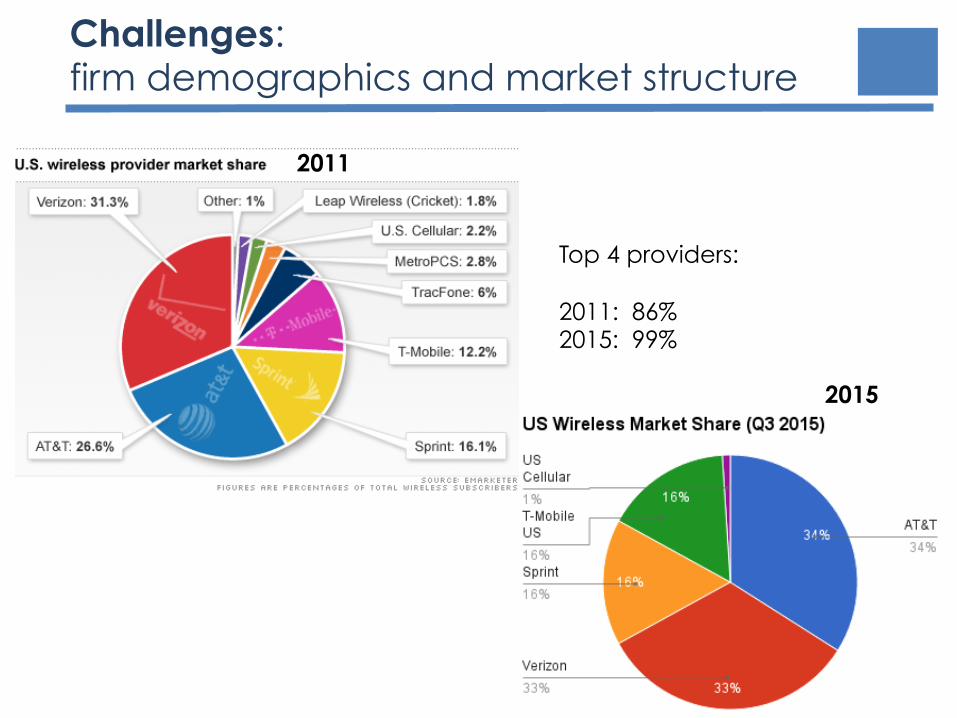
2011
2015
Top 4 providers: 2011: 86% 2015: 99%
Challenges: firm demographics and market structure
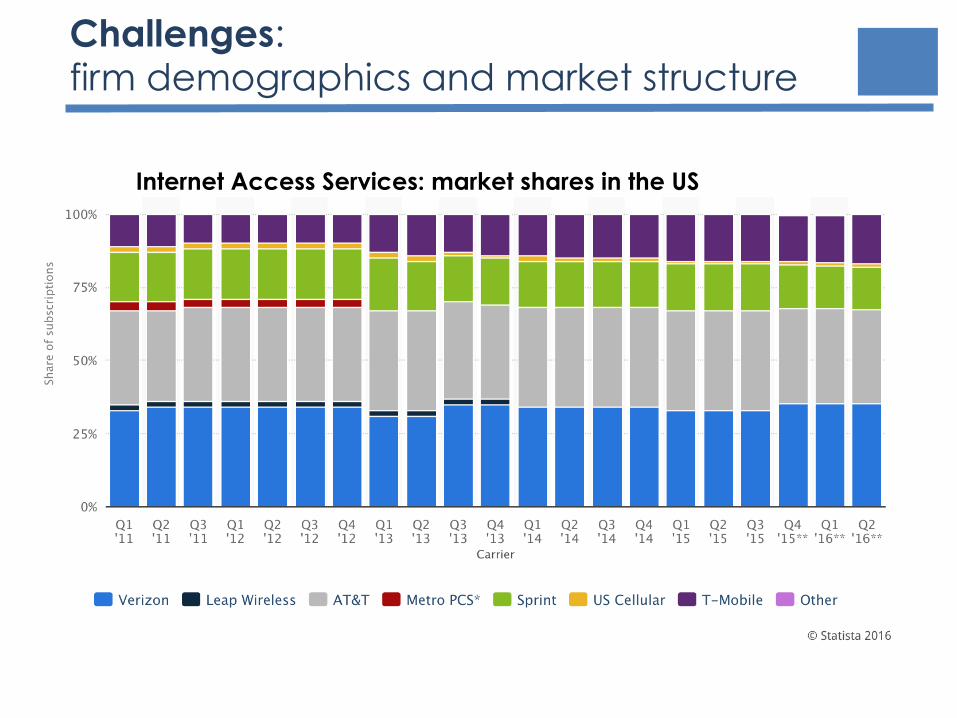
Challenges: firm demographics and market structure
Internet Access Services: market shares in the US
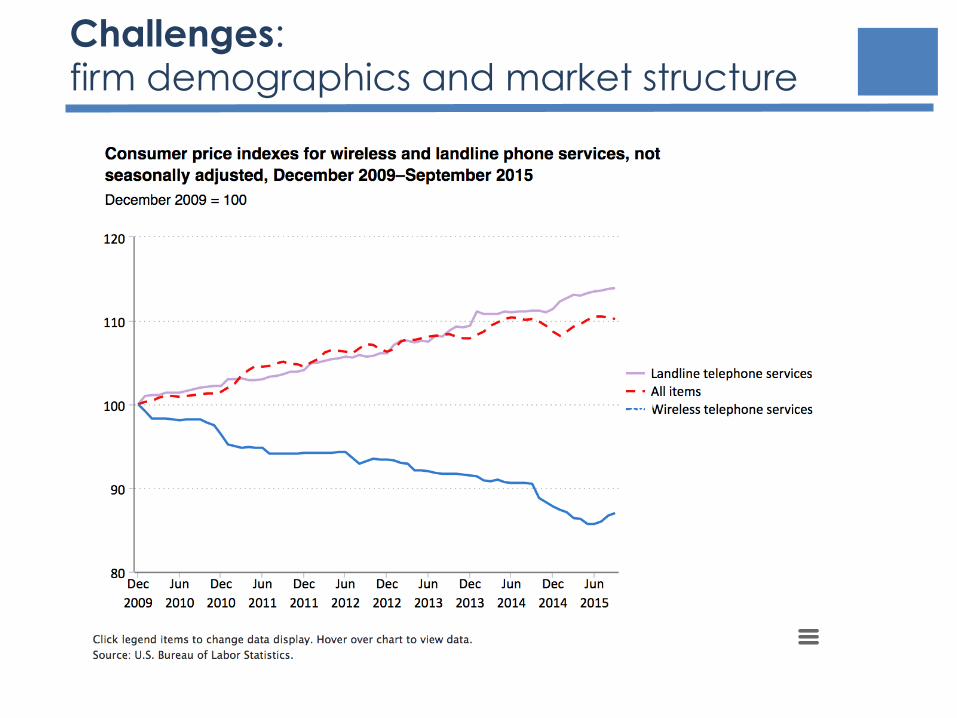
Challenges: firm demographics and market structure
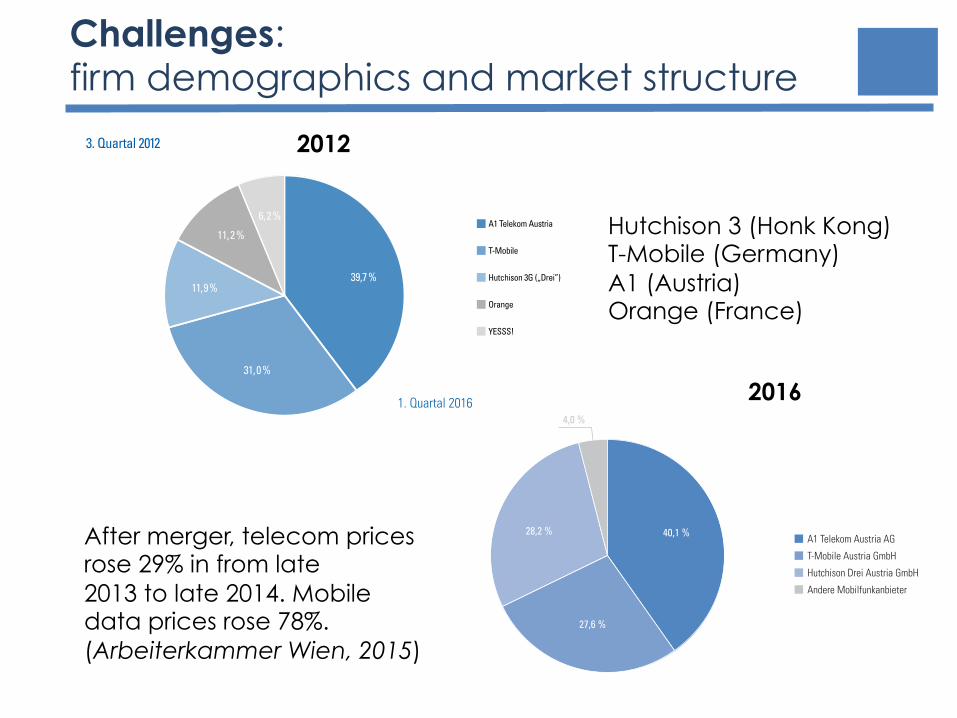
Challenges: firm demographics and market structure
1 | MOBILFUNK
RTR Telekom Monitor 1. Quartal 2016 (Ausgabe 3/2016)
14
Marktanteile der Mobilfunkanbieter in ÖsterreichDREI ALS NEUE NUMMER ZWEI
Die Grafik stellt die Marktanteile der in Österreich tätigen Mobilfunkbetreiber, berechnet auf Basis ihrer Teilnehmer-stände (Anzahl der genutzten SIM-Karten), dar.
■■ A1 kam im 1. Quartal 2016 auf einen Marktanteil von 40,1 % (5,45 Mio. Kundinnen und Kunden), T-Mobile hielt einen Marktanteil von 27,6 % (3,75 Mio. Kundinnen und Kunden), Hutchison erzielte einen Anteil von 28,2 % (3,83 Mio. Kundinnen und Kunden). Damit weist Hutchison erstmals mehr Kundinnen und Kunden auf als T-Mobile und findet sich somit erstmals an zweiter Stelle hinter Marktführer A1.
■■ Unter der Kategorie „andere Mobilfunkanbieter“ sind MVNOs und Airtime Reseller (siehe Glossar) subsummiert, die bei der RTR die Erbringung von Mobilfunkdiensten angezeigt haben und über eine entsprechende Allgemeingenehmigung verfügen. Mit 546.000 Kundinnen und Kunden hatten diese im 1. Quartal 2016 zusammen einen Marktanteil von 4,0 %.
4,0 %
28,2 %
27,6 %
40,1 %
Hutchison Drei Austria GmbH
A1 Telekom Austria AG
1. Quartal 2016
T-Mobile Austria GmbH
Andere Mobilfunkanbieter
4 8
RTR Telekom Monitor 1 / 2 013
3 | M O B I L F U N K
Die Grafik stellt die Marktanteile der in Österreich tätigen Mobilfunkbetreiber, berechnet auf Basis ihrer Teilnehmer-stände, dar.
■ Der Marktführer am Mobilfunkmarkt A1 Telekom Austria kommt im 3. Quartal des Jahres auf einen Marktanteil von 39,7 %, das sind 0,3 Prozentpunkte weniger als im Quartal davor. In absoluten Zahlen kommt A1 Telekom Austria auf 5,31 Mio. Kunden (plus 23.300 gegenüber dem 2. Quartal 2012).
■ Dahinter folgt mit einem Marktanteil von 31,0 % T-Mobile, die gegenüber dem 2. Quartal 0,2 Prozent-punkte an Marktanteil verloren hat. 4,14 Mio. Kunden hatte T-Mobile im 3. Quartal 2012, das sind rund 21.600 mehr als im Quartal davor.
■ Hutchison 3G hatte im 3. Quartal des Jahres einen Marktanteil von 11,9 %, um 0,6 Prozentpunkte mehr als im Quartal davor. Möglich wurde das durch 107.900 neue Kunden, damit zählt Hutchison 3G knapp 1,6 Mio. Kunden.
■ Orange (aufgrund der Fusion mit Hutchison 3G und Übernahme von YESSS! durch A1 Telekom Austria ohne YESSS! dargestellt) verzeichnet ein Plus von 14.200 Kunden und einen Marktanteil von 11,2 %, das entspricht 1,5 Mio. Kunden.
■ YESSS! kommt im 3. Quartal auf rund 829.000 Kunden und einen Marktanteil von 6,2 %. Gegenüber dem vorigen Quartal konnte YESSS! rund 6.500 Kunden dazugewinnen.
Marktanteile der Mobilfunkanbieter in Österreich¨ (NOCH) KAUM VERÄNDERUNGEN AM MOBILFUNKMARKT
11,2%
39,7%
31,0%
3. Quartal 2012
Orange
Hutchison 3G („Drei”)
T-Mobile
A1 Telekom Austria
11,9%
6,2%
YESSS!
Hutchison 3 (Honk Kong) T-Mobile (Germany) A1 (Austria) Orange (France)
After merger, telecom prices rose 29% in from late 2013 to late 2014. Mobile data prices rose 78%. (Arbeiterkammer Wien, 2015)
2012
2016

PRONTO: data and dissemination
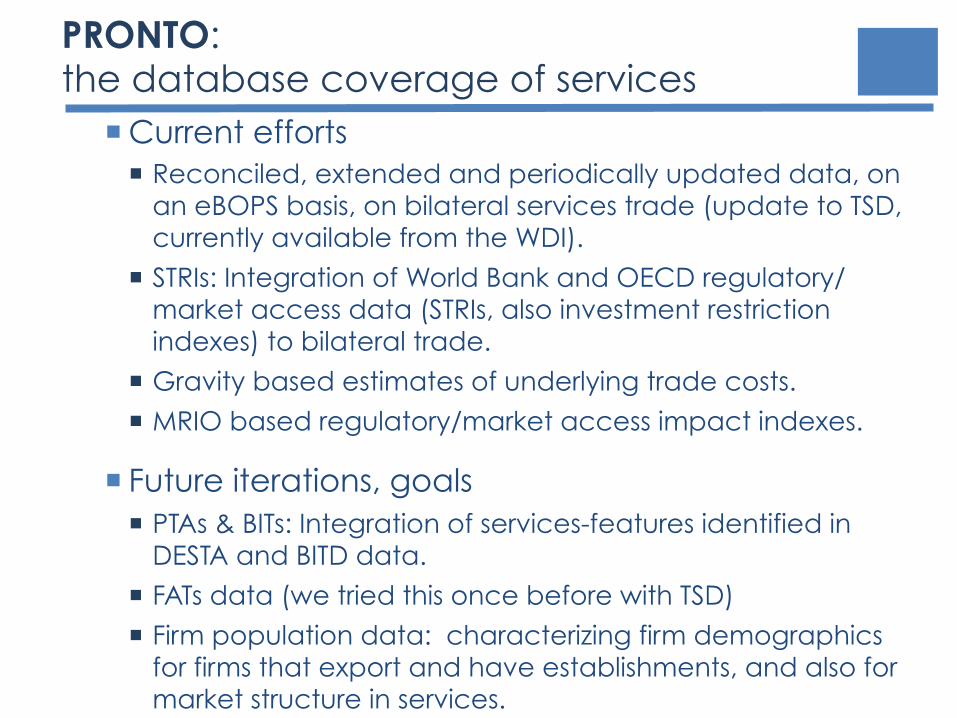
PRONTO: the database coverage of services
¡ Current efforts ¡ Reconciled, extended and periodically updated data, on
an eBOPS basis, on bilateral services trade (update to TSD, currently available from the WDI).
¡ STRIs: Integration of World Bank and OECD regulatory/market access data (STRIs, also investment restriction indexes) to bilateral trade.
¡ Gravity based estimates of underlying trade costs.
¡ MRIO based regulatory/market access impact indexes.
¡ Future iterations, goals ¡ PTAs & BITs: Integration of services-features identified in
DESTA and BITD data.
¡ FATs data (we tried this once before with TSD)
¡ Firm population data: characterizing firm demographics for firms that export and have establishments, and also for market structure in services.