Embed Size (px)
Citation preview

Leakage 2005 - Conference Proceedings Page 1
Quantifying Meter Under-Registration Caused by the Ball Valves of Roof Tanks
Quantifying Meter Under-Registration Caused by the Ball Valves of Roof Tanks (for Indirect Plumbing Systems) A Rizzo*, J Cilia**
* 24, Triq id-Dielja, Attard, BZN04, Malta [email protected]
** University of Malta, [email protected]
Keywords: Apparent Water Loss, Meter Under-Registration, Apparent Loss Indicator, ALI, Ball valve.
Abstract
The concept of Real and Apparent Water Loss has been constantly advocated by the International Water Association in a drive to clarify the different components through which a water utility will produce water but not receive corresponding revenues. The difference between a Real and an Apparent Water Loss is quite basic: A Real Loss is water lost through a distribution network as leakage, hence is quite ‘really’ a loss as no one stands to gain from it! An Apparent Loss consists of water that is produced, distributed and ultimately consumed, but not paid for by the consumer. The paper shall review the four components forming Apparent Water Losses, shall detail an in-depth case study aimed at quantifying one of these four components (for a particular scenario), and shall conclude with a proposal for a more robust performance indicator for Apparent Water Loss control. The case study in question was carried out with the assistance of the University of Malta and the Maltese national water utility; the Water Services Corporation.
Objectives of the Paper
The paper focuses upon three objectives:
1) To revise the concept and the four inter-related components that make up Apparent Water Losses. To focus more specifically upon one particular component; meter under-registration.
2) To describe a methodology for quantifying the volume and cost of meter under-registration caused by the low flows induced by roof tank ballvalves. To review the results of this methodology, applied to the national Maltese water authority.
3) To propose a performance indicator (PI) that can be realistically used to measure, manage and compare Apparent Water Losses.

Leakage 2005 - Conference Proceedings Page 2
Quantifying Meter Under-Registration Caused by the Ball Valves of Roof Tanks
Economic Target for
Apparent Loss
Existing Apparent Loss
Meter U
nder-R
egistrationW
ater Theft
Meter ReadingErrors
Water Accounting Errors
Economic Target for
Apparent Loss
Existing Apparent Loss
Meter U
nder-R
egistrationW
ater Theft
Meter ReadingErrors
Water Accounting Errors
Figure 1: The 4 components of Apparent Water Loss
M
eter Under-
Registration
Existing Loss
Target Loss
Meter U
nder-R
egistration
Existing Loss
Target Loss
Figure 2: A focus on meter under-registration
The Four Components of Apparent Water Losses
As shown in Fig.1, Apparent Water Losses are made up of four components: The first, meter under-registration, is possibly the easiest to picture, whereby a revenue meter will not accurately measure the water supplied to a household. Various types of water meters exist, with each type boasting different properties. The most common small revenue meters are the volumetric, single-jet and multi-jet models. A second Apparent Loss is water theft, whereby water is stolen from a water distribution network, often via a meter bypass or through an illegal service connection. A third Apparent Loss is that of meter reading or collecting errors, whilst a fourth Apparent Loss is caused by water billing and accounting errors. The conceptual outline in Fig.1 shows how a water utility should strive to reduce Apparent Losses to an economic minimum by simultaneously controlling all four components. The focus of this paper shall be on one specific loss; that of meter under-registration (Fig. 2), with a particular focus on the roof tank ballvalve effect on a meter. Whilst the case study in question utilized the most accurate ‘volumetric’ type water meter, the subsequent section on a proposed Apparent Water Loss performance indicator takes all water meter models (and related performances) into due consideration.

Leakage 2005 - Conference Proceedings Page 3
Quantifying Meter Under-Registration Caused by the Ball Valves of Roof Tanks
3.75Lt/Hr 7.5Lt/Hr 1m3/Hr 2m3/Hr
Class D (Qn=1.0m3/Hr) Meter
Accuracy
Flow
5% under-recording
5% over-recording
2% over-recording
2% under-recording
3.75Lt/Hr 7.5Lt/Hr 1m3/Hr 2m3/Hr
Class D (Qn=1.0m3/Hr) Meter
Accuracy
Flow
5% under-recording
5% over-recording
2% over-recording
2% under-recording
3.75Lt/Hr 7.5Lt/Hr 1m3/Hr 2m3/Hr
Class D (Qn=1.0m3/Hr) Meter
Accuracy
Flow
5% under-recording
5% over-recording
2% over-recording
2% under-recording
3.75Lt/Hr 7.5Lt/Hr 1m3/Hr 2m3/Hr
Class D (Qn=1.0m3/Hr) Meter
Accuracy
Flow
5% under-recording
5% over-recording
2% over-recording
2% under-recording
Figure 3: The performance curve for a Class D (Qn=1.0m3/Hr) volumetric meter.
Figure 4: The piston-chamber mechanism of the meter.
The performance of any type of meter can be described by looking at 4 main points along a flow range. The first point is the starting flow Qs (3.75Lt/Hour in the above graph) at which point the meter will start to perform within a fairly acceptable level of accuracy, usually at 5% under/over recording. The second point is the minimum accurate flow Qmin (twice the starting flow), at which point the meter will reach its maximum accuracy, usually at 2%. The third point is the meter’s nominal flow Qn, this being half the maximum flow Qmax. From the above graph Qn = 1m3/Hour and Qmax = 2m3/Hour. Above the maximum flow the meter will perform erratically and damage to the meter mechanism is possible. Essentially the nominal flow Qn marks the mid-point of the meter’s performance curve.
The class of a water meter, be it A, B, C or D, is a means utilized by BS5728 and the similar ISO4064 standards to classify the flow characteristics of a meter. Simply put, one must first specify the nominal flow Qn of a meter (its expected mid-range). Class D requires that the starting flow of the meter must be 0.0075 times this Qn value, whilst class C requires that the starting flow of the meter must be 0.015 times the Qn value. In fact, stating a class without specifying the nominal flow makes no sense whatsoever! The model utilized in the following case study is thus Class D at a Qn of 1.0m3/Hour, giving a starting flow of 3.75Lt/Hr.
A second concept that must be explained is the effect of an indirect plumbing system on water meter performance. An indirect plumbing system (see Fig.11) usually consists of the household kitchen fed straight off the inlet mains pressure whilst the rest of the household is fed via gravity from a roof tank. It is the slow closure of the roof tank ballvalve that induces flows that are lower than the starting flow of the water meter, as shown in Fig. 5. The larger the surface area of the roof tank or the higher the starting flow Qs of the meter, the larger will be the resulting meter under-registration.

Leakage 2005 - Conference Proceedings Page 4
Quantifying Meter Under-Registration Caused by the Ball Valves of Roof Tanks
Flow recorded by meter, at a flow above starting flow
Flow not recorded by meter, at a flow below starting flow
Water being consumed within household
Flow (Lt/Hour)
Time (Minutes)10 20 30 400
10
20
30
Flow recorded by meter, at a flow above starting flow
Flow not recorded by meter, at a flow below starting flow
Water being consumed within household
Flow (Lt/Hour)
Time (Minutes)10 20 30 400
10
20
30
Figure 5: Low flows induced by slow closure of a ballvalve Figure 6: Graphical view of valve
The Research Methodology
The case study, intensively carried out on 3 averagely sized households in Malta, aimed at answering the following research questions:
‘Can the under-registration value (for meter A, Fig.11) be measured by monitoring the inlet and outlet of the roof tank (meters B and C, Fig.11), and can this value be eliminated through an alternative system to a standard ballvalve? Furthermore, how much money is being lost through this under-registration, given highly accurate new meters?’
The methodology adopted was to first monitor the system with the household roof tank controlled by an existing ballvalve. New inlet and outlet Class D (Qn = 1.0m3/Hr) meters (meters B and C, Fig.11) were data logged at 5min intervals using pulse count mode, and over weekly time spans. The meters provided a normally-closed pulse per ½ litre of water measured. The weekly timeframes and pulse count logging mode ensured that whatever the meters measured was correctly captured by the data loggers. For all 3 households tested, the inlet meter B constantly under-recorded between 5 to 9% of the water measured by the outlet meter C (see Fig.12, Appendix 1 and Appendix 2). The reason being that whilst the outlet meter was measuring fairly high flows determined by the household’s consumption patterns, the inlet meter was attempting to measure the very low flows induced by the tank’s ballvalve.
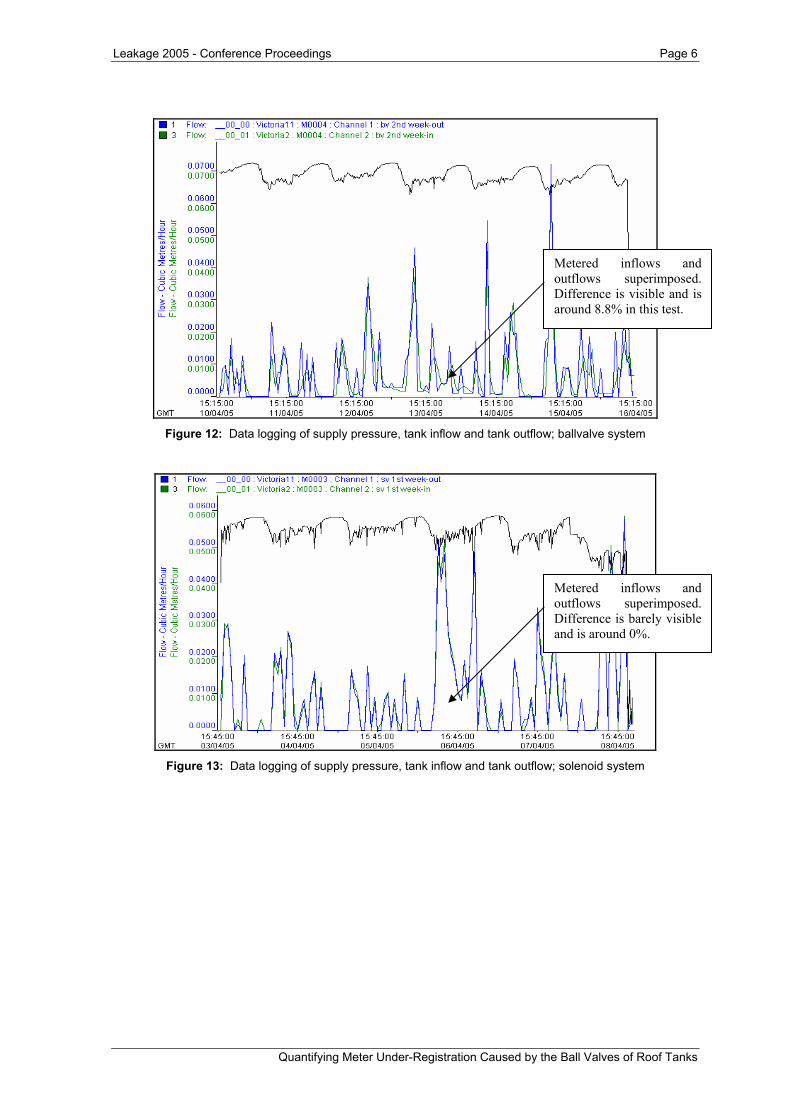
The next step was to replace the ballvalve with an innovative solenoid system (Fig. 8) controlled by a non-intrusive capacitive sensor (Fig. 7). This sensor uses the water itself as the second plate of the capacitor. The system was designed to allow water through the solenoid only at flows above Qmin. The result answered the first research question; the flows through the inlet meter B and outlet meter C coincided (Fig. 13), meters A and B both now registering an increase in meter readings of between 5 to 9%. Fig. 9 shows the test layout.
Ball or Float Valve

Leakage 2005 - Conference Proceedings Page 5
Quantifying Meter Under-Registration Caused by the Ball Valves of Roof Tanks
Figure 7: The capacitive sensor used to control tank level Figure 8: Latching solenoid valve
used to replace the ballvalve
Consumption Pattern for Sample Household
Flushing 46%
Bathroom Tap Water
29%
Washroom Tap Water
7%
Washing Machine
3%
Shower9%
Kitchen6%
Figure 9: The complete layout, metered & logged Figure 10: Recorded consumption patterns
The test methodology adopted was to meter (using highly accurate low flow meters) and data log the inflows of water into the complete household, the roof tank inlet, and the roof tank outlet, for a) roof tank controlled by a common ballvalve and b) roof tank controlled by a solenoid valve. The solenoid valve and capacitive sensor would allow for fast tank filling.
Average roof tank size: 1m3
KitchenBathrooms
Washroom
Flow of water
Garden
10% of consumption directly to kitchen 90% of
consumption from tank to rest of house
Data LoggerPulse Count5min interval
Meter A Meter B
Meter C
Average roof tank size: 1m3
KitchenBathrooms
Washroom
Flow of water
Garden
10% of consumption directly to kitchen 90% of
consumption from tank to rest of house
Data LoggerPulse Count5min interval
Average roof tank size: 1m3
KitchenBathrooms
Washroom
Flow of water
Garden
10% of consumption directly to kitchen 90% of
consumption from tank to rest of house
Data LoggerPulse Count5min interval
Meter A Meter B
Meter C
Figure 11: The test layout, meters used were new Class D (Qn=1.0m3/Hr) volumetric type
Leakage 2005 - Conference Proceedings Page 6
Quantifying Meter Under-Registration Caused by the Ball Valves of Roof Tanks
Figure 12: Data logging of supply pressure, tank inflow and tank outflow; ballvalve system
Figure 13: Data logging of supply pressure, tank inflow and tank outflow; solenoid system
Metered inflows and outflows superimposed. Difference is barely visible and is around 0%.
Metered inflows and outflows superimposed. Difference is visible and is around 8.8% in this test.
Leakage 2005 - Conference Proceedings Page 7
Quantifying Meter Under-Registration Caused by the Ball Valves of Roof Tanks
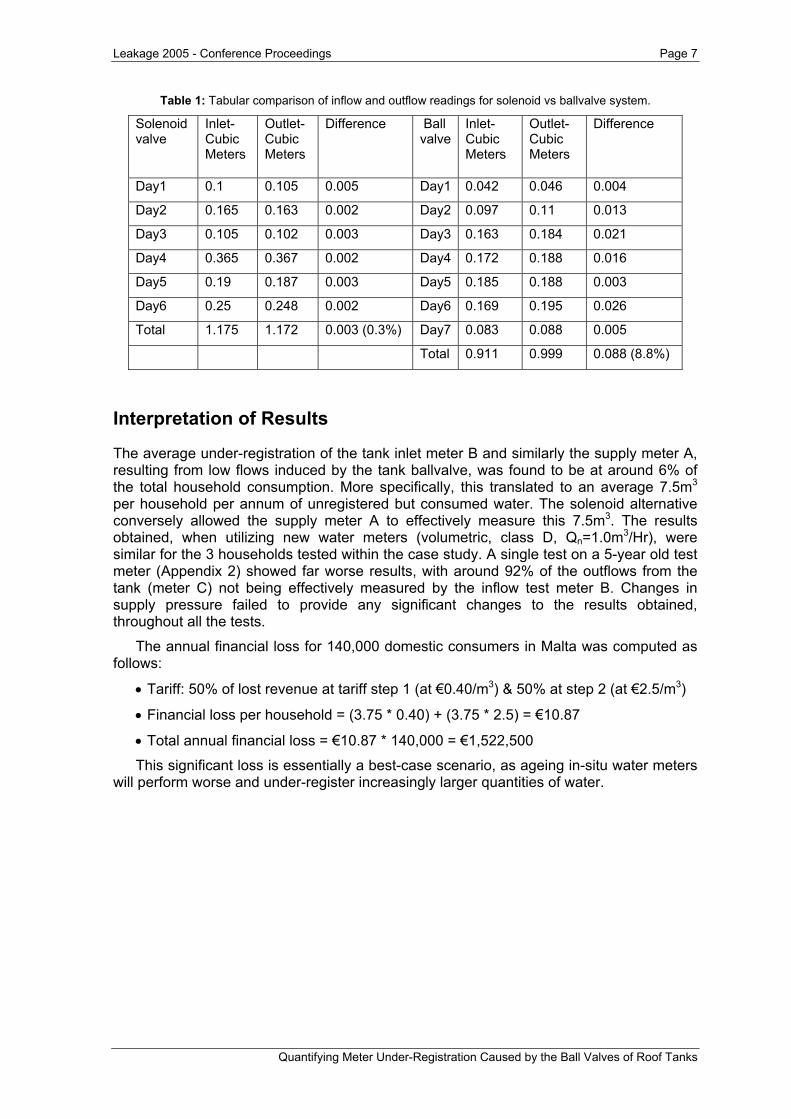
Table 1: Tabular comparison of inflow and outflow readings for solenoid vs ballvalve system.
Solenoid valve
Inlet- Cubic Meters
Outlet- Cubic Meters
Difference Ball valve
Inlet- Cubic Meters
Outlet- Cubic Meters
Difference
Day1 0.1 0.105 0.005 Day1 0.042 0.046 0.004
Day2 0.165 0.163 0.002 Day2 0.097 0.11 0.013
Day3 0.105 0.102 0.003 Day3 0.163 0.184 0.021
Day4 0.365 0.367 0.002 Day4 0.172 0.188 0.016
Day5 0.19 0.187 0.003 Day5 0.185 0.188 0.003
Day6 0.25 0.248 0.002 Day6 0.169 0.195 0.026
Total 1.175 1.172 0.003 (0.3%) Day7 0.083 0.088 0.005
Total 0.911 0.999 0.088 (8.8%)
Interpretation of Results
The average under-registration of the tank inlet meter B and similarly the supply meter A, resulting from low flows induced by the tank ballvalve, was found to be at around 6% of the total household consumption. More specifically, this translated to an average 7.5m3 per household per annum of unregistered but consumed water. The solenoid alternative conversely allowed the supply meter A to effectively measure this 7.5m3. The results obtained, when utilizing new water meters (volumetric, class D, Qn=1.0m3/Hr), were similar for the 3 households tested within the case study. A single test on a 5-year old test meter (Appendix 2) showed far worse results, with around 92% of the outflows from the tank (meter C) not being effectively measured by the inflow test meter B. Changes in supply pressure failed to provide any significant changes to the results obtained, throughout all the tests.
The annual financial loss for 140,000 domestic consumers in Malta was computed as follows:
• Tariff: 50% of lost revenue at tariff step 1 (at €0.40/m3) & 50% at step 2 (at €2.5/m3)
• Financial loss per household = (3.75 * 0.40) + (3.75 * 2.5) = €10.87
• Total annual financial loss = €10.87 * 140,000 = €1,522,500
This significant loss is essentially a best-case scenario, as ageing in-situ water meters will perform worse and under-register increasingly larger quantities of water.
Leakage 2005 - Conference Proceedings Page 8
Quantifying Meter Under-Registration Caused by the Ball Valves of Roof Tanks
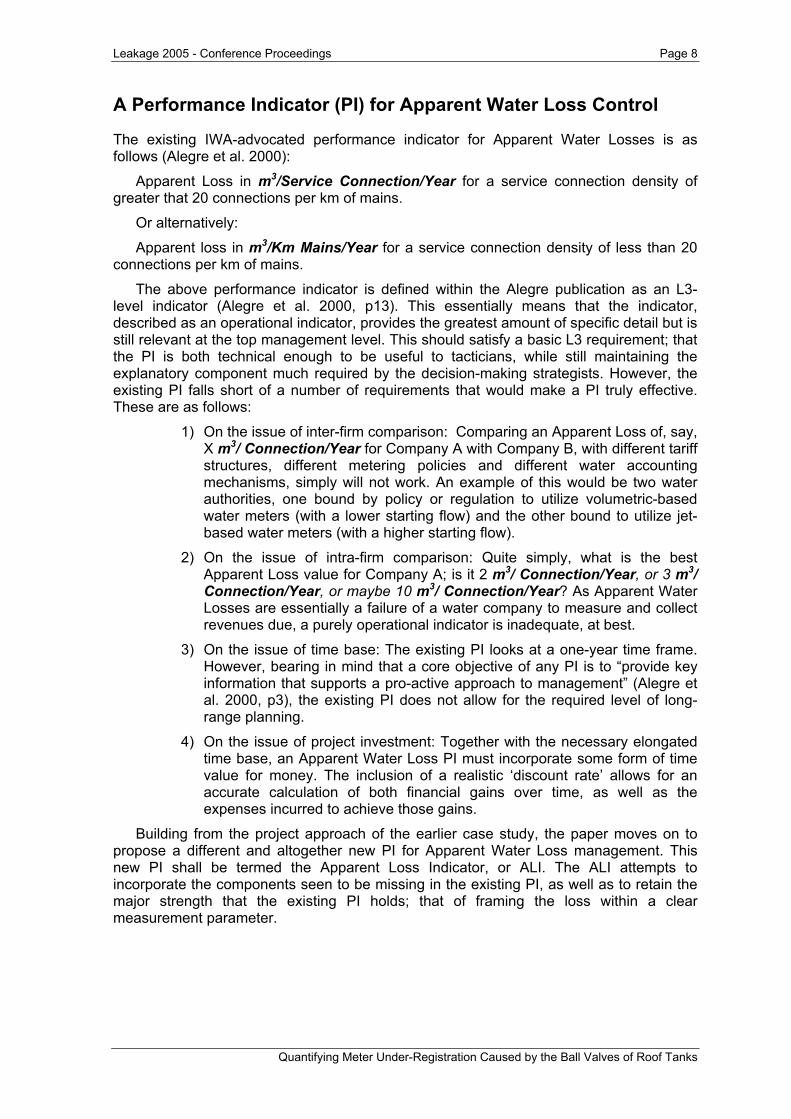
A Performance Indicator (PI) for Apparent Water Loss Control
The existing IWA-advocated performance indicator for Apparent Water Losses is as follows (Alegre et al. 2000):
Apparent Loss in m3/Service Connection/Year for a service connection density of greater that 20 connections per km of mains.
Or alternatively:
Apparent loss in m3/Km Mains/Year for a service connection density of less than 20 connections per km of mains.
The above performance indicator is defined within the Alegre publication as an L3-level indicator (Alegre et al. 2000, p13). This essentially means that the indicator, described as an operational indicator, provides the greatest amount of specific detail but is still relevant at the top management level. This should satisfy a basic L3 requirement; that the PI is both technical enough to be useful to tacticians, while still maintaining the explanatory component much required by the decision-making strategists. However, the existing PI falls short of a number of requirements that would make a PI truly effective. These are as follows:
1) On the issue of inter-firm comparison: Comparing an Apparent Loss of, say, X m3/ Connection/Year for Company A with Company B, with different tariff structures, different metering policies and different water accounting mechanisms, simply will not work. An example of this would be two water authorities, one bound by policy or regulation to utilize volumetric-based water meters (with a lower starting flow) and the other bound to utilize jet-based water meters (with a higher starting flow).
2) On the issue of intra-firm comparison: Quite simply, what is the best Apparent Loss value for Company A; is it 2 m3/ Connection/Year, or 3 m3/ Connection/Year, or maybe 10 m3/ Connection/Year? As Apparent Water Losses are essentially a failure of a water company to measure and collect revenues due, a purely operational indicator is inadequate, at best.
3) On the issue of time base: The existing PI looks at a one-year time frame. However, bearing in mind that a core objective of any PI is to “provide key information that supports a pro-active approach to management” (Alegre et al. 2000, p3), the existing PI does not allow for the required level of long-range planning.
4) On the issue of project investment: Together with the necessary elongated time base, an Apparent Water Loss PI must incorporate some form of time value for money. The inclusion of a realistic ‘discount rate’ allows for an accurate calculation of both financial gains over time, as well as the expenses incurred to achieve those gains.
Building from the project approach of the earlier case study, the paper moves on to propose a different and altogether new PI for Apparent Water Loss management. This new PI shall be termed the Apparent Loss Indicator, or ALI. The ALI attempts to incorporate the components seen to be missing in the existing PI, as well as to retain the major strength that the existing PI holds; that of framing the loss within a clear measurement parameter.
Leakage 2005 - Conference Proceedings Page 9
Quantifying Meter Under-Registration Caused by the Ball Valves of Roof Tanks
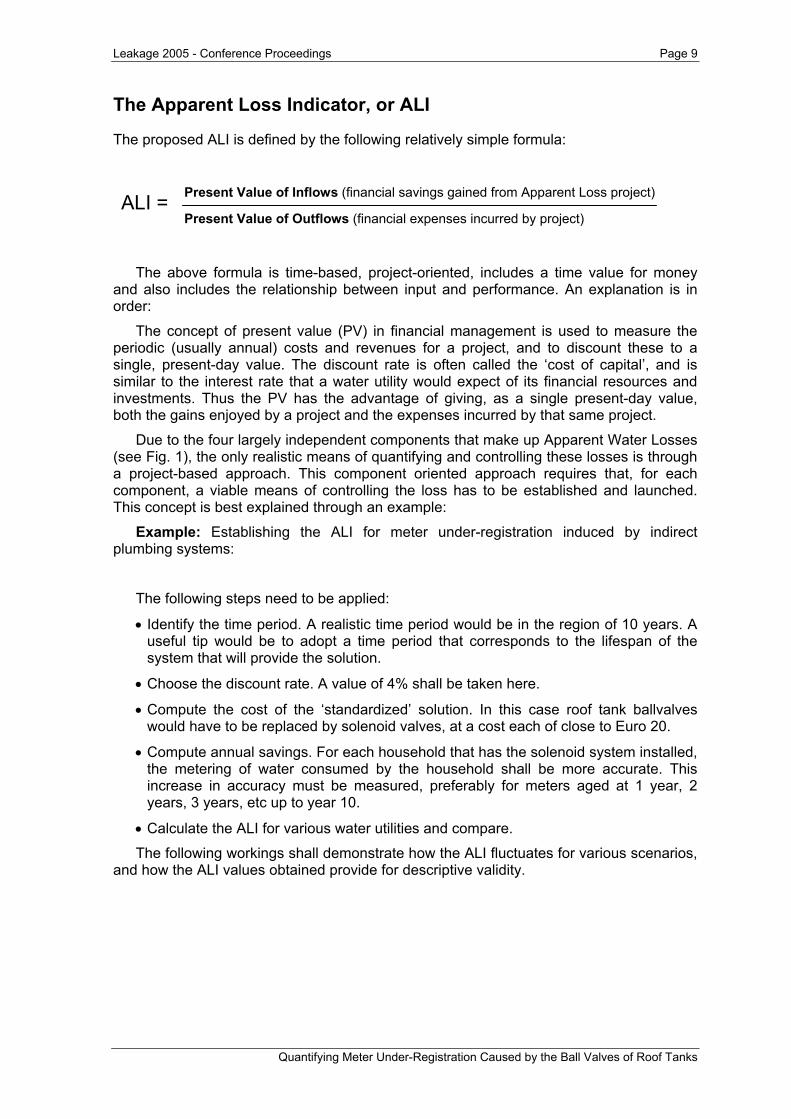
The Apparent Loss Indicator, or ALI
The proposed ALI is defined by the following relatively simple formula:
The above formula is time-based, project-oriented, includes a time value for money and also includes the relationship between input and performance. An explanation is in order:
The concept of present value (PV) in financial management is used to measure the periodic (usually annual) costs and revenues for a project, and to discount these to a single, present-day value. The discount rate is often called the ‘cost of capital’, and is similar to the interest rate that a water utility would expect of its financial resources and investments. Thus the PV has the advantage of giving, as a single present-day value, both the gains enjoyed by a project and the expenses incurred by that same project.
Due to the four largely independent components that make up Apparent Water Losses (see Fig. 1), the only realistic means of quantifying and controlling these losses is through a project-based approach. This component oriented approach requires that, for each component, a viable means of controlling the loss has to be established and launched. This concept is best explained through an example:
Example: Establishing the ALI for meter under-registration induced by indirect plumbing systems:
The following steps need to be applied:
• Identify the time period. A realistic time period would be in the region of 10 years. A useful tip would be to adopt a time period that corresponds to the lifespan of the system that will provide the solution.
• Choose the discount rate. A value of 4% shall be taken here.
• Compute the cost of the ‘standardized’ solution. In this case roof tank ballvalves would have to be replaced by solenoid valves, at a cost each of close to Euro 20.
• Compute annual savings. For each household that has the solenoid system installed, the metering of water consumed by the household shall be more accurate. This increase in accuracy must be measured, preferably for meters aged at 1 year, 2 years, 3 years, etc up to year 10.
• Calculate the ALI for various water utilities and compare.
The following workings shall demonstrate how the ALI fluctuates for various scenarios, and how the ALI values obtained provide for descriptive validity.
ALI = Present Value of Inflows (financial savings gained from Apparent Loss project)
Present Value of Outflows (financial expenses incurred by project)
Leakage 2005 - Conference Proceedings Page 10
Quantifying Meter Under-Registration Caused by the Ball Valves of Roof Tanks
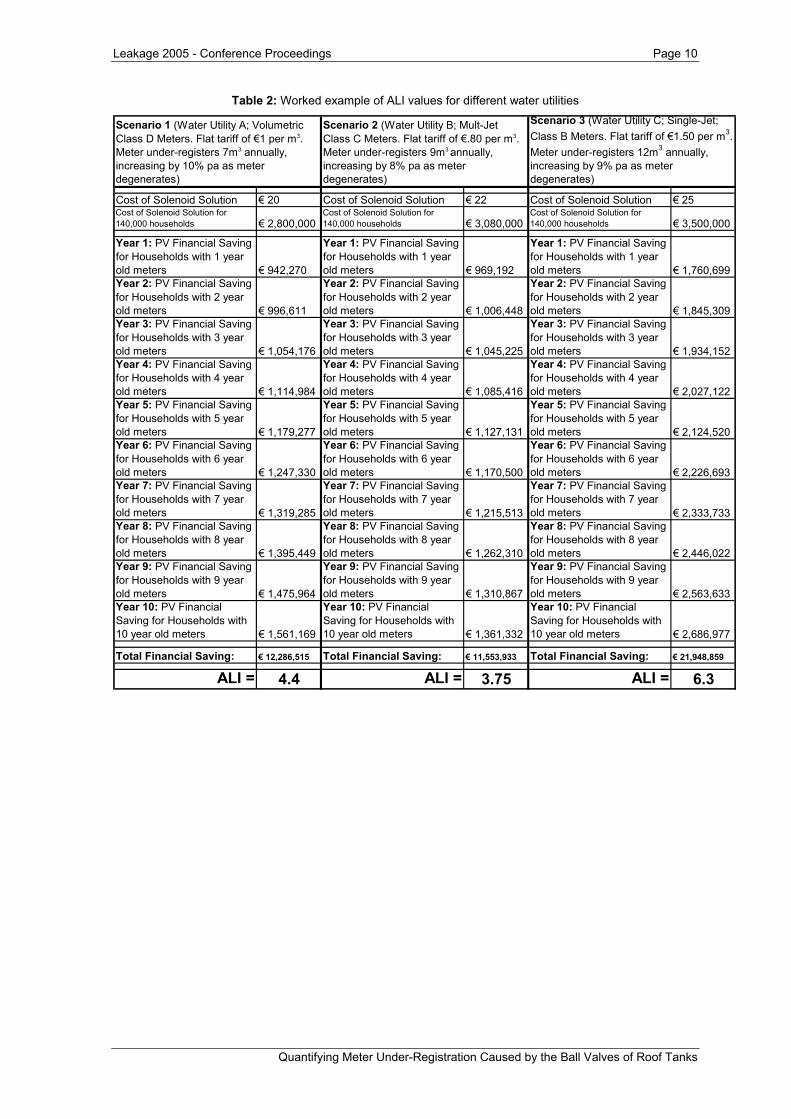
Table 2: Worked example of ALI values for different water utilities
Cost of Solenoid Solution € 20 Cost of Solenoid Solution € 22 Cost of Solenoid Solution € 25Cost of Solenoid Solution for 140,000 households € 2,800,000
Cost of Solenoid Solution for 140,000 households € 3,080,000
Cost of Solenoid Solution for 140,000 households € 3,500,000
Year 1: PV Financial Saving for Households with 1 year old meters € 942,270
Year 1: PV Financial Saving for Households with 1 year old meters € 969,192
Year 1: PV Financial Saving for Households with 1 year old meters € 1,760,699
Year 2: PV Financial Saving for Households with 2 year old meters € 996,611
Year 2: PV Financial Saving for Households with 2 year old meters € 1,006,448
Year 2: PV Financial Saving for Households with 2 year old meters € 1,845,309
Year 3: PV Financial Saving for Households with 3 year old meters € 1,054,176
Year 3: PV Financial Saving for Households with 3 year old meters € 1,045,225
Year 3: PV Financial Saving for Households with 3 year old meters € 1,934,152
Year 4: PV Financial Saving for Households with 4 year old meters € 1,114,984
Year 4: PV Financial Saving for Households with 4 year old meters € 1,085,416
Year 4: PV Financial Saving for Households with 4 year old meters € 2,027,122
Year 5: PV Financial Saving for Households with 5 year old meters € 1,179,277
Year 5: PV Financial Saving for Households with 5 year old meters € 1,127,131
Year 5: PV Financial Saving for Households with 5 year old meters € 2,124,520
Year 6: PV Financial Saving for Households with 6 year old meters € 1,247,330
Year 6: PV Financial Saving for Households with 6 year old meters € 1,170,500
Year 6: PV Financial Saving for Households with 6 year old meters € 2,226,693
Year 7: PV Financial Saving for Households with 7 year old meters € 1,319,285
Year 7: PV Financial Saving for Households with 7 year old meters € 1,215,513
Year 7: PV Financial Saving for Households with 7 year old meters € 2,333,733
Year 8: PV Financial Saving for Households with 8 year old meters € 1,395,449
Year 8: PV Financial Saving for Households with 8 year old meters € 1,262,310
Year 8: PV Financial Saving for Households with 8 year old meters € 2,446,022
Year 9: PV Financial Saving for Households with 9 year old meters € 1,475,964
Year 9: PV Financial Saving for Households with 9 year old meters € 1,310,867
Year 9: PV Financial Saving for Households with 9 year old meters € 2,563,633
Year 10: PV Financial Saving for Households with 10 year old meters € 1,561,169
Year 10: PV Financial Saving for Households with 10 year old meters € 1,361,332
Year 10: PV Financial Saving for Households with 10 year old meters € 2,686,977
Total Financial Saving: € 12,286,515 Total Financial Saving: € 11,553,933 Total Financial Saving: € 21,948,859
ALI = 4.4 ALI = 3.75 ALI = 6.3
Scenario 1 (Water Utility A; Volumetric Class D Meters. Flat tariff of €1 per m3. Meter under-registers 7m3 annually, increasing by 10% pa as meter degenerates)
Scenario 2 (Water Utility B; Mult-Jet Class C Meters. Flat tariff of €.80 per m3. Meter under-registers 9m3 annually, increasing by 8% pa as meter degenerates)
Scenario 3 (Water Utility C; Single-Jet; Class B Meters. Flat tariff of €1.50 per m3. Meter under-registers 12m3 annually, increasing by 9% pa as meter degenerates)
Leakage 2005 - Conference Proceedings Page 11
Quantifying Meter Under-Registration Caused by the Ball Valves of Roof Tanks
Where:
• PV is the ‘present value’ of the financial saving, i.e. the value discounted to the start of the 10 year period. This essentially means that all the financial values are shown as their actual worth at the start-point of the project.
• The ALI is the total financial saving divided by the total cost of the solution for 14, 000 households within each utility. The number of households taken is irrelevant to the ALI value as it is simply a ratio.
• The results show that, notwithstanding 3 entirely different scenarios, water utility C has the highest ALI, standing to gain 6.3 times in revenue when compared to what it would have to spend to solve the Apparent Loss.
Conclusion and Comments
The paper attempts to resolve two complementary issues; that of quantifying and controlling Apparent Water Losses relating to meter under-registration for indirect plumbing systems, and that of adopting a more powerful performance indicator for Apparent Water Losses.
On the first issue the author has implemented a test sequence whereby a number of roof tanks were monitored for under-registration, first with the standard ballvalve and then with a replacement solenoid valve. The results consistently showed that a water utility will meter around 6% more water with a solenoid valve instead of the common ballvalve.
On the second issue the author has proposed a performance indicator to complement the existing operational Apparent Water Loss indicator. The author hesitates to define the ALI as a financial performance indicator, mainly because the thought behind the indicator is purely technical, only being translated into financial values for ease of interpretation.
References Alegre, H., Hirner, W., Baptista, J.M., and Parena, R., (2000). Performance Indicators for Water Supply
Services. London: IWA Publishing. Lambert, A., Myers, S., and Trow, S., (1998). Managing Water Leakage, Economic and Technical Issues.
U.K.: Financial Times Business Ltd. Lambert, A.O., Brown, T.G., Takizawa, M., and Weimer, D., (1999). A Review of Performance Indicators for
Real Losses from Water Supply Systems. Aqua, Journal of Water Services Research and Technology, 45 (2), 227-237
Malta Water Services Corporation, (2004). Annual Report 2003/2004. Malta Margeta, J., Iacovides, I., Azzopardi, E., (1997). Integrated Approach to Development, Management and Use
of Water Resources. Split: Priority Actions Programme. Peresso, J.P., (2005). Monitoring and Control of Apparent Losses in a Water Network Distribution. University
of Malta: B.Eng.(Hons.) Dissertation. Thornton, J., and Rizzo, A., (2002). Apparent Losses, How Low Can You Go? Cyprus: IWA Conference. Welton, R.J., and Goodwin, S.J., (1984). TR221. The Accuracy of Small Revenue Meters. UK. Water
Research Centre.

Leakage 2005 - Conference Proceedings Page 12
Quantifying Meter Under-Registration Caused by the Ball Valves of Roof Tanks
Appendices
Appendix 1:
Further testing of the effect of ballvalve on a second sample, utilizing new upstream and downstream meters. Similar results were obtained, with upstream meter failing to read over 5% of water consumed.
Appendix 2:
Further tests with a 5-year in-situ water meter upstream of tank and a new water meter downstream of tank. Over 92% of water outflows from tank were not measured by inflow meter.
Metered inflows and outflows superimposed. Difference is visible and is around 92%.
Metered inflows and outflows superimposed. Difference is visible and is around 5%.