Embed Size (px)
Citation preview

1
Quantifying Morphology and Diffusion Properties of
Mesoporous Carbon from High-Fidelity 3D Reconstructions
Quantification of Electron Tomography Measurements
Wu Wang1,4, Artur Svidrytski2, Di Wang1,5, Alberto Villa3, Horst Hahn1,4, Ulrich Tallarek2 and
Christian Kübel*1,5,6
1. Institute of Nanotechnology, Karlsruhe Institute of Technology, Hermann-von-Helmholtz-Platz
1, 76344 Eggenstein-Leopoldshafen, Germany.
2. Department of Chemistry, Philipps-Universitat Marburg, Hans-Meerwein-Straße 4, 35032
Marburg, Germany.
3. Dipartimento di Chimica, Università degli Studi Milano, via Golgi 19, 20133 Milano, Italy.
4. Joint Research Laboratory Nanomaterials, Technische Universität Darmstadt, Jovanka-
Bontschits-Straße 2, 64287 Darmstadt, Germany.
5. Karlsruhe Nano Micro Facility, Karlsruhe Institute of Technology, Hermann-von-Helmholtz-
Platz 1, 76344 Eggenstein-Leopoldshafen, Germany.
6. Helmholtz-Institute Ulm for Electrochemical Energy Storage, Karlsruhe Institute of
Technology, 89081 Ulm, Germany.
*Corresponding author: Dr. Christian Kübel, E-mail: [email protected], Phone: +49
721/608-28970.

2
Abstract:
A reliable quantitative analysis in electron tomography, which depends on the segmentation of
the 3D reconstruction, is still challenging because of constraints during tilt-series acquisition
(missing wedge) and reconstruction artifacts introduced by established reconstruction algorithms
such as Simultaneous Iterative Reconstruction Technique (SIRT) and Discrete
Algebraic Reconstruction Technique (DART). We have carefully evaluated the fidelity of
segmented reconstructions analyzing a disordered mesoporous carbon commonly used as support
in catalysis. Using experimental STEM tomography data as well as realistic phantoms, we have
quantitatively analyzed the effect on the morphological description as well as on diffusion
properties (based on a random-walk particle-tracking simulation) as key parameters to understand
the role of porosity in catalysis and in phase separation applications. The morphological
description of the pore structure can be obtained reliably both using SIRT and DART
reconstructions even in the presence of a limited missing wedge. However, the measured pore
volume is sensitive to the threshold settings, which are difficult to define globally for SIRT
reconstructions. This leads to noticeable variations of the diffusion constants in case of SIRT
reconstructions, whereas DART reconstructions resulted in more reliable data. In addition, the
anisotropy of the determined diffusion properties was evaluated, which was significant in the
presence of a limited missing wedge for SIRT and strongly reduced for DART.
Keywords: Disordered mesoporous carbon, electron tomography, fidelity of 3D reconstruction,
morphology quantification, diffusion properties.
1. Introduction
Mesoporous materials have attracted a lot of attention and are of great importance in many
advanced applications due to their remarkable properties, such as high specific surface area,

3
versatile pore structure, chemical inertness, and good mechanical stability (Ryoo et al., 2001;
Taguchi & Schüth, 2005; Liang et al., 2008). In heterogeneous catalysis, various porous materials
have been used as support for the active nanometer-sized particles (Taguchi & Schüth, 2005;
Yang et al., 2011). All aspects of the performance of supported catalysts (activity, selectivity and
stability) are strongly influenced by the architecture of the porous support: i) the mesopores (2-50
nm) and micropores (<2 nm) improve the stability of the catalyst (Zuiderveld, 1994; Taguchi &
Schüth, 2005); ii) the morphology of the macro- and mesopores (geometry and topology) controls
mass transport during catalyst preparation, thus determining the distribution of the active centers
(Ruthven & Post, 2001; Armatas et al., 2003; Gommes, Bons, et al., 2009); iii) the meso- and
micropore morphology is confining the diffusion of reactants and products thereby affecting
selectivity and activity (Christensen et al., 2003; Olsbye et al., 2012; Wang et al., 2018).
Bulk techniques such as physisorption or small angle X-ray diffraction provide an average
measure of the pore structure and pore volume. However, those techniques require assumptions
on the pore shape and connectivity and are not sufficient for an accurate three-dimensional (3D)
characterization of the structure of disordered porous materials. To fully understand the complex
3D structure of meso- and microporous materials and to evaluate how the local and average pore
structure influences the catalyst properties, alternative techniques are needed. Electron
tomography in combination with advanced analysis has been demonstrated to provide
quantifiable 3D structural information at the nanoscale (Kübel et al., 2005; Bals et al., 2007;
Friedrich et al., 2009; Midgley & Dunin-Borkowski, 2009;). For example, SBA-15, an ordered
mesoporous silica, has been investigated using electron tomography, which revealed the pore
corrugation and its spatial correlation along the main channels (Gommes, Friedrich, et al., 2009).
Furthermore, the sensitive interrelationship between morphology and transport properties of

4
SBA-15 has been highlighted recently (Reich et al., 2018). The pore-scale simulations of
hindered diffusion within a 3D reconstruction of this material demonstrated that even a small
amount of structural imperfections in the primary mesopore system has drastic consequences for
the transport properties. Quantitative information about the pore network in Zeolite Y, including
two types of blocked mesopores (closed and constricted mesopores), the tortuosity of the
mesopores, and the size distribution has been obtained by electron tomography (Zečević et al.,
2012). However, any quantitative analysis of electron tomograms critically depends on the
fidelity of the segmentation, the assignment of each voxel to a specific feature or composition
depending on the gray level and/or local neighborhood. In general, segmentation of tomographic
data can be achieved by three approaches: manual segmentation, various types of image
processing as well as advanced reconstruction algorithms that directly result in (partially)
segmented reconstructions. Careful manual segmentation is typically considered as benchmark
for unknown objects. However, manual segmentation is very time-consuming, labor-intensive
and difficult to perform fully reproducibly. During image processing the 3D volume is processed
in order to reduce noise and to get well-separated image intensities to enable extraction of the
features using global (Russ, 1992; Vala & Baxi, 2013; Jahne, 2005) or adaptive local (Niblack,
1985) thresholding. However, in practice, global thresholding typically over/underestimates some
of the features in the 3D volume due to noise and, more critical, systematic reconstruction
artifacts of the commonly used weighted back projection (WBP) or simultaneous iterative
reconstruction technique (SIRT) (Norton, 1985; Kübel et al., 2010). More recently, advanced
reconstruction algorithms have been proposed that make use of prior knowledge to improve the
overall reconstruction quality and fidelity. The discrete algebraic reconstruction technique
(DART) (Batenburg et al., 2009) includes a segmentation in the reconstruction process itself
based on the prior knowledge that the overall sample can be represented by a few different

5
materials, corresponding to a few grey levels in the 3D reconstruction. The DART algorithm
starts from a simple thresholded reconstruction, where voxels close to a boundary are iteratively
refined to achieve the best agreement between the re-projections from the current segmentation
and the experimental projections (Batenburg et al., 2009). Thereby, the reconstruction directly
produces a segmented 3D volume of the original object. As another alternative, total variation
minimization (TVM) compressive sensing (CS) (Goris et al., 2012) assumes a sparse gradient of
grey levels as normalization to improve the 3D reconstruction. The fidelity of the different
approaches has been estimated by a number of groups for various materials and shapes
(Batenburg & Sijbers, 2009; Biermans et al., 2010; Kübel et al., 2010; Saghi et al., 2011;
Roelandts et al., 2012; Goris et al., 2013;).
However, the effect of the limited fidelity of the segmented 3D reconstruction on the
measured/calculated properties of the investigated material has not been addressed. Moreover,
investigations providing quantitative information on the geometry and topology of disordered
pore structures, or even relating this information to relevant transport properties (Müllner et al.,
2016), are still very limited. In this work, we combine electron tomography with advanced image
analysis to elucidate the 3D structure of a disordered mesoporous carbon, which is commonly
used as support in heterogeneous catalysis. The fidelity of the segmented 3D object obtained
from a SIRT reconstruction followed by image processing and with the DART algorithm is
investigated using both experimental data and realistic phantoms for the material. The effect of
the reconstruction approach on the pore morphology is discussed in terms of pore size, pore
length, tortuosity and connectivity. Most importantly, the effect of reconstruction variations on
physical properties calculated from the support structure is evaluated, looking at obstructed
diffusion as one of the critical properties of the mesoporous materials.

6
2. Materials and Methods
Mesoporous carbon
Details of the mesoporous carbon synthesis have been published previously (Villa et al., 2015).
The material has a specific surface area of 589 m2/g with an average pore diameter of 6.9 nm
according to BET analysis.
Electron tomography data acquisition
The dry mesoporous carbon powder was directly dispersed on 100x400 mesh carbon coated
copper grids (Quantifoil Micro Tools GmbH), which was labelled with Au colloidal particles (6.5
nm diameter). Electron tomography was performed using a Fischione 2020 tomography holder on
a Titan 80-300 microscope (FEI Company) operated at 300 kV in STEM mode with a
convergence angle of 10 mrad and a nominal beam diameter of 0.27 nm. STEM images
(1024x1024 pixels, the pixel size 0.32 nm) were acquired at a camera length of 195 mm with a
high-angle annular dark-field (HAADF) detector with in inner angle of 31 mrad using the
Xplore3D software (FEI Company) over a tilt range of ±76º with a tilt increment of 2°.
Alignment of the tilt series was performed in IMOD (Kremer et al., 1996) using the Au particles
as fiducial markers to reach a mean residual alignment error of 0.44 pixels.
Reconstruction and segmentation
The 3D reconstruction of the aligned tilt series was performed using Inspect3D Version 3.0 (FEI
Company) using the simultaneous iterative reconstruction technique (SIRT) with 25 iterations. In
the reconstructed volume, the y-axis is parallel to the tilt axis during data acquisition, the x-axis is
perpendicular to the tilt axis and the z-direction is parallel to the electron beam direction at 0°

7
sample tilt. Several image processing steps were carried out on the reconstructed tomogram to
segment the 3D volume. The goal of the image processing was to reduce noise and get well-
separated image intensities to facilitate segmentation, while preserving the sharp boundaries
between components. The image processing was performed using plugins in the Fiji software
package (Schindelin et al., 2012): i) Noise reduction of the image stack using the PureDenoise
plugin (Luisier et al., 2010) and the anisotropic diffusion filter (Tschumperlé & Deriche, 2005);
ii) Enhancement of local contrast using the CLAHE plugin (Zuiderveld, 1994); iii) binarization
by global thresholding. The generated binary 3D reconstruction volume (labelled as segmented-
SIRT) was further separated into three parts: vacuum, pore and carbon using the pore filling
approach implemented in Amira 6.1.1 (FEI Company) to separate internal pores and vacuum
around the mesoporous carbon particle. The full image processing steps are exemplified in
Figure 1. For comparison with the DART reconstruction, the aligned tilt series was reconstructed
using the DART implementation of the TomoJ plugin (MessaoudiI et al., 2007) in Fiji (labelled
as DART). The resulting tomogram has an edge length of the voxels of 0.32 nm.
Validation of experimental reconstruction and segmentation
The segmented models based on the segmented-SIRT and the DART reconstruction were used to
create tilt-series of 2D projections covering the angular range of ±90º in 2° steps. MATLAB was
used to generate projections based on a simple linear integration of the intensities in the
projection direction. The mean absolute error (MAE) (Sage & Unser, 2003) was used to estimate
the difference between the experimental tilt-series and the re-projected segmented images, in
which the gold markers within the experimental tilt-series images were removed by interpolating
the image intensities in the corresponding areas using IMOD. For the MAE calculation, the

8
complete tilt-series of projected images was scaled to cover the full 8-bit intensity range of 0-255
with the intensity of the vacuum regions set to 0.
Phantom study
The DART reconstruction of the particle was used as a phantom to evaluate the fidelity of the
reconstruction and segmentation approaches in more detail. For this, 3D reconstructions were
performed using the re-projected tilt-series in the angular range of ±76º and ±90º with a tilt step
of 2° created in Matlab by rotating the orginal object using the function ‘imrotate’. Experimental
error sources such as detection noise, scan errors or limited alignment quality were excluded in
this phantom study as well as the supporting carbon film. The reconstruction and segmentation
was done following the same procedure as before for the experimental data. The resulting
reconstructions are labeled as Phantom.segmented-SIRT and Phantom.DART. For these phantom
reconstructions, we can quantitatively compare the mesopore morphology and the diffusion
simulations with the initial phantom in addition to evaluating any differences on a voxel level.
Morphological characterization of the pore structure
Skeleton analysis
In order to quantify the geometry and topology of the pore structure, the pore volume was
analyzed using the skeletonization function in Amira based on the segmented data. The
skeletonization procedure reduces the pore space to a branch-node network (i.e., skeleton), as
described in literature (Fouard et al., 2006) while both the geometrical and topological
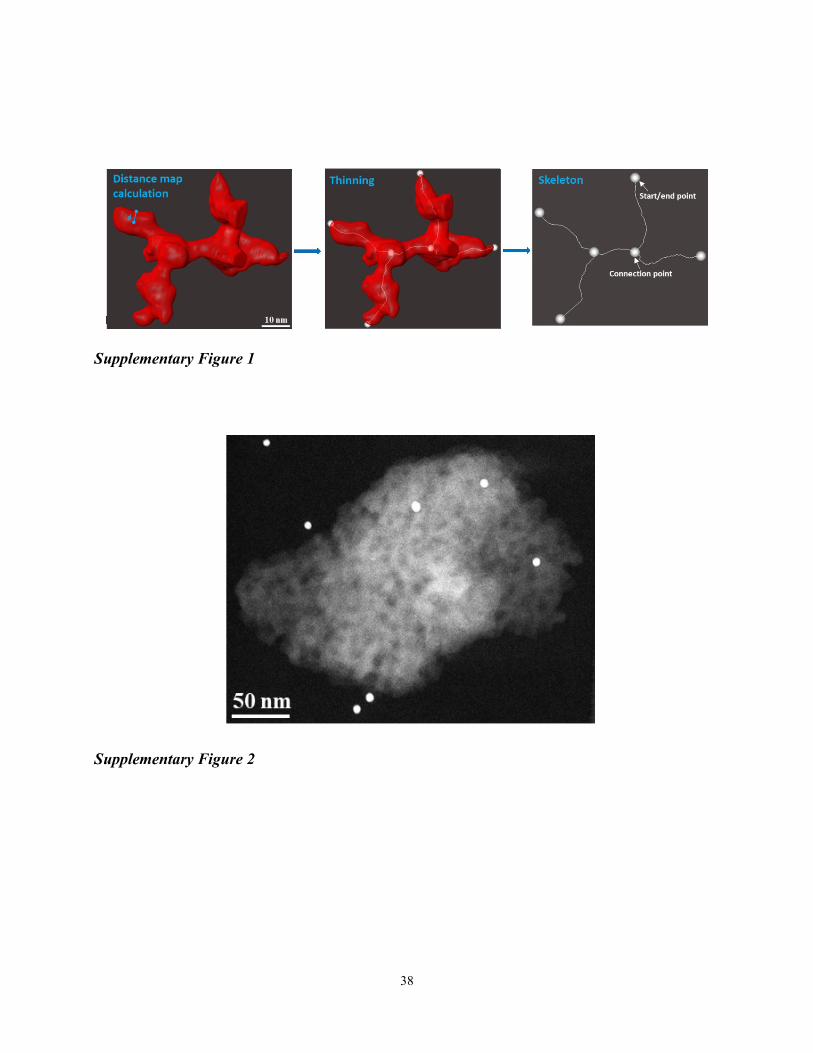
information are preserved. The skeletonization procedure is illustrated in Supplementary Figure
1. In the process, the mean pore diameter of all individual pores was calculated as average from
the diameter along each skeleton. The pore length was obtained from summation of number of

9
voxels along skeleton. The pore coordination number was determined by counting the number of
individual branches connected to a common point. The skeletonized data was further analyzed by
a home-made code in MATLAB to calculate the tortuosity of the pores. The average tortuosity of
the pore structure was estimated by analyzing each individual branch of the derived skeleton. The
tortuosity (τ) of an individual branch is defined as the pore length (dl) divided by the Euclidean
distance (deucl.) between the pore entrance and exit points:
(1)
Chord length distribution (CLD) analysis
The pore space within the segmented volume was analysed using CLD analysis (Bruns &
Tallarek, 2011; Stoeckel et al., 2014; Kroll et al., 2018). For each reconstruction 107 chords were
generated. These chords originate from randomly chosen points in the void space. From each
point, 26 equispaced vectors were defined and the length of these vectors determined when they
hit the solid phase. Chords that projected out of the image were discarded. The resulting chord
length is the sum of the absolute lengths of any two opposing pairs of vectors. The histogram of
the chord length distribution was fitted with a k-gamma function (Aste & Di Matteo, 2008)
(2)
where lc is the chord length, Γ is the gamma function, µ is the first statistical moment of the
distribution, and k is a second-moment parameter defined by the mean and the standard deviation
σ as k = (µ2/σ2). The values for μ and k obtained from the k-gamma fit to the CLD are quantitative
measures for the average pore size and for the homogeneity of the pore volume distribution (Gille
et al., 2002; Aste & Di Matteo, 2008; Hormann & Tallarek, 2013; Müllner et al., 2016).

10
Diffusion simulations
Diffusion in the void space of cubic subdomains for each reconstruction was simulated by a
random-walk particle-tracking technique (Delay et al., 2005). For that purpose, a large number
(typically ) of passive, point-like tracers were randomly distributed in the reconstructed
void space. At each time step of the simulation, the random displacement of every tracer
due to random diffusive motion was calculated as
, (3)
where is the tracer diffusion coefficient in the open space and γ is a vector with random
orientation in space and a length governed by a Gaussian distribution with zero mean and unity
standard deviation. The value of was adjusted such that the mean diffusive displacement did
not exceed (where is the voxel size of the reconstruction). To restrict diffusion
to the void space, a multiple-rejection boundary condition was implemented at the solid–void
interface: if at the current iteration step a tracer crossed the solid–void interface, this
displacement was rejected and recalculated until the tracer position was in the void space. At the
external faces of the reconstructed domain, mirror boundary conditions were imposed, i.e., when
a tracer hit an external face, it was mirror-reflected from that face. During the simulation, the
displacements of every tracer along x-, y-, and z-direction were monitored, which allowed us to
determine time-dependent diffusion coefficients along each direction according to (Brenner,
1980)
(4)
where denotes x, y, or z, and is the accumulated displacement of the ith tracer along
direction after time . A decrease of with time (i.e., the number of iterations) from the

11
initial value of 1 results from passive interactions of the tracers with the solid phase. At short
times, only a small fraction of the tracers experiences geometric confinement during their random
walk. At long times, the transient diffusion coefficients approach asymptotically the targeted
effective (time-independent) values.
3. Results and discussion
3.1 Quantitative comparison of the morphological information obtained from
experimental SIRT and DART reconstructions
The HAADF-STEM tilt-series (Supplementary Figure 2) gives a first idea of the disordered pore
structure of the investigated mesoporous carbon material. The internal mesopore structure is
better revealed in the reconstructed slices (Figure 2a), where their irregular shape and non-
uniform size can be seen. In order to provide any quantitative 3D structural information, some
kind of segmentation has to be performed after reconstruction. The resulting quantitative analysis
strongly depends on the fidelity of the obtained segmentation.
Representative 2D slices of the SIRT reconstruction, the segmented-SIRT and the DART
reconstruction are shown in Figure 2. Most of the features visually detected in the SIRT
reconstruction (Figure 2a) are also present in the slices of the segmented-SIRT and the DART
reconstruction (Figure 2b/c). However, when looking closely at the highlighted regions (red and
blue circles in Figure 2), we found that the size and connectivity of some of the pores in the 2D
slices is different in the two segmented results and does not necessarily fit to our visual
interpretation of the SIRT reconstruction. As one measure for the fidelity of the segmented
reconstructions we used the calculated re-projection tilt-series from the segmented-SIRT and

12
DART reconstruction and compared it to the experimental tilt-series (Figure 3). The mean
absolute error (MAE) was calculated to estimate the difference between the experimental
projections and the re-projections. The MAE values for the nine re-projection directions shown in
Figure 3d are slightly larger for the segmented-SIRT reconstruction than for the DART
reconstruction, but the differences are so small that it would be difficult to judge which
reconstruction is better.
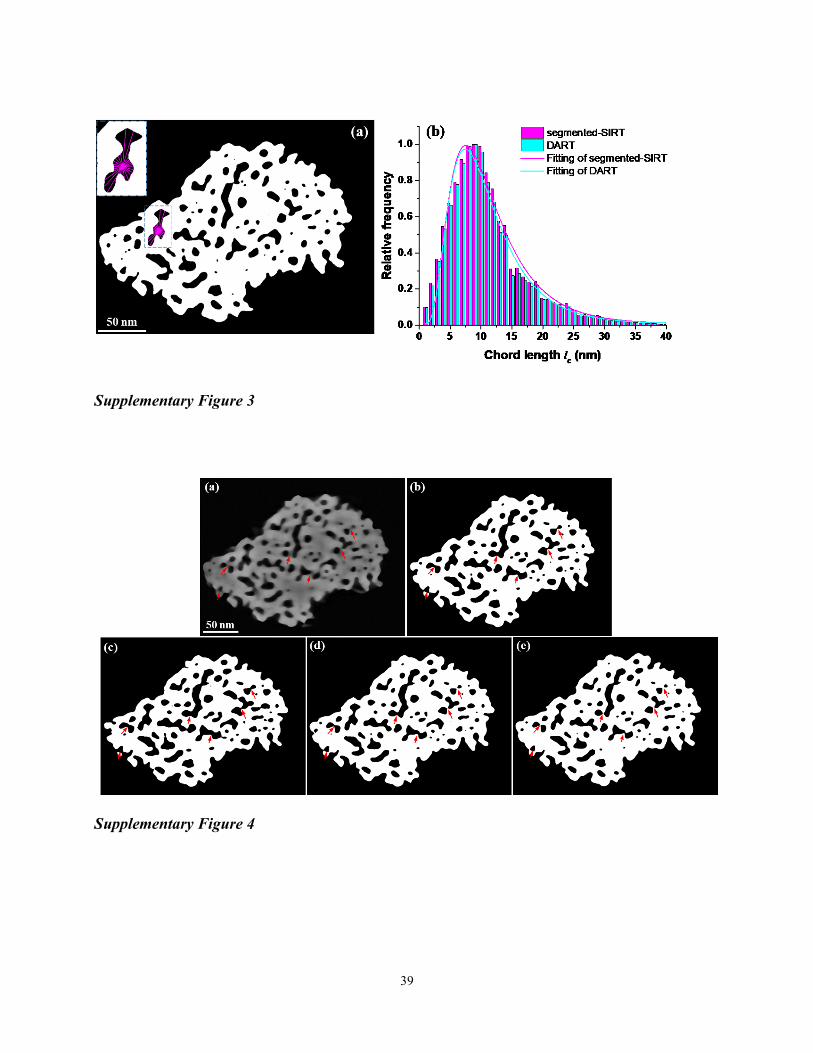
The pore morphology of the segmented reconstructions was quantified by CLD and skeleton
analysis. The Supplementary Figure 3 schematically shows the CLD analysis of the pore space
and the resulting CLD for the segmented-SIRT and the DART reconstruction. The distribution of
chords (Supplementary Figure 3b) and the k-Gamma fitting of the CLD histograms ( Table 1)
indicate that the geometry and the homogeneity of the pore space are similar for the segmented-
SIRT and the DART reconstruction. From the skeleton analysis, the important features related to
the geometry and topology of the pore network such as pore size, pore length, tortuosity and
interconnectivity are summarized in Figure 4. The pore diameter distribution (Figure 4a) shows
that a higher percentage of pores with diameters below 4 nm are observed in the segmented SIRT
reconstruction, thereby resulting in a smaller mean pore diameter ( Table 1) compared to the
DART reconstruction. Nevertheless, the pore length distribution (Figure 4b) and the mean pore
length are very similar in the two reconstructions, in agreement with the similar mean chord
length determined from the CLD analysis. Furthermore, the branch tortuosity (Figure 4c) and the
coordination number of the branch-node network (Figure 4d), two important parameters
regarding topology, are also similar. This fits to the CLD results and indicates that the overall
morphology of the two reconstructions is similar, independent of the reconstruction method (
Table 1). However, the total pore volume of the two reconstructions differs noticeably (~25%).
This pore volume difference should result in a significant difference in the MAE calculation, if

13
performed using a forward simulation of the STEM images with a fully quantified detection
sensitivity (LeBeau et al., 2008). However, for the MAE calculations presented in Figure 3, the
experimental tilt-series and the calculated projection intensities were both scaled to cover 8-bit,
thereby compensating for most of the pore volume differences. This difference of the total pore
volume is mainly caused by the difficulty to define a good global threshold for the SIRT
reconstruction. Despite the local contrast enhancement, the average reconstructed intensity for the
pore/solid varies noticeably in different parts of the particle, rendering a global segmentation
difficult. More details on the effect of the segmentation threshold will be discussed with the
phantom studies.
3.2 Diffusion simulations based on experimental segmented-SIRT and DART
reconstructions
Transport properties of mesoporous materials are one of the critical aspects to understand activity
and selectivity in catalysis (Ruthven & Post, 2001; Armatas et al., 2003; Gommes, Bons, et al.,
2009) as well as their efficiency as separation media (Dullien, 1979; Brenner, 1980;
D’Alessandro et al., 2010). To analyse diffusion properties for this particle, taking into account
the experimental pore shape, we used a cubic domain with a size of up to 220x220x220 voxels to
derive effective diffusion coefficients through direct pore-scale simulations (Figure 5). With
increasing domain size, the diffusion coefficients become almost stable, indicating that the
domain is starting to approach a statistically representative volume considering the structural
variations in the material. When comparing the segmented-SIRT and the DART reconstruction of
exactly the same volume (Figure 5c), we found that normalized diffusion coefficient Deff/Dbulk
within the largest cubic domain from the DART reconstruction differs (~50%) noticeably from
the segmented-SIRT reconstruction. Considering that the topology of both reconstructions is
14
similar, this significant difference should be due to the larger pore volume (higher porosity) of
the DART reconstruction. As the limited convergence of the SIRT reconstruction is known to
introduce local and global intensity variations (Norton, 1985; Kübel et al., 2010) and as we
experimentally noticed how difficult it is to define a global threshold even after image processing
to enhance the local contrast, we assume that the DART reconstruction and thus the DART-based
diffusion simulations are more accurate. However, this is difficult to verify from the
experimentally available data. Moreover, we have no good experimental measure to judge the
fidelity of the DART-based diffusion simulations.
3.3 Fidelity of the 3D reconstruction and effect on morphology and diffusivity
To further evaluate the fidelity of the 3D reconstruction of mesoporous materials and to estimate
the effect on the calculated properties of this material, we employed the DART reconstruction as
a phantom to directly quantify differences between the SIRT and DART based reconstructions
obtained using the same procedures as for the experimental data. The phantom based SIRT and
DART reconstructions were carried out for tilt-angles ranges of ±76° and ±90° to further evaluate
effects due to the missing wedge. As already discussed for the experimental data, defining the
segmentation threshold is critical for evaluating the reconstructions, both for SIRT and for
DART. We tested some common unbiased approaches to define a global threshold for
segmentation such as the isodata-algorithm (Ridler & Calvard, 1978), the moment-preserving
(Tsai, 1985) and Otsu’s (Otsu, 1979) threshold and a representative slice of the corresponding
segmented volume is shown in Supplementary Figure 4. However, there are significant
differences (highlighted by red arrows) in all cases compared to the visual features in the initial
slice of SIRT reconstruction. Therefore, we were visually defining the best onset threshold for the
segmentation of the SIRT reconstruction. For the DART reconstruction, we estimated the onset

15
threshold from several regions based on the mean pore and carbon intensities as is commonly
done in the literature (Batenburg et al., 2009; Biermans et al., 2010). Afterwards, we varied the
threshold by 10% and 20% to evaluate the sensitivity to the threshold settings. The resulting
effect on the reconstructed pore volume is shown in Figure 6b. The pore volume determined
from the segmented SIRT reconstruction is more sensitive to variations of the threshold
compared to the DART reconstruction. This means that, experimentally, it is more difficult to
reproducibly segment a SIRT reconstruction compared to a DART reconstruction in these
mesoporous materials.
For a more detailed analysis, we have evaluated representative 2D slices (Errore. L'origine
riferimento non è stata trovata.Figure 7) of the Phantom.segmented-SIRT and the
Phantom.DART reconstructions (based on the onset threshold) and the corresponding surface
rendering of the pores (Figure 8). All four reconstructions show a high similarity with the
original phantom exhibiting a very similar morphology. However, the size and 2D connectivity of
some of the pores (highlighted areas in Figure 7b-e) are affected by the artefacts introduced
during the reconstruction and segmentation process. To understand the differences between the
segmented volumes better, the differences are highlighted with red color indicates ‘missing’
pixels/voxels and green represents ‘additional’ pixels/voxels in the reconstructions compared to
the reference phantom. With a good threshold, the missing and additional voxels in the pores are
more or less balanced. The pore variations are mainly present in a few voxel wide boundary
region of the pores. As is visually obvious, the Phantom.DART±90° reconstruction exhibits the
least variations with a lower amount of ‘missing’ and ‘additional’ voxels compared to other
reconstructions.

16
To quantify the variations between these reconstructions and the reference phantom, the number
of voxels differing (‘missing’ and ‘additional’) for each reconstruction are counted and compared
to the total number of pore voxels both on a slice-by-slice basis (Figure 9a) as well as for the
overall volume. In addition, the structural similarity (SSIM) index (Z. Wang, A. C. Bovik, 2004)
is used to measure the similarity between reconstructed slices and the corresponding slices of the
phantom (Figure 9b). The Phantom.DART±90° and Phantom.DART±76° reconstructions show a
lower pore variation in all investigated slices compared to the Phantom.segmented-SIRT
reconstructions and the SSIM calculation also indicates that the Phantom.DART±90° data has the
highest structural similarity with the initial structure. This is confirmed by the overall differences
in 3D in Table 2. The comparison further clearly shows the effect of the missing wedge. The
fidelity of both the SIRT and the DART reconstructions obtained with a missing wedge of 28° is
lower compared to the ones without missing wedge. However, in case of the DART
reconstruction this difference is smaller and might partially be due to the reduced number of
projections. The same trend can also be seen looking at the MAE calculations for this phantom
study (Supplementary Figure 5). All MAE values are well below 1%, which is significantly
lower compared to the experimental counterpart, presumably mostly due to the missing noise in
the phantom studies. Furthermore, slight structural changes, contamination and the beam
convergence might add to the higher MAE values for the experimental reconstructions.
With the evaluation above, it is clear that the segmented 3D reconstructions are not perfect, but
visually they nevertheless appear to be close to the original phantom structure. In order to analyze
the effect of the differences on the morphology and diffusion properties, we analyzed the
reconstructed phantom structures analogously to the experimental data. The quantitative
information on the pore morphology derived from CLD and skeleton analysis are summarized in

17
Table 3. Overall, the morphological parameters are quite similar for all 4 reconstructions
compared to the reference phantom. Especially the topology of the constructed volume fits well
based on the mean coordination number and the tortuosity. This fits to the visual analysis of the
pores (as in Figure 8) and means that connectivity differences seen in individual slices of the 3D
volume ( Figure 7 ) do not lead to a significant number of changes in the 3D pore connectivity.
However, looking at the geometry-related parameters, such as pore length and width or the mean
chord length µ as well as the total power volume, slightly stronger differences are noticeable.
These parameters are most sensitive to slight threshold variations. In addition, the k values (as a
measure of the homogeneity) are higher for both the segmented-SIRT and the DART
reconstructions compared to the phantom reference, especially for the limited tilt range of ±76°.
This indicates that the reconstruction process causes a smoothing of pore variations, especially if
the reconstruction is affected by the missing wedge.
The diffusion behavior within the 3D pore volume of the phantom reconstructions have been
simulated as before in case of the experimental data (Figure 10a) to compare the differences
between the reconstruction algorithms and to evaluate the effect of the missing wedge. We found
that the effective diffusion within the largest cubic domain of the Phantom.segmented-SIRT±76°
reconstruction is about 14% lower compared to the reference, while the value of
Phantom.segmented-SIRT±90° reconstruction is about 21% higher. This difference is partially
due to the variations in the pore volume between the reconstructions, which is ~5% lower than in
the reference for the Phantom.segmented-SIRT±76° (in the volume used for the diffusion
simulation), whereas the pore volume of the Phantom.segmented-SIRT±90° is ~14% higher
compared to the reference phantom. For the Phantom.DART reconstructions, the variation of the
diffusion coefficients compared to the reference is significantly smaller. It is about 7%

18
(Phantom.DART±76°) and about 3% (Phantom.DART±90°) higher than in the reference
phantom. However, it should be noted that the corresponding pore volume of the
Phantom.DART±76° is almost the same as in the reference (1% higher), while the pore volume
in the Phantom.DART±90° reconstruction is 4% higher. This clearly shows that the pore volume
is not the only factor affecting the variations in diffusion coefficients between the 3D
reconstructions, but the slight morphological differences and potentially also necking between
pores play a role. Another critical point is the effect of the missing wedge on the measured
diffusion properties and, in particular, on the anisotropy of the determined diffusion properties
that it causes. This was evaluated by separately analyzing the x-component (perpendicular to the
tilt-axis and the electron beam direction), y-component (parallel to the tilt-axis) and z-component
(parallel to the electron beam direction) of the diffusion coefficients Figure 10b-c). As the
investigated volume is not necessarily fully isotropic, we did not compare the absolute diffusion
components in the different directions but only the differences of each component relative to the
reference phantom. In case of the Phantom.segmented-SIRT±76°, the diffusion in 3D is 14%
lower compared to the reference, but the z-component of the diffusion is enhanced and almost the
same as the diffusion in this direction in the reference. This is the expected result of the missing
wedge, leading to a lower intensity for pore walls oriented perpendicular to the electron beam,
thus enhancing the pore length/connectivity in z-direction. In addition, we noticed that the
missing wedge has a significantly different effect on the x- and y-component of the diffusion
coefficients. The x-component of the diffusion is 10% lower than the reference value and thus
slightly enhanced compared to the difference in 3D. However, the y-component of the diffusion
is strongly reduced; it is 56% lower than the reference.

19
To better understand this anisotropy, we investigated the effect of the SIRT reconstruction from a
series of projections of a 3D shell model covering a tilt-angle range of ±76° (Supplementary
Figure 6). As commonly considered, the missing wedge results in a significant reduction of the
reconstructed intensities of the shell in z-direction, because this part of the shell has strong
Fourier coefficients within the missing wedge (Supplementary Figure 6a/b). However, the
reconstruction also reveals a slight anisotropy for the central slice in x- and y-direction
(Supplementary Figure 6c). This leads to the highest reconstructed intensities for pore walls
perpendicular to the y-direction, which is a bit higher than the intensities perpendicular to the x-
direction and again higher than the intensities perpendicular to the z-direction (Supplementary
Figure 6d). In turn, the components of the effective diffusion coefficient should be inversely
affected, which is exactly the trend we notice in our diffusion simulations based on the
Phantom.segmented-SIRT±76° reconstruction compared to the reference. For the
Phantom.DART±76° reconstruction, the anisotropy of the diffusion components is significantly
reduced compared to the Phantom.segmented-SIRT±76° reconstruction. This means that the
DART reconstruction significantly reduces the missing wedge artifacts. However, a deeper
analysis shows that we still see the same trend as for the SIRT reconstruction. The z-component
is enhanced (13%) compared to the reference, the x-component and the y-component are almost
the same. This residual anisotropy suggests that the DART reconstruction did not fully converge
to suppress the missing wedge artifacts.
In the reconstruction based on the full tilt-angle range of ±90°, the Phantom.segmented-
SIRT±90° exhibits slightly higher normalized diffusion coefficients in x- and z-direction
compared to the y-direction. The SIRT reconstruction of a tilt-series of projections of a 3D shell
model covering the full tilt-range of ±90° revealed that the intensity in x- and z-direction is lower

20
compared to the y-direction ( Supplementary Figure 6e), which would lead to higher diffusion
both in x- and z-direction, which is exactly what we observe in our diffusion simulations for the
Phantom.segmented-SIRT±90° reconstruction. This anisotropy of the SIRT reconstructions even
with the full ±90° tilt-angle range is due to the discrete angular sampling during tilting (2° tilt
step here), which can be considered as a set of mini missing wedge in the x-z plane, whereas the
y-direction along the tilt-axis will not be affected. Also in this case, the anisotropy of the
diffusion components is again significantly reduced by the Phantom.DART±90°, resulting in a
just slightly higher component in the z-direction compared to the other two directions.
4. Conclusions
The morphological description and the diffusion properties of a disordered mesoporous carbon
material have been quantified based on an electron tomographic reconstruction. The quantitative
analysis strongly depends on the fidelity of the reconstruction and the segmentation, which are
affected by pore size variations, the missing wedge during tomographic acquisition and the
reconstruction approach. The morphological description of the pore structure in terms of simple
geometric and topological parameters can be performed reliably based on both the SIRT and
DART reconstruction even in the presence of a limited missing wedge. However, the measured
pore size and length vary somewhat depending on the threshold used for segmentation, and in
particular, for the SIRT reconstruction it is difficult to reproducibly define a uniform global
threshold. This has a noticeable effect on the measured pore volume, which differed by ~25% in
our experimental SIRT and DART reconstructions. Since diffusion through a pore network
depends essentially on porosity, i.e., on the void volume fraction, the simulated diffusion
coefficients also differed significantly (by ~50%) between the experimental SIRT and the DART
reconstruction.

21
In a phantom study based on the reconstructed mesoporous carbon, we analyzed the fidelity of
the reconstruction and segmentation approach for disordered mesoporous materials in more
detail. This revealed that the sensitivity of the pore volume towards the threshold settings is
higher for the SIRT reconstruction compared to the DART reconstruction, making it more
difficult to define a good threshold and, thus, to reproducibly measure the pore volume based on
a SIRT reconstruction. However, we found that the pore variations introduced in the
reconstruction and segmentation process are mainly present in a few voxel wide boundary region
of the pores, slightly altering the local size of the pore structure, but not significantly affecting the
morphology. Mainly due to the differences in the pore volume, the simulated diffusion
coefficients also varied for the different reconstructions. Nevertheless, in the case of the DART
reconstruction a reproducible simulation of the diffusion coefficient was possible.
Missing wedge artifacts result in a noticeable anisotropy of the measured x-, y- and z-components
of the diffusion coefficient based on the SIRT reconstruction, with the highest coefficients in z-
direction and the lowest coefficient in y-direction. This anisotropy is strongly reduced in the
DART reconstruction, resulting in differences of only a few percent even in the presence of a
limited missing wedge.
In summary, our studies indicate that a reproducible and reliable analysis of the pore structure of
mesoporous materials is possible by electron tomography based on a DART reconstruction. It
enables reliable analysis of the effective diffusion properties, thereby providing input to the
understanding of morphology–transport relationships, e.g., in heterogeneous catalysis.

22
Acknowledgement
Wu Wang is grateful for financial support from the China Scholarship Council (CSC) for his PhD
research conducting at the Karlsruhe Institute of Technology (Karlsruhe, Germany) and the
Technical University of Darmstadt (Darmstadt, Germany). This work was supported by the
Deutsche Forschungsgemeinschaft DFG (Bonn, Germany) under grant TA 268/9–1 and by the
Karlsruhe Nano Micro Facility (KNMF) at the KIT under the KNMF long-term user proposal
2017-019-020749.
References
ARMATAS, G. S., SALMAS, C. E., LOULOUDI, M., ANDROUTSOPOULOS, G. P. & POMONIS, P. J.
(2003). Relationships among pore size, connectivity, dimensionality of capillary
condensation, and pore structure tortuosity of functionalized mesoporous silica. Langmuir
19, 3128–3136.
ASTE, T. & DI MATTEO, T. (2008). Emergence of Gamma distributions in granular materials and
packing models. Physical Review E 77, 021309.
BALS, S., BATENBURG, K. J., VERBEECK, J., SIJBERS, J. & VAN TENDELOO, G. (2007).
Quantitative three-dimensional reconstruction of catalyst particles for bamboo-like carbon
nanotubes. Nano Letters 7, 3669–3674.
BATENBURG, K. J., BALS, S., SIJBERS, J., KÜBEL, C., MIDGLEY, P. A., HERNANDEZ, J. C., KAISER,
U., ENCINA, E. R., CORONADO, E. A. & VAN TENDELOO, G. (2009). 3D imaging of
nanomaterials by discrete tomography. Ultramicroscopy 109, 730–740.
BATENBURG, K. J. & SIJBERS, J. (2009). Adaptive thresholding of tomograms by projection

23
distance minimization. Pattern Recognition 42, 2297–2305.
BIERMANS, E., MOLINA, L., BATENBURG, K. J., BALS, S. & VAN TENDELOO, G. (2010). Measuring
porosity at the nanoscale by quantitative electron tomography. Nano Letters 10, 5014–5019.
BRENNER, H. (1980). Dispersion resulting from flow through spatially periodic porous media.
Phil. Trans. R. Soc. Lond. A 297, 81–133.
BRUNS, S. & TALLAREK, U. (2011). Physical reconstruction of packed beds and their
morphological analysis: Core-shell packings as an example. Journal of Chromatography A
1218, 1849–1860.
CHRISTENSEN, C. H., JOHANNSEN, K., SCHMIDT, I. & CHRISTENSEN, C. H. (2003). Catalytic
benzene alkylation over mesoporous zeolite single crystals: improving activity and
selectivity with a new family of porous materials. Journal of the American Chemical Society
125, 13370–13371.
D’ALESSANDRO, D. M., SMIT, B. & LONG, J. R. (2010). Carbon dioxide capture: prospects for
new materials. Angewandte Chemie International Edition 49, 6058–6082.
DELAY, F., ACKERER, P. & DANQUIGNY, C. (2005). Simulating solute transport in porous or
fractured formations using random walk particle tracking. Vadose Zone Journal 4, 360–379.
DULLIEN, F. (1979). Porous media: fluid transport and pore structure. Massachusetts: Academic
press.
FOUARD, C., MALANDAIN, G., PROHASKA, S. & WESTERHOFF, M. (2006). Blockwise processing
applied to brain microvascular network study. IEEE Transactions on Medical Imaging 25,
1319–1328.
FRIEDRICH, H., JONGH, P. E. DE, VERKLEIJ, A. J. & JONG, K. P. DE (2009). Electron tomography
for heterogeneous catalysts and related nanostructured materials. Chemical Reviews 109,
1613–1629.

24
GILLE, W., ENKE, D. & JANOWSKI, F. (2002). Pore size distribution and chord length distribution
of porous VYCOR glass (PVG). Journal of Porous Materials 9, 221–230.
GOMMES, C. J., BONS, A. J., BLACHER, S., DUNSMUIR, J. H. & TSOU, A. H. (2009). Practical
methods for measuring the tortuosity of porous materials from binary or gray-tone
tomographic reconstructions. AIChE Journal 55, 2000–2012.
GOMMES, C. J., FRIEDRICH, H., WOLTERS, M., DE JONGH, P. E. & DE JONG, K. P. (2009).
Quantitative characterization of pore corrugation in ordered mesoporous materials using
image analysis of electron tomograms. Chemistry of Materials 21, 1311–1317.
GORIS, B., VAN DEN BROEK, W., BATENBURG, K. J., HEIDARI MEZERJI, H. & BALS, S. (2012).
Electron tomography based on a total variation minimization reconstruction technique.
Ultramicroscopy 113, 120–130.
GORIS, B., ROELANDTS, T., BATENBURG, K. J., HEIDARI MEZERJI, H. & BALS, S. (2013).
Advanced reconstruction algorithms for electron tomography: From comparison to
combination. Ultramicroscopy 127, 40–47.
HORMANN, K. & TALLAREK, U. (2013). Analytical silica monoliths with submicron macropores:
current limitations to a direct morphology-column efficiency scaling. Journal of
Chromatography A 1312, 26–36.
JAHNE, B. (2005). Digital image processing. New York: Springer.
KREMER, J. R., MASTRONARDE, D. N. & MCINTOSH, J. R. (1996). Computer visualization of
three-dimensional image data using IMOD. Journal of structural biology 116, 71–76.
KROLL, M., HLUSHKOU, D., SCHLABACH, S., HÖLTZEL, A., ROLING, B. & TALLAREK, U. (2018).
Reconstruction–simulation approach verifies impedance-derived ion transport tortuosity of a
graphite battery electrode. Journal of The Electrochemical Society 165, A3156–A3163.
KÜBEL, C., NIEMEYER, D., CIESLINSKI, R. & ROZEVELD, S. (2010). Electron tomography of

25
nanostructured materials –towards a quantitative 3D analysis with nanometer resolution.
Materials Science Forum 638–642, 2517–2522.
KÜBEL, C., VOIGT, A., SCHOENMAKERS, R., OTTEN, M., SU, D., LEE, T. C., CARLSSON, A. &
BRADLEY, J. (2005). Recent advances in electron tomography: TEM and HAADF-STEM
tomography for materials science and semiconductor applications. Microscopy and
Microanalysis 11, 378–400.
LEBEAU, J. M., FINDLAY, S. D., ALLEN, L. J. & STEMMER, S. (2008). Quantitative atomic
resolution scanning transmission electron microscopy. Physical review letters 100, 206101.
LIANG, C., LI, Z. & DAI, S. (2008). Mesoporous carbon materials: synthesis and modification.
Angewandte Chemie - International Edition 47, 3696–3717.
LUISIER, F., VONESCH, C., BLU, T. & UNSER, M. (2010). Fast interscale wavelet denoising of
Poisson-corrupted images. Signal Processing 90, 415–427.
MESSAOUDII, C., BOUDIER, T., SORZANO, C. O. S. & MARCO, S. (2007). TomoJ: tomography
software for three-dimensional reconstruction in transmission electron microscopy. BMC
Bioinformatics 8, 288.
MIDGLEY, P. A. & DUNIN-BORKOWSKI, R. E. (2009). Electron tomography and holography in
materials science. Nature materials 8, 271–280.
MÜLLNER, T., UNGER, K. K. & TALLAREK, U. (2016). Characterization of microscopic disorder in
reconstructed porous materials and assessment of mass transport-relevant structural
descriptors. New Journal of Chemistry 40, 3993–4015.
NIBLACK, W. (1985). An Introduction to Digital Image Processing. Michigan: Prentice-Hall.
NORTON, S. J. (1985). Iterative reconstruction algorithms: convergence as a function of spatial
frequency. Journal of the Optical Society of America A 2, 6–13.
OLSBYE, U., SVELLE, S., BJRGEN, M., BEATO, P., JANSSENS, T. V. W., JOENSEN, F., BORDIGA, S.

26
& LILLERUD, K. P. (2012). Conversion of methanol to hydrocarbons: how zeolite cavity and
pore size controls product selectivity. Angewandte Chemie - International Edition 51, 5810–
5831.
OTSU, N. (1979). A threshold selection method from gray-level histograms. IEEE Transactions
on Systems, Man, and Cybernetics 9, 62–66.
REICH, S. J., SVIDRYTSKI, A., HÖLTZEL, A., FLOREK, J., KLEITZ, F., WANG, W., KÜBEL, C.,
HLUSHKOU, D. & TALLAREK, U. (2018). Hindered diffusion in ordered mesoporous silicas:
insights from pore-dcale dimulations in physical reconstructions of SBA-15 and KIT-6
silica. Journal of Physical Chemistry C 122, 12350–12361.
RIDLER, T. W. & CALVARD, S. (1978). Picture thresholding using an iterative selection method.
IEEE Transactions on Systems, Man, and Cybernetics 8, 630–632.
ROELANDTS, T., BATENBURG, K. J., BIERMANS, E., KÜBEL, C., BALS, S. & SIJBERS, J. (2012).
Accurate segmentation of dense nanoparticles by partially discrete electron tomography.
Ultramicroscopy 114, 96–105.
RUSS, J. C. (1992). The Image Processing Handbook. Boca Raton: CRC Press.
RUTHVEN, D. M. & POST, M. F. M. (2001). Diffusion in zeolite molecular sieves. Studies in
surface science and catalysis 137, 525–577.
RYOO, R., JOO, S. H., KRUK, M. & JARONIEC, M. (2001). Ordered mesoporous carbons. Advanced
Materials 13, 677–681.
SAGE, D. & UNSER, M. (2003). Teaching image-processing programming in Java. IEEE Signal
Processing Magazine 20, 43–52.
SAGHI, Z., HOLLAND, D. J., LEARY, R., FALQUI, A., BERTONI, G., SEDERMAN, A. J., GLADDEN, L.
F. & MIDGLEY, P. A. (2011). Three-dimensional morphology of iron oxide nanoparticles
with reactive concave surfaces. A compressed sensing-electron tomography (CS-ET)

27
approach. Nano Letters 11, 4666–4673.
SCHINDELIN, J., ARGANDA-CARRERAS, I., FRISE, E., KAYNIG, V., LONGAIR, M., PIETZSCH, T.,
PREIBISCH, S., RUEDEN, C., SAALFELD, S., SCHMID, B., TINEVEZ, J. Y., WHITE, D. J.,
HARTENSTEIN, V., ELICEIRI, K., TOMANCAK, P. & CARDONA, A. (2012). Fiji: an open-source
platform for biological-image analysis. Nature Methods 9, 676–682.
STOECKEL, D., KÜBEL, C., HORMANN, K., HÖLTZEL, A., SMARSLY, B. M. & TALLAREK, U.
(2014). Morphological analysis of disordered macroporous-mesoporous solids based on
physical reconstruction by nanoscale tomography. Langmuir 30, 9022–9027.
TAGUCHI, A. & SCHÜTH, F. (2005). Ordered mesoporous materials in catalysis.
TSAI, W.-H. (1985). Moment-preserving thresolding: a new approach. Computer Vision,
Graphics, and Image Processing 29, 377–393.
TSCHUMPERLÉ, D. & DERICHE, R. (2005). Vector-valued image regularization with PDEs: a
common framework for different applications. IEEE Transactions on Pattern Analysis and
Machine Intelligence 27, 506–517.
VALA, M. H. J. & BAXI, A. (2013). A review on Otsu image segmentation algorithm.
International Journal of Advanced Research in Computer Engineering and Technology 2,
387–389.
VILLA, A., SCHIAVONI, M., CHAN-THAW, C. E., FULVIO, P. F., MAYES, R. T., DAI, S., MORE, K.
L., VEITH, G. M. & PRATI, L. (2015). Acid-functionalized mesoporous carbon: an efficient
support for ruthenium-catalyzed γ-valerolactone production. ChemSusChem 8, 2520–2528.
WANG, W., VILLA, A., KÜBEL, C., HAHN, H. & WANG, D. (2018). Tailoring the 3D structure of
Pd nanocatalysts supported on mesoporous carbon for furfural hydrogenation.
ChemNanoMat 4, 1125–1132.
YANG, Y., CHIANG, K. & BURKE, N. (2011). Porous carbon-supported catalysts for energy and

28
environmental applications: a short review. Catalysis Today 178, 197–205.
Z. WANG, A. C. BOVIK, H. R. S. AND E. P. S. (2004). Image quality assessment: from error
visibility to structural similarity. IEEE Transactions on Image Processing 13, 600–612.
ZEČEVIĆ, J., GOMMES, C. J., FRIEDRICH, H., DEJONGH, P. E. & DEJONG, K. P. (2012).
Mesoporosity of zeoliteY: quantitative three-dimensional study by image analysis of
electron tomograms. Angewandte Chemie - International Edition 51, 4213–4217.
ZUIDERVELD, K. (1994). Contrast limited adaptive histogram equalization. In Graphics gems IV,
pp. 474–485. Massachusetts: Academic Press.
29
Table and Figures
Table 1: Morphological descriptors for the pore structure of the segmented-SIRT and DART
reconstructions.
Table 2: Pore variation and SSIM calculation for the phantom segmented 3D reconstructions.
Table 3: Quantitative morphological information on the pore structure.
Figure 1: Illustration of the image processing steps after SIRT reconstruction for the mesoporous
carbon.
Figure 2: Typical xy slices of (a) the SIRT reconstruction, (b) the segmented-SIRT and (c) the
DART reconstruction (the areas highlighted by red cycles exhibit pore size variations and the
blue regions indicate differences in connectivity of the pores in 2D).
Figure 3: Projected images at 0° for (a) experimental STEM tilt-series, (b) segmented-SIRT and
(c) DART reconstructions. (d) MAE calculation for re-projected images from the segmented-
SIRT (purple) and DART (blue) reconstructions at angles of -70°,-50°,-30°,-10°, 0°, 10°, 30°, 50°
and 70°.
Figure 4: (a) Pore size distribution, (b) pore length distribution, (c) pore tortuosity and (d)
coordination number based on the segmented-SIRT and the DART reconstruction.
Figure 5: (a) Overall 3D morphology of the mesoporous carbon particle, (b) cubic substructure
used for the diffusion simulations and (c) calculated effective diffusion coefficients normalized
by the bulk diffusivity in dependence of the cube edge length for the segmented-SIRT and the
DART reconstruction.
Figure 6: (a) Intensity histogram of a 3D reconstruction showing two main peaks corresponding
to pore (void) and carbon (solid); (b) effect of threshold on the reconstructed pore volume within

30
Phantom.segmented-SIRT and the Phantom.DART reconstructions (the dashed line indicates the
pore volume of the reference phantom).
Figure 7: Slices of the (a) DART phantom reference, (b) Phantom.segmented-SIRT±76°, (c)
Phantom.segmented-SIRT±90°,(d) Phantom.DART±76° and (e) Phantom.DART±90°
reconstructions with (f-i) the differences in the pore structures: the pixels of the red and green
parts represent ‘missing’ and ‘additional’ voxels of the reconstructed pore compared to the
phantom. (Areas highlighted by red circles exhibit pore size variations and the blue regions
indicate differences in the connectivity of the pores.)
Figure 8: 3D view of a selected pore: (a) reference, (b) Phantom.segmented-SIRT±76°, (c)
Phantom.segmented-SIRT±90°, (d) Phantom.DART±76° and (e) Phantom.DART±90°.
Differences are highlighted in red (missing voxels) and green (additional voxels).
Figure 9: (a) Percentage of pore variation (the dashed lines indicate the average values of the
pore variation in the 3D volume) and (b) SSIM calculated for slices distributed throughout the
reconstructed volume for the four phantom reconstructions.
Figure 10: Effective diffusion coefficients normalized by the bulk diffusivity as a function of the
simulation box size. (a) 3D, (b) x-component, (c) y-component and (d) z-component.
Table 1
Data CLD analysis Skeleton analysis
µ
(nm) k
Pore volume
(105 nm3)
Pore diameter
(nm)
Pore length
(nm) Tortuosity
segmented-SIRT 11.1 3.13 4.39 5.2±2.6 13.1±11.0 1.17±0.31
DART 11.0 3.10 5.67 5.6±2.1 13.3±10.3 1.15±0.24
Table 2
Segmentation Pore variation (%) SSIM
Phantom.segmented-SIRT±76° 21 0.946

31
Phantom.segmented-SIRT±90° 19 0.947
Phantom.DART±76° 15 0.954
Phantom.DART±90° 7 0.973
Table 3
Data CLD
analysis Skeleton analysis
µ
(nm) k
Pore
volume
(105
nm3
)
Pore
volume
within
largest
cubic
domain
(105
nm3
)
Pore
diameter
(nm)
Pore
length
(nm)
Tortuosity
Coordination
number
3 >3
DART 11.0 3.10 5.67 0.79 5.6±2.1 13.3±10.3 1.15±0.24 94.8% 5.2%
Phantom.segmented-
SIRT±76° 11.5 3.23 5.44 0.75 5.6±2.5 14.6±11.8 1.16±0.48 95.6% 4.4%
Phantom.segmented-
SIRT±90° 12.3 3.16 5.78 0.90 6.2±2.5 14.8±11.2 1.15±0.23 96.0% 4.0%
Phantom.DART±76° 11.7 3.23 5.54 0.80 5.9±2.4 13.8±11.2 1.12±0.17 94.9% 5.1%
Phantom.DART±90° 11.4 3.15 5.60 0.82 5.8±2.3 13.7±11.2 1.14±0.21 94.8% 5.2%
Figure 1

32
Figure 2
Figure 3

33
Figure 4
Figure 5

34
Figure 6
Figure 7

35
Figure 8
Figure 9

36
Figure 10

37
Supplementary Information
Supplementary Figures
Supplementary Figure 1: Scheme of the skeletonization process: distance map calculation,
thinning and the derived skeleton (left to right).
Supplementary Figure 2: 0° HAADF-STEM image from a tilt-series of the disordered
mesoporous carbon. The aligned tilt-series is available online as movie.
Supplementary Figure 3: Schematic illustration of the CLD analysis of the pore space: (a)
chords scanning the solid−void border from a random point in the pore space, (b) chord length
(lc) distribution for the pore space of the segmented-SIRT and DART reconstructions and best fits
to the k-gamma function.
Supplementary Figure 4: (a) Gray-scale slice of the Phantom.segmented-SIRT±90°
reconstruction and the corresponding binary slices defined by the (b) isodata-algorithm, (c)
moment-preserving and (d) Otsu’s thresholds and (e) best visually defined threshold representing
most of the features.
Supplementary Figure 5: MAE calculation for the Phantom.segmented-SIRT and
Phantom.DART reconstructions at angles of -70°,-50°,-30°,-10°, 0°, 10°, 30°, 50° and 70°.
Supplementary Figure 6: Phantom study of a shell reconstructed using SIRT with a tilt-range of
±76°: (a) surface rendering of the reconstructed structure; central (b) xz and (c) xy slices and the
corresponding intensity profile of central lines in x, y and z directions (red, green and blue lines in
b and c) indicating the anisotropy effect of the missing wedge on the reconstructed intensity; (e)
The intensity profile of central lines in x, y and z directions of the same shell phantom
reconstructed using SIRT with a tilt-range of ±90°.
38
Supplementary Figure 1
Supplementary Figure 2
39
Supplementary Figure 3
Supplementary Figure 4

40
Supplementary Figure 5

41
Supplementary Figure 6