Embed Size (px)
Citation preview

MARINE ECOLOGY PROGRESS SERIESMar Ecol Prog Ser
Vol. 532: 41–57, 2015doi: 10.3354/meps11344
Published July 21
INTRODUCTION
Spatial heterogeneity is an intrinsic feature of eco-logical communities, and quantifying the hierarchi-cal scales of this variability is a fundamental goal ofecology (Levin 1992). Numerous ecological and envi-ronmental factors, acting on different spatial scales,affect the variable abundance and distribution ofspecies across a landscape (Menge & Olson 1990).Heterogeneity in community or assemblage structureis driven by succession (Odum 1969), which in turn isdriven by disturbance (Connell 1978). Mechanismsbehind the relationship between disturbance, suc-
cession, and community structure include life historystrategies, nutrient uptake, reproductive potential,and interspecific competition (Connell & Slatyer1977). Therefore, identifying scales of the greatestheterogeneity can elucidate which scale-dependentprocesses exert the most influence on communitystructure.
In many ecosystems, the smallest scales are charac-terized by stochastic events or processes, while atlarger scales these random processes and patchy dis-tributions even out and become more generalizableas biogeographic patterns (Levin 1992, Coleman2002, Fraschetti et al. 2005). However, small-scale
© Inter-Research 2015 · www.int-res.com*Corresponding author: [email protected]
Quantifying scales of spatial variability in algal turf assemblages on coral reefs
J. L. Harris*, L. S. Lewis, J. E. Smith
Center for Marine Biodiversity & Conservation, Scripps Institution of Oceanography, University of California San Diego, La Jolla, California 92037, USA
ABSTRACT: Quantifying variability over multiple spatial scales is a fundamental goal in ecology,providing insight into which scale-dependent processes most strongly influence community struc-ture. On coral reefs, the ubiquitous turf algae are the primary food source for herbivores and com-petitors for space with corals. Turf algae will likely increase in the future, because they thriveunder conditions that reduce coral cover. Turfs are typically treated as a single homogeneousfunctional group, but analyzing them as a variable assemblage is more informative. We used ahierarchical sampling design to quantify 4 scales of variability in turf assemblages from centime-ters (within single dead coral heads) to kilometers (across islands) on the rarely studied LhaviyaniAtoll, Maldives. We used 4 metrics, each reflecting different ecological processes: percent cover,canopy height, richness, and assemblage composition. For most of these metrics, variability wassignificant at multiple spatial scales. However, for all metrics, the smallest scale (centimeters)explained the greatest proportion of overall variability. The least variability in cover, canopyheight, and richness occurred among sites (100s meters), suggesting that processes such as com-petition, predation, and vegetative growth are heterogeneous at small scales. In contrast, assem-blage composition was least variable at the largest scale (kilometers), suggesting that oceano-graphic processes or a well-mixed propagule supply reduce variability. With declining coral andincreasing cover of turf on reefs worldwide, it will become increasingly important to understandthe dynamics of coral−turf competitive interactions. However, because turf assemblages arehighly variable at small spatial scales, these interactions require more detailed consideration.
KEY WORDS: Epilithic algal matrix · Spatial variability · Algal assemblage · Patchiness · Hierarchical analysis
Resale or republication not permitted without written consent of the publisher

Mar Ecol Prog Ser 532: 41–57, 2015
patchiness is not simply random, ecological noise(Coleman 2002). In terrestrial, aquatic, and marinesystems, small-scale heterogeneity and communitydiversity is driven by dispersal ability (Levin 1992,Marhaver et al. 2013), micro-patchiness in the physi-cal habitat or substrate, and both facilitative andinhibitive biological interactions (Pacala & Levin1997). At larger scales (e.g. >100 km), biogeographicfactors, such as habitat and long-distance dispersal,appear to be more important (Underwood & Chap-man 1996, Fraschetti et al. 2005). This spatial vari-ability can be either compounded or counteracted bytemporal variation, particularly in systems wheresmall-scale spatial heterogeneity is the largest sourceof variation (Underwood 1991). However, interac-tions between spatial and temporal scales of varia-tion require explicit examination of nested scales inboth dimensions, which was beyond the scope of thisstudy. Therefore, here we examine only the spatialaspects of variability as a foundation for future inves-tigation into temporal variability.
Marine benthic community structure is typically,but not always, most spatially variable at small scales(Fraschetti et al. 2005). Grazing and competition (Ste-neck & Dethier 1994) are two of the most dominantprocesses that drive succession and thus heterogene-ity in community structure. However, the effects ofgrazing are widely variable at scales ranging frommeters (Iveša et al. 2010, Poray & Carpenter 2014) tolocal (Fletcher 1987) and regional scales (Foster1990). Disturbance has long been known to play amajor role in driving variability among communitiesseparated by several meters in the rocky intertidaland subtidal habitats (Sousa 1979, Smale et al. 2010),and large-scale disturbances such as storms, fires, orEl Niño events can create heterogeneity over a scaleof 10s or 100s of meters (Kennelly 1987, Collins 1992,Dayton et al. 1992). Propagule dispersal and recruit-ment contribute to community heterogeneity at bothsmall (meters) (Andrew & Viejo 1998) and very large(100s of kilometers) spatial scales (Deysher & Norton1981), depending on the type of reproduction (Bell-grove et al. 2004).
Many of these processes contribute to heterogene-ity in marine algal assemblages, which can be mostvariable at scales ranging from centimeters (Rowan &Knowlton 1995) to kilometers (Tribollet et al. 2010).Importantly, though, marine algal assemblagesappear to not be consistently structured at a globalscale. One of the most widely applicable trends inglobal diversity patterns, the latitudinal diversity gra-dient, is a broad pattern of high species diversity atthe equator and decreasing diversity as latitude
increases (Pianka 1966). While the latitudinal diver-sity gradient is observed in almost every group oforganisms in marine, terrestrial, and aquatic envi-ronments (Witman & Roy 2009), it, notably, does notapply to marine macroalgae (Santelices et al. 2009).Therefore, smaller-scale processes may be moreimportant in driving variability in algal communities.Specifically, heterogeneous recruitment and recov-ery from disturbance appear to be the most influen-tial in structuring temperate algal turfing assem-blages, which are most heterogeneous at smallerscales (Chapman & Underwood 1998).
Turf algae comprise a multi-species assemblage oftaxonomically diverse algae and cyanobacteria. Thedefinition of algal turf varies among temperate andtropical systems (Hatcher & Larkum 1983, Connell etal. 2014), sometimes including associated inverte-brates (Huff 2006) and organic matter (Wilson et al.2003). Here, tropical turf refers to only the algal component of the community with a canopy height ofless than 1 cm. On coral reefs, turf algae are typicallyfound growing on the calcium carbonate substrata ofdead corals and rubble.
Turf assemblages are ecologically important, abun-dant, and significantly understudied components ofthe coral reef ecosystem. Turf algae are the mainsource of primary production on reefs (Wanders1976), the primary food source for most coral reef her-bivores (Carpenter 1986, Ledlie et al. 2007), can re-duce the abundance of both adult and juvenile coralsdirectly (i.e. overgrowth, allelochemicals) and indi-rectly (i.e. pre-emption of space, overgrowth of crus-tose coralline algae) (Birrell et al. 2005, 2008, Vermeijet al. 2010), and are rapid colonizers of open space after physical disturbances (Fong & Paul 2011), coralbleaching and disease (Diaz-Pulido & McCook 2002),and corallivory (Bonaldo & Bellwood 2009). Turfalgae are more abundant than both coral and macro-algae on many coral reefs (Wismer et al. 2009), andare likely to become more abundant in the future, be-cause they thrive under conditions that threaten coralhealth, such as overfishing of herbivores, nutrientpollution (Smith et al. 2010), ocean acidification (Fal -kenberg et al. 2013), and sedimentation (Birrell et al.2005). As anthropogenic impacts become more fre-quent and more extreme, turf algae will likely play anincreasingly central role in the coral reef communitiesof the future. Therefore, a more comprehensive understanding of the structure and variability of turfassemblages is needed to better understand the over-all ecology of reef ecosystems.
Most ecological studies treat turf algae as a singlehomogeneous functional group. However, there is
42

Harris et al.: Spatial scales of algal turf variability
mounting evidence that different turf assemblagesmay play variable ecological roles. Turf assemblagesat different successional stages vary in canopyheight, density, and heterogeneity, causing variableeffects on coral larval settlement (Birrell et al. 2005).Canopy height in particular may be an importantphysical trait of turf algae, as taller turf assemblagestrap more sediment, making them less susceptible toherbivory and possibly triggering a positive feedbackloop leading to a persistent state of ungrazed, sedi-ment-laden turf that is inhospitable to coral settle-ment (Bellwood & Fulton 2008). In addition to canopyheight, morphologically distinct species within a turfassemblage have predictable differences in produc-tivity, longevity, and susceptibility to herbivory (Ste-neck & Dethier 1994, Padilla & Allen 2000). Forexample, turf assemblages dominated by simple, fil-amentous algae would likely respond more quicklyto nutrient enrichment but be more susceptible toherbivory compared to more complex corticated orcalcified species. Individual turf algae species thatare superior competitors to corals (Jompa & McCook2003) might be more likely to overgrow existingcorals or prevent coral recovery following a distur-bance event, while presence of taxa that are pre-ferred by herbivores would indicate low levels of her-bivory. A closer examination of both the physicaltraits and taxonomic composition of turf assemblagesis needed.
There are few studies that have explicitly ad dres -sed how tropical turf assemblages vary across spatialscales, and the results are thus far conflicting. Diver-sity and assemblage structure vary across oceanbasins (Anderson et al. 2005), across 10s (Diaz-Pulido& McCook 2002, Stuercke & McDermid 2004) or 100sof kilometers (Chapman & Underwood 1998), withdepth (Anderson et al. 2005), based on successionalstage following a coral bleaching event (Diaz-Pulido& McCook 2002) and within damselfish territories(Lison de Loma & Ballesteros 2002), and in responseto experimental manipulations of herbivory and nu -trients (Smith et al. 2010). These results demonstrate
quantifiable spatial patterns in turf assemblages andsuggest that turf assemblage composition could berelated to ecological function or environmental con-ditions. However, it remains unclear to what degreetropical turf assemblages vary at different spatialscales within a given system. A quantitative under-standing of spatial variation in turf assemblageswould help elucidate the spatial patterns of the bio-logical and physical processes driving benthic reefcommunity structure (Table 1). Once spatial patternsare understood, we can begin to examine both theprocesses that cause those patterns and the effects ofthose patterns on the community and ecosystem.Here we take the first step by quantifying the spatialpatterns of a tropical turf assemblage.
Specifically, the purpose of this study was todescribe a variety of turf assemblage characteristicsat a greater level of detail than typically studied andto identify how these characteristics vary across spa-tial scales. To identify any scale-dependent processesthat contribute most to the structure of tropical algalturf assemblages, we compared 4 functionally dis-tinct metrics (total percent cover, canopy height, rich-ness, and assemblage composition) that each reflectdifferent dimensions of the ecological role of turfalgae, identifying the spatial scale (mm, cm, m, km)that explained the majority of variation for each metric.
MATERIALS AND METHODS
Site description and sample collection
Turf algae were collected from the lagoonal reefflat of Lhaviyani Atoll (also called Faadhippolhu),Republic of the Maldives (Fig. 1). Lhaviyani is in thenorthern part of the Maldivian Archipelago in theIndian Ocean. The atoll is approximately 35 km indiameter and is made up of 54 islets, 5 of which areinhabited, with a total atoll population of approxi-mately 9000 (Ministry of Planning and National
43
Scale Distance between replicates n Processes
Punch 10 cm (1 × 10⁻¹ m) 256 Microhabitat suitability, vegetative growth, competition, herbivory
Colony 1 m (1 × 100 m) 64 Vegetative growth, morphology, competition, herbivory, time since coral death
Site 100 m (1 × 10² m) 16 Herbivory, abiotic environment
Island 5−10 km (1 × 10⁴ m) 4 Currents, propagule dispersal, herbivory, nutrient availability
Table 1. Sampling strategy at hierarchical spatial scales and the processes that likely contribute the most to heterogeneity at each scale

Mar Ecol Prog Ser 532: 41–57, 2015
Development 2007). The lagoon is physically shel-tered but open to ocean flushing and swell and isdominated by massive Porites and branching Acrop-ora corals. Lagoon depths of approximately 50 mhave been reported. The tropical climate is driven byseasonal monsoons, with westerly winds over the wetsummer and easterly winds in the drier winter.
Reefs in Lhaviyani Atoll were recently affected by2 major disturbance events: a massive bleachingevent in 1998 and a tsunami in 2004. The bleachingevent resulted in almost complete loss of branchingand tabular corals in the portion of the atoll that wasinvestigated (Loch et al. 2002, 2004). The tsunamicompletely washed over Lhaviyani’s islands (Fritz etal. 2006, I. K. Mohamed pers. comm.), which reach amaximum elevation of 1.5 m above sea level, but itwas less damaging there than in more southern partsof the Maldives. While scientific data are lacking forLhaviyani’s reefs, these 2 significant disturbanceslikely ‘reset’ much of the reef ecosystem, killingmany corals and opening up space for turf coloniza-
tion. Algal turf assemblages in Lhaviyani are likelyrepresentative of algal turfs on other reefs that haveexperienced similar large-scale disturbances in thepast few decades.
To quantify spatial variability in turf assemblages,replicate samples were collected using identical me -thods at 4 different scales: sample/punch (separatedby ~10 cm), colony (separated by ~1 m), site (sepa-rated by ~100 m), and island (separated by ~10 km).Smaller scales reflect stochastic biological events andprocesses, such as different algal growth morpholo-gies or individual herbivore grazing scars, whilelarger scales reflect broader population- or land-scape-level processes including herbivore popula-tions, propagule supply, and the abiotic environment(including thermal histories and bleaching events;Table 1).
Each scale was sampled with 4 replicates for a totalof 256 turf samples. Samples were collected bySCUBA divers using a 1.3-cm diameter steel hollowpunch and mallet, resulting in an area of 1.27 cm2 per
44
Fig. 1. Hierarchical spatial arrangement of sampling locations. Algal turf samples were collected (A) from the Republic of theMaldives in the Indian Ocean, (B) from Lhaviyani Atoll in the northern part of the Maldives archipelago, (C) at 4 islands within
Lhaviyani Atoll, and (D−G) from 4 sites at each island
Harris et al.: Spatial scales of algal turf variability 45
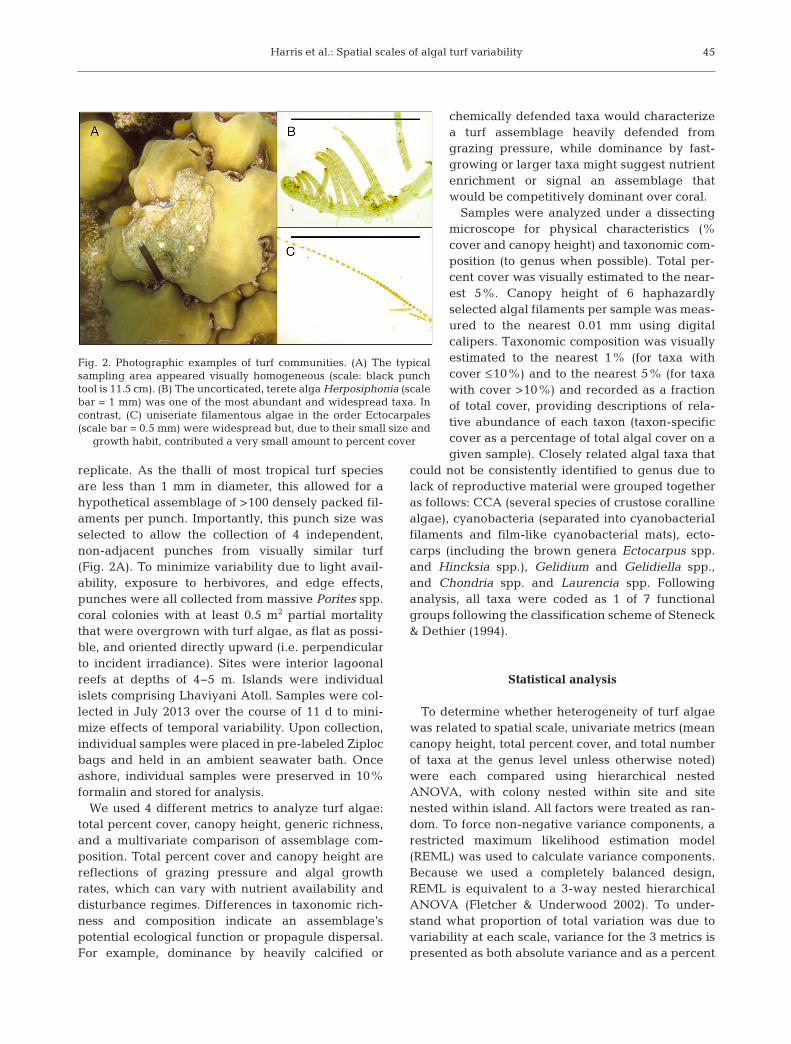
replicate. As the thalli of most tropical turf speciesare less than 1 mm in diameter, this allowed for ahypothetical assemblage of >100 densely packed fil-aments per punch. Importantly, this punch size wasselected to allow the collection of 4 independent,non-adjacent punches from visually similar turf(Fig. 2A). To minimize variability due to light avail-ability, exposure to herbivores, and edge effects,punches were all collected from massive Porites spp.coral colonies with at least 0.5 m2 partial mortalitythat were overgrown with turf algae, as flat as possi-ble, and oriented directly upward (i.e. perpendicularto incident irradiance). Sites were interior lagoonalreefs at depths of 4−5 m. Islands were individualislets comprising Lhaviyani Atoll. Samples were col-lected in July 2013 over the course of 11 d to mini-mize effects of temporal variability. Upon collection,individual samples were placed in pre-labeled Ziplocbags and held in an ambient seawater bath. Onceashore, individual samples were preserved in 10%formalin and stored for analysis.
We used 4 different metrics to analyze turf algae:total percent cover, canopy height, generic richness,and a multivariate comparison of assemblage com -position. Total percent cover and canopy height arereflections of grazing pressure and algal growthrates, which can vary with nutrient availability anddisturbance regimes. Differences in taxonomic rich-ness and composition indicate an assemblage’spotential ecological function or propagule dispersal.For example, dominance by heavily calcified or
chemically defended taxa would characterizea turf assemblage heavily defended fromgrazing pressure, while dominance by fast-growing or larger taxa might suggest nutrientenrichment or signal an assemblage thatwould be competitively dominant over coral.
Samples were analyzed under a dissectingmicroscope for physical characteristics (%cover and ca nopy height) and taxonomic com-position (to genus when possible). Total per-cent cover was visually estimated to the near-est 5%. Canopy height of 6 haphazardlyselected algal filaments per sample was meas-ured to the nearest 0.01 mm using digitalcalipers. Taxonomic composition was visuallyestimated to the nearest 1% (for taxa withcover ≤10%) and to the nearest 5% (for taxawith cover >10%) and recorded as a fractionof total cover, providing descriptions of rela-tive abundance of each taxon (taxon-specificcover as a percentage of total algal cover on agiven sample). Closely related algal taxa that
could not be consistently identified to genus due tolack of reproductive material were grouped togetheras follows: CCA (several species of crustose corallinealgae), cyanobacteria (separated into cyanobacterialfilaments and film-like cyanobacterial mats), ecto-carps (including the brown genera Ectocarpus spp.and Hincksia spp.), Gelidium and Gelidiella spp.,and Chondria spp. and Laurencia spp. Followinganalysis, all taxa were coded as 1 of 7 functionalgroups following the classification scheme of Steneck& Dethier (1994).
Statistical analysis
To determine whether heterogeneity of turf algaewas related to spatial scale, univariate metrics (meancanopy height, total percent cover, and total numberof taxa at the genus level unless otherwise noted)were each compared using hierarchical nestedANOVA, with colony nested within site and sitenested within island. All factors were treated as ran-dom. To force non-negative variance components, arestricted maximum likelihood estimation model(REML) was used to calculate variance components.Because we used a completely balanced design,REML is equivalent to a 3-way nested hierarchicalANOVA (Fletcher & Underwood 2002). To under-stand what proportion of total variation was due tovariability at each scale, variance for the 3 metrics ispresented as both absolute variance and as a percent
Fig. 2. Photographic examples of turf communities. (A) The typicalsampling area appeared visually homogeneous (scale: black punchtool is 11.5 cm). (B) The uncorticated, terete alga Herposiphonia (scalebar = 1 mm) was one of the most abundant and widespread taxa. Incontrast, (C) uniseriate filamentous algae in the order Ectocarpales(scale bar = 0.5 mm) were widespread but, due to their small size and
growth habit, contributed a very small amount to percent cover

Mar Ecol Prog Ser 532: 41–57, 2015
of total variation for each response variable sepa-rately (the ‘magnitude of effect’; Graham & Edwards2001), thus allowing us to quantify total variabilityattributed to each scale and to determine the propor-tion of total variability that occurs between specificscales, respectively (Edwards 2004). While present-ing variance components as proportions preventsdirect comparisons across metrics (Underwood 1997),it does allow for a clearer picture of patterns of vari-ability across scales within a given metric. To providean estimate of the uncertainty in the variance compo-nents, 95% confidence intervals of variance compo-nents were calculated using parametric bootstrap-ping. Hierarchical ANOVAs and bootstrapping wereperformed using the lmer and confint functions (lme4package), respectively, in R 3.1.2 (R DevelopmentCore Team, www.r-project.org).
Multivariate approaches were used to test whetherspatial variability in turf assemblage composition, atthe genus level, was related to scale. A hierarchicalnested PERMANOVA (permutation-based multivari-ate ANOVA; Anderson 2001) with 3 factors (island,site, and colony) was run on a Bray-Curtis similaritymatrix of relative percent cover data using PRIMER-E (v6). As with univariate metrics, colony was nestedwithin site and site was nested within island; all fac-tors were treated as random. Variance componentsfor each spatial scale were calculated from thePERMANOVA mean squares, and statistical signifi-cance was tested under a reduced model with 9999permutations. As with the univariate metrics, PERM-ANOVA variance components are presented as bothabsolute variance (square roots of estimates of com-ponents of variation; Anderson et al. 2008) and as aproportion of total variability within each responsevariable separately (Underwood & Chapman 1996).
To visually represent the similarity in turf assem-blage structure within and among spatial scales, non-metric multidimensional scaling (nMDS) plots of all256 samples were created based on ranked Bray−Curtis similarities. To visually represent the structureof turf assemblages for each island separately, indi-vidual nMDS plots were created for each of the 4islands based on Bray−Curtis similarities of genus-level percent cover data.
We used a square-root transformation to increasethe influence of less common taxa that could haveunique ecological functions. We performed all analy-ses on both transformed and untransformed data.However, because the transformation made no mate-rial difference in the results or interpretation, wepresent only the untransformed data below.
RESULTS
Turf assemblage composition
We identified 29 taxa (including the few higher-order taxa that were indistinguishable to finer genuslevel) from 11 orders across 4 algal phyla (Table 2).Red algae were both the most common, accountingfor 16 of the 29 taxa, and the most abundant taxa,accounting for 56% of the total algal assemblage bycover. These patterns of red algal occurrence weredriven by the abundant and diverse order Cerami-ales, which accounted for 9 taxa and 40% of algae bycover. Seven of the 8 functional groups identified bySteneck & Dethier (1994) were represented, exclud-ing only leathery macrophytes, which typically in -clude only large macroalgae species not commonlyfound in turf assemblages. The most common func-tional group, in terms of prevalence in samples, wascorticated terete algae, which included most of thetaxa from the order Ceramiales.
The most abundant taxa were filamentous cyano-bacteria (30 ± 22% cover, occurring on 93% of indi-vidual punches) and Polysiphonia spp. (29 ± 22%cover, occurring on 93% of punches; Figs. 3 & 4). Thenext most abundant taxa, Gelidium/-iella spp., Her-posiphonia spp. (Fig. 2B), and Dictyota spp., eachhad mean cover of less than 9% (Figs. 3, 4). Gelid-ium/-iella spp. and Herposiphonia spp. were bothabundant and widespread and were found on 62%and 68% of punches, respectively (Figs. 3, 4). In con-trast, while Dictyota spp. were abundant, they werenot widespread and were found in just 17% ofpunches (Figs. 3, 4). However, when present theycovered a large proportion of the substrate.
Most taxa were rare: 17 taxa had less than 1%cover (Table 2), either because they were physicallysmall filaments that, due to their growth habit, didnot cover much of the substrate (e.g. Cladophoraspp., Sphacelaria spp., and Ectocarpales; Fig. 2C), orbecause they were only found on 1 or 2 individualpunches (e.g. Griffithsia spp., Peyssonnelia spp., and2 unidentified taxa).
Turf cover, height and richness
Total cover, canopy height, and richness were allapproximately normally distributed based on distri-butions and quantile−quantile plots, thereby satisfy-ing the assumptions for ANOVA. Mean total algalcover across all punches was 57.5% (±1.6 SE), rang-ing from 10% to 100%. The remaining space was
46

Harris et al.: Spatial scales of algal turf variability
either bare limestone or microbial films. ANOVArevealed significant variation in total cover at thescales of island and colony but not among sites(Table 3).
Eight key taxa were selected tomore closely investigate ecologicallyrelevant variability across scales.These taxa included the 5 most abun-dant taxa (cyanobacterial filaments,Polysiphonia spp., Herpo siphoniaspp., Gelidium/-iella spp., and Dicty-ota spp.; Table 2), one ‘ecologicallypositive’ taxon known to be benefi-cial to reef accretion and coral settle-ment (CCA), and 2 ‘ecologicallydetrimental’ taxa known to haveharmful effects on coral (Corallophilaspp. and Anotrichium spp.; Jompa &McCook 2003). Cover of all of theserepresentative taxa was highly vari-able across sites, with no discernible
patterns in abundance at the colony, site, or islandlevel (Fig. 4).
Mean canopy height across all punches was1.3 mm (±0.03 SE), ranging from 0.4 to 3.8 mm. Mean
47
Taxon % Cover % Occurrence Order Phylum Functional group
Cyanobacterial filaments 30.0 93.4 − Cyanophyta MICPolysiphonia 28.9 93.0 Ceramiales Rhodophyta CRTGelidium/-iella 8.7 62.1 Gelidiales Rhodophyta CRTHerposiphonia 7.9 67.6 Ceramiales Rhodophyta CRTDictyota 6.9 16.8 Dictyotales Ochrophyta CFLCCA 5.0 27.7 Corallinales Rhodophyta CRUEctocarpales (multiple families) 2.8 30.1 Ectocarpales Ochrophyta FILCaulerpella <2 41.0 Bryopsidales Chlorophyta SPHCeramium <2 22.7 Ceramiales Rhodophyta CRTUlva <2 16.0 Ulvales Chlorophyta FOLAnotrichium <2 12.9 Ceramiales Rhodophyta FILGelidium − blades <2 11.3 Gelidiales Rhodophyta CFLCladophora <1 18.0 Cladophorales Chlorophyta FILCorallophila <1 8.6 Ceramiales Rhodophyta CRTCyanobacterial mats <1 5.5 – Cyanophyta MICCaulerpa <1 4.3 Bryopsidales Chlorophyta SPHSphacelaria <1 4.3 Sphacelariales Ochrophyta FILBryopsis <1 3.9 Bryopsidales Chlorophyta SPHJania <1 3.1 Corallinales Rhodophyta ARTCentroceras <1 2.3 Ceramiales Rhodophyta CRTChondria/Laurencia <1 <2 Ceramiales Rhodophyta CRTChampia <1 <2 Rhodomeniales Rhodophyta CRTLobophora <1 <2 Dictyotales Ochrophyta CFLRhipidosiphon <1 <2 Bryopsidales Chlorophyta SPHCondrophycus/Laurencia <1 <1 Ceramiales Rhodophyta CRTGriffithsia <1 <1 Ceramiales Rhodophyta FILPeyssonnelia <1 <1 Peyssonneliales Rhodophyta CRFUnknown red blade <1 <1 − Rhodophyta CRFUnknown sp. <1 <1 − − −
Table 2. All algal taxa found, including percent cover (of all 256 punches) and percent occurrence (percentage of punches inwhich each taxon occurred). Functional groups are after Steneck & Dethier (1994): MIC: single-celled microalgae and cyano-bacteria; FIL: simple uniseriate filaments; FOL: foliose (sheet of cells); CFL: complex foliose (multiple layers of cells); CRT:complex or corticated terete; ART: articulated calcified; CRU: calcified crusts; SPH: siphonous). CCA: crustose coralline algae.
Abundances of the taxa shown in bold are presented in Fig. 4
Fig. 3. Relative contribution by cover (mean ± 1 SE) of the 5 most abundant taxaon each island. Means and standard errors were calculated by treating all 64
punches on an island as individual replicates

Mar Ecol Prog Ser 532: 41–57, 2015
canopy height varied significantly only amongcolonies and not at greater scales among sites orislands (Table 3).
Mean generic richness of all punches was 5.5(±0.1 SE) taxa per punch (per 1.3 cm2). Richnessranged from 1 to 10 taxa per punch. Vavvaru had thelowest mean richness at all spatial scales, but alsohad the single punch with the highest richness.There was significant variation in number of taxa atthe scales of island and colony, but not among sites(Table 3). The cumulative number of unique taxaincreased with sampling area and appeared toapproach an asymptote (n = 29 taxa) across all 256punches (approximately 340 cm2 sampled; Fig. 5).
Variance components for all 3 of these univariatemeasures were greatest at the smallest scale(Table 3), such that the smallest spatial scale ex-plained the largest proportion of the total variation(Fig. 6). Estimates of residual variance were alwaysgreater than variance at any other scale and ac-counted for more than 50% of the total variability,
48
Fig. 4. Mean (±1 SD) cover of 8 key taxa by colony (n = 4 colonies per site) at each of 4 sites on each island (Maafilaafushi, Vav-varu, Hurvalhi, and Kanuhara): (A) cyanobacterial filaments, (B) Polysiphonia spp., (C) Gelidium/-iella spp., (D) Dictyota spp.,(E) Herposiphonia spp., (F) crustose coralline algae (CCA), (G) Corallophila spp., and (H) Anotrichium spp. Taxa selected werethe most abundant (A−E), known to have a positive effect on corals (F), or known to have a negative effect on corals (G,H)
Fig. 5. Cumulative number of unique taxa at each spatialscale. Horizontal bars show medians, boxes are drawn at thefirst and third quartiles, whiskers display the range of thedata, and outliers (open circles) are more than 1.5 times the
interquartile range outside the box

Harris et al.: Spatial scales of algal turf variability
indicating that there was high vari-ation among in dividual punches.Both absolute and proportional va -riability decreased as spatial scaleincreased from the punch to the sitelevel, which always contributedthe least to total variance (Table 3,Fig. 6). In fact, among-site variabil-ity contri buted almost 0% to overallvariability for both total cover andrichness. Among-island variabilityalways explained a greater propor-tion of total variation than among-site variability. Although variabilitywas highly significant at all spatialscales, the 95% confidence inter-vals of variance components wereoverlapping among many of thelarger scales. However, the confi-dence interval around variance atthe punch level did not overlap anyother confidence intervals for eitherpercent cover or mean canopyheight.
Scales of assemblage variation
Variability in taxonomic similarity among assem-blages was significant at all spatial scales based onnested PERMANOVA (Table 4). As with the univari-ate metrics, multivariate variability was greatest atthe smallest scales, and variance components de -creased (assemblages became more homogeneous)as spatial scale in creased (Table 4, Fig. 7D). Therewas approximately 32% residual variability unex-
plained by the scales sampled, indicating that thegreatest proportion of multivariate heterogeneitywas among individual punches. The variance compo-nents were significantly different from zero at allspatial scales based on 9999 permutations (Ta ble 4)and followed the same pattern as the results obtainedfrom the nested univariate ANOVAs.
The clear pattern of variability decreasing as spa-tial scale in creases is reflected in the nMDS plot of all256 samples (Fig. 7C), which shows no clear group-
49
Source df MS F p Variance 95% CI component
Total percent cover Island 3 2809 4.815 0.020 28.2 [0, 102.9]Site (Island) 12 583.3 0.5279 0.89 0 [0, 45.6]Colony (Site (Island)) 48 1105 2.160 0.0001 122.2 [43.0, 191.1]Residual = Punch 192 511.6 511.7 [432.8, 604.5]Total 255
Mean canopy height Island 3 0.9592 2.163 0.15 0.008 [0, 0.03]Site (Island) 12 0.4435 1.310 0.24 0.006 [0, 0.03]Colony (Site (Island)) 48 0.3386 3.574 <0.0001 0.061 [0.03, 0.09]Residual = Punch 192 0.0947 0.095 [0.08, 0.1]Total 255
Taxonomic richness Island 3 33.9 9.555 0.0017 0.49 [0, 1.5]Site (Island) 12 3.553 0.9094 0.55 0 [0, 0.19]Colony (Site (Island)) 48 3.908 2.332 0.0001 0.54 [0.02, 0.8]Residual = Punch 192 1.676 1.68 [0, 2.0]
. 255
Table 3. Results of the hierarchical nested ANOVA tests, using a restricted maxi-mum likelihood estimation model, on total algal cover, canopy height, and taxo-nomic richness. All factors were treated as random effects. Significance effects forα = 0.05 are shown in bold. Confidence intervals were calculated by bootstrap-ping. The proportion of variance explained by each spatial scale is presented in
Fig. 6
Fig. 6. Percent of total varia-tion in 3 turf characteristics ex -plained by each spatial scale.Percent variation ex plainedwas calculated as the ‘mag -nitude of effect’ of each scale:individual variance compo-nents divided by the sum of allvariance components for eachmetric. Estimates of uncer-tainty around variance compo-nents, presented as 95% confi-dence intervals, are presented
in Table 3

Mar Ecol Prog Ser 532: 41–57, 2015
ing among samples at the colony, site, or island level.Instead, individual punches are fairly evenly scat-tered such that larger-scale groups overlap com-pletely (i.e. islands almost completely overlap allother islands).
The same inverse relationship between variabilityand spatial scale are visible in nMDS plots of
assemblage structure at individualislands (Fig. 8). There is no clearvisual separation between sites be -cause variability is greater withinthan among sites. Note, however,that with such large sample sizes (n= 64) the nMDS stress ranges from0.16 to 0.19, and therefore theseconfigurations should be interpretedconservatively.
DISCUSSION
All of the turf algal parameters measured hereshow the greatest variability at the smallest spatialscales, among assemblages separated by centime-ters. While in some cases there was statistically sig-nificant variability at other spatial scales (and in fact,variance was highly significant at all spatial scales
50
Source df MS Pseudo-F p (perm) Variance component
Island 3 9231.6 1.943 0.0198 70.02Site (Island) 12 4750.3 1.681 0.0037 120.25Colony (Site (Island)) 48 2862.4 2.052 0.0001 362.27Residual = Punch 192 1377.3 1377.3Total 255
Table 4. Permutational multivariate ANOVA based on Bray−Curtis dissimilar-ities of relative percent cover of turf algae genera. Analysis was based on 9999permutations. Significance effects for α = 0.05 are shown in bold. The propor-
tion of variance explained by each spatial scale is presented in Fig. 7
Fig. 7. Comparison of 2 possible relationships between variability and spatial scale. (A) Theoretical non-metric multidimen-sional scaling (nMDS) plot of similarity among samples from 4 different spatial scales in which communities are most similarat smaller scales (e.g. within a single colony) and most dissimilar at larger scales (among islands). Symbols differentiate the 4islands: , Vavvaru; , Kanuhara; , Maafilaafushi; , Huruvalhi. This clustering pattern in an MDS plot would correspondto (B) a theoretical positive relationship between spatial scale and percent of total variation in taxonomic composition, wherethe greatest amount of variation in community composition occurs among samples from different islands. (C) Actual nMDSplot of all samples (n = 256) based on Bray−Curtis similarities (stress = 0.2) of untransformed relative abundances. Symbols dif-ferentiate the 4 islands as in A. (D) Actual percent of total variation in turf communities explained by each spatial scale from
square roots of estimates of variance components from PERMANOVA (Table 4)

Harris et al.: Spatial scales of algal turf variability
under the PERMANOVA model with 9999 permuta-tions; Table 4), by far the largest proportion of totalvariability always occurred at the smallest scale. Thisinverse relationship between spatial scale and vari-ability suggests that at least some processes operat-ing at small scales, such as grazing by herbivores,competition, propagule settlement, and vegetativegrowth, are important in structuring turf algal assem-blages on these Maldivian coral reefs. Alternately,turf algae assemblages may vary over time andalthough we controlled for it here, temporal variabil-ity can actually conflate spatial variability on verysmall scales (Underwood 1991). However, the rela-tive strengths of temporal and spatial variation areinconsistent (e.g. see opposite results in Hughes et al.1999, Kelaher & Levinton 2003). Therefore, here welimit our interpretation to processes that drive spatialpatterns.
Other studies that have examined structure of mar-ine algal and benthic invertebrate assemblages athierarchical spatial scales have documented similarinverse relationships between variability and spatialscale (reviewed in Fraschetti et al. 2005; see alsoWiens 1989, Underwood & Chapman 1996, Smale etal. 2010, O’Leary & Potts 2011). Most heterogeneityin benthic marine taxa occurs at small, but not always
the smallest, scales (10s of centimeters to severalmeters) (Fraschetti et al. 2005). For example, temper-ate turf algal assemblages display the greatest varia-tion at the centimeter scale (Coleman 2002), and intropical marine environments specifically, coral reeffish assemblages are heterogeneous among individ-ual patch reefs and become more homogeneous atlarger scales (Wiens 1989). In contrast, however,coral cover varies widely among reefs separated byseveral kilometers, though this effect depends onreproductive strategy (brooders versus spawners;Hughes et al. 1999).
Such spatial patterns in benthic organisms can bedriven by recruitment variability. There is experi-mental evidence that variable recruitment drivessmall-scale heterogeneity at the scale of 10s of cen-timeters in temperate macroalgae (Bellgrove et al.2004, Smale et al. 2010) and invertebrates living intemperate turf algae (Kelaher 2005). As a generalrule, marine animals with limited dispersal are mostvariable at the centimeter to meter scale (Underwood& Chapman 1996). Organisms with planktonic larvaevary at larger scales than do organisms with directdevelopment (Fraschetti et al. 2005). Turf algae,specifically, have been show to vary at the centimeterscale due to recruitment patterns (Coleman 2002).
51
Fig. 8. Non-metric multidimensional scaling plots of untransformed relative abundance on punches (n = 64) from each island.Colors indicate site (for all islands, green = site 1, orange = site 2, dark blue = site 3, light blue = site 4) and shapes indicatecolony (for all islands, square = colony 1, diamond = colony 2, triangle = colony 3, inverted triangle = colony 4). Stress values
are 0.16 (Huruvalhi, Vavvaru, Maafilaafushi) and 0.19 (Kanuhara)

Mar Ecol Prog Ser 532: 41–57, 2015
However, since algal dispersal can be hyper-local(<1 km) or more regional (up to 100 km) (Shanks etal. 2003), and algal recruitment varies temporally inspecies-specific ways (Bellgrove et al. 2004), we canexpect recruitment to drive species-specific spatialpatterns among algae that would sum to the hetero-geneous assemblages measured here.
In addition to recruitment, disturbance eventsinfluence spatial patterns because space is one of themost limiting resources in benthic communities. Wecan expect benthic communities to be variable atsmall scales where isolated chance events or biologi-cal interactions dominate a landscape, and at largerspatial scales where the physical disturbances suchas bleaching events, wave energy, storms, or tsu -namis are the main driving forces. For example, fol-lowing a large-scale bleaching event in Australia,turf succession varied among locations dependingupon both the bleaching severity and the local siteenvironment (Diaz-Pulido & McCook 2002). Recolo-nization after a space-clearing disturbance drivessmall-scale variability in temperate intertidal turfs(Benedetti-Cecchi & Cinelli 1994) and their infaunalinvertebrate assemblages (Olabarria 2002). How-ever, physical disturbances are less important thaninterspecific competition in structuring temperateturf assemblages (Maggi et al. 2012), and anthro-pogenic disturbances seem to structure turf variabil-ity on larger scales (kilometers) (Benedetti-Cecchi etal. 2001). As the largest variability we measured intropical turf algal assemblages was at the scale ofcentimeters, we propose that smaller-scale distur-bances are more important in structuring tropical turfcommunities.
Herbivorous grazing is one such spatial distur-bance that structures benthic reef communities (Ste-neck & Dethier 1994, Poray & Carpenter 2014) and,due to its mechanics, is likely to drive small-scalepatchiness of algal turf assemblages. Grazing bitescan be considered centimeter-scale ‘disturbances’that completely reset turf succession by cropping orentirely scraping the algae down to the underlyingcarbonate substrate (Bonaldo & Bellwood 2009), butthis effect depends on the type of grazer (Ceccarelliet al. 2011). The effect of grazing is pronounced forturf algae, because turf algae are the preferred foodsource for most reef herbivores (Carpenter 1986,Ledlie et al. 2007) and, consequently, on unfishedreefs, each square centimeter of turf is bitten up to6 times per day (Hamilton et al. 2014). Since suchintense grazing and its effects on algae are spatiallyvariable due to behavioral and ecological variationamong types of grazers (Carpenter 1986, Bonaldo &
Bellwood 2011, Sandin & McNamara 2012), onemight expect grazing to contribute to a patchymosaic of turf assemblages at different points in suc-cession, as has been observed in temperate intertidalalgae (Benedetti-Cecchi & Cinelli 1993). If herbivoreassemblages are consistent across reefs, this patternwould be repeated at the site and island scales, suchthat variability decreases as spatial scale increases.As the scale of greatest variability measured here,centimeters, is approximately the bite size of domi-nant reef grazers (herbivorous fishes and urchins),one plausible explanation for the observed scalesof spatial variability in turf algae is that turf assem-blages are patchy in response to the distribution ofherbivores across the landscape.
Although herbivores influence the spatial distribu-tion of benthic primary producers in most ecosys-tems, such effects tend to vary with the idiosyncraticcircumstances of each system. For instance, selectiveherbivory on specific morphologies or life stages canact as a special type of disturbance that increasesplant diversity (Hulme 1996). Grazing has beenexperimentally measured to be more important thanphysical factors in driving assemblage variability insubtropical intertidal microalgae (Christofoletti et al.2011) and in some temperate turf systems (Benedetti-Cecchi et al. 2000). However, grazing is a negligiblefactor in other temperate turf systems (e.g. seeBenedetti-Cecchi et al. 2012), so this comparison maynot be particularly informative for predicting pro-cesses that drive spatial patterns in tropical coral reefturf algae. And while spatially patchy grazing in -creases heterogeneity in corals (O’Leary & Potts2011), terrestrial vegetation (Adler et al. 2001), uni-cellular benthic marine algae (Sommer 2000), andintertidal coralline algae (Wai & Williams 2006), itseems to reduce spatial homogeneity of algae in astream even at very small scales (Sarnelle et al.1993). Therefore, while there are compelling reasonswhy grazing patterns might yield small-scale patchi-ness in turf algal assemblages, such effects are notassured.
An alternative explanation is that small-scalepatchiness is simply an inherent feature of mixed-species assemblages due to the diverse growth formsrepresented in a typical turf algal assemblage, analo-gous to the way that differences in life history strate-gies contribute to patchiness in terrestrial plantassemblages (Shmida & Ellner 1985). For example,Polysiphonia, Gelidiella/Gelidum, and Herposipho-nia were some of the most abundant and widespreadtaxa observed here. Where these red terete algaeoccurred, they branched out and crept across the
52

Harris et al.: Spatial scales of algal turf variability
substrate, leaving open space for other algae. In con-trast, Dictyota was also one of the most abundanttaxa, but it was not widespread. As a foliose alga, itgrows in a much different pattern than do terete fila-ments. In the few samples where it occurred, it grewas a thick mat, covering 100% of the substrate andleaving no room for other taxa. Smaller brown fila-mentous algae from the order Ectocarpales, whichgrow singly as simple filaments, and red calcifiedCCA, which grow as thick crusts, are further extremeexamples of the morphological diversity within themixed species turf assemblage. Such variable mor-phologies could explain the heterogeneity in existingassemblages, while random settlement processescould be responsible for starting individual turfassemblages on different trajectories. Both the ‘lot-tery hypothesis’ (Sale 1977) and the ‘carousel’ model(van der Maarel & Sykes 1993) rely on some amountof stochastic settlement, allowing many species withsimilar traits to take turns occupying the same nichespace. These models explain small-scale patchinessin temperate intertidal algae (Bastow Wilson et al.1992), and they could be equally applicable in tropi-cal turf algae. The observed patterns of small-scalepatchiness could be a straightforward result of sto-chastic settlement processes that are amplified asalgae grow in different ways.
Comparing the richness of turfs on Maldivian reefsmeasured here to turf diversity reported elsewhere isnot straightforward due to unknown relationshipsbetween α and β diversity of turf algae and the distri-bution of species at different spatial scales. Here, thesmallest unit measured was 1.27 cm2 and, with 256samples, the total area sampled was 324 cm2 acrossmore than 20 km of reef. Other studies have used dif-ferent areas, but it is not appropriate to simply stan-dardize by area. Still, taxonomic richness reportedhere falls within the range of richness reported else-where for tropical turf algae (Stuercke & McDermid2004, Anderson et al. 2005, Smith et al. 2010).
Total cover, canopy height, and taxonomic richnessall displayed the same pattern: decreasing variabilityas spatial scale increased from punch to colony tosite, and then greater variability at the island level.Therefore, these characteristics of turf assemblageswere relatively homogeneous within and among siteson a given island, but there was larger variabilityamong the 4 islands. That there was no discerniblevariation among sites (separated by 100−300 m) im -plies homogeneous environmental conditions withina given island, with dispersal barriers and/or differ-ent disturbance regimes (e.g. wave forcing or bleach-ing history) among islands. Therefore, we propose
that both very small-scale processes, such as vegeta-tive growth, herbivory, and competition, and larger-scale processes, such as propagule dispersal, likelyplay important roles in differentiating turf assem-blages on coral reefs.
Whatever processes drive the observed variation incanopy height may in part determine the ecologicalrole of turf algae. Turf canopy height is rarely manip-ulated experimentally or even measured at a resolu-tion matching the resolution presented here, butthere is indirect evidence that differences of just afew millimeters in canopy height could make a differ-ence in the ecology of turf on a coral reef. For exam-ple, an increase in turf canopy height of 3 mm (from<1 to 4 mm) increased the thickness of the benthicboundary layer (Carpenter & Williams 1993), withinwhich there are measured changes in pH, O2, andrates of photosynthesis and respiration (Larkum et al.2003). Further, thicker and taller turfs trap more sed-iment and organic matter than thinner and shorterturfs, which has negative effects on the survival ofcoral larvae (reviewed in Birrell et al. 2008). Sedi-ment within turf assemblages has strong effects onthe survival of canopy-forming macroalgae in tem-perate systems (Alestra et al. 2014), the infaunalinvertebrate community living in turf (Prathep et al.2003), and coral settlement success (Birrell et al.2005). Differences of millimeters in the amount ofaccumulated sediment within turf reduce the sur-vival of macroalgal recruits (Chapman & Fletcher2002), and match the scale of a proposed thresholdfor the creation of anoxic sediment (Clausing et al.2014). Though it has not been experimentally tested,we expect that millimeter changes in turf canopyheight could negatively affect the settlement and sur-vival of coral larvae, which are in the micron to mil-limeter size range, via sediment retention, smother-ing, or other mechanisms. Our measured range of 0.4to almost 4 mm matches the range in canopy heightshown to cause impacts in other studies. As there wassignificant variation in canopy height only amongcolonies, any effects of variation in turf canopy heightare acting on individual coral colonies. In future stud-ies, it would be interesting to experimentally test theeffect of turf canopy height on sediment retention,turf competitive ability, and coral larval settlement.
In contrast to the variability in canopy height andthe other univariate measures, multivariate variabil-ity in turf assemblage decreased monotonically asspatial scale increased, with variance in assemblageat the island scale explaining the smallest proportionof the total variability. These different patterns ofspatial variability for multivariate and univariate
53

Mar Ecol Prog Ser 532: 41–57, 2015
metrics suggest that processes governing these dif-ferent parameters act at separate scales. Any small-scale processes that determine assemblage structureare repeated and balanced out across larger spatialscales, while small-scale processes that determinecover, canopy, or richness increase slightly in vari-ability from the site to the island scale.
In addition to examining whole-assemblage char-acteristics, spatial patterns of key taxa may be par -ticularly informative about ecological processes. Forexample, 2 red algae known to be harmful to corals,Corallophila spp. and Anotrichium spp., were neithercommon nor abundant throughout the study(Table 2). However, closer inspection of their individ-ual spatial patterns (Fig. 4G−H) points to a handful ofindividual coral colonies where one or both of thesetaxa were relatively abundant. Therefore, we canpredict that those individual colonies either mayhave active coral−algal interaction zones or may, infact, be losing space to aggressive turf assemblagesladen with toxic red algae. And while among-islandvariability was the smallest proportion of overallassemblage variability, abundance patterns of these2 red algae taxa point to individual islands wherecorals may be susceptible to turf overgrowth: turfassemblages on Kanuhara and Maafilaafushi haverelatively consistent amounts of Corallophila spp.and Anotrichium spp., respectively. These taxa werelow in abundance and so contributed little to vari-ability in the total assemblage, but examining themseparately from the whole assemblage providesimportant insight into potentially critical ecologicalprocesses underway at these 2 islands.
Taxa-specific insights, combined with the overallsmall-scale variability of turf algal assemblages,present a suite of implications for future analysis ofcoral reef communities. Knowing that turf assem-blages on coral reefs can be highly variable at a scaleof centimeters highlights a need for appropriate spa-tial sampling. Describing a 1-m quadrat by its overallturf cover may be insufficient to capture the highlyvariable turf assemblage. Instead, detailed samplesreplicated across centimeters are needed to suffi-ciently describe the complexity and diversity of turfassemblages, especially if different taxa within theturf assemblage have unique roles in coral−algalcompetition, such as producing allelochemicals thatcan kill corals (e.g. Jompa & McCook 2003).
With declining coral and increasing turf cover onreefs worldwide, understanding coral−turf interac-tion dynamics will become increasingly central tocoral reef ecology and conservation. However, turfassemblages are variable at scales smaller than a sin-
gle coral colony, so these interactions deserve moredetailed consideration. Turf algae represent a domi-nant, diverse, and highly productive component ofcoral reef communities, so a better understanding ofthe processes that drive turf assemblage structureand spatial dynamics is needed.
Acknowledgements. The authors thank Ibrahim ‘Kahley’Mohamed and Easa Jawaadh for their knowledgeable andcheerful assistance with sample collection. The Korallionlabstaff provided logistical support in the Maldives, particularlyMoosa Ugail, Josie Chandler, Abrahim Shikar Mohamed,Muneer Mohamed, Gianni Arlotti, and the entire Arlottifamily; Penny Dockry provided logistical support at ScrippsInstitution of Oceanography. The authors gratefullyacknowledge insightful discussions with Maggie Johnsonand Stuart Sandin, and invaluable comments from RachelMorrison, Lisa Levin, Elsa Cleland, David Holway, Ed Vul,and three anonymous reviewers. Samples were collectedunder permit no. 30-D/INDIV/2013/437 from the MaldivesMinistry of Fisheries and Agriculture. This work was sup-ported by National Science Foundation IGERT grant no.0903551, and Wyer Family and Charles H. Stout Foundationfellowships to J.L.H.
LITERATURE CITED
Adler PB, Raff DA, Lauenroth WK (2001) The effect of graz-ing on the spatial heterogeneity of vegetation. Oecologia128: 465−479
Alestra T, Tait LW, Schiel DR (2014) Effects of algal turfs andsediment accumulation on replenishment and primaryproductivity of fucoid assemblages. Mar Ecol Prog Ser511: 59−70
Anderson MJ (2001) A new method for non-parametricmulti variate analysis of variance. Austral Ecol 26: 32−46
Anderson RJ, McKune C, Bolton J, Declerck O, Tronchin E(2005) Patterns in subtidal seaweed communities oncoral-dominated reefs at Sodwana Bay on the KwaZulu-Natal coast, South Africa. Afr J Mar Sci 27: 529−537
Anderson MJ, Gorley R, Clarke K (2008) PERMANOVA+ forPRIMER: guide to software and statistical methods.PRIMER-E, Plymouth, UK
Andrew N, Viejo R (1998) Ecological limits to the invasion ofSargassum muticum in northern Spain. Aquat Bot 60: 251−263
Bastow Wilson J, James R, Newman J, Myers T (1992) Rockpool algae: species composition determined by chance?Oecologia 91: 150−152
Bellgrove A, Clayton MN, Quinn GP (2004) An integratedstudy of the temporal and spatial variation in the supplyof propagules, recruitment and assemblages of intertidalmacroalgae on a wave-exposed rocky coast, Victoria,Australia. J Exp Mar Biol Ecol 310: 207−225
Bellwood D, Fulton C (2008) Sediment-mediated suppres-sion of herbivory on coral reefs: decreasing resilience torising sea levels and climate change? Limnol Oceanogr53: 2695−2701
Benedetti-Cecchi L, Cinelli F (1993) Early patterns of algalsuccession in a midlittoral community of the Mediterran-ean sea : a multifactorial experiment. J Exp Mar Biol Ecol169: 15−31
54

Harris et al.: Spatial scales of algal turf variability
Benedetti-Cecchi L, Cinelli F (1994) Recovery of patches inan assemblage of geniculate coralline algae: variabilityat different successional stages. Mar Ecol Prog Ser 110: 9−18
Benedetti-Cecchi L, Bulleri F, Cinelli F (2000) The interplayof physical and biological factors in maintaining mid-shore and low-shore assemblages on rocky coasts in thenorth-west Mediterranean. Oecologia 123: 406−417
Benedetti-Cecchi L, Pannacciulli F, Bulleri F, Moschella PS,Airoldi L, Relini G, Cinelli F (2001) Predicting the con -sequences of anthropogenic disturbance: large-scaleeffects of loss of canopy algae on rocky shores. Mar EcolProg Ser 214: 137−150
Benedetti-Cecchi L, Tamburello L, Bulleri F, Maggi E, Gen-nusa V, Miller M (2012) Linking patterns and processesacross scales: the application of scale-transition theory toalgal dynamics on rocky shores. J Exp Biol 215: 977−985
Birrell CL, McCook LJ, Willis BL (2005) Effects of algal turfsand sediment on coral settlement. Mar Pollut Bull 51: 408−414
Birrell CL, McCook LJ, Willis BL, Diaz-Pulido G (2008)Effects of benthic algae on the replenishment of coralsand the implications for the resilience of coral reefs.Oceanogr Mar Biol Annu Rev 46: 25−63
Bonaldo RM, Bellwood DR (2009) Dynamics of parrotfishgrazing scars. Mar Biol 156: 771−777
Bonaldo RM, Bellwood DR (2011) Spatial variation in theeffects of grazing on epilithic algal turfs on the GreatBarrier Reef, Australia. Coral Reefs 30: 381−390
Carpenter R (1986) Partitioning herbivory and its effects oncoral reef algal communities. Ecol Monogr 56: 345−364
Carpenter RC, Williams SL (1993) Effects of algal turfcanopy height and microscale substratum topography onprofiles of flow speed in a coral forereef environment.Limnol Oceanogr 38: 687−694
Ceccarelli DM, Jones GP, McCook LJ (2011) Interactionsbetween herbivorous fish guilds and their influence onalgal succession on a coastal coral reef. J Exp Mar BiolEcol 399: 60−67
Chapman AS, Fletcher RL (2002) Differential effects of sedi-ments on survival and growth of Fucus serratus embryos(Fucales, Phaeophyceae). J Phycol 38: 894−903
Chapman M, Underwood A (1998) Inconsistency and varia-tion in the development of rocky intertidal algal assem-blages. J Exp Mar Biol Ecol 224: 265−289
Christofoletti RA, Almeida TVV, Ciotti ÁM (2011) Environ-mental and grazing influence on spatial variability ofintertidal biofilm on subtropical rocky shores. Mar EcolProg Ser 424: 15−23
Clausing RJ, Annunziata C, Baker G, Lee C, Bittick SJ, FongP (2014) Effects of sediment depth on algal turf heightare mediated by interactions with fish herbivory on afringing reef. Mar Ecol Prog Ser 517: 121−129
Coleman MA (2002) Small-scale spatial variability in inter-tidal and subtidal turfing algal assemblages and the tem-poral generality of these patterns. J Exp Mar Biol Ecol267: 53−74
Collins SL (1992) Fire frequency and community hetero-geneity in tallgrass prairie vegetation. Ecology 73: 2001−2006
Connell JH (1978) Diversity in tropical rain forests and coralreefs. Science 199: 1302−1310
Connell JH, Slatyer RO (1977) Mechanisms of succession innatural communities and their role in community stabil-ity and organization. Am Nat 111: 1119−1144
Connell SD, Foster MS, Airoldi L (2014) What are algal turfs?Towards a better description of turfs. Mar Ecol Prog Ser495: 299−307
Dayton PK, Tegner MJ, Parnell PE, Edwards PB (1992) Tem-poral and spatial patterns of disturbance and recovery ina kelp forest community. Ecol Monogr 62: 421−425
Deysher L, Norton TA (1981) Dispersal and colonization inSargassum muticum (Yendo) Fensholt. J Exp Mar BiolEcol 56: 179−195
Diaz-Pulido G, McCook LJ (2002) The fate of bleachedcorals: patterns and dynamics of algal recruitment. MarEcol Prog Ser 232: 115−128
Edwards MS (2004) Estimating scale-dependency in distur-bance impacts: El Niños and giant kelp forests in thenortheast Pacific. Oecologia 138: 436−447
Falkenberg LJ, Russell BD, Connell SD (2013) Contrastingresource limitations of marine primary producers: impli-cations for competitive interactions under enriched CO2
and nutrient regimes. Oecologia 172: 575−583Fletcher WJ (1987) Interactions among subtidal Australian
sea urchins, gastropods, and algae: effects of experimen-tal removals. Ecol Monogr 57: 89−109
Fletcher D, Underwood A (2002) How to cope with negativeestimates of components of variance in ecological fieldstudies. J Exp Mar Biol Ecol 273: 89−95
Fong P, Paul VJ (2011) Coral reef algae. In: Dubinsky Z,Stambler N (eds) Coral reefs: an ecosystem in transition.Springer Netherlands, Dordrecht, p 242−272
Foster MS (1990) Organization of macroalgal assemblagesin the Northeast Pacific: the assumption of homogeneityand the illusion of generality. Hydrobiologia 192: 21−33
Fraschetti S, Terlizzi A, Benedetti-Cecchi L (2005) Patternsof distribution of marine assemblages from rocky shores: evidence of relevant scales of variation. Mar Ecol ProgSer 296: 13−29
Fritz HM, Synolakis CE, McAdoo BG (2006) Maldives fieldsurvey after the December 2004 Indian Ocean tsunami.Earthq Spectra 22: S137−S154
Graham M, Edwards M (2001) Statistical significance versusfit: estimating the importance of individual factors in eco-logical analysis of variance. Oikos 93: 505−513
Hamilton SL, Smith JE, Price NN, Sandin SA (2014) Quanti-fying patterns of fish herbivory on Palmyra Atoll (USA),an uninhabited predator-dominated central Pacific coralreef. Mar Ecol Prog Ser 501: 141−155
Hatcher BG, Larkum AWD (1983) An experimental analysisof factors controlling the standing crop of the epilithicalgal community on a coral reef. J Exp Mar Biol Ecol 69: 61−84
Huff TM (2006) Impacts of human trampling and periodicsand inundation on Southern California intertidal algalturf communities: implications for conservation and man-agement of rocky shores. Scripps Institution of Oceanog-raphy, La Jolla, CA, USA
Hughes TP, Baird AH, Dinsdale EA, Moltschaniwskyj NA,Pratchett MS, Tanner JE, Willis BL (1999) Patterns ofrecruitment and abundance of corals along the GreatBarrier Reef. Nature 397: 59−63
Hulme P (1996) Herbivory, plant regeneration, and speciescoexistence. J Ecol 84: 609−615
Iveša L, Chapman MG, Underwood AJ, Murphy RJ (2010)Differential patterns of distribution of limpets on inter-tidal seawalls: experimental investigation of the roles ofrecruitment, survival and competition. Mar Ecol Prog Ser407: 55−69
55

Mar Ecol Prog Ser 532: 41–57, 2015
Jompa J, McCook LJ (2003) Coral-algal competition: macro-algae with different properties have different effects oncorals. Mar Ecol Prog Ser 258: 87−95
Kelaher BP (2005) Does colonization contribute to spatialpatterns of common invertebrates in coralline algal turf?Austral Ecol 30: 40−48
Kelaher BP, Levinton JS (2003) Variation in detrital enrich-ment causes spatio-temporal variation in soft-sedimentassemblages. Mar Ecol Prog Ser 261: 85−97
Kennelly SJ (1987) Physical disturbances in an Australiankelp community. II. Effects on understorey species due todifferences in kelp cover. Mar Ecol Prog Ser 40: 155−165
Larkum AWD, Koch MW, Ku M (2003) Diffusive boundarylayers and photosynthesis of the epilithic algal commu-nity of coral reefs. Mar Biol 142: 1073−1082
Ledlie MH, Graham NAJ, Bythell JC, Wilson SK, JenningsS, Polunin NVC, Hardcastle J (2007) Phase shifts and therole of herbivory in the resilience of coral reefs. CoralReefs 26: 641−653
Levin SA (1992) The problem of pattern and scale in ecol-ogy. Ecology 73: 1943−1967
Lison de Loma T, Ballesteros E (2002) Microspatial variabil-ity inside epilithic algal communities within territories ofthe damselfish Stegastes nigricans at La Réunion (IndianOcean). Bot Mar 45: 316−323
Loch K, Loch W, Schuhmacher H, See WR (2002) Coralrecruitment and regeneration on a Maldivian reef 21months after the coral bleaching event of 1998. Mar Ecol23: 219−236
Loch K, Loch W, Schuhmacher H, See WR (2004) Coralrecruitment and regeneration on a Maldivian reef fouryears after the coral bleaching event of 1998. Part 2: 2001−2002. Mar Ecol 25: 145−154
Maggi E, Bulleri F, Bertocci I, Benedetti-Cecchi L (2012)Competitive ability of macroalgal canopies overwhelmsthe effects of variable regimes of disturbance. Mar EcolProg Ser 465: 99−109
Marhaver KL, Vermeij MJ, Rohwer FL, Sandin S (2013)Janzen-Connell effects in a broadcast-spawning Carib-bean coral: distance-dependent survival of larvae andsettlers. Ecology 94: 146−160
Menge BA, Olson AM (1990) Role of scale and environmen-tal factors in regulation of community structure. TrendsEcol Evol 5: 52−57
Ministry of Planning and National Development (2007) Maldives population and housing 2006. www. planning.gov.mv (accessed 6 July 2015)
O’Leary JK, Potts DC (2011) Using hierarchical sampling tounderstand scales of spatial variation in early coralrecruitment. Coral Reefs 30: 1013−1023
Odum EP (1969) The strategy of ecosystem development.Science 164: 262−270
Olabarria C (2002) Role of colonization in spatio-temporalpatchiness of microgastropods in coralline turf habitat.J Exp Mar Biol Ecol 274: 121−140
Pacala SW, Levin SA (1997) Biologically cenerated spatialpattern and the coexistence of competing species. In: Tilman D, Kareiva P (eds) Spatial ecology: the role ofspace in population dynamics and interspecific inter -action. Princeton University Press, Princeton, NJ,p 204−232
Padilla DK, Allen BJ (2000) Paradigm lost: reconsideringfunctional form and group hypotheses in marine ecology.J Exp Mar Biol Ecol 250: 207−221
Pianka ER (1966) Latitudinal gradients in species diversity: a
review of concepts. Am Nat 100: 33−46Poray AK, Carpenter RC (2014) Distributions of coral reef
macroalgae in a back reef habitat in Moorea, FrenchPolynesia. Coral Reefs 33: 67−76
Prathep A, Marrs R, Norton T (2003) Spatial and temporalvariations in sediment accumulation in an algal turf andtheir impact on associated fauna. Mar Biol 142: 381−390
Rowan R, Knowlton N (1995) Intraspecific diversity and eco-logical zonation in coral−algal symbiosis. Proc Natl AcadSci USA 92: 2850−2853
Sale P (1977) Maintenance of high diversity in coral reef fishcommunities. Am Nat 111: 337−359
Sandin SA, McNamara DE (2012) Spatial dynamics of ben-thic competition on coral reefs. Oecologia 168: 1079−1090
Santelices B, Bolton J, Meneses I (2009) Marine algal com-munities. In: Witman JD, Roy K (eds) Marine macro -ecology. The University of Chicago Press, Chicago, IL,p 153–192
Sarnelle O, Kratz K, Cooper S (1993) Effects of an inverte-brate grazer on the spatial arrangement of a benthicmicrohabitat. Oecologia 96: 208−218
Shanks AL, Grantham BA, Carr MH (2003) Propagule dis-persal distance and the size and spacing of marinereserves. Ecol Appl 13: 159−169
Shmida A, Ellner S (1985) Coexistence of plant species withsimilar niches. In: Plant community ecology: papers inhonor of Robert H. Whittaker. Springer, Dordrecht,p 275−301
Smale DA, Kendrick GA, Wernberg T (2010) Assemblageturnover and taxonomic sufficiency of subtidal macroalgaeat multiple spatial scales. J Exp Mar Biol Ecol 384: 76−86
Smith JE, Hunter CL, Smith CM (2010) The effects of top-down versus bottom-up control on benthic coral reefcommunity structure. Oecologia 163: 497−507
Sommer U (2000) Benthic microalgal diversity enhanced byspatial heterogeneity of grazing. Oecologia 122: 284−287
Sousa WP (1979) Experimental investigations of disturbanceand ecological succession in a rocky intertidal algal com-munity. Ecol Monogr 49: 227−254
Steneck RS, Dethier MN (1994) A functional groupapproach to the structure of algal-dominated communi-ties. Oikos 69: 476−498
Stuercke B, McDermid K (2004) Variation in algal turf species composition and abundance on two Hawaiianshallow subtidal reefs. Crypotogamie Algol 25: 353−365
Tribollet AD, Schils T, Vroom PS (2010) Spatio-temporalvariability in macroalgal assemblages of AmericanSamoa. Phycologia 49: 574−591
Underwood A (1991) Spatial and temporal problems withmonitoring. In: Calow P (ed) Rivers handbook: the sci-ence and management of river environments. Wiley-Blackwell, Hoboken, NJ, p 101−123
Underwood AJ (1997) Ecological experiments: their logicaldesign and interpretation using analysis of variance.Cambridge University Press, Melbourne
Underwood AJ, Chapman MG (1996) Scales of spatial pat-terns of distribution of intertidal invertebrates. Oecologia107: 212−224
van der Maarel E, Sykes MT (1993) Small-scale plant spe-cies turnover in a limestone grassland: the carouselmodel and some comments on the niche concept. J VegSci 4: 179−188
Vermeij MJ, van Moorselaar I, Engelhard S, Hörnlein C,Vonk SM, Visser PM (2010) The effects of nutrientenrichment and herbivore abundance on the ability of
56

Harris et al.: Spatial scales of algal turf variability 57
turf algae to overgrow coral in the Caribbean. PLoSONE 5: e14312
Wai TC, Williams GA (2006) Monitoring spatio-temporalvariation in molluscan grazing pressure in seasonal,tropical rock pools. Mar Biol 149: 1139−1147
Wanders JBW (1976) The role of benthic algae in the shal-low reef of Curacao (Netherlands Antilles). I: Primaryproductivity in the coral reef. Aquat Bot 2: 235−270
Wiens J (1989) Spatial scaling in ecology. Funct Ecol 3: 385−397
Wilson SK, Bellwood DR, Choat JH, Furnas M (2003)Detritus in the epilithic algal matrix and its use bycoral reef fishes. Oceanogr Mar Biol Annu Rev 41: 279−309
Wismer S, Hoey A, Bellwood D (2009) Cross-shelf benthiccommunity structure on the Great Barrier Reef: relation-ships between macroalgal cover and herbivore biomass.Mar Ecol Prog Ser 376: 45−54
Witman JD, Roy K (eds) (2009) Marine macroecology. Uni-versity of Chicago Press, Chicago, IL
Editorial responsibility: Lisandro Benedetti-Cecchi, Pisa, Italy
Submitted: October 31, 2014; Accepted: May 11, 2015Proofs received from author(s): July 7, 2015
➤
➤
➤