Embed Size (px)
Citation preview

Quantifying the demand forunskilled labour in areas of
low economic activity
Welsh Assembly Government

For and on behalf of Experian
Approved by: Fiona Harris
Position: Associate Director

Quantifying the demand for unskilled labour inareas of low economic activity
Contents Executive summary ....................................................................................................................................1
Introduction.................................................................................................................................................6
1 Economic and policy context............................................................................................................91.1 Overview ...................................................................................................................................101.2 Economic context ......................................................................................................................101.3 Local area comparisons ............................................................................................................131.4 Workforce context......................................................................................................................221.5 Inactivity: a supply or demand side problem?............................................................................27
2 The demand for unskilled labour....................................................................................................292.1 Overview ...................................................................................................................................302.2 Vacancies..................................................................................................................................312.3 Factors affecting local labour demand.......................................................................................362.4 Employment patterns ................................................................................................................38
3 What employers want ......................................................................................................................403.1 Overview ...................................................................................................................................413.2 Skills gaps: the wider evidence .................................................................................................413.3 Recruitment ...............................................................................................................................423.4 The quality of jobs offered by employers ...................................................................................453.5 Inclusion issues .........................................................................................................................47
4 Employer response to local labour markets..................................................................................494.1 Overview ...................................................................................................................................504.2 The balance of local labour demand and supply .......................................................................504.3 Characteristics of the current balance of demand and supply ...................................................524.4 Migrant workers in Wales ..........................................................................................................614.5 Training .....................................................................................................................................63
5 Conclusion and policy implications ...............................................................................................665.1 Conclusion.................................................................................................................................665.2 Policy implications .....................................................................................................................67
Appendix A: Employer questionnaire
Appendix B: Questionnaire for recruitment agencies and jobcentres
Appendix C: Database details

Quantifying the demand for unskilled labour in areas of low economic activity
1
Executive summary
OVERVIEW AND OBJECTIVES
The Welsh Assembly Government (WAG) commissioned Experian Business Strategies toundertake a review of the demand for labour, particularly unskilled labour, in areas of loweconomic activity. The areas for analysis and comparison are Merthyr Tydfil, Blaenau Gwent,Cardiff, Newport, Swansea, Bridgend and Wrexham, based on current labour market evidenceand to ensure compatibility with past research.
Seventy five per cent of the Welsh population were economically active in 2005, lower than forthe UK as a whole (78 per cent). Bridgend, Cardiff and Swansea all have working age activityrates approximate to the Welsh average and Wrexham (79.5 per cent) and Newport (78.5 percent) have activity rates above the average for Wales, and indeed the UK. In contrast, theactivity rates of Merthyr Tydfil and Blaenau Gwent, at 68 and 70 per cent respectively, are a(long standing) policy issue.
Summary labour market characteristicsEconomic
activityrate, 2005
Employmentrate, 2005
Unemploymentrate, 2005
Share of unskilled & lowskilled*, 2004
GDP perhead,2005
% working age population % Work-force % Residents £
BlaenauGwent 70.0 63.8 8.9 40 43 8,500
Bridgend 74.6 69.9 6.3 36 34 12,000Cardiff 74.8 70.0 6.4 27 27 22,200MerthyrTydfil 67.9 62.5 8.0 38 35 11,100
Newport 78.5 73.6 6.2 34 32 17,000Swansea 74.1 70.6 4.5 32 32 13,100Wrexham 79.5 75.6 4.9 30 31 13,700Wales 75.2 71.2 5.3 31 30 12,900Source: Annual Population Survey 2005, Experian
* Occupational share comprises the total of Elementary; Process, Plant and Machine Operatives; andSales and Customer Service
Table 1: Summary statistics
Tackling inactivity is a key policy challenge and WAG research has already been undertakeninto characteristics of the inactive population that hinder them from gaining employment(supply side issues). This current study examines the extent of the demand for unskilled labour,because the skills and qualification profile of the inactive population is primarily suited tounskilled work. Unskilled is not tightly defined in this report, but generally refers to jobs that donot require qualifications above level 2. In reality, employers recruiting for unskilled jobs do notdemand specific levels of qualifications or skills; instead they speak in terms of personalattributes such as motivation, willingness to work, and reliability.

Quantifying the demand for unskilled labour in areas of low economic activity
2
THE ECONOMIC AND OCCUPATIONAL CONTEXT
The Welsh economy has exhibited robust and consistent growth since the early 1990s (averageoutput growth was 2.3 per cent per year in the decade to 20051). The recent moderate rise inunemployment and a decrease in job vacancies advertised is reflective of a UK-wide slowdownin growth. In 2007 GVA and employment prospects are expected to lag UK rates asmanufacturing grows sluggishly while the service sector sees its weakest expansion this decade.This sluggishness is not forecast to persist; Wales will see GVA growth pick up to near the UKaverage in the next two years.
Manufacturing employment continues to lessen (although there is significant variation in thefortunes of different manufacturing sub sectors) but service sector expansion has remained atlevels to adequately match manufacturing job losses. However, the valley areas of MerthyrTydfil and Blaenau Gwent do lag the rest of Wales in the transition to a service economy.
Some local areas in the study still have an above average proportion of manufacturingemployment, but this does not equate to low levels of activity; Wrexham has both high levels ofactivity and a substantial manufacturing base. The economic activity rate does, however,strongly correlate with the proportion of the workforce or population who work in unskilledoccupations (see table 1).
DEMAND FOR UNSKILLED LABOUR
Table 2 shows the key characteristics of lower skilled occupations compared with higher skilledoccupations. There are some notable factors linked to low skilled employment, and there arealso differences between low skilled occupations.
Low skilled work is more likely to be part-time, temporary, and mostly below level 2 but doesnot facilitate training. Male low skilled employment is also important to process, plant andmachine operatives (more so than sales and customer service and elementary).
A further characteristic of low skilled workers is their relative youth, which in sales andcustomer service and elementary roles is strongly related to the number of students in theworkforce, many of whom move on to higher skilled jobs when their studies finish. Low skilledpart time employment for most students in their university years is temporary, but low skilledpart time employment for adults is an emerging trend as the demand for labour has altered overtime.
1 Source: Experian Business Strategies.

Quantifying the demand for unskilled labour in areas of low economic activity
3
Key characteristics of low skilled workers - UK index*, compared to other occupations (SOC 1-5)
Low skilledSales and
Customer Service(SOC 6)
Process, Plant andMachine Operative
(SOC 7)
Elementary(SOC 7) Total
Part time 279 49 218 188Temporary 87 77 155 114Male 58 164 102 10916-24 year olds 284 61 194 26145+ year olds 68 119 94 91Not received training 114 125 123 121Below NVQ level 2 181 259 273 243
* The index identifies the characteristics that are under- and over-represented in low skilled occupationscompared with other occupation. An index of 100 is average, anything below is under-represented,anything above is over-represented.
Source: Labour Force Survey, Spring 2006
Table 2: Characteristics of low skilled labour
Recruitment in most sectors of the economy, high skilled as well as low skilled, is largelydriven by churn rather than the net creation of new positions. Our qualitative research confirmsthat this is particularly true for low-skilled occupations, which reflects low entrancerequirements and lower penalties for shifting from one employer or type of role to another.
The number of vacancies for low skilled positions2 advertised through the Jobcentre Plusnetwork in the areas studied dipped in 2005 and early 2006, although this is consistent withWales and the UK as a whole and areas of the study were affected by this national slowdown tovarying degrees. However, it seems likely that the number of low skilled vacancies advertisedwill pick up again as the UK and Welsh economies gather speed in 2006 and 2007.
The long-term weakening of manufacturing in the region has not negated the importance ofmanufacturers in providing employment for lower skilled workers. In terms of detailed jobdescriptions the type of vacancy most frequently advertised is for manufacturing workers(followed by bar staff and retail assistants). However, low skilled manufacturing jobs are beingreplaced by low skilled service sector jobs, which demand different types of skills, includingsocial skills and personal presentation.
Low skilled jobs in the areas studied are likely to be temporary, contributing to higher labourturnover. Such jobs are also more likely to be part-time, and areas with a lower rate of economicactivity also have a greater rate of part time vacancies. Wages are typically set at the minimumwage level for manual work, though call centres, often seen as low skill, low paid employment,tend to pay above the minimum wage.
Qualitative evidence suggests that low pay, and a lack of job security, makes taking a job, andconsequently forgoing some benefits, a risky and unappealing option for certain groups ofinactive people, including lone parents and those in receipt of housing benefits. To this extentthe nature of demand for unskilled labour has a negative impact on inactivity.
2 Low skilled is defined as SOC codes 7, 8 and 9.

Quantifying the demand for unskilled labour in areas of low economic activity
4
WHAT EMPLOYERS WANT
Employer requirements for low skilled work appear to present few barriers to the majority ofpeople who are looking for this kind of work, though, as the inactivity statistics indicate, thereare still individuals unable to overcome the barriers presented.
Employers most commonly require applicants to fill in application forms; CVs are lesscommonly required. Vacancies are mostly advertised through job brokers, though word ofmouth and shop windows also play a role.
Job brokers offer significant help to candidates seeking jobs. The help available includes fillingin application forms and creating CVs, and both types of organisations actively market theircandidates to potential employers. For people who have previously experienced difficultyfinding employment, interview training, encouragement and support are also available fromJobcentre Plus advisors and initiatives such as Pathways to Work and Want2Work.
Our qualitative research focussed on the criteria employers use to select employees from theunskilled candidates they are presented with. The requirement universally mentioned is anenthusiastic attitude to work, which employers feel would be demonstrated by a commitment topunctuality and a low level of absenteeism. The ‘right attitude’ is a necessary condition for a joboffer, and previous experience is the second most important asset a candidate could have.Employers do not consider formal qualifications necessary, or even relevant, when recruitinglow skilled workers.
Our qualitative research also sought to establish whether employers particularly targeted, ordiscriminated against, certain candidates. Employers expressed themselves willing to hiredisabled people and those with a history of unemployment, although job brokers feel that thereis sometimes some discrimination against these groups. Having experienced a period ofimprisonment is, however, a major barrier to employment.
Importantly, evidence from the vacancy databases and qualitative consultation shows thatacceptance in a low-skilled role is seldom the first step on a ladder that can lead from inactivityto a higher skilled, high paid, permanent, full-time role. Employers do not set stringent entrancerequirements for low-skilled roles at least in part because they do not anticipate such workersupskilling and making more decisive contributions to the business later in their careers.
SUPPLY-DEMAND IMBALANCES
Future Skills Wales 2005 data shows that while unskilled vacancies do not dominate theoccupations that are hard to fill, employers can find it hard to fill process, plant and machineoperative positions in the manufacturing sector; sales and customer service occupations inwholesale and retail trade, and elementary occupations in hotel and restaurant businesses(reflecting the dominance of these occupations within such sectors).
Qualitative research suggests that employers in the areas of study do not generally haveproblems filling unskilled vacancies. They find the supply of candidates is adequate despite thefiltering out of unsuitable candidates that takes place as job brokers seek to maintain strongrelationships with employers. At the same time the evidence suggests that the local labourmarkets studied have absorbed a significant amount of migrant workers seeking lower-skilledwork, while job brokers remain confident of their ability to rapidly place candidates in lowskilled work.

Quantifying the demand for unskilled labour in areas of low economic activity
5
Transport remains a critical issue for some and the source of ‘micro-mismatches’ in supply anddemand for unskilled labour. Transport issues are much more likely to be critical for the lowskilled and inactive, the very people who are the target of this study. There are valid cost-benefitrationales for why unskilled workers will not travel, including cost and care responsibilities, butthere is also some consultation evidence that workers in the valleys are less willing to travel farto work than in other areas. However, few employers subsidise or provide transport solutionsfor their workers, suggesting that transport problems are not frequent or severe enough toseriously impact on the macro balance of supply and demand in local areas.
Migrant workers, particularly from the A8 countries, are a recent and important factor in thefunctioning of local labour markets. They primarily work in low skilled occupations, are verymobile in comparison with locally resident workers, and have a work ethic universally praisedby employers. Migrant workers tend to access job opportunities through the existinginfrastructure of job brokers, although informal routes are also used, and work across a widerange of low skilled occupations.
CONCLUSION
The cumulative evidence base suggests that across the areas studied the labour market isfunctioning well with many opportunities available for low skilled workers and with recruitmentbarriers substantially reduced by the support of job brokers. Migrant workers are operating inlocal labour markets but they appear to be plugging gaps in the market rather than supplantinglocal workers. This suggests that low activity levels are not the result of a lack of demand forunskilled labour or other market failure (though transport related micro-mismatches are anissue) but reflect supply side issues.
That said, there could be no doubts that in terms of job security, potential for careeradvancement, pay, and in some cases job satisfaction, the quality of unskilled jobs is relativelylow. This can make the opportunities available unattractive to the inactive who are ready, andotherwise willing, to work. Furthermore, a cultural shift driven by the increasing number ofservice sector, customer facing roles, requires ‘softer’ skills.
Employers are more than willing to overlook lack of qualifications, but a good work ethic is apre-requisite for employment, while experience is also a major advantage. However, intensivesupport into work is available and job brokers actively seek opportunities for their clientsthrough relationship building with local employers.

Quantifying the demand for unskilled labour in areas of low economic activity
6
Introduction
BACKGROUND
The Welsh Assembly Government’s strategic framework for economic development ‘Wales: AVibrant Economy’ outlines the Assembly’s vision for strong sustainable growth andopportunities for all. Helping more people into jobs is outlined as a key priority and theAssembly’s Skills and Employment Action Plan, originally released in 2002 and updated in2005, contributes to the implementation of this vision.
However, it is noted that economic inactivity is a more significant factor than unemployment incontributing to low rates of employment in Wales. Indeed, economic inactivity is one of thebiggest challenges facing the Welsh economy as a whole. Economic inactivity rates are higherin Wales than elsewhere in the UK. In 2005, the economic activity rate in Wales stood at 75.2per cent of the working age population. While this represents a marked improvement on pastyears, it remains below the UK average (78.2 per cent).3 Moreover, economic inactivity isparticularly severe in certain areas of Wales such as the Upper Valleys in South Wales and inurban hotspots around Cardiff, Swansea and Newport.
High levels of economic inactivity are closely linked to high levels of poverty and socialexclusion and much must be done to address these issues in order to achieve objectives foreconomic and social prosperity in Wales. For example, the Welsh Assembly Governmentrecently introduced the ‘Want2Work’ pilots. Past research also commissioned by the WelshAssembly Government analysed the effect that supply side factors have on economic inactivityrates, such as willingness to work, reservation wages, skills and qualifications and healthproblems.4
However, demand side factors, such as the availability of suitable job opportunities andemployer recruitment practices, may also have a key role to play in the picture of economicinactivity in Wales.
RESEARCH OBJECTIVES
In February 2006 the Welsh Assembly Government commissioned Experian Business Strategiesto undertake a review of the demand for labour, particularly unskilled labour, in areas of loweconomic activity. The key project objectives were therefore to understand:
� the extent and nature of demand in areas of both high and low economic activity;
� employer recruitment practices;
� whether there is evidence of recruitment difficulties for unskilled work in areas of higheconomic inactivity;
� the role of demand side factors in preventing those seeking work from securingemployment.
3 Annual Population Survey (2005)4 University of Wales Swansea Department of Economics and WELMERC, Report for the WelshAssembly Government Economic Research Unit: Identifying barriers to economic activity in Wales

Quantifying the demand for unskilled labour in areas of low economic activity
7
Figure 1 in Annex D shows the relationship between the demand for labour and the supply oflabour. The focus of Experian’s research is on the demand for labour, together with theworkings of the recruitment market, the intersection point between demand and supply.
A related factor, explored in a minor way by our qualitative research for this project, is the roleof migrant workers in fulfilling a need versus displacement of local workers. The complexity ofthe migration questions is captured in the flow from skills, qualifications and attitude back toeconomic performance. The availability of additional labour (the UK’s labour market isrelatively tight) and a significant flow of workers (such as the A85) can create competition forjobs; the flow of workers also raises demand and can create further job opportunities benefitingboth indigenous and migrant labour.
In the reporting that follows we explore various demand side indicators for areas of loweconomic activity as well as for areas with above or average activity levels. We also analyseindicators of supply/demand mismatches and through qualitative research, the activity andflexibility of the recruitment infrastructure.
GEOGRAPHICAL COVERAGE
To ensure comparability with past research this project focuses on:
� Clusters of economic inactivity in the Upper Valleys: the unitary authorities of MerthyrTydfil and Blaenau Gwent.
� Urban areas with hotspots of inactivity: the unitary authorities of Cardiff, Newport andSwansea.
� Ties with the Valleys and urban centres: Bridgend.
� Cooler areas where inactivity rates are lower: the local authority of Wrexham.
To offer further understanding, we also look at how the local areas in Wales compare withEasington in County Durham (an area identified in previous Welsh Assembly Governmentresearch as having similar features to the Upper Valleys), High Peak in Derbyshire andCalderdale in West Yorkshire (which are mixed areas with a major commercial draw withincommutable distance).
5 The eight eastern European countries that joined the EU in May 2004, consisting of the Czech Republic,Estonia, Hungary, Latvia, Lithuania, Poland, Slovakia, and Slovenia

Quantifying the demand for unskilled labour in areas of low economic activity
8
METHODOLOGY
To meet the project objectives the research methodology entailed a combination of desk-basedresearch and qualitative primary research.
Secondary research
Desk research is crucial to any research project. It plays an important role in setting the scene aswell as providing valuable information. For this project, it allowed us to collate and aggregateoriginal data concerning the demand for labour while considering how this relates to pastresearch concerning the supply side picture. Desk research took the form of a literature reviewand a review of two databases of vacancies in the local areas selected for the study.
� The literature review covered research papers dealing with relevant labour market issuesin the UK generally, as well as research specifically focussed on Wales.
� Jobcentre Plus database of all vacancies advertised through the local branches within thegeographical coverage of the project for the months of April, May and June 2006.
� Past research suggests that 39 per cent of all vacancies are advertised through JobcentrePlus, although this varies significantly by occupation.6 Therefore, we also compiled an in-house database of vacancies advertised through the internet to consider the fullest pictureof local vacancies.
Primary research
Primary stakeholder consultations provided qualitative information concerning the nature oflabour demand and recruitment difficulties experienced by employers. We conducted 15 face-to-face consultations with local Jobcentre Plus, other publicly funded bodies who have directcontact with jobseekers, and private recruitment agencies. This was augmented with 17telephone consultations with employers in sectors where there is a high probability that a largeproportion of their workforce are unskilled. The semi-structured questionnaires on which theconsultations were based can be found in Appendices B and C.
WHAT IS AN UNSKILLED JOB?
In our qualitative consultations we allowed respondents themselves to broadly define what theymeant by un- (and low) skilled employment. Interviewers offered guidance where necessary tothe effect that few qualifications would imply no qualifications above an NVQ level 2.
In the analysis of the database procured from Jobcentre Plus low-skilled jobs are classified byoccupation (personal service occupations; sales and customer service occupations; and process,plant and machine operatives) and industry (parts of manufacturing, wholesale and retail, hotelsand catering, transport and communications, real estate and refuse disposal).
In the Jobs Broker Database vacancies are assessed as low skilled on an individual basis, takinginto account not only the qualifications and skills requested but also the wages offered.
6Usage is highest in the security sector (67 per cent) and in 2005 it was also significantly higher in callcentres (63 per cent). Half of employers in the healthcare, construction and hospitality sectors have alsoused Jobcentre Plus in the last 12 months. Source: Jobcentre Plus (2006) Employer Survey,

Quantifying the demand for unskilled labour in areas of low economic activity
9
1 Economic and policy context
SUMMARY
Economic context
The Welsh economy enjoyed healthy growth in the early years of this decade, despite the dragfrom a severe contraction in manufacturing. This is partly because the economy has alsoexperienced service sector employment growth, with large numbers of service sector jobscreated for the relatively low skilled. Despite this, the Welsh economy exhibits an industry mixthat is more reliant on manufacturing than the faster growth regions of the Greater South East.
Local area comparisons
Economic inactivity is primarily due to retirement and long-term sickness, and the associatedlow employment rates are one of the biggest challenges facing the Welsh economy. Economicinactivity is a particular issue for Blaenau Gwent and Merthyr Tydfil, the latter having very highmale inactivity rates.
A breakdown of employment by sector shows areas with similar economic performance vary intheir industrial make-up; and it is clear that a large manufacturing base and low levels of activityare not necessarily related.
Disparities in average income and economic output per head are a reflection of the occupationalmake-up in local areas. Cardiff has an above average proportion of managers and seniorofficials while Cardiff, Newport and Swansea reflect the demand from their industrial profile,with an over-representation of administrative and secretarial; and sales and customer serviceoccupations. Blaenau Gwent, Merthyr Tydfil, Bridgend and Wrexham largely employelementary occupations and plant, process and machine operatives.
Almost one-quarter of Welsh residents are educated to level 4 or above. Blaenau Gwent andMerthyr Tydfil have a higher proportion of residents at the lower end of the qualification scale,compared to the Wales average and Cardiff, Swansea, Bridgend and Wrexham. Notably,significant in-commuting of higher skilled workers to the Valleys is evident
Disability remains a key issue for the Welsh population, where 23 per cent are registered asdisabled. In Merthyr Tydfil, Blaenau Gwent and Bridgend the comparable figure is 28 per cent.In particular, a very high proportion of the inactive and unemployed population are registered ashaving a disability of some kind.
Inactivity: a supply or demand side problem?
Inactivity and unemployment in the areas of the study are intrinsically local in character, and arenot the result of an economy-wide lack of labour demand. In contrast, some worklessness inhotspots of deprivation is a result of local people being unwilling or unable to work because ofbarriers to accepting available jobs in the local labour market.

Quantifying the demand for unskilled labour in areas of low economic activity
10
1.1 OVERVIEW
The economic and policy context within which this research is positioned provides a number ofimportant factors linked to, and associated with, inactivity and the demand for low skilledlabour in areas of Wales. In the first section we present the demand for labour as revealed byeconomic trends and the current industry profile, and how this differs between the local areas.This is followed in the second section with a more discursive analysis of the reasons forinactivity, focusing on labour demand but with reference to labour supply.
1.2 ECONOMIC CONTEXT
Historic trends in the composition of the Welsh economy
Heavy and light manufacturing sectors are important for Wales as a whole; and for certainregions in particular. For example, in common with other regions of the UK South Wales’heavy industrial base began to shrink rapidly from the early 1980’s onwards, although theprincipal driver of declining industrial employment switched during the 1990’s from highinterest rates and macro-economic instability to low-cost competition from increasinglysophisticated East Asian manufacturing economies.
Despite continued contraction in the manufacturing sector, in the years between 1994 and 2005Wales experienced an average annual increase in GVA of 2.3 per cent a year7 and in 2004average GVA per full time employed worker was 90 per cent of the UK average. The broadreduction in overall employment in manufacturing does mask sectors within it that are growingstrongly.8
The share of total jobs coming from the service sectors in Wales is rising, and an example ofservice sector employment growth is the establishment of call-centres in Wales, takingadvantage of falls in the cost of telecommunications, and relatively cheap labour.9 These centreshave created large numbers of relatively low-skilled service sector jobs, and call centres arementioned as significant employers during the qualitative consultations, particularly in Cardiffand Merthyr Tydfil. The jobs associated with them also form a significant proportion ofjobcentre vacancies (section 2.2.4).
7 Source: Experian Business Strategies.8 Welsh Assembly Government (2005) Wales: A Vibrant Economy.9 Call centre staff in Wales may be cheap to employ compared with other regions in the UK but wages incontact centres are relatively high by local standards. For example call centres in Wrexham pay between£6.50 and £7.15 per hour plus bonus packages.

Quantifying the demand for unskilled labour in areas of low economic activity
11
Current economic structure
Based on official estimates of the UK economy, table 1.1 summarises the structural features ofWales, compared to the UK.
Structural featuresWales UK
Output and expenditure (2004):Gross value added (£bn 2003 prices) 38.7 1017.9GVA per head (£ 2003 prices) 13,138 16,994GVA per FTE worker (£ 2003 prices) 35,793 40,378Industrial structure (sector output as a share of GVA) (2004):Manufacturing 18.5 14.5Engineering 5.7 4.4Other 6.5 6.1Services 66.4 72.0Transport & Communications 6.8 7.7Financial & Business 15.9 25.5Other (Mainly Public) 29.7 23.3Other 15.1 13.4Labour market and demographics (2005 estimates):Employment rate (workplace employment as % of working population) 74.6 76.9Unemployment rate (% of resident labour force ILO measure) 4.6 4.8Total population (millions) 3.0 60.3Working age population (millions) 1.8 37.4Average weekly earnings (£) 463 529Sources: National Statistics, Experian Autumn 2006.
Table 1.1
The Welsh economy still exhibits structural features that have constrained growth in recentdecades, and its industry mix is unfavourable when compared with faster growth regions of theGreater South East. The economy continues to be more reliant on manufacturing than otherregions of the UK.
The employment rate and unemployment rate in Wales are below the UK average, with weeklyearning also below the national level. The unemployment rate has risen recently in Wales,although it remains extremely low by the standards of the 1980’s and early 1990’s. This ispartly the result of a healthy economy and a labour market that has become substantially moreflexible over the past 20 years.
Steady economic growth resulted in a declining claimant count throughout Wales between 1997and 2004. The fall in the number of people claiming the Jobseekers Allowance (JSA) isconcurrent with a downward trend in the number of working age claimants of incapacity benefitand severe disability allowance (figure 1.1). This suggests that the fall in claimants is a result ofrecipients finding paid employment rather than moving from the JSA to disability benefit andremaining workless.

Quantifying the demand for unskilled labour in areas of low economic activity
12
Figure 1.1
Future trends in the Welsh economy
In general terms the outlook for the Welsh economy is good. Experian Business Strategiesforecasts that the slower growth of 2005 will not continue and that GVA growth will average2.7 per cent in the years between 2008 and 2013. The potential for the further development ofknowledge economy businesses in the Cardiff city region is good and those regions that haveseen below average growth recently, such as Blaenau Gwent, are forecast to see GVA growth inexcess of 2 per cent over the same period.
De-industrialization is likely to continue, though Experian forecasts suggest the rate of declineover the next five years will be less than it has been in preceding years. There are some sub-sectors of manufacturing that remain globally competitive and are relatively untroubled by low-cost competitors, such as the cluster of aerospace related industries. However, some of theWelsh Valley regions remain overly dependent on assembly plants, and continued pressure fromlow-cost manufacturing abroad is likely to fall disproportionately on these areas.
Contact centres also remain under threat from off shoring to lower income English-speakingcountries elsewhere in the world, including India and South Africa. However, contact centresbased in the UK are likely to retain some customer service advantages over foreign centres andas a result are not faced with the same degree of threat from off shoring as low value-addedmanufacturers are.
Looking forward, the key issue for inactive areas of Wales is that many large employers,including assembly plants and contact centres, compete on the basis of low costs. This is aneffective short-term strategy but may threaten future economic success.

Quantifying the demand for unskilled labour in areas of low economic activity
13
1.3 LOCAL AREA COMPARISONS
1.3.1 Economic inactivity
One of the key factors in determining the rates of economic growth in local areas of Wales is thenature of labour market participation. At a UK level, the reasons for inactivity are as follows:10
� looking after family or home (29 per cent of the economically inactive);
� long-term sickness (27 per cent);
� student (22 per cent);
� retired (8 per cent);
� temporary sickness (2 per cent);
� discouraged worker (<0.5 per cent); and
� other (11 per cent).
As highlighted in the background to this study, economic inactivity and the associated lowemployment rates is one of the biggest challenges facing the Welsh economy as a whole, andmagnified in certain unitary authorities. Over the past 20 years or so the number of peopleclassified as economically inactive has significantly increased, in particular through anincreased proportion of men giving their reason for inactivity as long-term sickness ordisability. Indeed, Wales has higher incidences in inactivity primarily due to retirement andlong-term sickness.
Across the local areas of interest in this study, the following patterns emerge:
� The local authorities of Bridgend and Wrexham are considered ‘cooler’ areas whereinactivity rates are lower, and this is illustrated in part in figure 1.2. The average rate ofeconomic activity in 2005 was 79.5 per cent in Wrexham, above that of Wales (75.2 percent). This is despite the skew of the local economy towards the manufacturing sector(section 1.3.2).
� In contrast, Bridgend experienced activity rates below the average, and below that ofNewport and Cardiff. However, we consider Cardiff, Newport and Swansea as urbanareas with hotspots of inactivity, rather than areas with generally low activity rates.
� The story for Blaenau Gwent and Merthyr Tydfil is as we expect, in that for these clustersof economic inactivity in the Upper Valleys, economic activity rates are notably belowthe Wales average, at 70 per cent and 67.9 per cent respectively.
10 Source: Labour Force Survey, Q2 (April to June) 2005.

Quantifying the demand for unskilled labour in areas of low economic activity
14
� A notable point illustrated in figure 1.2 is the relatively narrow difference between maleand female economic activity rates in Bridgend and Swansea, at around 5 per cent(compared to Wales, Bridgend and Swansea offer relatively more employmentopportunities in female dominated hospitality, retail, and public services), while thedifference rises to 11 per cent in Newport and 12 per cent in Cardiff (this partly reflectsthe relatively large, male dominated, manufacturing sector in Newport and areas offinancial and business services providing male employment opportunities in Cardiff,including financial brokering and computer consultancy activities).
Figure 1.2
The very low male activity rate in Merthyr Tydfil is one of the key determinants of economicactivity in the local area. It also helps interpret the demand for un- and low-skilled labour, asMerthyr Tydfil is subject to unique issues for both the nature of individuals in the labour pool,and the job opportunities open and available to males not in employment.
Gently rising unemployment in 2006 has resulted in unemployment rolls being swelled bypeople who, having being recently laid off, are probably more attractive to employers thanpeople who were unable or unwilling to work when employment levels were higher. There isanecdotal evidence that this may be happening on a local basis in places such as Bridgend.

Quantifying the demand for unskilled labour in areas of low economic activity
15
1.3.2 Industry
The breakdown of employment by sector shows that the difference in workforce compositionbetween the wealthier and poorer regions of Wales is evident, but areas with similar economicperformance vary in their industrial make-up. For example, Blaenau Gwent remains extremelydependent on manufacturing employment, yet nearby Merthyr Tydfil, with a similar incidenceof deprivation, is less reliant on manufacturing jobs (figure 1.5). Wrexham, one of the moreeconomically successful areas in the study, with an extremely low incidence of unemployment,is also more dependent on manufacturing than any other region (figure 1.6), with the exceptionof Blaenau Gwent. It is clear that a large manufacturing base and low levels of activity are notnecessarily related (figure 1.3).
Figure 1.3
Apart from manufacturing the proportions of the workforce employed in each industrial sectorare broadly comparable, though Cardiff remains a clear leader in financial services.
Cardiff, Newport and Swansea
Cardiff dominates the Welsh economy, both in terms of economic size and income per head,although with areas of inactivity associated with large urban cities. This position is likely tocontinue in the medium term as Cardiff is home to relatively high concentrations of growthindustries, including financial services.
Swansea is the second largest city in Wales, but has not experienced the same degree ofpopulation expansion as Cardiff. Eligibility for objective 1 funding also demonstrates a GDPper head that is less than 75 per cent of the European average. Newport is predominantly amanufacturing city and port; however this is a declining sector in terms of employment.Concentrated pockets of deprivation exist in Newport near areas of relative affluence and thereare concentrations of disadvantaged households that fall within the 100 most deprived wards inWales.

Quantifying the demand for unskilled labour in areas of low economic activity
16
Figure 1.4 considers the industrial make-up of the three areas in more detail. Financial servicesaccount for over twice the proportion of employment in Cardiff, compared to the Walesaverage. Similarly, business services (real estate, renting and business activities) are over-represented in Cardiff, Newport and Swansea.
While the industrial structure of the three urban areas is quite similar, there are also somenotable differences. Newport does differ from Cardiff and Swansea, in terms of its reliance onthe manufacturing sector and the significant proportion of employment in health and socialwork. Meanwhile, Swansea has a relatively large hospitality sector.
Figure 1.4

Quantifying the demand for unskilled labour in areas of low economic activity
17
Merthyr Tydfil and Blaenau Gwent
Merthyr Tydfil and Blaenau Gwent are towns with industrial roots whose faces have beenchanged by two decades of reclamation and regeneration. However, GDP per head levels lagbehind both the Welsh and European average, and both are recipients of objective 1 funding.
The manufacturing sector accounts for around one-fifth of total employment in Merthyr Tydfiland one-quarter in Blaenau Gwent, compared to the Wales average of 13 per cent (figure 1.5).However, the health and social work sector is of greater importance in Merthyr Tydfil thanWales as a whole.
Figure 1.5

Quantifying the demand for unskilled labour in areas of low economic activity
18
Bridgend and Wrexham
Bridgend and Wrexham have similar levels of economic activity to the Welsh average.Bridgend’s local economy is a mix of successful and growing companies, in both manufacturingand service and typically experiences similar employment rates in comparison to Wales as awhole, and average levels of low and non-qualified working age population. Wrexham is nowthe largest settlement in North Wales and has one of the lowest rates of unemployment.
The industrial profile of employment in Bridgend and Wrexham follows the Welsh trends,although as illustrated in figure 1.6, both economies have an over-reliance on the manufacturingsector and a smaller financial and business service sector.
Figure 1.6

Quantifying the demand for unskilled labour in areas of low economic activity
19
In this respect, both Bridgend and Wrexham have a similar industrial make-up to the lowereconomic activity areas of Merthyr Tydfil and Blaenau Gwent and this is an important point thatwe highlight through the report. However, comparing the local authorities at a sub-sectormanufacturing level (as shown in figure 1.7), Wrexham is significantly over-represented infood, drink and tobacco (as is Merthyr Tydfil), sectors with a relatively low workforcequalification profile. However, a significant proportion of Merthyr Tydfil manufacturingemployment is also found in manufacturers of metals, machinery and equipment, requiringmore specialist skills above those held by the un- and low-skilled.
Blaenau Gwent and Bridgend have a relatively similar profile, with both local authorities over-represented in minerals, electrical and optical equipment and transport equipment.
Figure 1.7
Quantifying the demand for unskilled labour in areas of low economic activity
20
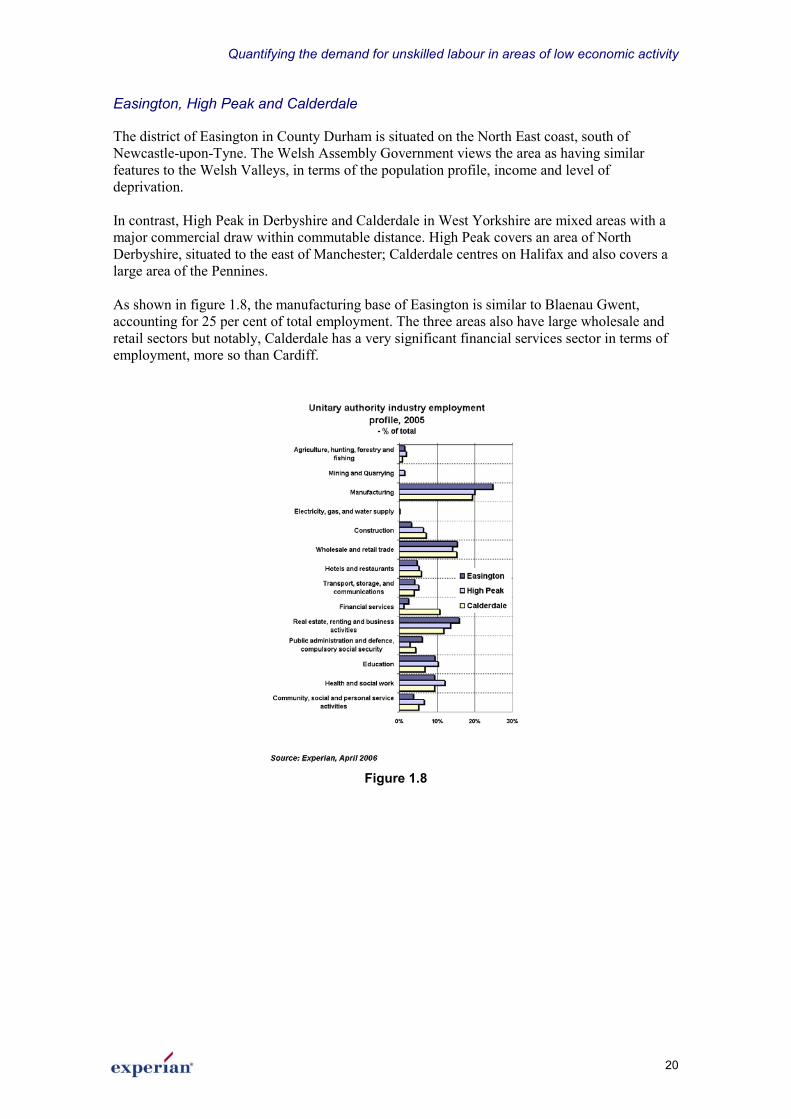
Easington, High Peak and Calderdale
The district of Easington in County Durham is situated on the North East coast, south ofNewcastle-upon-Tyne. The Welsh Assembly Government views the area as having similarfeatures to the Welsh Valleys, in terms of the population profile, income and level ofdeprivation.
In contrast, High Peak in Derbyshire and Calderdale in West Yorkshire are mixed areas with amajor commercial draw within commutable distance. High Peak covers an area of NorthDerbyshire, situated to the east of Manchester; Calderdale centres on Halifax and also covers alarge area of the Pennines.
As shown in figure 1.8, the manufacturing base of Easington is similar to Blaenau Gwent,accounting for 25 per cent of total employment. The three areas also have large wholesale andretail sectors but notably, Calderdale has a very significant financial services sector in terms ofemployment, more so than Cardiff.
Figure 1.8

Quantifying the demand for unskilled labour in areas of low economic activity
21
1.3.3 Income and productivity
There are substantial regional variations in average incomes within the Welsh economy. Theareas of concern in this report include both Swansea, where the median gross weekly pay of fulltime workers is just £326, and Bridgend where it is 30 per cent higher: almost £427.11
It is worth noting that even areas which are perceived as having high levels of deprivation, suchas Blaenau Gwent and Merthyr Tydfil, still have median incomes for full-time workers that areover 90 per cent of the Welsh average. However, on average, those that live and work inMerthyr Tydfil and Blaenau Gwent earn 35 per cent less than those that work in but live outsidethe area.
Figure 1.9 shows that output per head of the working age population in the regions studiedvaries to a far greater degree than the median wage. This difference reflects both the highinactivity rates in the less productive regions, and differences in the industrial composition ofeach region.
Figure 1.9
11 ASHE median gross full time weekly wage by workplace, for full time workers in 2005.

Quantifying the demand for unskilled labour in areas of low economic activity
22
1.4 WORKFORCE CONTEXT
1.4.1 Occupations
The average income and economic output per head of local authorities in Wales is a reflectionof the occupational make-up of the population (table 1.2 and 1.3):
� Cardiff has an above average proportion of the population and workforce employed asmanagers and senior officials; professionals; and associate professionals andtechnicians.12
� The occupational make-up of Cardiff, Newport and Swansea also reflects the demandfrom its industrial profile, in terms of administrative and secretarial; and sales andcustomer service occupations.
� Conversely the population and workforce in Blaenau Gwent, Merthyr Tydfil, Bridgendand Wrexham has higher than average proportions of relatively low paid occupationalgroups including elementary occupations13 and plant, process and machine operatives.14
� The difference between Blaenau Gwent and the Welsh average is stark – proportionately,Blaenau Gwent has 43 per cent of its residents (and 40 per cent of its workforce)employed in low-skilled occupations, compared to 30 per cent across the whole of Wales.
Occupational composition of the workforce by local authority area, 2004(residence based, % of total, column = 100%)
BlaenauGwent Bridgend Cardiff Merthyr
Tydfil Newport Swansea Wrexham Wales
Managers andSeniorOfficials
9 12 15 11 13 13 12 13
Professional 5 9 16 7 11 10 10 11AssociateProfessionaland Technical
9 14 16 11 12 14 13 13
AdministrativeandSecretarial
11 10 15 13 13 13 11 11
Skilled Trades 12 13 7 14 10 10 14 13PersonalService 12 8 5 8 8 8 9 9
Sales andCustomerService
8 8 11 9 10 11 8 8
Process,Plant andMachineOperatives
20 13 5 11 9 8 13 10
Elementary 15 13 11 15 13 13 10 12Source: Annual Population Survey 2004
Table 1.2
12 Examples of associate professional and technical occupations include: draughtspersons, nurses, ITtechnicians etc.13 Examples of elementary occupations include: window cleaners, postal workers, bar staff etc.14 Examples of plant, process and machine operatives include: crane drivers, construction workers etc.

Quantifying the demand for unskilled labour in areas of low economic activity
23
Occupational composition of the workforce by local authority area, 2004(workplace based, % of total, column = 100%)
BlaenauGwent Bridgend Cardiff Merthyr
Tydfil Newport Swansea Wrexham Wales
Managers andSeniorOfficials
10 12 15 8 12 12 13 12
Professional 9 8 14 8 11 10 10 11AssociateProfessionaland Technical
11 14 16 11 14 13 13 13
AdministrativeandSecretarial
9 8 17 14 14 16 9 12
Skilled Trades 12 13 7 12 9 10 16 13PersonalService 8 8 5 9 7 7 9 8
Sales andCustomerService
7 9 12 11 9 11 8 8
Process,Plant andMachineOperatives
17 14 5 9 13 8 13 10
Elementary 16 13 10 18 12 13 9 13Source: Annual Population Survey 2004
Table 1.3
1.4.2 Qualification levels
In terms of Welsh resident qualification levels, these are below the UK average generally, butthere are distinct differences in the qualification levels of residents and the workforce at aunitary authority level.
As shown in table 1.4, almost one-quarter of Welsh residents are educated to level 4 or above(equivalent to degree or postgraduate qualifications). This rises to 34 per cent of Cardiffresidents but just 13 per cent of residents in Blaenau Gwent.
Notably, Blaenau Gwent and Merthyr Tydfil have a higher proportion of residents at the lowerend of the qualification scale, compared to the Wales average and Cardiff, Swansea, Bridgendand Wrexham.
Qualification composition of the workforce by local authority area, 2004(NVQ equivalent, residence based, % of total, column = 100%)
BlaenauGwent Bridgend Cardiff Merthyr
Tydfil Newport Swansea Wrexham Wales
Level 4 + 13 22 34 17 22 25 22 24Level 3 10 15 16 12 13 20 16 15Tradeapprenticeships 6 6 4 7 6 6 7 6
Level 2 19 17 14 15 16 15 19 17Below level 2 17 14 12 15 16 13 13 13Other 10 7 7 8 8 6 7 8None 26 19 13 26 20 17 17 18
Source: Annual Population Survey 2004
Table 1.4

Quantifying the demand for unskilled labour in areas of low economic activity
24
As we expect, qualification levels of the workforce in Wales exceed those of residents, and thisis the case across all the local areas. However, table 1.5 also shows that in the areas of particularinactivity – Blaenau Gwent and Merthyr Tydfil – there is a significant difference in theproportion of the workforce with low-level qualifications compared to residents. This suggeststhere are relatively fewer employment opportunities for these groups than in, for example,Wrexham, which has a closer qualification profile of residents to the workforce. Indeed,previous research has found that there is significant in-commuting of the higher skilled to theValleys.
Qualification composition of the workforce by local authority area, 2004(NVQ equivalent, workplace based, % of total)
BlaenauGwent Bridgend Cardiff Merthyr
Tydfil Newport Swansea Wrexham Wales
Level 4 + 21 27 38 23 28 29 24 28Level 3 11 14 15 11 14 20 18 15Tradeapprenticeships 6 6 5 7 6 6 9 7
Level 2 18 18 16 19 18 15 17 18Below level 2 17 14 13 14 13 13 13 13Other 12 9 6 9 8 6 8 8None 16 12 7 17 13 11 13 12
Source: Annual Population Survey 2004
Table 1.5
1.4.3 Full and part-time work
Trends in recent years have been for a growing number of part-time employment opportunities,at the expense of full-time work, with part-time jobs particularly prevalent in hospitality; retail;education; health and social work; and community, social and personal services. Importantly forthe purposes of this study and the links back to the decline in the male-dominatedmanufacturing sector, these are also sectors where there is an above average representation offemale employment.
The ratio of full to part-time workers in the regions of Wales studied in this report is broadlyreflective of wider UK patterns, and as shown in table 1.6, local areas differ little from theWelsh average. That said, one-third of residents (and workforce) in Swansea work part-time,reflecting the relatively large hospitality sector.
Full and part-time work, 2004(% of total workforce, row = 100%)Residence based Workplace based
Full-time Part-time Full-time Part-timeBlaenau Gwent 76 24 74 25Bridgend 75 25 75 26Cardiff 74 26 76 24Merthyr Tydfil 76 24 72 28Newport 73 27 74 26Swansea 67 33 68 32Wrexham 78 22 78 22Wales 75 25 74 26Source: Annual Population Survey 2004
Table 1.6

Quantifying the demand for unskilled labour in areas of low economic activity
25
1.4.4 Disability
Disability remains a key issue for labour markets in the UK, Wales, and in particular for theareas of relatively low activity considered in this study. The significance of the issue is relatedto frequently voiced perceptions that the number of people registered as disabled and in receiptof disability benefits is substantially greater than the number of people with disabilities sosevere as to preclude all forms of work.
Twenty three per cent of the Welsh population is registered as disabled, though this figureincludes work-limiting disability that does not preclude a person from working in at least someoccupations (figure 1.10).15 However, the national figure contains significant regional variation.In Merthyr Tydfil, Blaenau Gwent and Bridgend the comparable figure is approximately 28 percent, while the figure for Cardiff is the lowest, at 21 per cent.
Figure 1.10
Annual Population Survey data from 2004 suggests that a very high proportion of the inactiveand unemployed population are registered as having a disability of some kind. For Wales as awhole, 35 per cent of people without a job (including both those who are looking for a job andthose who are not) were registered as having some kind of disability (figure 1.11). In Bridgendthe figure is as high as 45 per cent.
15 Office of National Statistics (2004) Annual Population Survey

Quantifying the demand for unskilled labour in areas of low economic activity
26
Figure 1.11

Quantifying the demand for unskilled labour in areas of low economic activity
27
1.5 INACTIVITY: A SUPPLY OR DEMAND SIDE PROBLEM?
Labour demand
The UK has suffered from a decline in industrial employment. This decline had the most severeeffects in areas of South Wales that were particularly reliant on a single industry, such as coalmining. The demise of industry led to substantial unemployment, but it is not sufficient toexplain the persistence of high-levels of unemployment in the decades that followed. Otherareas of the UK that were equally affected by the hollowing out of the national manufacturingbase have had far more success in re-orientating their economies and replacing the jobs lost.
The current macro-economic climate in the UK and Wales is benign, and GDP growth has beensteady since 1994. Levels of demand in Wales, and in the UK nationally, are sufficient to powersubstantial employment growth in Merthyr Tydfil, Blaenau Gwent, and the more inactive areasof Newport. This suggests that the problems of inactivity and unemployment in the areas of thestudy are intrinsically local in character, and are not the result of an economy-wide lack oflabour demand.
“The only issue is people who have previously worked in industrial jobsgetting used to a customer service culture.”Retailer, Ebbw Vale
Fears have been raised that the employment prospects of UK nationals are being adverselyaffected by the large increase in economic migration into the UK from the Eastern Europeancountries that acceded to the EU (henceforth referred to as the A8 countries). Evidence showsthat 80 per cent of A8 migrants work in low-skilled occupations where the average hourly wageis between £4.50 and £6.00.16 Given that the inactive and unemployed, should they enter thelabour market, are most likely to obtain low-skilled jobs at similar rates of pay it is probable thatthey will be most affected by the impact of A8 migration. However, thus far, statistical evidencesuggests that increased A8 immigration has not impacted nominal wage growth or beenresponsible for the national rise in the claimant count measure of unemployment in 2005 and2006.17
Romania and Bulgaria are due to accede to the EU in 2007. The UK’s position on allowingmigrants from these countries free access to the UK labour market has not yet been finalised. Itis therefore conceivable that another upsurge in migration may have a cumulative effect on UKwage rates and patterns of unemployment greater than that created by A8 migration alone.18
16 Source: Department of Work and Pensions, (2006), The impact of free movement of workers fromCentral and Eastern Europe on the UK labour market. Available online at:http://www.dwp.gov.uk/asd/asd5/wp29.pdf17 Ibid18 More information on potential A2 migration into the UK can be found in: Institute of Public PolicyResearch, (2006) EU enlargement: Bulgaria and Romania – migration implications for the UK.

Quantifying the demand for unskilled labour in areas of low economic activity
28
However, there are two structural features of the UK labour market that mitigate against thepossibility of eastern European migrants reducing wages and displacing British-born workers.Firstly, the minimum wage prevents migrants undercutting local labour in the lowest paid jobs.The minimum wage has grown faster than average wages and it provides effective wageprotection for a large number of workers.19 Secondly, migrant workers have been concentratedin distribution, hotels and restaurants, and manufacturing employment.20 It seems plausible thatlimited oral, and in particular written, language skills are less disadvantageous in theseoccupations than administrative and customer service roles in the service sector. Therefore, UK-born low-wage, low-skill workers probably enjoy some protection from migrant job competitionin large areas of the service sector.
Labour supply
Previous studies in the UK and Wales suggest that some worklessness in hotspots of deprivationis a result of local people being unwilling or unable because of barriers to accept available jobsin the local labour market. People voluntarily leaving benefits must rationally expect to improvetheir standard of living by beginning work. If this is not possible, those with access to benefitswill be understandably reluctant to accept some low paid jobs. The success of A8 migrants infinding employment at the minimum wage while some local people remain inactive suggeststhat wage expectations and the benefit trap do have a role to play in unemployment andinactivity.
Substantial anecdotal evidence and survey evidence suggests that a benefit trap exists for theunemployed in the UK, with the result that taking on a minimum wage job will result in a verylow increase in income per hour worked. The effect appears to persist despite Governmentefforts to tackle the issue through the Working Family Tax Credit programme. The Return toWork21 credit is also aimed at tackling the problem.
Poor public transport links and a lack of private transport may also prevent people who wish towork from finding jobs. The unemployed and the economically inactive of working age holdfewer qualifications than the workforce,22 and are consequently much more likely to have a low-skilled, low-paid job if they re-enter the workforce. Studies show that the location of a job is farmore important for people with low skills and workers with low skills typically commute asmaller distance to work than average.23
The high cost and limited availability of childcare is recognised as an important factor inkeeping mothers out of the workforce. Childcare is particularly important for lone parents andmust be addressed if the government is to meet its goal of a 70 per cent employment rate for thisgroup.
19 From 1999 to October 2006 the adult minimum wage rose from £3.60 to £5.35: a rise of 48 per cent. Asa proportion of the average hourly wage this compares favourably with, for example, the USA where theminimum wage is $5.15 per hour.20 Source: Department of Work and Pensions, (2006) The impact of free movement of workers fromCentral and Eastern Europe on the UK labour market. Available online at:http://www.dwp.gov.uk/asd/asd5/wp29.pdf21 A non-taxable payment of £40 per week, available for up to 12 months for people moving into full-timework in certain pilot areas.22 In Wales 54 per cent of the unemployed and inactive have no qualification higher than an NVQ level 2,or no qualifications at all; the comparable figure for the workforce in Wales is just 32 per cent. Source:Annual Population Survey 2004.23 Source: The geography of poor skills and access to work (2006). University of Warwick of behalf ofthe Joseph Rowntree Foundation.

Quantifying the demand for unskilled labour in areas of low economic activity
29
2 The demand for unskilled labour
SUMMARY
Compared to other occupations, low skilled work is more likely to be part-time, temporary, andmostly below level 2 but does not facilitate training. Relative youth in sales and customerservice and elementary roles is also strongly related to the number of students in the workforce
Vacancies
Vacancies notified in Wales have generally been on a downward trend over the past two years,consistent with slowing economic growth. The statistical evidence also suggests that labourdemand in terms of the scale of vacancies is lower in areas of low activity. However, anecdotalevidence stresses there are no difficulties in placing low skilled workers in work and that evenin areas with a low vacancy ratio there is not an excess supply of unskilled labour.
On the whole there are substantial numbers of job opportunities for workers looking for low-skilled employment in the study areas – approximately half of all vacancies advertised withJobcentre Plus in Wales, rising to 59 per cent in Wrexham.
Production operatives account for the largest number of low skilled vacancies, particularly inBridgend and Swansea. Low skilled roles in the service sector are primarily located in Cardiff,Newport and Swansea. Wrexham demonstrates its manufacturing base with a high proportion ofwarehouse operative and assembly operative vacancies.
Factors affecting local labour demand
The scale of in-commuting in Cardiff makes it the only local authority in Wales to have a jobsdensity above 1. Merthyr Tydfil and Blaenau Gwent have relatively low job density ratesindicating a low number of jobs opportunities and a potential mismatch between local labourdemand and supply that prevents positions being filled. Low business density may alsocontribute to inactivity.
Employment patterns
Blaenau Gwent and Merthyr Tydfil, with the highest levels of inactivity, have markedly morepart time vacancies, particularly requiring between 8 and 15 hours. This is partly related to thestructure of benefits payments.
The majority of the lowest skilled workers are on temporary contracts, but many temporaryvacancies are filled by existing employment agency clients, rather than through directadvertising.
Quantifying the demand for unskilled labour in areas of low economic activity
30
2.1 OVERVIEW
This section draws on data and consultation evidence to present the current demand forunskilled labour in local areas of Wales. Existing labour market patterns are a close proxy to theextent and nature of demand for labour, as over time both supply and demand generally moveinto alignment and meet what is required from both individuals and businesses (althoughequilibrium may not necessarily be reached in the short-term due to lags in response).
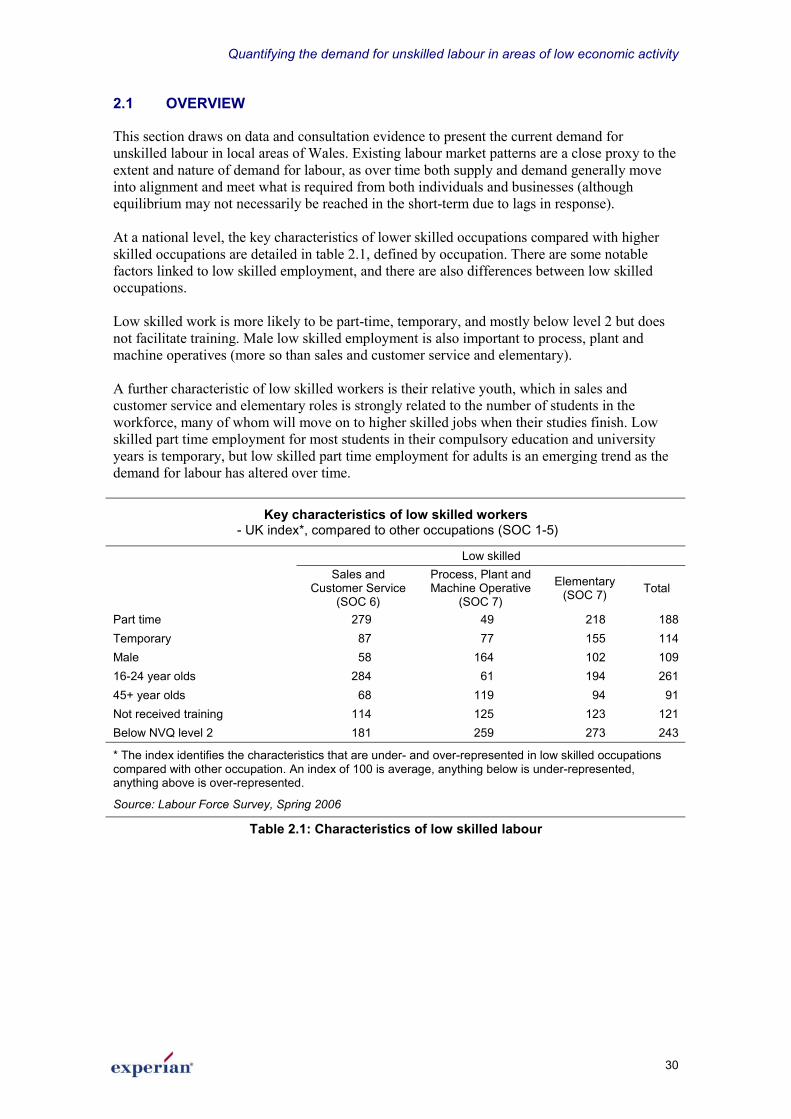
At a national level, the key characteristics of lower skilled occupations compared with higherskilled occupations are detailed in table 2.1, defined by occupation. There are some notablefactors linked to low skilled employment, and there are also differences between low skilledoccupations.
Low skilled work is more likely to be part-time, temporary, and mostly below level 2 but doesnot facilitate training. Male low skilled employment is also important to process, plant andmachine operatives (more so than sales and customer service and elementary).
A further characteristic of low skilled workers is their relative youth, which in sales andcustomer service and elementary roles is strongly related to the number of students in theworkforce, many of whom will move on to higher skilled jobs when their studies finish. Lowskilled part time employment for most students in their compulsory education and universityyears is temporary, but low skilled part time employment for adults is an emerging trend as thedemand for labour has altered over time.
Key characteristics of low skilled workers - UK index*, compared to other occupations (SOC 1-5)
Low skilledSales and
Customer Service(SOC 6)
Process, Plant andMachine Operative
(SOC 7)
Elementary(SOC 7) Total
Part time 279 49 218 188Temporary 87 77 155 114Male 58 164 102 10916-24 year olds 284 61 194 26145+ year olds 68 119 94 91Not received training 114 125 123 121Below NVQ level 2 181 259 273 243
* The index identifies the characteristics that are under- and over-represented in low skilled occupationscompared with other occupation. An index of 100 is average, anything below is under-represented,anything above is over-represented.
Source: Labour Force Survey, Spring 2006
Table 2.1: Characteristics of low skilled labour

Quantifying the demand for unskilled labour in areas of low economic activity
31
2.2 VACANCIES
2.2.1 The relationship between vacancies and labour demand
Vacancies are indicative of demand for labour in an area. Employers who are working in agrowing market will notify vacancies to fill temporary and permanent positions, as orderrequests require them to do so. Similarly, in periods of economic downturn, employers are morelikely to end all recruitment activity, and even shed workers, and this will be reflected in a fall-off of vacancy openings for new staff.
However, the number of vacancies generated by businesses in an area is not a complete matchto the demand for labour. There are three reasons for this:
� Firstly, advertised vacancies may be lower than the number of actual vacancies due toinadequate information or informal recruitment methods. However, our qualitativeresearch suggests that informal methods of recruitment only form a small element of thetotal (see section 3.3.1).
� Secondly, high labour turnover can distort the relationship between the number ofvacancies and the stock of jobs available, and our qualitative research suggests that labourturnover is high in low skilled jobs in the areas of the study.
� Thirdly, even if vacancies are an accurate reflection of the stock of jobs available, peoplecommuting into work from outside the area may fill them. However, given the low travel-to-work times typically exhibited by low-skilled workers, and the particular transportissues in the Welsh Valleys, such considerations are unlikely to be significant in this case.
Not withstanding these caveats, vacancy-based measures remain the best available indicator ofunderlying labour demand in a local area.
2.2.2 Vacancies nationally
The number of vacancies notified to Jobcentre Plus in Wales has generally been on a downwardtrend over the past two years (figure 2.1). This is consistent with the slowing of economicgrowth throughout the Welsh and UK economies, but it is also possible (though unlikely) that afall in Jobcentre vacancies is being balanced by a rise in vacancies advertised through othersources. However, the decline in vacancy rates is modest, and with the outlook for the Welsheconomy fairly robust, the scope for further falls in vacancy numbers is limited, and a smallrecovery seems the more likely outcome.

Quantifying the demand for unskilled labour in areas of low economic activity
32
Figure 2.124
2.2.3 Vacancies per head of working age population
As table 2.2 demonstrates, areas of low activity generally do have fewer vacancies relative tothe size of their working age and economically inactive populations than areas with higheractivity rates. This is particularly the case in Blaenau Gwent, where vacancies account foraround half the proportion of the economically inactive compared to Cardiff. Vacancies inMerthyr Tydfil are also below average.
Vacancy rates, 2005- local authorities ranked by ratio in first column
All notified vacancies Low skilled* notified vacancies% of working age
population% of economicallyinactive population
% of working agepopulation
% of economicallyinactive population
Cardiff 1.2 4.9 0.6 2.6Newport 1.1 5.1 0.6 2.8Swansea 1.1 4.2 0.7 2.5Merthyr Tydfil 1.0 3.0 0.6 1.9Wales 0.9 3.5 0.5 1.9Bridgend 0.9 3.4 0.5 1.9Wrexham 0.8 3.7 0.4 2.1Blaenau Gwent 0.7 2.3 0.4 1.4
* Defined by SOCSource: Annual Population Survey and JCP, Jan 2005-Dec 2005 average; NOMIS
Table 2.2
24 In September 2001 ONS, with the agreement of the Department for Work and Pensions, deferred thepublication of Jobcentre Plus vacancy statistics because of distortions in the data from May 2001onwards. This data was restored but is available from April 2004 onwards.

Quantifying the demand for unskilled labour in areas of low economic activity
33
The statistical evidence suggests that labour demand in terms of the scale of vacancies is lowerin areas of low activity. However, the ratio of vacancies to working age population differs verylittle, particularly for the low skilled. The ratio of low skilled vacancies to the inactivepopulation in areas such as Blaenau Gwent also reflects the relatively large number of inactive.It is also important to note that job brokers feel that there are no significant difficulties inplacing low skilled workers in work and that even in areas with a low vacancy ratio there is notan excess supply of unskilled labour.
2.2.4 Labour demand by occupation
In line with the pattern of total vacancies, the number (and percentage) of unskilled vacanciesnotified to Jobcentre Plus in Wales has generally also been on a downward trend over the pasttwo years (figure 2.2), particularly for elementary vacancies. Figure 2.2 also demonstrates theseasonal variations in demand for unskilled labour. There is a clear pattern of increased hiring inlate summer after the summer holidays have finished, and a dearth of vacancies being posted inthe months following the Christmas holidays.
Figure 2.2
Considering the local areas of Wales between 2004 and 2006, Newport, Wrexham and Cardiffappear to be in a situation where the number of low skilled vacancies is rising. Neither MerthyrTydfil nor Blaenau Gwent has yet seen a sustained increase in vacancies while in Swanseaunskilled vacancies still seem to be falling. At the time of writing the labour market appears tohave made an upward turn, however there is not enough data to read a trend with certainty.
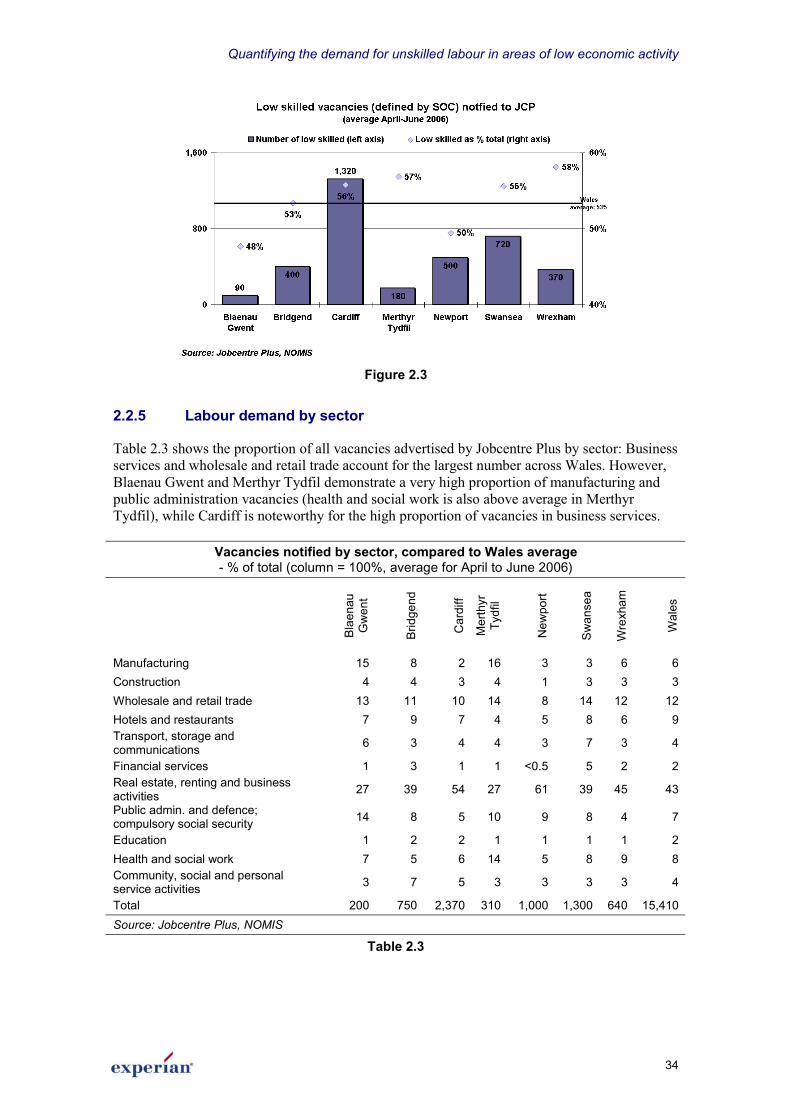
As figure 2.3 shows, despite the downturn there remain a substantial number of jobopportunities for workers looking for low-skilled employment in the study areas, approximatelyhalf of all vacancies advertised with Jobcentre Plus in Wales, rising to 59 per cent in Wrexham.
Quantifying the demand for unskilled labour in areas of low economic activity
34
Figure 2.3
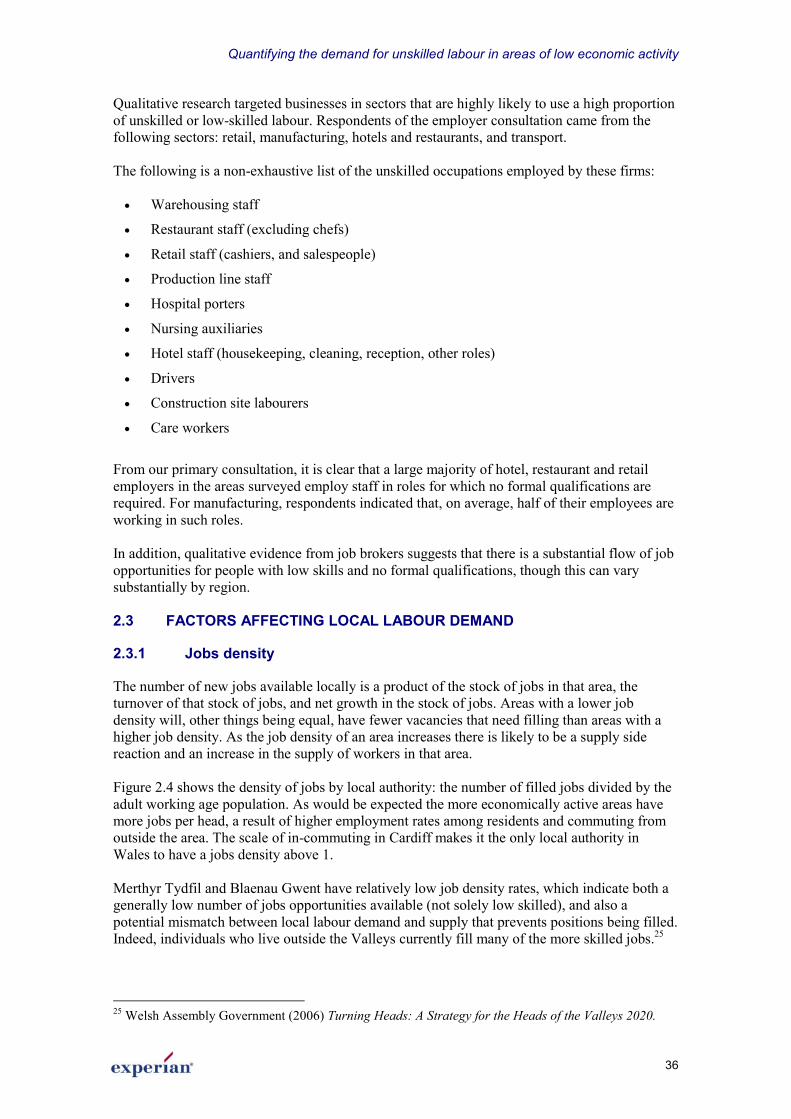
2.2.5 Labour demand by sector
Table 2.3 shows the proportion of all vacancies advertised by Jobcentre Plus by sector: Businessservices and wholesale and retail trade account for the largest number across Wales. However,Blaenau Gwent and Merthyr Tydfil demonstrate a very high proportion of manufacturing andpublic administration vacancies (health and social work is also above average in MerthyrTydfil), while Cardiff is noteworthy for the high proportion of vacancies in business services.
Vacancies notified by sector, compared to Wales average- % of total (column = 100%, average for April to June 2006)
Blae
nau
Gw
ent
Brid
gend
Car
diff
Mer
thyr
Tydf
il
New
port
Swan
sea
Wre
xham
Wal
esManufacturing 15 8 2 16 3 3 6 6Construction 4 4 3 4 1 3 3 3Wholesale and retail trade 13 11 10 14 8 14 12 12Hotels and restaurants 7 9 7 4 5 8 6 9Transport, storage andcommunications 6 3 4 4 3 7 3 4
Financial services 1 3 1 1 <0.5 5 2 2Real estate, renting and businessactivities 27 39 54 27 61 39 45 43
Public admin. and defence;compulsory social security 14 8 5 10 9 8 4 7
Education 1 2 2 1 1 1 1 2Health and social work 7 5 6 14 5 8 9 8Community, social and personalservice activities 3 7 5 3 3 3 3 4
Total 200 750 2,370 310 1,000 1,300 640 15,410Source: Jobcentre Plus, NOMIS
Table 2.3

Quantifying the demand for unskilled labour in areas of low economic activity
35
2.2.6 Job title
In terms of presenting members of the inactive population with achievable and realisticopportunities of work, a wide range of vacancies is as important as a large number of vacancies.The top 20 vacancies are presented in table 2.4, where the notable points are highlighted in bold:
� Production operatives account for the largest number, although these vacancies are over-represented in Bridgend and Swansea. Bridgend is also over-represented as the locationfor service sector roles such as bar staff and entertainment consultants;
� That said, low skilled roles in the service sector are primarily located in Cardiff, Newportand Swansea, as expected from the industry profile of employment in the three areas;
� Wrexham demonstrates its manufacturing base with a high proportion of warehouseoperative and assembly operative vacancies;
� (As also illustrated in figure 2.3) Blaenau Gwent and Merthyr Tydfil have relatively fewlow skilled vacancies compared to other areas (which is reflective of the population base),but the highest number of low skilled vacancies in these areas are brochure distributors,packers, and sales advisors that are specifically advertised as part-time and weekend.
Top 20 low skilled vacancies* notified to Jobcentre Plus in areas of study(Open vacancies, April-June 2006)
Tota
l
Brid
gend
Blae
nau
Gw
ent
Car
diff
Mer
thyr
Tydf
il
New
port
Swan
sea
Wre
xham
% of total (row = 100%)Production operative 230 32 - 10 18 5 34 1Bar staff 190 39 5 27 1 3 17 9Sales assistant 170 15 3 48 5 3 16 10Cleaner 160 12 4 21 3 7 30 22Customer service 150 1 1 54 - 1 44 -Asset and recovery agent 150 - - 33 - 33 33 -Customer service advisor 100 5 - 37 13 5 16 25Warehouse operative 100 2 1 - 7 3 18 69Sales advisor 90 16 - 30 1 43 7 3Security officer 80 18 - 29 8 17 25 4Telesales executive 70 - - - - 8 92 -Customer service agents 70 - - - - - 100 -Chef 70 14 - 43 - 6 20 17Assembly operative 60 - - - - - - 100Entertainment consultant 60 33 - 67 - - - -Food operative 60 - - - - - - 100Telesales staff 60 5 - 9 - - 86 -Window cleaner 60 - 3 2 - - - 95Waiting staff 60 9 - 35 4 4 25 25Brochure distributor 60 20 48 - 20 - 13 -Total 7,510 11 3 32 5 13 22 13* Low skilled defined by occupation or industry (see page 8).Source: Jobcentre Plus vacancies database, April to June 2006
Table 2.4
Quantifying the demand for unskilled labour in areas of low economic activity
36
Qualitative research targeted businesses in sectors that are highly likely to use a high proportionof unskilled or low-skilled labour. Respondents of the employer consultation came from thefollowing sectors: retail, manufacturing, hotels and restaurants, and transport.
The following is a non-exhaustive list of the unskilled occupations employed by these firms:
� Warehousing staff
� Restaurant staff (excluding chefs)
� Retail staff (cashiers, and salespeople)
� Production line staff
� Hospital porters
� Nursing auxiliaries
� Hotel staff (housekeeping, cleaning, reception, other roles)
� Drivers
� Construction site labourers
� Care workers
From our primary consultation, it is clear that a large majority of hotel, restaurant and retailemployers in the areas surveyed employ staff in roles for which no formal qualifications arerequired. For manufacturing, respondents indicated that, on average, half of their employees areworking in such roles.
In addition, qualitative evidence from job brokers suggests that there is a substantial flow of jobopportunities for people with low skills and no formal qualifications, though this can varysubstantially by region.
2.3 FACTORS AFFECTING LOCAL LABOUR DEMAND
2.3.1 Jobs density
The number of new jobs available locally is a product of the stock of jobs in that area, theturnover of that stock of jobs, and net growth in the stock of jobs. Areas with a lower jobdensity will, other things being equal, have fewer vacancies that need filling than areas with ahigher job density. As the job density of an area increases there is likely to be a supply sidereaction and an increase in the supply of workers in that area.
Figure 2.4 shows the density of jobs by local authority: the number of filled jobs divided by theadult working age population. As would be expected the more economically active areas havemore jobs per head, a result of higher employment rates among residents and commuting fromoutside the area. The scale of in-commuting in Cardiff makes it the only local authority inWales to have a jobs density above 1.
Merthyr Tydfil and Blaenau Gwent have relatively low job density rates, which indicate both agenerally low number of jobs opportunities available (not solely low skilled), and also apotential mismatch between local labour demand and supply that prevents positions being filled.Indeed, individuals who live outside the Valleys currently fill many of the more skilled jobs.25
25 Welsh Assembly Government (2006) Turning Heads: A Strategy for the Heads of the Valleys 2020.

Quantifying the demand for unskilled labour in areas of low economic activity
37
Figure 2.4
2.3.2 Business density and creation
The demand for labour at a local level is also a product of the demand for goods and serviceslocally and nationally and of the number of businesses in the local area who can take advantageof that demand. Table 2.5 shows the number of businesses registered with the InterDepartmental Business Register (IDBR) per 1,000 working age population.26 As would beexpected, Cardiff and Wrexham have the greatest number of businesses relative to their workingage population. Lower inactivity rates may encourage business start-ups, but it is also true thathigh business density may contribute to activity.
Levels of business creation are also indicators of economic dynamism. A high level of businessstart-ups (or a high level of businesses growing beyond the IDBR £60,000 threshold) suggeststhat an area has a strong entrepreneurial base that will allow it to continue to grow. It isinteresting to note that Merthyr Tydfil and Blaenau Gwent perform relatively well by thisranking.
Business density and creation, 2004Number of businesses per 1,000
working age populationRatio of business start ups to stock
of businesses (%)Cardiff 29 11Wrexham 29 9Newport 26 11Bridgend 26 10Swansea 25 10Merthyr Tydfil 19 14Blaenau Gwent 17 12High Peak 41 9Calderdale 39 10Easington 16 9Source: IDBR 2005
Table 2.5
26 Businesses are registered with the IDBR when their turnover exceeds an annually adjusted level. In the2005 data release of the IDBR this level was £58,000.

Quantifying the demand for unskilled labour in areas of low economic activity
38
In addition, there is also anecdotal evidence to suggest that in areas with low official activityrates and strong communities there is some informal economic activity.
2.4 EMPLOYMENT PATTERNS
The key characteristics of low skilled labour are detailed in the overview to this section, sourcedfrom the Labour Force Survey for the whole of the UK. Supporting this picture for the localareas in Wales, information on the employment patterns of vacancies advertised by JobcentrePlus are presented in the following analysis.
2.4.1 Part time and full time jobs
Two trends are apparent in the data presented in table 2.6. Firstly, lower skilled vacancies aremarginally, but consistently, more likely to be for jobs requiring less than 30 working hours aweek. Secondly, the areas with the highest levels of inactivity (Blaenau Gwent and MerthyrTydfil) have markedly more part time vacancies, and the difference is particularly pronouncedfor lower skilled part time vacancies requiring between 8 and 15 hours.
The proportion of full and part time jobs advertised by Jobcentre Plus(% of total, column = 100%)
Wrexham Swansea Bridgend Merthyr Tydfil
BlaenauGwent Newport Cardiff Average
30+ hours 76 71 78 69 64 73 72 7316-29 hours 17 22 17 21 26 21 22 218-15 hours 7 7 6 10 10 5 5 6
All Vacs3-month Ave.
(%)Base 770 1,360 720 340 210 1,110 2,340 6,84030+ hours 74 64 74 61 48 76 66 6816-29 hours 18 27 17 25 36 15 26 238-15 hours 8 9 9 15 16 9 8 9
Low skilled*3-month Ave.
(%)Base 430 770 400 200 100 530 1,280 3,710
* Sales Occupations, Plant and machine operators, Elementary occupationsSource: Jobcentre Plus database, April to June 2006
Table 2.6
The particularly high number of vacancies for jobs requiring between 8 and 15 hours a week ispartly related to the structure of benefits payments. Anyone working over 16 hours a week losestheir entitlement to income support, Job Seekers Allowance, and (in most cases) incapacitybenefits as well. Other benefits are also revised downwards, (though the Working Families TaxCredit reduces the benefits trap). This can lead unemployed people to seek a job offering 16hours a week, and is an example of the nature of supply of unskilled labour affecting thedemand for unskilled labour. The higher number of benefit recipients would make this effectmore pronounced in relatively inactive areas, and our qualitative research in Merthyr Tydfilparticularly supports this interpretation.
However, part time jobs are a component of labour flexibility and may well be the best form ofworking for both employer and employee:
“My business couldn’t succeed if I didn’t have young mothers working the 9-3pm shift.”Employer, Swansea

Quantifying the demand for unskilled labour in areas of low economic activity
39
2.4.2 Permanent and temporary jobs
The Jobs Broker Database (a record of vacancies advertised through local newspapers andemployment agencies) indicates that a relatively high proportion of low skilled vacancies arepermanent.
However, as shown in table 2.7 (and evidenced from national Labour Force Survey data),Jobcentre Plus vacancies for jobs in lower skilled occupations are more likely to be temporarythan higher skilled jobs. The discrepancy is partly a reflection of the different types of vacanciesoffered by Jobcentre Plus and private job brokers.
The proportion of temporary and permanent jobs advertised by Jobcentre Plus(% of total, column = 100%)
Wrexham Swansea Bridgend MerthyrTydfil
BlaenauGwent Newport Cardiff Average
Permanent 62 79 73 73 79 77 80 76Temporary 38 21 27 27 21 23 20 24
All Vacs 3-month
Ave. (%) Base 770 1,360 720 340 210 1,110 2,340 6,840Permanent 53 77 70 68 81 72 80 73Temporary 47 23 30 33 19 28 20 27
LowSkilled*3-monthAve. (%) Base 430 770 400 200 100 530 1,280 3,710
* Sales Occupations, Plant and machine operators, Elementary occupationsSource: Jobcentre Plus database, April to June 2006
Table 2.7
Indeed, qualitative research suggests that the proportion of low-skilled vacancies that aretemporary is probably greater than is indicated in either database. This is because manytemporary vacancies are filled by private sector employment agencies from clients on theirbooks, without the need for advertising.
Anecdotally, the majority of the lowest skilled workers are on temporary contracts, and workerswho perform well over a period of time may be offered a permanent role, or workers hired ontemporary contracts may permanently fill the job. Construction jobs in particular are almostalways temporary: labouring jobs are very unlikely to persist longer than the completion of theconstruction project in question.

Quantifying the demand for unskilled labour in areas of low economic activity
40
3 What employers want
SUMMARY
Recruitment
A large majority of interviewed employers use the Jobcentre Plus network to advertise lowskilled vacancies. The second largest advertising channel is via shop windows, and someemployers use private recruitment agencies.
Employers often outsource their selection process for low skilled workers, whereby job brokersselect suitable candidates for immediate employment. Beyond this, application forms are thefavoured method and the selection process often involves at least one interview. Placingpotential candidates on two-week trials with employers also has a high success rate.
Past work experience is the largest single request by employers, although not necessarily in thesame field as the job being applied for. Employers are likely to select more experiencedcandidates when available, although are willing to lower their standards if the pool ofprospective workers is limited.
One powerful factor militating against barriers to work in the recruitment process is the amountof help extended to candidates by job brokers. The amount of assistance and encouragementmade available to potential workers is comprehensive, and is designed to remove as manybarriers to finding a job as possible.
The quality of jobs offered by employers
Anecdotal evidence suggests that a high proportion of unskilled jobs in the areas of study arefilled through temporary contracts, not solely the result of employer preferences, but also ofworker behaviour.
It would appear that for the majority of unskilled jobs, employers have very low requirements.Moreover low-skilled workers do not face the same career penalties as higher skilled workerswhen they change from one type of work to another, with limited possibilities for jobprogression and associated pay increases when remaining with one employer.
Inclusion issues
In recent years awareness of discrimination has risen. That said, candidates who are disabled,over 45, lone parents, or from an ethnic minority are considered disadvantaged in terms ofaccess to the labour market.
Employers are generally unwilling to acknowledge that their procedures may discriminate, butrecruitment agencies believe this to be the case, particularly for those whose work history hasbeen interrupted by time in prison.

Quantifying the demand for unskilled labour in areas of low economic activity
41
3.1 OVERVIEW
On the demand side, employers determine the quality and quantity of the workforce needed todeliver output and to improve competitiveness in the local, national and global marketplace.This section details what employers look for when recruiting for low skilled positions, byconsidering how recruitment, progression and inclusion issues may act as a barrier to groups ofthe inactive attempting to move into the labour market.
3.2 SKILLS GAPS: THE WIDER EVIDENCE
Since 1998, Future Skills Wales has been an ongoing programme of research, consisting ofsurvey and forecast evidence to plan for future skills needs in Wales. Central to the programmeare the Skills Surveys that provide skills shortage, gap and need information from employers.
The existence of skill gaps reflects employer concerns over the skills of its workforce.Employers in the Future Skills Wales skills survey are asked if there is a gap between the typesof skills their current employees have, and those their company needs to meet its businessobjectives.
As shown in table 3.1, skills gaps across the whole economy are concentrated in the occupationswe consider low skilled, namely sales and customer service; process, plant and machineoperative; and elementary. By sector, skill gaps do reflect the occupational profile of theworkforce, so skill gaps amongst sales and customer service staff are to be found in wholesaleand retail trade and financial services; process, plant and machine operatives in themanufacturing sector; and elementary occupations in hotels and restaurants.
Skills gaps by low skilled occupational group and sector in Wales(% of total, all occupations = 100%)
Who
le e
cono
my
Man
ufac
turin
g
Con
stru
ctio
n
Who
lesa
le a
ndre
tail
trade
Hot
els
and
rest
aura
nts
Tran
spor
t, st
orag
ean
dco
mm
unic
atio
ns
Fina
ncia
l ser
vice
s
Rea
l est
ate,
rent
ing
and
busi
ness
activ
ities
Educ
atio
n
Hea
lth a
nd s
ocia
lw
ork
Com
mun
ity, s
ocia
lan
d pe
rson
alse
rvic
e ac
tiviti
esSales andCustomerService
24 5 10 65 29 23 49 17 0 1 16
Process,Plant andMachineOperatives
17 60 7 10 1 29 0 7 1 0 5
Elementary 12 5 5 6 50 18 0 13 12 5 18
Base 63,800 13,870 2,880 13,240 6,260 2,180 3,820 5,740 4,180 6,820 3,740Source: Future Skills Wales 2005
Table 3.1

Quantifying the demand for unskilled labour in areas of low economic activity
42
3.3 RECRUITMENT
The recruitment process, from initial advertisement of vacancy to criteria used in the selectionprocess, typically used by employers often has the effect of excluding candidates who couldsuccessfully fill the role. This is more likely to be the case for individuals experiencing a periodof time away from the labour market, and who have lost some of their job related skills thatwould smooth the movement back into employment.
3.3.1 Methods of advertising jobs used by employers and recruitment agencies
It is clear that different methods are used to advertise different categories of vacancies. The JobsBroker Database, populated by searches of websites, contained far more administrative jobs,and far more permanent jobs than the Jobcentre Plus database.
A large majority of interviewed employers use the Jobcentre Plus network to advertisevacancies, which then makes the vacancies available online and to visitors to the Jobcentre. Thesecond largest advertising channel is via shop windows, presumably because of its costeffectiveness compared with other methods. Some employers use recruitment agencies but inpractice these agencies will advertise these vacancies in their windows, on the internet, and alsothrough the Jobcentre Plus network. Newspapers are seldom used and only one employer heldtheir own recruitment event.
3.3.2 Job application and selection process used by employers
Employers often outsource their selection process for low skilled workers, whereby job brokersselect suitable candidates for immediate employment. Agencies will advertise and interviewworkers, and the first time employers see their new employees is the day they start work.However, our qualitative research does suggest that only large employers use this method, andonly do so for temporary staff.
Application method required for Jobcentre Plus vacancies(% of total, column = 100%)
Wre
xham
Swan
sea
Brid
gend
Mer
thyr
Tydf
il
Blae
nau
Gw
ent
New
port
Car
diff
Aver
age
Interview 13 20 19 17 15 9 16 16Application form 13 14 18 34 25 15 12 15Written app and/or CV 13 17 12 12 16 12 16 14Ring before sending 60 47 51 36 43 64 56 54Go straight round 1 2 1 1 1 1 1 1
All Vacs -3-monthAve. (%)
Base 770 1,360 720 340 210 1,110 2,340 6,840Interview 12 21 22 22 17 12 16 17Application form 9 9 17 33 30 11 9 12Written app and/ or CV 10 14 6 6 11 10 10 10Ring before sending 67 53 54 37 42 67 64 59Go straight round 1 4 2 2 1 1 2 2
Lowskilled - 3-monthAve. (%)
Base 430 770 400 200 100 530 1,280 3,710Source: Jobcentre Plus database, April to June 2006
Table 3.2

Quantifying the demand for unskilled labour in areas of low economic activity
43
Beyond this, employers interviewed in qualitative consultations typically required candidates toapply using application forms. CVs are less commonly requested. There is no evidence ofemployers requiring candidates to apply online.
Qualitative research indicates that the selection process often involves at least one interview.The nature of the interviews varies from an informal chat, to a semi-structured face-to-facequestionnaire format. In some customer facing roles an interview is supplemented by a short(one day or less) trial on the shop or restaurant floor. Permanent workers are also often selectedfrom temporary staff, so in effect employers can benefit from a (paid) trial period of severalmonths.
3.3.3 The selection criteria used by employers
As part of the qualitative research employers were asked what criteria they use to selectcandidates. By far the largest single request is for past work experience, although notnecessarily in the same field as the job being applied for. However, some job brokers also feelthat employers will lower their standards, particularly in areas where low unemployment hasreduced the pool of willing workers.
“Employers expect clients to be able to work immediately so experience isvalued. Employers look for ‘reliability, turn up on time, experience.”Recruitment agency, Swansea
‘…Not really interested in qualifications as such…’Caterer, Swansea
“All occupations such as customer support and warehouse are open toindividuals with some or no qualifications.”Retailer, Cardiff

Quantifying the demand for unskilled labour in areas of low economic activity
44
This point of view is corroborated by the high percentage of vacancies available to candidateswith no experience (table 3.3). However, it is also true that this table probably overstates theopportunities available to candidates with no, or very limited experience as employers are likelyto select more experienced candidates when available, even if experience is not an absoluterequirement.
Length of experience required for JCP vacancies(% of total, column = 100%)
Wrexham Swansea Bridgend MerthyrTydfil
BlaenauGwent Newport Cardiff Average
Noexperiencerequired
71 81 77 73 73 66 58 67
Up to 1 year 9 9 13 19 13 21 22 17Up to 2years 13 5 3 4 4 8 15 10
Between 2and 5 years 7 4 6 5 9 5 5 5
More than 5years <0.5 1 1 <0.5 1 <0.5 1 1
All Vacs3-monthAve. (%)
Base 380 610 410 180 80 730 1,470 3,860Noexperiencerequired
76 87 87 77 86 57 57 69
Up to 1 year 7 7 10 19 13 31 24 19Up to 2years 15 4 - - - 9 17 10
Between 2and 5 years 2 - 2 4 - 2 2 2
More than 5years - - - - - - - -
Lowskilled 3-monthAve. (%)
Base 190 340 220 100 40 340 830 2,070Source: Jobcentre Plus database, April to June 2006
Table 3.3
Other qualities that employers mentioned in qualitative consultations are team working andenthusiasm, skills identified as important in the Future Skills Wales skills survey. Employers inthe hospitality and retail sectors needed staff with communication, customer-handling andpresentation skills.
Providing required work experience could be a problem for support agencies. However, a localJobcentre Plus finds that placing potential candidates on two week trials with employers (aperiod during which the candidate continues to receive benefits while gaining experience) has ahigh success rate.
3.3.4 Support offered to jobseekers
One powerful factor militating against barriers to work in the recruitment process used byemployers is the amount of help extended to candidates by job brokers. There is a verysubstantial and well-established system of initiatives and programmes aimed at ensuring thatcandidates are helped and supported through the process of applying for jobs. The process ofapplication does not appear to offer significant barriers to those who wish to work. The criteriaemployers use to judge candidates are not demanding but are a far greater barrier to candidatesthan the selection process itself.
Recruitment agencies will often complete application forms on behalf of their clients. JobcentrePlus, with its mandate to help weaker candidates, engages third party firms to write candidates’

Quantifying the demand for unskilled labour in areas of low economic activity
45
CVs, and in some cases also offer candidates practice interviews. The Jobcentre network is alsoemployer orientated with active attempts made to market their clients to local employers. Tostrengthen relationships with employers Jobcentre Plus facilities are made available foremployer interviews and recruitment events. The amount of assistance and encouragement madeavailable to potential workers appears to be comprehensive, and is designed to remove as manybarriers to finding a job as possible.
In areas of severe deprivation (such as Merthyr Tydfil) Jobcentre Plus is augmented by theWorking Links initiative. The Employment Zone part of Working Links deals with people whohave been unemployed for more than 18 months and ex-offenders, and attendance iscompulsory. Working Links advisors offer one-to-one engagement with their clients over anextended period of time and help their clients to find, apply for, and keep jobs. Both JobcentrePlus and Working Links can offer well signposted routes to free training programmes.
Since 2003 the DWP has been piloting the Pathways to Work programme that aims to engagewith people on incapacity benefits and help them to find work where and when appropriate. Oneof the seven pilot areas is Bridgend. Early evidence is that the programme has been successfulin moving people in receipt of incapacity benefits into paid work.27 The Want2Workprogramme, also aimed at improving work outcomes for people on incapacity benefit or incomesupport, is rolled out in 200528 and currently operates in four locations in Wales, includingMerthyr Tydfil.
3.4 THE QUALITY OF JOBS OFFERED BY EMPLOYERS
3.4.1 Job security and labour turnover
Anecdotal evidence suggests that a high proportion of unskilled jobs in the areas of study arefilled through temporary contracts. Qualitative consultations found this to be the case even forprocess, plant, and machinery operatives, who nationally are less likely than average to betemporary (see table 2.1). The high number of temporary contracts is not solely the result ofemployer preferences, but also of worker behaviour.
It would appear that for the majority of unskilled jobs employers have very low requirements.This means that a production worker will be considered suitable for a role in another factoryproducing an unrelated product, or even on a construction site, or possibly a retail environment.Anecdotal evidence from Merthyr Tydfil suggests that there are a number of workers who haveexperience working at most, if not all, of the town’s main industrial employers. Low entrancerequirements make it relatively easy for employees to change companies, provided localdemand for unskilled labour is sufficient to enable them to find a similar job nearby.Furthermore, with limited possibilities for job progression and associated pay increases (section3.4.2 and 3.4.3), low-skilled workers do not face the same career penalties as higher skilledworkers when they change from one type of work to another. This further raises the rate oflabour turnover.
Unwillingness on the part of employers to commit to longer term labour contracts without firsttesting the employees’ performance may also be behind high levels of temporary working and
27 Assessments of Pathways to Work are limited by the length of time the pilot programmes have beenrunning for. Further information on the Pathways to Work programme can be found in: Department ofWork and Pensions, (2006) Early Quantitative Evidence of the Pathway to Work Pilots. Available onlineat: http://www.dwp.gov.uk/asd/asd5/rports2005-2006/rrep354.pdf28 There is no official data on the outcomes of the Want2Work project but as of September 30 2006Want2Work has to date engaged with over 2,720 beneficiaries, of whom over 600 have been helped intoemployment through the project.

Quantifying the demand for unskilled labour in areas of low economic activity
46
turnover. Another way in which employers contribute to high levels of labour turnover amongtemporary staff is through seasonally adjusting their labour requirements. Manufacturers insome industrial sectors increase hiring of production in summer in order to meet orders due tobe delivered prior to the Christmas retail boom. Similarly retailers substantially increase hiringimmediately prior to the Christmas shopping period.
High turnover also reduces the willingness of employers to train workers, which reduces theopportunities workers have to upskill and achieve more demanding and rewarding posts. Highturnover clearly also imposes recruitment and induction costs for manufacturers, while alsoreducing the average levels of experience and consequently productivity of the workforce.Having people alternating between periods of employment and unemployment also imposesadministrative and benefit costs on government agencies.
Despite the disadvantages of high labour turnover, the ability to rapidly increase and decreasestaff numbers in response to demand is a key element of competitiveness for local companies,and current economic orthodoxy holds that it is precisely this flexibility that has created thesustained fall in unemployment seen in Wales and elsewhere from the mid 1990’s onwards. Itmay be the case that a less flexible workforce would result in a less successful economy and adecline in the number, and possibly quality, of jobs available. The net effects of high labourturnover are hard to discern and beyond the scope of this study.
3.4.2 Wages
The wages on offer for the lowest skilled work are overwhelmingly minimum wage,29 althoughat the extreme evidence from Wrexham suggests that unskilled labourers can normally expectan hourly wage between £6.00 and £6.50 an hour.
The Jobs Broker Database, populated by searches of websites, contains far more administrativejobs, and far more permanent jobs than the Jobcentre Plus database. As a consequence, thesejobs are also, on average, better paid than Jobcentre vacancies; and, according to qualitativeresearch, better paid than the average vacancy that recruitment agencies have on their books.
3.4.3 Career progression opportunities
Our qualitative interviews with employers and jobs brokers uncovered few examples of workerstaken on in unskilled jobs later progressing to more senior roles, though there are someexceptions:
“some members of staff are now training for higher skilled roles - of whichthere is a real shortage”
In addition, some large retail and restaurant sector businesses do have official programmes thatidentified and trained workers with management potential, which has the potential to upskill andpromote unskilled workers.30 (For more information on training offered by employers seesection 4.5.)
29 The introduction and rapid rise in value of the minimum wage, has according to interviewees, flattenedthe differential between different categories of work. For example, anecdotal evidence suggests thatadministrative positions in Cardiff no longer command the premium over manual work that they once did.30 For example the restaurant chain McDonalds states that 80 per cent of its restaurant managers started inthe company as paid-by-the-hour staff.

Quantifying the demand for unskilled labour in areas of low economic activity
47
3.5 INCLUSION ISSUES
3.5.1 Inclusion: the employer perspective
“I often interview people who have been without work for 2 years, once even for 3years and I am more than happy to hire them if they want to work.”Food processing, Merthyr
In recent years awareness of discrimination has risen, for example, the Prince Charles Hospitalin Merthyr Tydfil runs a substantial, and nationally recognised pre-employment programmeaimed at recruiting people with limited participation in the labour market.
That said, candidates who are disabled, over 45, lone parents, or from an ethnic minority areconsidered disadvantaged in terms of access to the labour market. Therefore, a result of generalawareness of discrimination is that employers are less willing to acknowledge that theirprocedures may discriminate against any candidate. Of all the employers interviewed, only onesays that he has trouble with employees who have previously been long-term unemployed orbeen in receipt of incapacity benefit and would not be willing to employ such people again inthe future. One other employer acknowledges that their shift patterns preclude the employmentof people with childcare responsibilities.
“In the past we’ve had bad experiences hiring individuals who have been out ofthe workforce and have found them to be unable to adjust to the workingenvironment…They failed to turn up on time and quit within a week or so.”Manufacturer, Bridgend
Two employers admitted positively discriminating in favour of workers from the A8 countries,although this could possibly work to the detriment of local jobseekers.
3.5.2 Inclusion: the job broker perspective
In contrast to the views of employers, half of all job brokers interviewed believe that employersdiscriminated against applicants who have been out of work for a long period of time, or havebeen in receipt of sickness benefits. Comments include:
“Employers are reluctant to recruit the long-term unemployed…many alsostay for just a few days before quitting…. (they have a) bad attitude to workand inability to adapt to working life”
“Application forms from employers aim to weed out people who have big gapsin their CVs. This is something of an emerging trend”
“(Employers are) very reluctant to hire those who have been outside of theworkforce for a significant period of time. They are concerned that peoplewho have been out of work for a reason, like they are not employable.”

Quantifying the demand for unskilled labour in areas of low economic activity
48
Job brokers also feel that it can be difficult to place the disabled in work. This may be partly dueto ignorance of the impact of specific disabilities on productivity, and their legal obligations.
“There is a certain fear of what their (employer) responsibilities might be ifthey take on a disabled person with reasonable adjustments.”
One issue that emerged from consultations is that even employers who are broadly sympathetictowards people who have experienced long periods of unemployment or joblessness are lessprepared to employ people whose work history has been interrupted by time in prison.
However, what is clear is that employers most worry about hiring somebody who lacks thecommitment necessary to turn up on time, attend regularly and work hard. They want to avoidthe loss of time and money experienced by the employer who recounted:
“A number of people have left immediately on taking cleaning positionsbecause of the hard physical work involved.”
Employers do not appear to discriminate against recipients of incapacity benefits, or those whohave previously been long term unemployed for those reasons per se, but because they see thesetraits as symptoms of a lack of a genuine work ethic. One of the key concerns of job brokers isto convince employers that their clients, despite a history of unemployment or incapacitybenefit, do genuinely want to work; and to filter out applications for jobs from those who lackthe motivation to hold down a job for more than a few days or weeks.

Quantifying the demand for unskilled labour in areas of low economic activity
49
4 Employer response to local labourmarkets
SUMMARY
The balance of local labour demand and supply
A large majority of employers have no difficulties in recruiting unskilled workers, althoughrecruiting people for anti-social shift patterns is raised as an issue. Employers do not consider alack of suitable candidates as a problem.
Job brokers feel that employers have unrealistic expectations of the quality of labour they canrecruit at the wages (normally minimum) that they are prepared to offer. Still, there is anelement of negotiation between employers and candidates, and in this way a perception may becreated that employer standards are higher than they actually are.
Evidence that substantial numbers of A8 migrants have found low-skilled work with localemployers adds credence to the view that local labour demand is adequate for people who meetthe required standards.
Characteristics of the current balance of demand and supply
The consensus of opinion seems to be that people who want to work are prepared to do so for at,or near, the minimum wage. However, feedback suggests there is a reluctance of low-skilledjobseekers to travel far for minimum wage employment, particularly in the Valleys.
An unwillingness to travel, compounded by poor transport links, means that unskilled workersin the most inactive areas do not benefit from employment opportunities beyond theirimmediate locale.
Migrant workers In Wales
A8 countries dominate the nationalities working in Wales, with Polish being the mostnumerous. However the number of migrants employed as a proportion of firms’ total headcountremains very small. Anecdotal evidence suggests that migrants are more willing to travel fromtheir accommodation to find work than domestic workers.
Migrant workers appear to work in the lowest skilled sectors, as production line workers,cleaners, and unskilled care-workers. The attitude of employers towards migrant labourers isvery positive and they offer a viable alternative to the existing population, but the arrival ofmigrant workers in the areas of the study has not as yet had a negative impact on the wagesavailable to unskilled workers.
Training
There is a mismatch between the skills of some people seeking low-skilled jobs and therequirements (soft skills) that employers have for such roles. However, a low proportion of suchworkers receive training and rapid turnover exacerbates this. Furthermore, for training to have abeneficial affect on output and productivity there needs to be a demand for the skills of trainedworkers and the opportunity for movement into more demanding and rewarding positions.
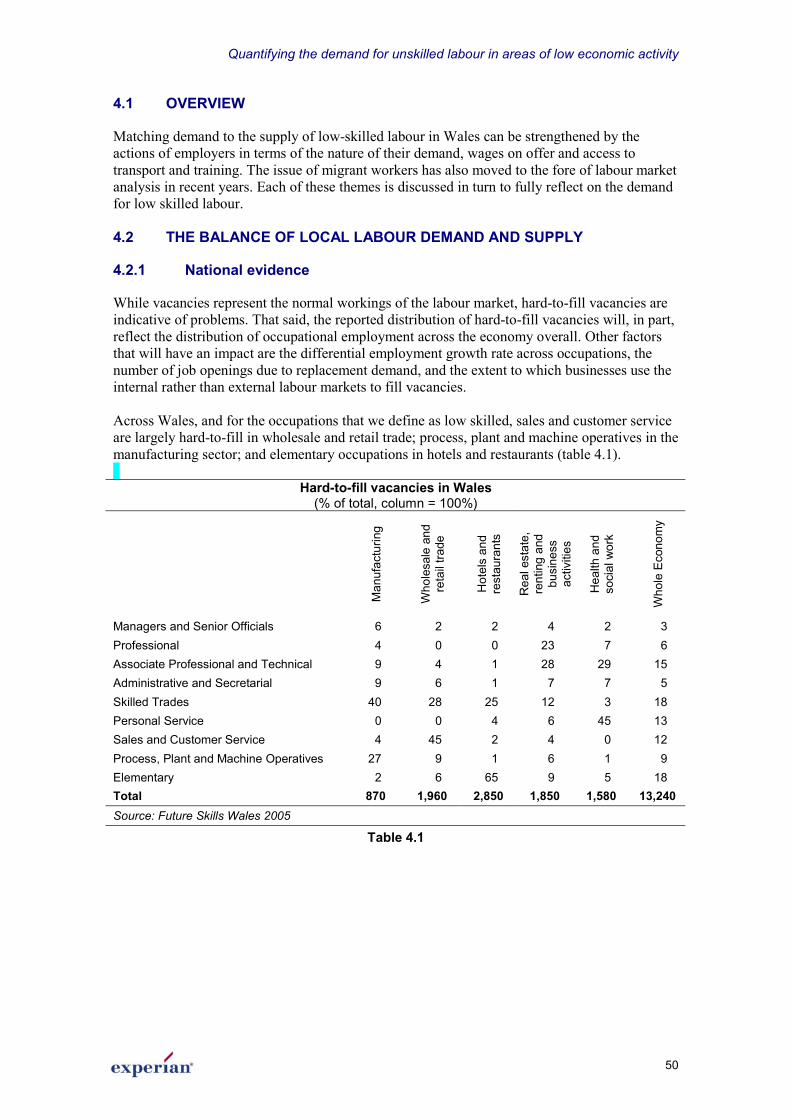
Quantifying the demand for unskilled labour in areas of low economic activity
50
4.1 OVERVIEW
Matching demand to the supply of low-skilled labour in Wales can be strengthened by theactions of employers in terms of the nature of their demand, wages on offer and access totransport and training. The issue of migrant workers has also moved to the fore of labour marketanalysis in recent years. Each of these themes is discussed in turn to fully reflect on the demandfor low skilled labour.
4.2 THE BALANCE OF LOCAL LABOUR DEMAND AND SUPPLY
4.2.1 National evidence
While vacancies represent the normal workings of the labour market, hard-to-fill vacancies areindicative of problems. That said, the reported distribution of hard-to-fill vacancies will, in part,reflect the distribution of occupational employment across the economy overall. Other factorsthat will have an impact are the differential employment growth rate across occupations, thenumber of job openings due to replacement demand, and the extent to which businesses use theinternal rather than external labour markets to fill vacancies.
Across Wales, and for the occupations that we define as low skilled, sales and customer serviceare largely hard-to-fill in wholesale and retail trade; process, plant and machine operatives in themanufacturing sector; and elementary occupations in hotels and restaurants (table 4.1).
Hard-to-fill vacancies in Wales(% of total, column = 100%)
Man
ufac
turin
g
Who
lesa
le a
ndre
tail
trade
Hot
els
and
rest
aura
nts
Rea
l est
ate,
rent
ing
and
busi
ness
activ
ities
Hea
lth a
ndso
cial
wor
k
Who
le E
cono
my
Managers and Senior Officials 6 2 2 4 2 3Professional 4 0 0 23 7 6Associate Professional and Technical 9 4 1 28 29 15Administrative and Secretarial 9 6 1 7 7 5Skilled Trades 40 28 25 12 3 18Personal Service 0 0 4 6 45 13Sales and Customer Service 4 45 2 4 0 12Process, Plant and Machine Operatives 27 9 1 6 1 9Elementary 2 6 65 9 5 18Total 870 1,960 2,850 1,850 1,580 13,240Source: Future Skills Wales 2005
Table 4.1

Quantifying the demand for unskilled labour in areas of low economic activity
51
4.2.2 Employer perceptions of their local labour market
Qualitative consultations with employers in areas of Wales covered by this research suggest thata large majority of employers have no difficulties in recruiting unskilled workers and there areno easily discernable differences by business type. Of those employers who do report problems,recruiting people for anti-social shift patterns appears to be the largest single issue.
Furthermore, a small number of these employers have experience of managing and recruitingstaff elsewhere in Wales and England, and who suggest that there is little difference betweentheir experiences currently and experiences in other locations.
That said, recruitment conditions in local labour markets do vary substantially. For example onerespondent feels that recent redundancies in the manufacturing sector at Bridgend would make itvery easy for the remaining local employers to fill any vacancies they might have. In addition,transport links make a major difference to the size of the area from which a business is able toattract (unskilled) workers.
Employers do not see a lack of suitable candidates as a problem, and potential barriers tooffering jobs to candidates such as a lack of skills, poor health, poor attitude, or childcareresponsibilities are seldom mentioned. However, our qualitative consultations with job brokersshow an unwillingness to put candidates with such issues forward for interview out of concernthat this will adversely affect their ability to place candidates with that employer in the future. Itis also the case that those with poor health or childcare responsibilities are unlikely to seekwork. Therefore, employers’ contacts with the inactive and unemployed are limited to thosewilling to rejoin the labour force; they have little or no contact with the hard to reach joblessand inactive.
4.2.3 Nature of employers’ labour demand
The majority of job brokers feel that employers have unrealistic expectations of the quality oflabour they could recruit at the wages (normally minimum wage) that they are prepared to offer.This feeling is particularly prevalent for staff that are tasked with moving the inactive and hard-to-employ into work rather than more experienced and more highly motivated clients.
However, there is an element of negotiation between employers and candidates or theirintermediaries, for some employers it is rational to start by demanding the best quality workerfor the lowest possible wage, and only reduce their requirements or raise the wage level if theycannot fill the vacancy. In this way a perception that employer standards are higher than theyactually are may be created.
There is a difference between employers having expectations that are beyond the majority ofcandidates, and expectations that are high per se. Conditions for recruitment of low-skilledworkers centre on reliability, punctuality, and having a good work ethic, and these are skills thatemployers take for granted. However, it is also the case that some of the inactive and long-termunemployed lack these soft skills.
Some job brokers feel that there is sufficient demand for the labour of those who are prepared towork. The evidence that substantial numbers of A8 migrants have found low-skilled work withlocal employers adds credence to the view that local labour demand is adequate for people whomeet required standards.

Quantifying the demand for unskilled labour in areas of low economic activity
52
4.3 CHARACTERISTICS OF THE CURRENT BALANCE OF DEMAND ANDSUPPLY
4.3.1 The impact of low wage levels
Low wages may deter some people of working age from entering the labour market. The effectis increased by the withdrawal of state benefits as wage income increases. Low wages may alsoaffect the demand for labour by making certain positions, such as those with anti-social shiftpatterns, hard-to-fill and contribute towards job turnover.
None of the employers contacted believe that low wages are a factor impinging on their abilityto recruit low-skilled members of staff. However, it is probable that self-selection is takingplace among candidates: those unwilling to work at the wage levels advertised would notcontact an employer.
A richer source of data comes from job brokers. The consensus of opinion seems to be thatpeople who want to work are prepared to do so for at, or near, the minimum wage, with theimportant exception of older people with familial responsibilities.31
However, the benefits trap is still very much in operation for some inactive people:
“Money alone is not enough to get our clients to work… (we) sell the idea ofemployment, the advantages of a marginal increase in income……..with norequirement to come and visit us every two weeks……. the social aspect of anew job and new friends.”
This comment is also revealing in that it illustrates that work has a role in people’s lives beyondthe exchange of labour for money.
It is probably true that higher wages would encourage more of the inactive to seek work.However, it is also true that the long-term benefit-dependent are, at least initially, the leastproductive workers, and for this reason they are the workers employers can least afford to paymore.
4.3.2 Worker transport issues
Transport issues are mostly a supply-side problem, and are not the focus of this research.However, without prompting in our consultations, employers almost universally mentionedtransport as a key factor in local labour demand and thus we consider this as part of ouranalysis. Some comments indicative of the difficulties also found by job brokers are reproducedoverleaf.
Willingness to travel
A key finding from qualitative consultations is that potential candidates for low-paid, low-skilled jobs are not prepared to travel far in order to work. For example, respondents in theValleys feel that this reluctance to commute formed part of a broader complex of work relatedattitudes. Respondents in areas outside the South Wales Valleys also remark upon the reluctanceof low-skilled jobseekers to travel far for minimum wage employment.
31 This insight is developed partly through experience of the New Deal programmes, which put staff incontact with those who have not hitherto been actively seeking work.
Quantifying the demand for unskilled labour in areas of low economic activity
53
“People expect work on their doorstep.”
“People do not expect to have to travel more than 30 minutes to work, at theoutside.”
“(In the absence of public transport) a two to three mile walk to work is notacceptable to our clients.”
It is worth noting that some workers will have justifiable reasons for not wishing to travel far towork. These include caring responsibilities, the cost of travel by public transport as a proportionof take-home pay (which can be substantial for lower-skilled workers), and the opportunity costof spending substantial amounts of time travelling. However, the general perception ofrespondents in our qualitative research in the Valleys is that a reluctance to travel is a seriousbarrier to finding work above and beyond the considerations listed above.
This unwillingness to travel has a significant impact on the effective demand for labour in anarea by excluding labour demand from employers beyond the distance low-skilled workers areprepared to travel. The geography and relatively under-developed transport links of the Valleysexacerbates the situation.
Travel times by car
To assess the impact of limited transport we use travel time maps32 that assume car ownership.Evidence related to the prevalence of private car use among the inactive is presented later in thereport. As the figures 4.1 to 4.5 demonstrate, a 30 minute driving time radius from the centre ofEbbw Vale or the centre of Merthyr Tydfil in peak traffic conditions excludes significantnumbers of nearby employers.
As figure 4.1 also shows, the centre of Merthyr Tydfil, despite being on one of the South WalesValleys major transport arteries, is not within 30 minutes peak driving time of substantialnumbers of businesses in Bargoed or parts of Pontypridd, let alone the massive concentration ofeconomic activity in Cardiff.33
32 Travel time maps are generated using Experian software that makes assumptions of average travelspeeds based on time of day and type of road used.33 2001 Census data, the latest source of data on migration issues, indicates that just 589 workerscommuted from Blaenau Gwent to Cardiff; from Merthyr Tydfil 1,829 did so. The likelihood is that mostworkers prepared to commute this far are in higher skilled and higher paid occupations.

Quantifying the demand for unskilled labour in areas of low economic activity
54
Figure 4.1: 30 minute peak hour drive-time radius from Merthyr Civic Centre
Figure 4.2 suggests that the situation in neighbouring Blaenau Gwent is similar, with the centreof Ebbw Vale isolated from the major centres of employment closer to Cardiff and the coast.
Figure 4.2: 30 minute peak hour drive time radius from Ebbw Vale Jobcentre

Quantifying the demand for unskilled labour in areas of low economic activity
55
However, the smaller villages in the Valleys suffer from even more acute economic isolation.Figures 4.3 and 4.4 show the limited employment opportunities available to a jobseekerprepared to drive for 30 minutes from the centre of Abertillery. This travel time map alsoillustrates the fact that transport links from North to South in the region are vastly superior toEast-West links. The consequence of this is that employers as nearby as New Tredegar andPontypool would not be considered practical employment propositions for many unskilledworkers in Abertillery.
Figure 4.3: 30 minute peak time drive time area from Abertillery Jobcentre
Figures 4.1, 4.2, and 4.3 are in contrast to the vastly superior transport links of Cardiff,Newport, Swansea and Bridgend shown in Figures 4.4 to 4.7. The greater distances that can betravelled by road from these four locations are largely due to the presence of the M4 motorway.
These four locations also benefit from a relatively dense network of rail links, giving commuterswithout cars more options. The fact that good transport links coexist with hotspots of inactivityin cities like Cardiff shows that while poor transport has a role to play in rates of inactivity it isneither a necessary nor a sufficient condition for high levels of inactivity.

Quantifying the demand for unskilled labour in areas of low economic activity
56
Figure 4.4: 30 min peak time area from central Cardiff34
Figure 4.5: 30 min peak time area from central Newport
34 Two separate travel zones appear on this map: this reflects the fact that the area around the motorwaycan only be accessed from motorway junctions which are spaced several miles apart. An area betweentwo motorway junctions can take longer to reach than the junction that is furthest from your startingpoint. This is because access requires you to reach the furthermost junction and then turn back in thedirection from which you have come, using minor roads.

Quantifying the demand for unskilled labour in areas of low economic activity
57
Figure 4.6: 30 min peak time area from central Bridgend35
Figure 4.7: 30 min peak time area from central Swansea
35 The non-contiguous appearance of the travel zones is a consequence of the configuration of motorwayaccess junctions. See footnote 34 for more details.

Quantifying the demand for unskilled labour in areas of low economic activity
58
Figure 4.8: 30 min peak time area from central Wrexham
Lack of private transport
Lack of private transport is a major issue for low skilled workers, particularly in the WelshValleys. The drive time maps represent a best-case scenario, but the actual ability andwillingness of low-skilled and unskilled workers is, on average, lower than these maps indicate.
“There are transport issues – lots of people don’t drive, public transport is notgood, buses stop too early, even taxis are hard to come by at night.”Hospitality employer, Merthyr
“The vast majority of our clients can’t drive; many have been disqualified fordriving without a license”Job broker
“(one of our clients) in Barry recently achieved an NVQ level 3 in woodworkbut simply can’t find work without a car”Job broker, Cardiff area

Quantifying the demand for unskilled labour in areas of low economic activity
59
Census data shows that typically around a third of the inactive (excluding students andthe retired) live in households with neither a car nor a van. The number of people who areactive in the labour market without access to private transport is much lower.
Car ownership- % population living in households with no car or van
Inactive (excluding students and the retired) ActiveCardiff 38 13Newport 37 12Blaenau Gwent 36 13Merthyr Tydfil 36 13Swansea 33 10Wrexham 30 9Bridgend 29 9Easington 37 15Calderdale 37 14High Peak 26 7Source: Census 2001
Table 4.2
For people without cars walking or public transport are the only alternatives. However, publictransport is an inadequate substitute for private car-ownership: this is a consistent themethroughout the qualitative consultations, both with employers and recruitment agencies.
“At this retail park we are not a bus route and this means that someapplicants turn down job offers.”Retailer, Cardiff
“Public transport is a major issue. Poor bus service. Individuals often have tohave own transport. Industrial parks in particular can be difficult to reach.”Job broker, Swansea
Rail routes are very limited as, for example, Ebbw Vale has no rail link to Cardiff.36 Buses arethe only public transport service for most people in the region, and they do not providecomprehensive coverage. A respondent from Ebbw Vale notes that:
“The Rassau Industrial Estate – one of the biggest estates in Europe and amajor employer in the local area, is not covered by a bus route”Job broker, Ebbw Vale
36 At the time of writing a commitment has been made to construct this link, although timescales are notconfirmed.

Quantifying the demand for unskilled labour in areas of low economic activity
60
For those who can access public transport the distance that can be covered by bus within a thirtyminute travel time is considerably less than that covered by car. For example a bus journey fromEbbw Vale to Pontypool in rush hour is timetabled to take thirty five minutes,37 not inclusive ofany travel to and from the bus route, yet Pontypool is within a 30 minute car journey of EbbwVale.
The inadequacies of public transport are particularly evident in the early morning and lateevening. For example, the direct Pontypool to Ebbw Vale bus route does not function in theearly morning, if it is necessary to start shift work in Pontypool at 8am the total journey timewould be in excess of ninety minutes.38 Meanwhile, should late night shift work, such as that inthe leisure or hospitality industry in Ebbw Vale, require a worker to begin his return journey toPontypool after 11pm then he/she would have no public transport options until 6.15am thefollowing morning.39
It is clear that a lack of willingness to travel, compounded by poor transport links, means thatunskilled workers and potential unskilled workers in the most inactive areas do not benefit fromemployment opportunities beyond their immediate locale.
Responses to transport issues
Generally speaking employers will not adjust their shift patterns to accommodate the limitationsof public transport. They have no incentive to do so, as there is no shortage of unskilled workersto fill their vacancies (section 4.2). A further problem is that with shifts starting at manydifferent times on a single industrial estate, early morning bus services can be uneconomical:this has proven to be the case on Bridgend Industrial Estate.
The Want2Work programme has an advisor’s discretionary fund (ADF) whereby grants of up to£100 can be made for activities that might help a client find work, such as paying for drivinglessons. Working Links in Merthyr Tydfil has also made efforts to address the transport issue byhelping its clients to pay for driving lessons, and on one occasion helping a client to purchase amoped.
There are some instances of larger employers providing subsidised transport for their workforce.One major electrical manufacturer in Bridgend arranges and heavily subsidises buses thatcollect workers as far as 40 miles away from the plant. There is also an example of anemployment agency arranging transport for its candidates to local factories, with the costdeducted from their wages. Some employers encourage car-share schemes though we alsoencountered an employer who discourages this on the grounds that if the driver is absent thecompany lost two to five workers for the day, rather than just one.
37 Estimates of bus journey times come from Traveline Cymru. Available online at: http://www.traveline-cymru.org.uk, last updated in 2006.38 Ibid.39 Ibid.

Quantifying the demand for unskilled labour in areas of low economic activity
61
4.4 MIGRANT WORKERS IN WALES
4.4.1 The supply of migrant workers
Of the employers contacted during the qualitative consultation, just under half have someexperience of hiring foreign-born workers. However, in each case the number of migrantsemployed as a proportion of the firm’s total headcount is very small. A wide range of countriesof origin are mentioned, including:
� Poland
� Portugal
� Slovakia
� Lithuania
� Czech Republic
� Hungary
� India
� Refugee groups (e.g. Kurds)
As the list shows, A8 countries dominate the nationalities working in the areas covered by ourconsultations. Of these nationalities Poles are clearly the most numerous, though it is clear thatPortuguese workers also comprise a significant amount of the migrant total.
Anecdotal evidence suggests that migrants from the A8 are more willing to travel from theiraccommodation to find work than domestic workers. One respondent mentioned that groups ofPolish workers would club together to hire and drive their own minibus in order to work. Inother cases where a recruitment agency sourced the workers from their home country they mayalso provide transport or nearby accommodation. Migrant workers are normally without caringresponsibilities, are not yet eligible for state benefits (apart from Work Tax Credit, and ChildTax Credit), and find the minimum wage highly remunerative by the standards of their homecountries; all these factors make them very likely to accept longer travel times than local people.
Application methods
Our consultations with employers and job brokers showed that migrants typically use the samechannels to find work as British born workers. Only one employer uses a specialist recruitmentagency to bring in workers from A8 countries. The other employers interviewed typicallyacquired their migrant workers through direct applications, local recruitment agencies, or word-of-mouth among the migrant workers themselves.
It would seem that local recruitment agencies have a significant role in placing migrant workersin work. One agency, based in a small Welsh town, accepted 200 migrant workers onto itsbooks in the period between the start of 2005 and summer 2006. Another reports being visitedby 15 migrant workers seeking to register every day. There is anecdotal evidence that privatesector agencies have responded to the new opportunities offered by A8 migrants by hiringrecruitment consultants with the relevant language expertise.
It is harder to gauge use of Jobcentre Plus facilities by migrant workers due to the way theyserve different groups of jobseekers. No A8 migrants are yet eligible for UK state benefits andtherefore they have very little in-depth contact with Jobcentre Plus advisors. However, they douse the self-service job searching facilities available at Jobcentres and use the information toapply directly to employers.

Quantifying the demand for unskilled labour in areas of low economic activity
62
Occupations
The businesses that appear most likely to use migrant labour are manufacturers and hotels.Migrant workers appear to work in the lowest skilled sectors as production line workers,cleaners, and unskilled care-workers. These positions are almost always temporary, at or closeto the minimum wage, and offer few opportunities for training or promotion. However, thesecharacteristics are a feature of employment in these positions for all workers, not just migrants.
There is no evidence of migrant workers from the A8 being used to fill local skill shortages inoccupations where a higher level of qualification is necessary. The only substantial communityof higher skilled workers mentioned in our qualitative research are Phillipino healthcareprofessionals working for NHS hospital trusts. However, this is a phenomenon that predates A8immigration.40
4.4.2 Employer attitudes toward migrant labour
The attitude of employers towards migrant labourers is very positive. A8 nationals areuniversally praised for their hard work and enthusiasm and this contrasts unfavourably with theattitude of UK nationals towards similar jobs. Consultations reveal no evidence of negativeperception of migrant workers, and the attitude of everyone consulted appears to be that themigrants are filling jobs that locals do not want, rather than out-competing locals in the labourmarket. Typical comments include:
“Employers actually specifically request migrant workers…(because they findthem) to be more reliable, willing to work longer hours and happier with justaccepting the minimum wage”Job broker
“(I have asked) current employees (who are migrant workers) to recommendfriends and family when available.”
Qualitative research does not find any evidence that language barriers are a majorproblem for using migrant workers. One large employer has signs in foreign languages aswell as English in its buildings, another says:
“(Our) migrant workers do have language problems but this does not impacttheir ability to do the job.”
40 Recent expansion in the number of UK-born nursing graduates suggests that the NHS will recruitsmaller numbers of nursing professionals from abroad in the foreseeable future.

Quantifying the demand for unskilled labour in areas of low economic activity
63
4.4.3 The impact of migrant workers on wages in Wales
At a national level, research indicates that there is no evidence that increased A8 migration hashad a negative impact on wage growth, compared with the period before 2004.41 Weencountered no anecdotal evidence to suggest that migrant workers are having a negative impacton wages. Furthermore, the minimum wage prevents wage competition in the lowest-paid jobs.Our conclusion is that the arrival of migrant workers in the areas of the study has not as yet hada negative impact on the wages available to unskilled workers, although they offer a viablealternative to the existing population.
“UK based workers are reluctant to work for min wage – benefits trap makeit not worth while. Foreign workers will.”Job broker, Swansea
4.5 TRAINING
There is a mismatch between the skills of some people seeking low-skilled jobs and therequirements that employers have for such roles. Jobs that do not require any formalqualifications still require what are termed soft skills and the Jobs Broker Database shows thatthe following are frequently required:
� motivation/self-motivation
� communication skills
� being a team player
� confidence
� customer service skills
� good presentation
� professional attitude (e.g. punctuality, meticulousness)
� organisational skills
It is clear that some unemployed and inactive people lack these skills, yet many employers viewthem as more important that job-specific skills, which they feel can be taught to a person withthe right attitudes and motivation.
4.5.1 What training do employers offer to low-skilled workers?
Overall, around one-third of the workforce in Wales received education or training in the threemonths preceding the survey. Notably, this proportion is greater in areas identified as higherskilled according to their occupational profile (section 1.4.1) – Cardiff, Swansea and Newport –while areas of lower skilled employment such as Blaenau Gwent and Merthyr Tydfil are lesslikely to receive training through work.
41 Source: Department of Work and Pensions, (2006), The impact of free movement of workers fromCentral and Eastern Europe on the UK labour market. Available online at:http://www.dwp.gov.uk/asd/asd5/wp29.pdf. NB: Any estimation of the impact of migrants on wagesinvolves the positing of an unknowable counterfactual (i.e. what would have happened if the migrantsnever arrived). However, nominal wage growth does not appear to have a correlation with increased A8immigration.

Quantifying the demand for unskilled labour in areas of low economic activity
64
The picture of training for the low skilled is consistent with national level evidence in section2.1, in that a lower proportion of workers employed in these occupations receive training,compared to the workforce average. The discrepancies between local areas also still exist forlow skilled workers.
Figure 4.9
As a general rule NVQ related training is provided under contract to an employer, normally by aprivately owned training provider, while employers provide all other types of training internally.
Training by sector
Qualitative consultations suggest that the quality and quantity of training employers offer totheir workers varies considerably by sector. Hotels appear to be the employers most likely tooffer training options that could allow staff to move into higher-paid and more responsible roles.In some cases training up to NVQ level 3 is available in areas such as customer service. Someretailers in the qualitative consultations also offer routes towards promotion through training. Alocal private training provider, rather than further education institution, typically providesNVQs.
Some call-centres are remarked upon for offering exceptionally thorough induction courses,some as long as four weeks. This reflects the fact that customer service call-centres can be themost prominent customer-facing units of large and well resourced companies such as mobiletelephone operators. In contrast, manufacturing employers offer very little training. Employersnormally offer health and safety training, and basic induction courses (where relevant this mightinclude basic food hygiene). In a minority of cases recruitment agencies might undertake to giveworkers basic training before supplying them to customers.
In the Jobs Broker Database of vacancies, that contains a high proportion of administrative andsales jobs, less than one in ten advertisements mention the prospect of career advancement orupskilling for the successful candidate.

Quantifying the demand for unskilled labour in areas of low economic activity
65
Modern apprenticeships
Employers seldom offer modern apprenticeships. When they do, competition is intense and theyare filled by better qualified candidates. In other words, the modern apprenticeship system helpspeople with a degree of motivation, confidence and formal education not possessed by thosewith the very lowest employment prospects. Apprenticeships are not a viable option for thelowest skilled workers who are the focus of this report.
Training in temporary jobs
A key issue is the relationship between temporary work and training. The lowest paid workersare typically hired on a temporary basis; this allows employers to rapidly adjust output todemand, but also results in a higher level of labour turnover. Rapid labour turnover makesemployers unwilling to engage in training beyond what is required by law.
4.5.2 Limitations of training
Training has a role to play in improving the productivity of the low-skilled workforce.However, it is not a panacea for the problems of areas of inactivity. For training to have abeneficial effect on output and productivity there needs to be a demand for the skills of trainedworkers and the opportunity for movement into more demanding and rewarding positions.Whether this demand exists, especially in inactive and isolated communities is a moot point,and beyond the scope of this report.
The second major limitation of training is the attitude and aptitude of the lowest skilledmembers of the workforce at acquiring qualifications. Low skilled workers are likely to haveachieved poorly at school, and evidence suggests this will discourage them from further study.In some cases a failure to achieve functional literacy before leaving school can offer significantbarriers to participating in training and assessment processes.
Some recruitment consultants believe that offering training when seeking to fill a roleencourages applicants. However, there is no consensus of opinion that this is the case. Indeed,some employers, particularly in the restaurant and hotel trade, feel that the staff are notinterested in gaining further qualifications.
“…the reception (to employers training provision) hasn’t been great, no staffmembers want to study for NVQs – they prefer to do their job and go home.”Employer
“We used the local college to provide NVQs in Customer Service at level 2 forcustomer facing staff, and offered the opportunity to cleaners (in relevantsubjects) but we had little staff interest.”Employer
It is also possible to question whether the soft skills required by employers can be taught in atraining course, or whether they come through accumulated experience of life and work.However, the pre-employment course offered by the Prince Charles Hospital in Merthyr Tydfilsuggests that well-designed courses and support networks can have a role to play.

Quantifying the demand for unskilled labour in areas of low economic activity
66
5 Conclusion and policy implications
5.1 CONCLUSION
Wages for unskilled work are low and work is frequently repetitive with very limitedopportunities for upskilling and advancement. Yet evidence from employers clearly indicatesthat they have no problems filling unskilled, low wage vacancies, with many reporting anexcess of candidates for such roles. At the same time, the impression given by our qualitativeconsultations is that people who are prepared to work hard do not have serious difficulty findinga job. This view is supported by the presence of A8 migrants in the area.
Our conclusion is that the labour market is functioning well, insofar as there are low skill jobsavailable in reasonable numbers in all the local areas, and those who seek work of this type aregenerally able to find it. Of course, low skilled positions are not well paid, and do notnecessarily offer the level of security important to those moving from inactivity to employment.This is primarily driven by factors beyond the local labour market, such as globalisation andtechnological change, and the demand for a flexible workforce offering the greatest levels ofvalue added (difference between wages and the value of output produced).
Barriers to employment are low on the demand side, though they do serve to exclude somemembers of the community. However, these general truths are often belied at the local level bythe fragmentation of the local labour market, caused by a combination of geography, poortransport links in some areas and an unwillingness of workers to travel.
To summarise, the key findings of the study are:
� Demand for low skilled labour is adequate: Evidence suggests that the demand bylocal firms for labour is sufficient for candidates with no qualifications, but individualsmust possess an adequate work ethic to find a position. This remains the case even afterthe A8 accession.
� Unskilled labour is not only required in declining sectors: Unemployment andinactivity may be partly a legacy of previous economic disruption and the closure ofheavy industry. However, while industrial lay offs continue to this day there is sufficienteconomic activity to create new unskilled jobs. However, support is needed for workersto make the transition from manufacturing to service sector opportunities that arefundamentally very different whilst still being low skilled (for example, the emphasis onsofter skills like communication and personal presentation as well as the prevalence ofpart-time roles).
� Application processes do not prevent the unskilled from finding jobs: Job brokersundertake much of the application process for potential workers. Barriers to applying fora job, even for people with severe literacy problems, are low.
� Employers have very low requirements for unskilled workers: Employers require softskills; a requirement for any kind of formal qualification is very rare. Some of the long-term unemployed lack these skills but the most important requirement is a willingness towork hard. Unskilled labour is a broad term that includes both productive hard-workingindividuals and individuals with severe problems adjusting to a work environment.
� Transport problems can be significant to some, especially in the Valleys: Supply-sideissues, such as the lack of access to private transport, severely limit the number of

Quantifying the demand for unskilled labour in areas of low economic activity
67
workers employers have access to. The problem is made considerably worse by a lack ofwillingness to travel among low-skilled workers.
� The quality of low skilled jobs is very low: The jobs available to those with low skillsare overwhelmingly low paid, insecure, and offer very little opportunity of progressionwithin the company to better-paid, more secure work (although some opportunity doesexist).
� Little spatial variations in the demand for unskilled labour: There is demand forunskilled labour evident in all local authorities, but the growth of the local economy (anddiffering economic activity rates) is partly dependent on the ability to move towardsservice-orientated low skilled roles.
5.2 POLICY IMPLICATIONS
� Existing government activity to help people into employment is extensive and wellplanned: Substantial, and effective, government activity to help people find work isongoing. The Jobcentre Plus network is focussed on finding employment for those whohave previously found it hard to access the labour market. A substantial amount ofsupport is available to jobseekers and pro-active approaches to find potential employersare made. The Working Links organisation offers even more intensive support.
� Linking supply and demand: By linking trainer and employer through training coursesand guaranteed job interviews there is a lower probability of the candidate completing thecourse but failing to find a job afterwards. There may be a role for similar programmeswith other employers, although the model is less likely to appeal to private sectoremployers who would be unwilling to expend resources on such a programme when theyare not facing shortages of unskilled labour.
� A culture of benefit dependency and worklessness: If there is a culture of benefitdependency and worklessness, as there appears to be in some areas studied, demand forunskilled labour is simply not a determinant of unemployment for some parts of theworking age population. Only measures that make people want to work more will beeffective, delivered at an early age through the school and careers system.
� Migration supplements rather than supplants: Our qualitative research in Walessuggests that local people have not suffered from the arrival of A8 workers, but that thepositive experience of working with migrant workers may encourage employers in thefuture to focus on this source of labour.
� More research is required at a local level: While this research focused on local areas inWales to understand the demand for unskilled labour, the primary consultation wasrelatively constrained in terms of scale. Further on the ground evidence should begathered before policy decisions are implemented.

Appendix A
Employer Questionnaire

INTERVIEWEE DETAILS:
Name:
Job Title:
Organisation:
Industry sector:
Location:
WORKFORCE CHARACTERISTICS:
1. Do you offer employment opportunities for individuals with no qualifications?
2. Which types of role/occupations could these individuals fill?
3. Approximately what proportion of your total workforce is employed within theseoccupations?
RECRUITMENT PATTERNS AND EMPLOYER PERCEPTIONS
4. Have you recruited for these less skilled positions in the past 12 months? On how manyoccasions?
5. What methods have you used to advertise or recruit for these posts?
� JCP?� Recruitment agencies?� Newspapers?� Shop windows?� Website?� Informal channels- e.g. word-of-mouth?
6. What means do you ask applicants use to apply for these positions?
� CV?� Application form?� Open recruitment event?� Telephone contact?
What happens next? Interview / written exam / other? Are basic skills tested eitherdirectly or indirectly?

7. What attributes do you look for in candidates looking to fill these roles?
� Past Experience?� Qualifications?� Confidence?� Enthusiasm?� Welsh language skills?� Communication skills?� Customer handling?� Team working?� Other ‘soft skills’?
8. Do you actively target any particular individuals for these roles?
9. Do you have any concerns associated with recruiting those who have been outside ofthe workforce for a period of time (e.g. through unemployment, health problems,family/childcare responsibilities)?
10. Do these concerns deter you from recruiting such individuals?
RECRUITMENT DIFFICULTIES
11. Did you find any of the vacancies you had for less skilled positions hard to fill?
� Yes- what proportion were hard to fill.� No- were they oversubscribed, and by how much?
12. Has the problem of hard to fill vacancies has got better or worse over time?
13. Does rapid turnover of staff prove problematic? Has this got better or worse?
14. What measures, if any, have you used to address the problem?

15. To what reasons do you attribute recruitment difficulties? [Do not prompt]
� Lack of basic skills? Lack of other skills or experience? Lack of confidence?� Attitude of candidates?� Lack of appropriate equipment/clothing?� Poor health or disability?� Lack of applicants generally� Too much competition from other employers?� Poor terms and conditions?� Poor career progression/lack of prospects?� Poor public transport?� Lack of childcare locally?
16. (If appropriate) do you have experience recruiting for similar positions elsewhere in theUK?
� Yes- have you found similar problems in other locations? If so, where? Are they more/ less severe here than elsewhere?
.
� No- do you consider these problems to be unique to the local area or would you `expect to face similar problems if recruiting for these roles elsewhere?
17. What measures have you put in place to overcome these recruitment problems?
18. Which measures have you found to be most successful?
MIGRANT WORKERS
19. Have you recruited migrant workers to fill these positions in the past?
20. Approximately, how many migrant workers are employed in less skilled positionswithin your organisation?
21. From which countries are these migrant workers originally from?
22. How do have you recruited them?
� Actively seek or just receive applications from migrant workers?� Using specialist agencies?
23. Is there any particular reason why you recruit migrant workers?� Unable to recruit from local labour market� Better skilled, more reliable, lower wages, etc

WORK ISSUES
24. Do any of your existing workforce, employed in less skilled occupations, experienceproblems that impact their ability to fulfil their role?
25. What types of problems?
� Lack of basic skills?� Language difficulties?� Health problems?� Difficulty adjusting to working life?� Childcare arrangements?� Transport issues?� Other…
26. What measures have you put in place to overcome these problems?� Subsidised childcare, transport?� Training provision?� Mentoring?� Flexible working?� Job Share?� Paid time off for illness?� Unpaid leave/career break?� Other….
27. Which measures have you found to be most successful?
28. Do you use outside agencies to support your workers address these issues?
� Local colleges?� Learndirect?� Local childcare or transport providers?
THANKS AND CLOSE
29. Would you be willing to have your organisation’s name passed onto the NationalAssembly for Wales as having participated in this research?
� Yes� No
30. Would you be willing to have your company name passed onto the National Assemblyfor Wales in connection with your comments?
� Yes� No

Appendix B
Questionnaire for recruitment agencies andjobcentres

INTERVIEWEE DETAILS:
Name:
Job Title:
Organisation:
Location:
DEMAND FOR UNSKILLED WORKERS:
1. Approximately how many vacancies do you have per month that are suitable forindividuals with few (below level 2) or no qualifications? What proportion of allvacancies do these positions comprise?
2. Where relevant- would all positions for unskilled workers be added to your database ofjobs or be presented on your website?
2. Which type of roles/occupations are these for?
3. Which sectors are these vacancies typically within (e.g. retail, hospitality,manufacturing)?
3. How has the sectoral profile of vacancies changed in recent years and how do youanticipate it will change in the future?
� Increasing service sector jobs?� Upskilling of manufacturing jobs as labour intensive processes are moved
overseas?
4. How is the changing business base impacting the availability of jobs for those with noformal qualifications?
4. Are there any areas within the locality where these vacancies are concentrated?
EMPLOYMENT ARRANGEMENTS
5. How do employers typically ask candidates to apply?
� CV?� Application form?� Open recruitment event?� Telephone contact?

6. What attributes do employers look for in candidates looking to fill these roles?
� Past Experience?� Qualifications?� Confidence?� Enthusiasm?� Welsh language skills?� Communication skills?� Customer handling?� Team working?
7. What wage rates (per hour, week or annum) are typically attached to such roles?
8. What working arrangements are usually attached to these roles (e.g. flexible working,shift work, overtime payments etc)?
9. Do these roles typically offer an opportunity for future career progression andadvancement?
TRAINING PROVISION AND ADDITIONAL EMPLOYEE SUPPORT
10. From you experience do employers often provide training as a means of developing thosethey recruit for these types of positions?
11. If yes, what type of training?
� Induction training?� Health and safety?� IT training?� Job specific?
12. Do employers typically offer the opportunity to obtain accredited qualifications (e.g.Modern Apprenticeships or NVQs)?
13. Do employers make use of external training providers (e.g. FE colleges or Learndirect)to deliver this training? Which providers in particular?
14. Do employers typically offer any assistance to these types of workers in the form ofchildcare or transport provision?

15. Do they offer opportunities that lone parents or disabled individuals would be able toaccess?
DEMAND/SUPPLY MISMATCH AND EMPLOYER PERCEPTIONS
15. How does the demand for unskilled labour compare to the supply of these workers? Arepositions requiring few or no skills difficult to fill or would you consider there to bemore people looking for these roles than positions available?
16. If relevant, what do you think causes this mismatch?
Demand side factors
� Unrealistic expectations/ employer perceptions?� Poor terms and conditions?� Poor career progression/lack of prospects?� Inflexibility in working practices?
Supply side factors
� Unrealistic wage expectations among jobseekers?� Lack of affordable public transport?� Lack of affordable childcare locally?� Lack of skills, experience or qualifications?
17. Do you find employers are reluctant to recruit individuals who have been outside of theworkforce for a period of time (through unemployment, health problems, looking afterfamily etc.) for low skilled positions?
18. Do you find employers often use migrant workers to address any shortages in suitablelow skilled local labour?
19. From which countries are these migrant workers originally from?
THANKS AND CLOSE
20. Would you be willing to have your organisation’s name passed onto the NationalAssembly for Wales as having participated in this research?
� Yes� No
21. Would you be willing to have your company name passed onto the National Assemblyfor Wales in connection with your comments?
� Yes� No

Appendix C
Database details

Details recorded in the JCP database:1. Job title2. Job category (e.g. sales/catering)3. Wage or salary4. The amount of experience required5. Whether the job was permanent or temporary6. Method of application required7. Whether job was permanent or temporary8. Hours of work
Websites searched
The following websites were searched as they included vacancies placed by a wide range ofrecruitment agencies:
1. Blue Arrow2. Fish4jobs3. Hotrecruit4. Jobsearch5. JobsWales6. Reed7. Retail Choice8. This is South Wales9. Totaljobs10. Welsh Jobs
Criteria for inclusion in the databases
1. The post advertised was within the project’s geographical coverage;2. The post fell within the following economic activities:
� Catering� Customer service and call centres� Distribution and warehousing� Domestic service� Hospitality, travel and leisure� Manufacturing� Public sector and charity� Regional assembly bodies� Retail� Sales� Secretarial and administrative
Details of vacancies recorded in the database
1. The website advertised on2. The recruitment agency placed the advert3. Date advertisement was put online4. Role/Job Title5. Job category (e.g. sales/catering)6. Location7. Wage or salary8. Additional financial benefits9. Non financial benefits10. Whether career progression opportunities were mentioned

11. Type/level of qualifications required12. Skills required13. Method of application required14. Mention of EOC employer/attracting under-represented groups?15. Whether job was permanent or temporary16. Whether job was full or part time17. Hours of work (where specified)18. Specialist working arrangements (e.g. shift work, or flexitime)19. Whether Welsh language skills are required

Appendix D
Labour market supply and demand

Employmentopportunities
Industrialstructure
Occupational mix
Economicperformance
Replacementdemand
Expansiondemand
Recruitment market
Skills/Qualifications/
AttitudeEmployed
Vacancies
Inactive
Unemployed
Social security
Wages Jobs brokers Geography of opportunity
Figure 1: Relationship between labour market supply and demand
The areas in dark blue focus on the demand for labour whilst the light blue areas highlight thesupply of labour.