Embed Size (px)
Citation preview

Quantifying the Digital Divide:
Latin America, S. Asia, AfricaPrepared by: Les CottrellSLAC,
Shahryar KhanNIIT/SLAC, Jared GreenoSLAC
ICFA Workshop on Digital Divide Issues for Global e-Science, Mexico City Oct 24-27, 2007
www.slac.stanford.edu/grp/scs/net/talk07/icfa-mexico07.ppt
Summary• Methodology of measuring Internet performance
• Overall Internet performance of the world today
• Performance trends
• Routing
• Relationship of Internet performance to countries’ development
• Examples of problems of poor performance
• Conclusions & further information

Methodology• Use PingER:
– Arguably the world’s most extensive Active E2E Internet Monitoring project

PingER Methodology
Internet
10 ping request packets each 30 mins
RemoteHost(typicallya server)
Monitoring host
>ping remhost
Ping response packets
Measure Round Trip Time & Loss
Data Repository @ SLAC
On
ce a Day
Uses ubiquitous ping
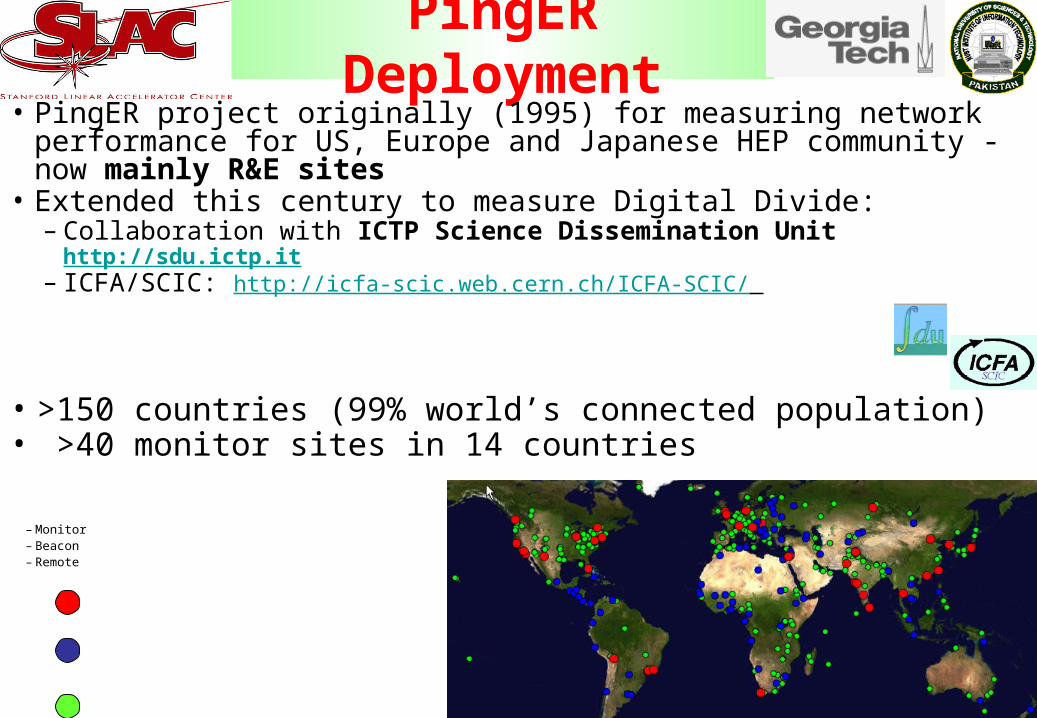
PingER Deployment• PingER project originally (1995) for measuring network
performance for US, Europe and Japanese HEP community - now mainly R&E sites
• Extended this century to measure Digital Divide:– Collaboration with ICTP Science Dissemination Unit http://sdu.ictp.it – ICFA/SCIC: http://icfa-scic.web.cern.ch/ICFA-SCIC/
– Monitor– Beacon– Remote
• >150 countries (99% world’s connected population)• >40 monitor sites in 14 countries

World Status
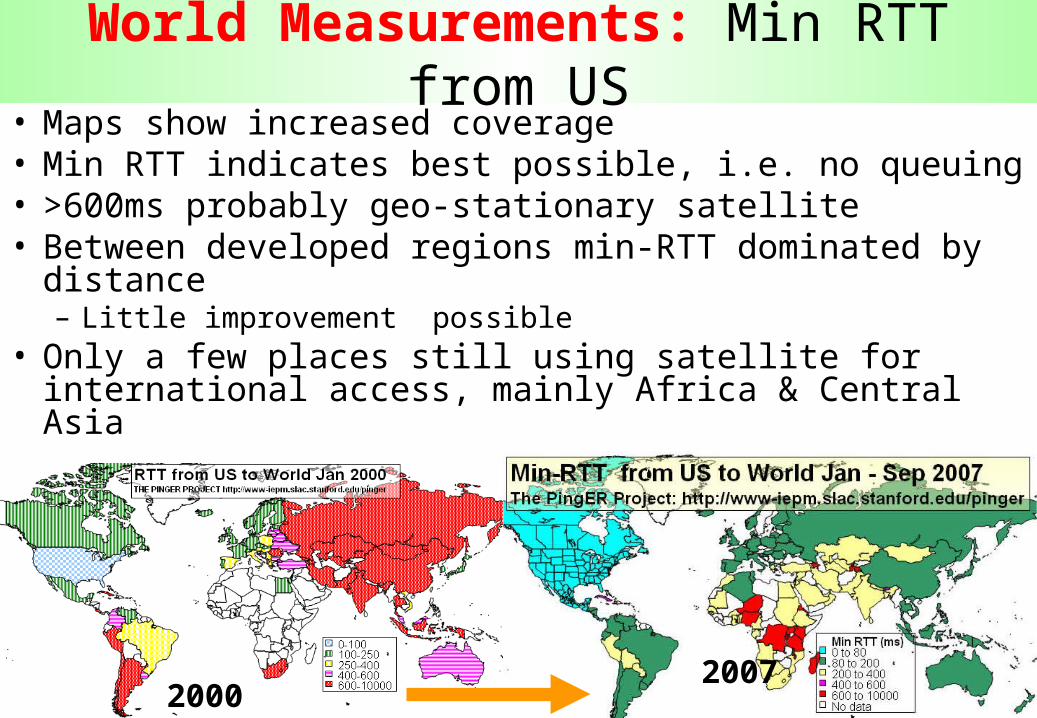
World Measurements: Min RTT from US• Maps show increased coverage • Min RTT indicates best possible, i.e. no queuing• >600ms probably geo-stationary satellite• Between developed regions min-RTT dominated by
distance– Little improvement possible
• Only a few places still using satellite for international access, mainly Africa & Central Asia
2000 20062007
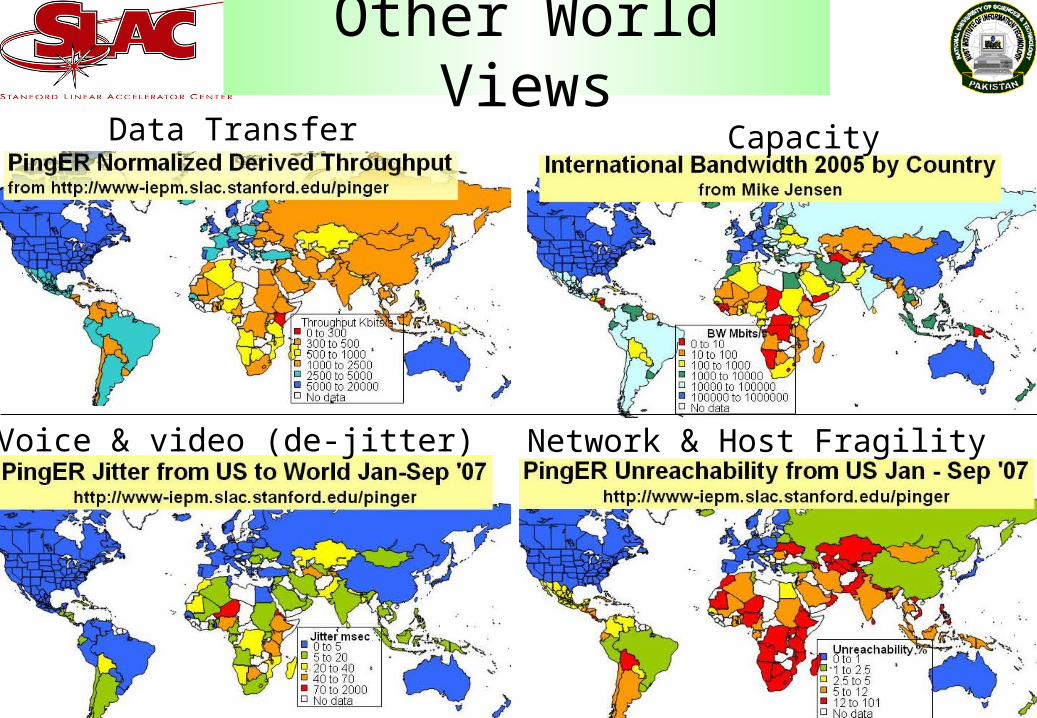
Other World Views
Voice & video (de-jitter) Network & Host Fragility
Data Transfer Capacity

Thru vs BW• Hard to get to
countries low (E. Africa, C Asia)
• Last mile not good (China
• ’07 vs ’05 (Aus & NZ)
• Emphasize Internet deploy(Estonia)
• Poor host choice (Congo, Libya)
Last decade Trends
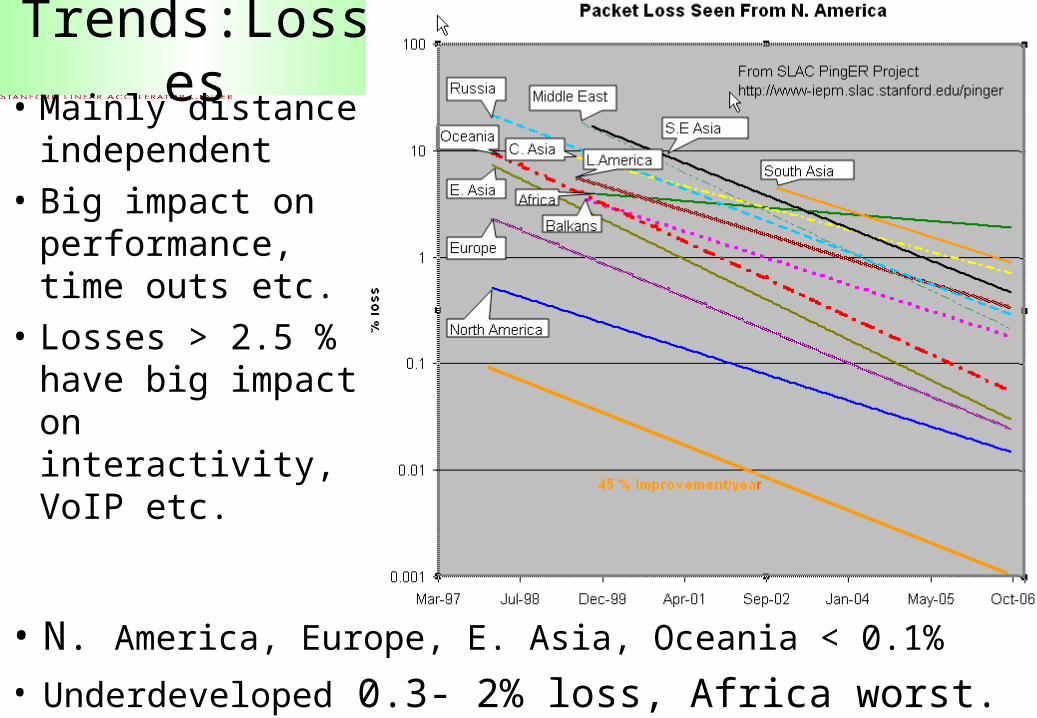
Trends:Losses
• N. America, Europe, E. Asia, Oceania < 0.1%
• Underdeveloped 0.3- 2% loss, Africa worst.
• Mainly distance independent
• Big impact on performance, time outs etc.
• Losses > 2.5 % have big impact on interactivity, VoIP etc.

Unreachability • All pings of a set fail ≡ unreachable
• Shows fragility, ~ distance independent
• Developed regions US, Canada, Europe, Oceania, E Asia lead– Factor of 10 improvement in 8 years
• Africa, S. Asia followed by M East & L. America worst off
• Africa NOT improving
US & CanadaEurope
E Asia
C Asia
SE Europe
SE Asia
S AsiaOceania
Africa
L America M East
Russia
DevelopedRegions
DevelopingRegions

• ~ Distance independent• Calculated as Inter Packet Delay Variation (IPDV)
– IPDV = Dri = Ri – Ri-1
• Measures congestion• Little impact on web, email• Decides length of VoIP codec buffers, impacts streaming• Impacts (with RTT and loss) the quality of VoIP
Trendlines for IPDV from SLAC to World Regions
N. America E. Asia
Europe
Australasia
S. Asia Africa
Russia
L. America SE Asia
C Asia
M East
Usual division into Developed vs Developing
Jitter

VoIP & MOS• Telecom uses Mean Opinion Score (MOS) for quality
– 1=bad, 2=poor, 3=fair, 4=good, 5=excellent– With VoIP codecs best can get is 4.2 to 4.4– Typical usable range 3.5 to 4.2– Calc. MOS from PingER: RTT, Loss, Jitter (www.nessoft.com/kb/50)
MOS of Various Regions from SLACImprovements very clear, often due to move from satellite to land line.Similar results from CERN (less coverage)
Usab
le
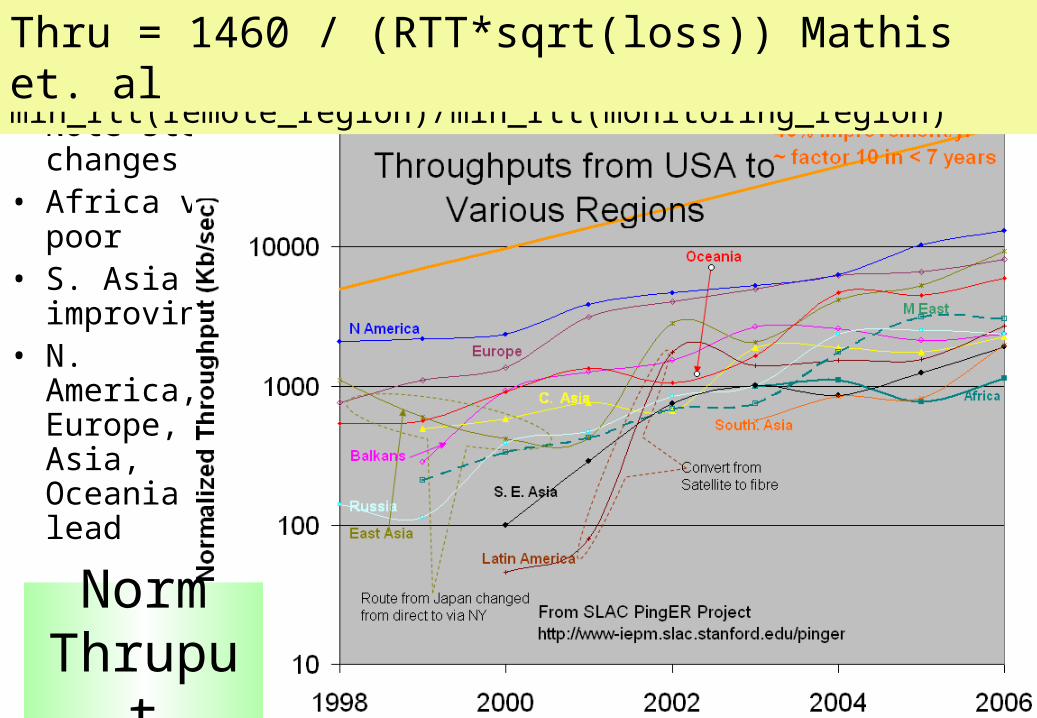
• Note step changes
• Africa v. poor
• S. Asia improving
• N. America, Europe, E Asia, Oceania lead
Norm_thru = thru * min_rtt(remote_region)/min_rtt(monitoring_region)Thru = 1460 / (RTT*sqrt(loss)) Mathis et. al
Norm Thruput

Routing between Countries
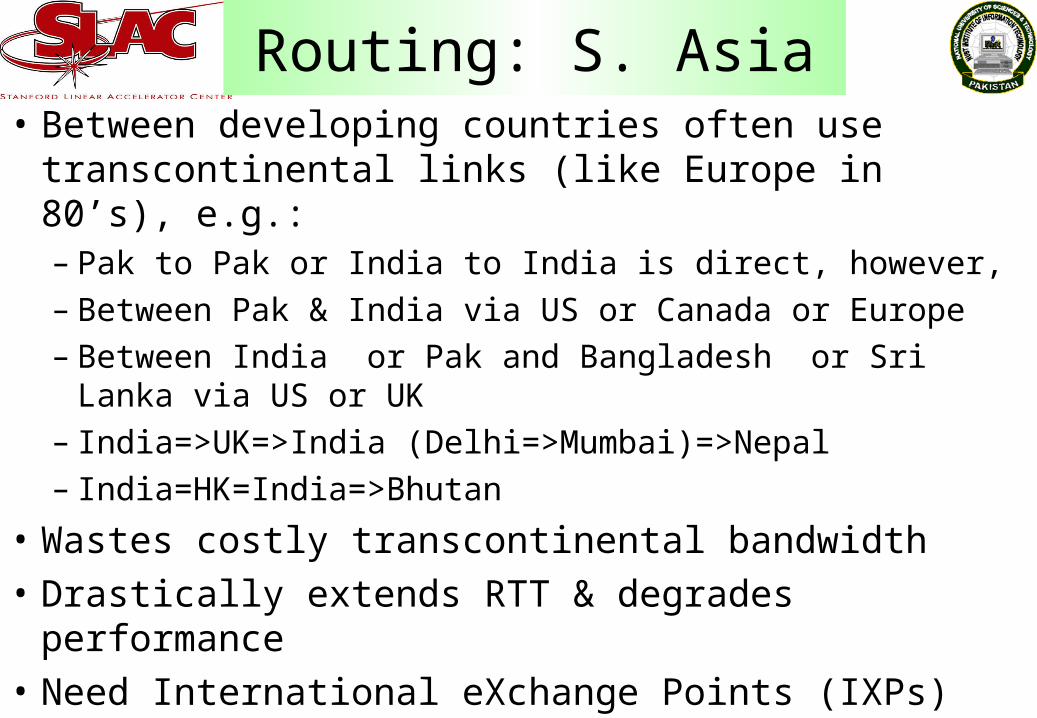
Routing: S. Asia• Between developing countries often use
transcontinental links (like Europe in 80’s), e.g.:– Pak to Pak or India to India is direct, however,– Between Pak & India via US or Canada or Europe– Between India or Pak and Bangladesh or Sri Lanka via
US or UK– India=>UK=>India (Delhi=>Mumbai)=>Nepal– India=HK=India=>Bhutan
• Wastes costly transcontinental bandwidth
• Drastically extends RTT & degrades performance
• Need International eXchange Points (IXPs)
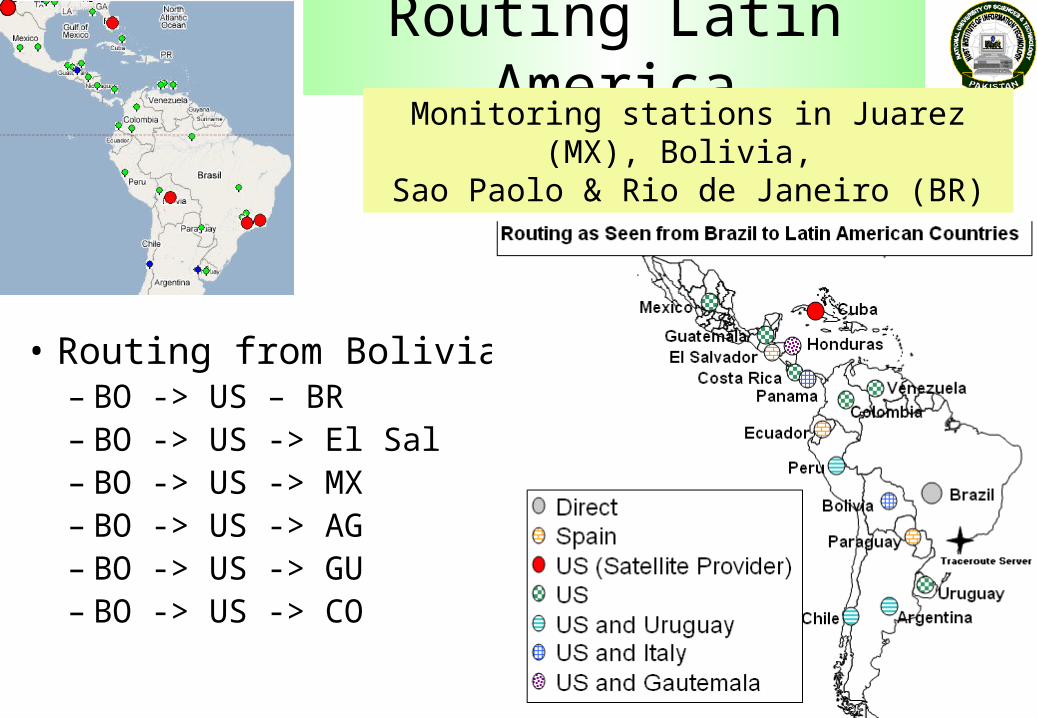
Routing Latin America
• Routing from Bolivia– BO -> US – BR– BO -> US -> El Sal– BO -> US -> MX– BO -> US -> AG– BO -> US -> GU– BO -> US -> CO
Monitoring stations in Juarez (MX), Bolivia, Sao Paolo & Rio de Janeiro (BR)
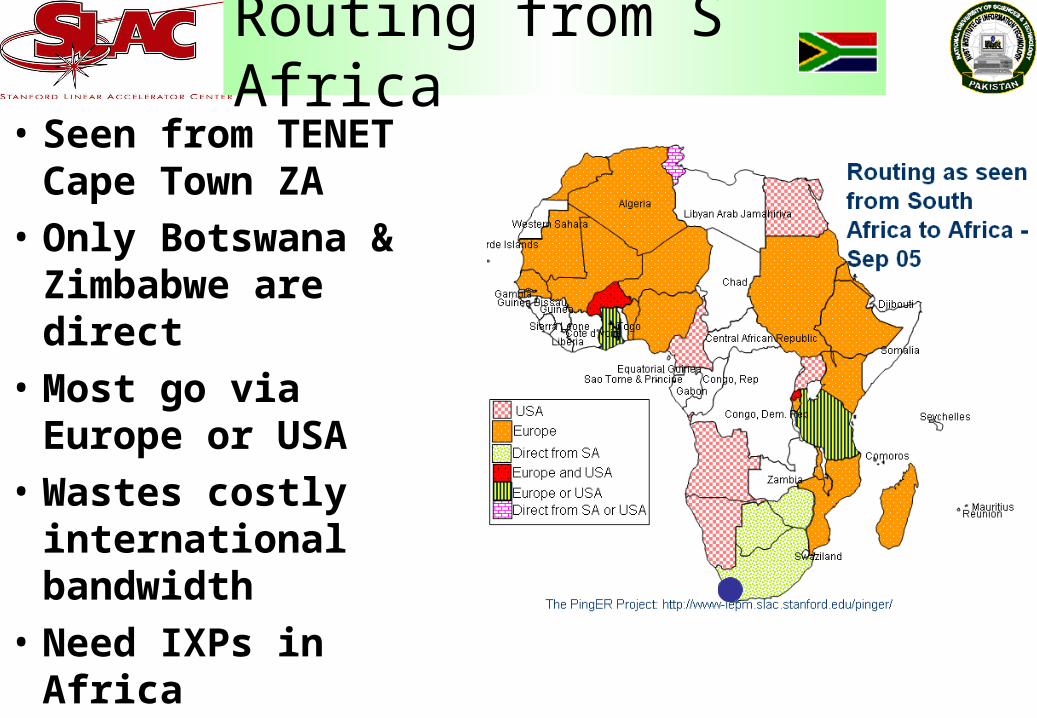
Routing from S Africa• Seen from TENET
Cape Town ZA
• Only Botswana & Zimbabwe are direct
• Most go via Europe or USA
• Wastes costly international bandwidth
• Need IXPs in Africa
Development Classification• Many indices from ITU, UNDP, CIA, World Bank try to classify
countries by their development– Difficult: what can be measured, how useful is it, how well defined, how
changes with time, does it change country to country, cost of measuring, takes time to gather & often out of date, subjective
– Typically use GDP, life expectancy, literacy, education, phone lines, Internet penetration etc.
– E.g. HDI, DOI, DAI, NRI, TAI, OI .. In general agree with one another (R2~0.8)
• Given importance of Internet in enabling development in the Information age:– International bandwidth– Number of hosts, ASNs– PingER Internet performance
• See if agree with development indices.– If not may point to bad PingER data or illuminate reasons for differences– If agree quicker, cheaper to get, continuous, not as subjective

Med. & Africa vs HDI• N. Africa has 10 times poorer performance than Europe• Croatia has 13 times better performance than Albania• Israel has 8 times better performance than rest of M East
Med. Countries• E. Africa poor,
limited by satellite access
• W. Africa big differences, some (Senegal) can afford SAT3 fibre others use satellite
• Great diversity between & within regions
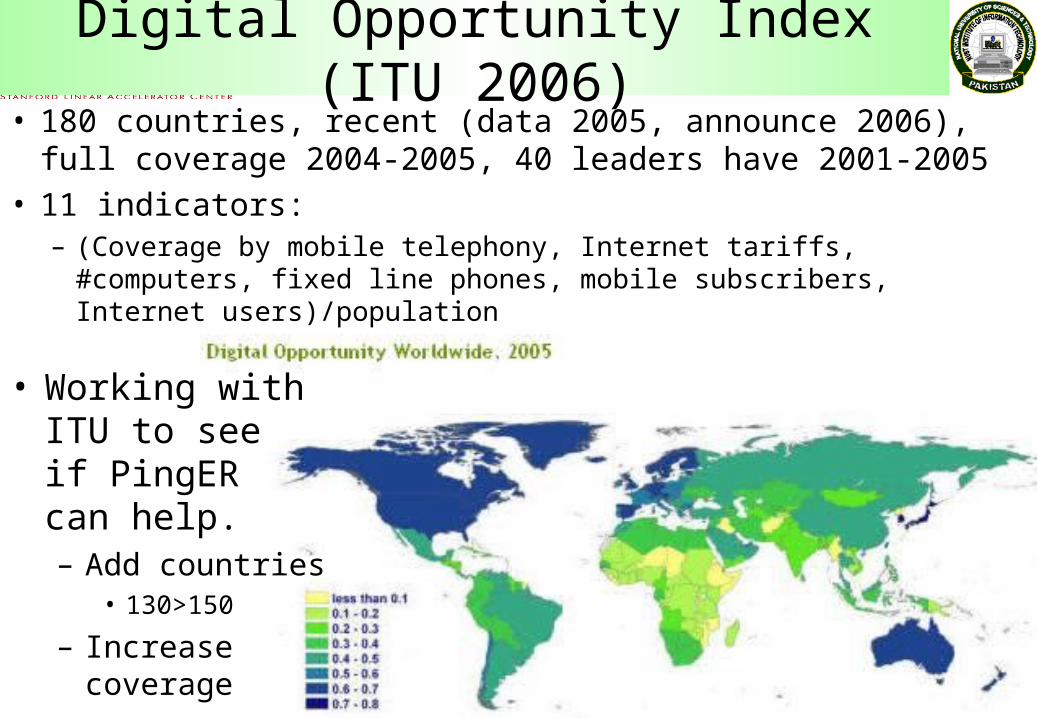
Digital Opportunity Index (ITU 2006)• 180 countries, recent (data 2005, announce 2006), full
coverage 2004-2005, 40 leaders have 2001-2005• 11 indicators:
– (Coverage by mobile telephony, Internet tariffs, #computers, fixed line phones, mobile subscribers, Internet users)/population
• Working with ITU to see if PingER can help.– Add countries
• 130>150
– Increase coverage

Correlation Loss vs DOI
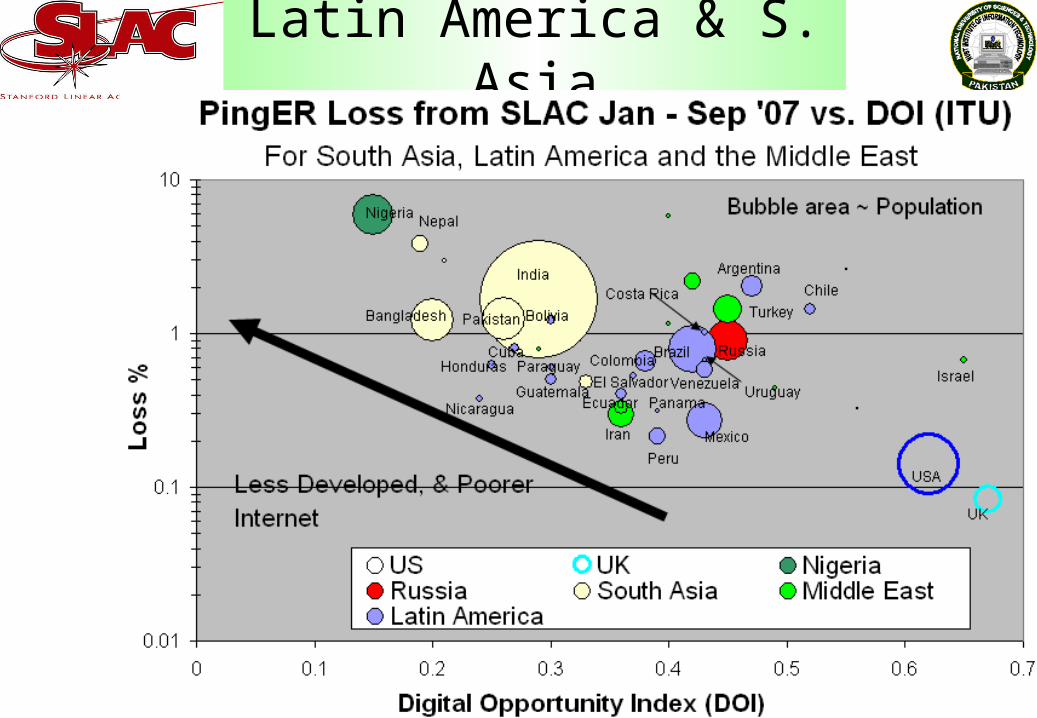
Latin America & S. Asia

World thruput vs ITU-OI Behind Europe6 Yrs: Russia, Latin America 7 Yrs: Mid-East, SE Asia10 Yrs: South Asia11 Yrs: Cent. Asia12 Yrs: Africa
South Asia, Central Asia, and
Africa are in Danger of Falling
Even Farther Behind

Scenario Cases
4. Sep 05, international fibre to Pakistan fails for 12 days, satellite backup can only handle 25% traffic, call centres given priority. Research & Education sites cut off from Internet for 12 days
Heloise Emdon, Acacia Southern
AfricaUNDP Global Meeting for ICT for
Development, Ottawa 10-13 July
3. Primary health care giver, somewhere in Africa, with sonar machine, digital camera and arrangement with national academic hospital and/or international health institute to assist in diagnostics. After 10 dial-up attempts, she abandons attempts to connect
1. School in a secondary town in an East Coast country with networked computer lab spends 2/3rds of its annual budget to pay for the dial-up connection.– Disconnects
2. Telecentre in a country with fairly good connectivity has no connectivity– The telecentre resorts to generating revenue from photocopies,
PC training, CD Roms for content.

Conclusions• Poor performance affects data transfer, multi-media, VoIP, IT development & country performance / development
• DD exists between regions, within regions, within countries, between age groups…– E.g S Asia divides into two
• Decreasing use of satellites, expensive, but still needed for many remote countries in Africa and C. Asia
• Last mile problems, and network fragility• International Exchange Points (IXPs) needed• Internet performance (non subjective, relatively
easy/quick to measure) correlate strongly with economic/technical/development indices– Increase coverage of monitoring to understand Internet performance

More Information• Thanks:
– Incentive: ICFA/SCIC, ITU – Funding: SLAC/HEP, Pakistan HEC– Effort: ICTP (Trieste), FNAL, Georgia Tech, administrators at over
40 monitoring sites
• ITU/WIS Report 2006 & 2007 – www.itu.int/osg/spu/publications/worldinformationsociety/2006/report.html
• PingER– www-iepm.slac.stanford.edu/pinger, sdu.ictp.it/pinger/africa.html
• Case Studies (in progress):– confluence.slac.stanford.edu/display/IEPM/South+Asia+Case+Study– confluence.slac.stanford.edu/display/IEPM/Latin+America+Case+Study– confluence.slac.stanford.edu/display/IEPM/Sub-Sahara+Case+Study– confluence.slac.stanford.edu/display/IEPM/Palestine+Case+Study
• DOI & ITU-OI Development Indices– Google: “WSIS Report 2007”

Extra Slides

Bandwidth & Internet use• Note Log scale for BW• India region leader• Pakistan leads bw/pop• Nepal very poor
• Pakistan leads % users• Sri Lanka leads hosts%
%• Pakistan leads bw/pop• Nepal, Bangladesh,
Afghanistan very poor
Bit
/s
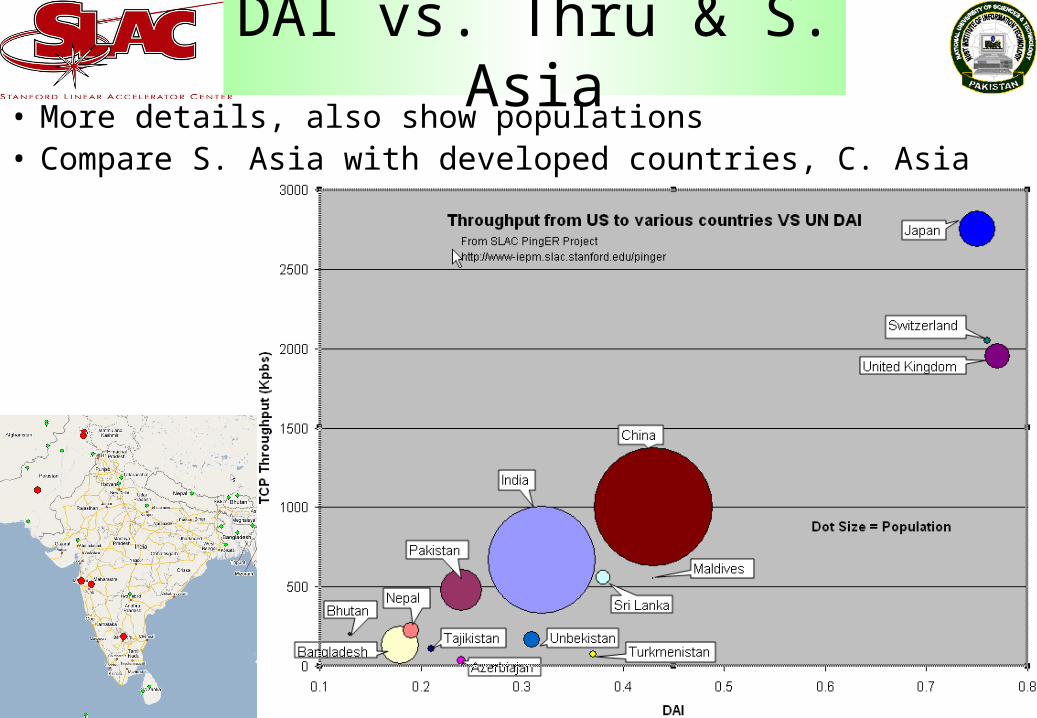
DAI vs. Thru & S. Asia• More details, also show populations• Compare S. Asia with developed countries, C. Asia
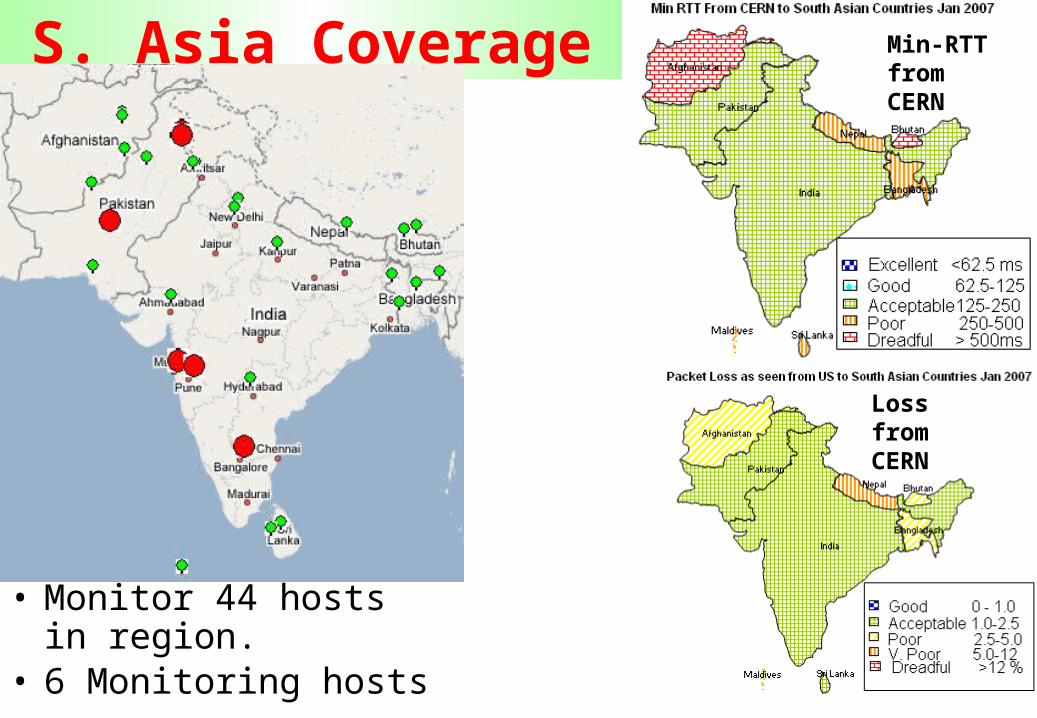
S. Asia Coverage
• Monitor 44 hosts in region.
• 6 Monitoring hosts
Loss from CERN
Min-RTT from CERN
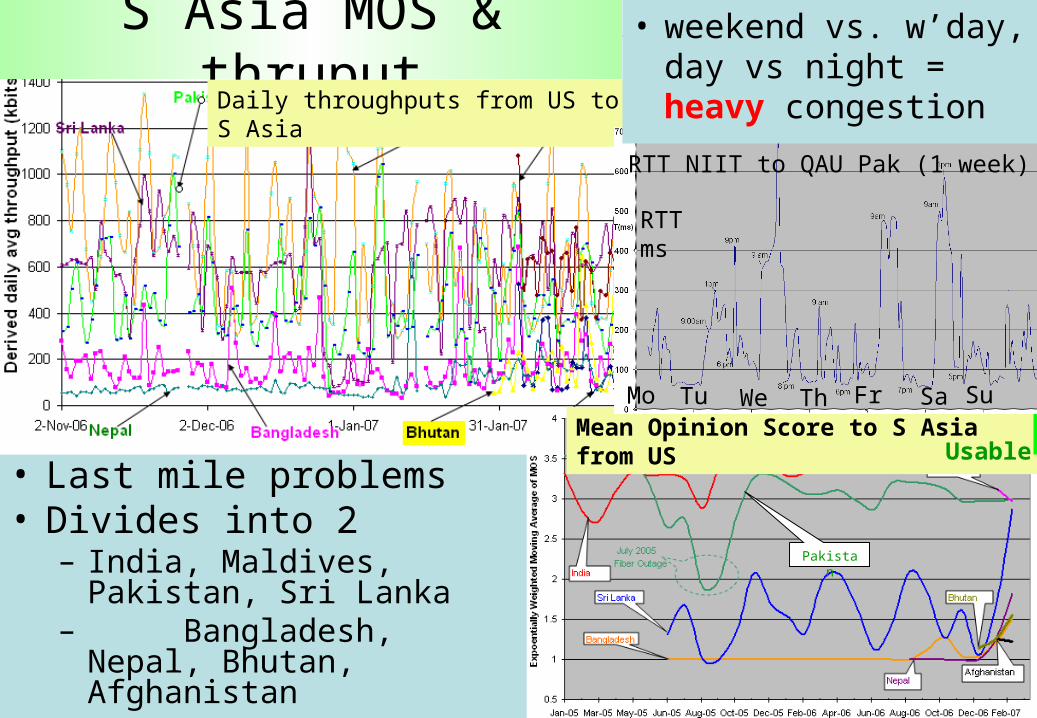
S Asia MOS & thruput
Mean Opinion Score to S Asia from US
Daily throughputs from US to S Asia
• Last mile problems• Divides into 2
– India, Maldives, Pakistan, Sri Lanka
– Bangladesh, Nepal, Bhutan, Afghanistan
Usable
RTT ms
RTT NIIT to QAU Pak (1 week)
Mo Tu We Th Fr Sa Su
• weekend vs. w’day, day vs night = heavy congestion
Pakistan

Africa:Satellites vs Terrestrial• Terrestrial links via SAT3 & SEAMEW (Mediterranean, Red Sea)• Terrestrial not available to all within countries
PingER min-RTT measurements fromS. African TENET monitoring station
EASSy fibre for E. AfricaWill it share sorry experience of SAT3 for W. Africa?
Mike Jensen,Paul HamiltonTENET, S. Africa
Satellite $/Mbps 300-1000x fibre costs

Africa: Fibre Links Future
– SAT-3 shareholders such as Telecom Namibia, which has no landing point of its own find it cheaper to use satellite
• Will EASSy follow suit?• Another option to EASSy: since
Sudan and Egypt are now connected via fibre, and the link will shortly extend to Ethiopia, there are good options for both Kenya and Uganda/Rwanda and Tanzania to quickly link to the backbones via this route
• SAT3 connects eight countries on the W coast of the continent to Europe and the Far East. Operating as a cartel of monopoly state-owned telecommunication providers, prices have barely come down since it began operating in 2002
Mike Jensen

Costs compared to West• Sites in many countries have bandwidth< US residence
– “10 Meg is Here”, www.lightreading.com/document.asp?doc_id=104415
• Africa: $5460/Mbps/m– W Africa $8K/Mbps/m– N Africa $520/Mbps/m
• Often cross-country cost dominates cf. international
1 yr of Internet access > average annual income of most Africans, Survey by Paul Budde Communnications
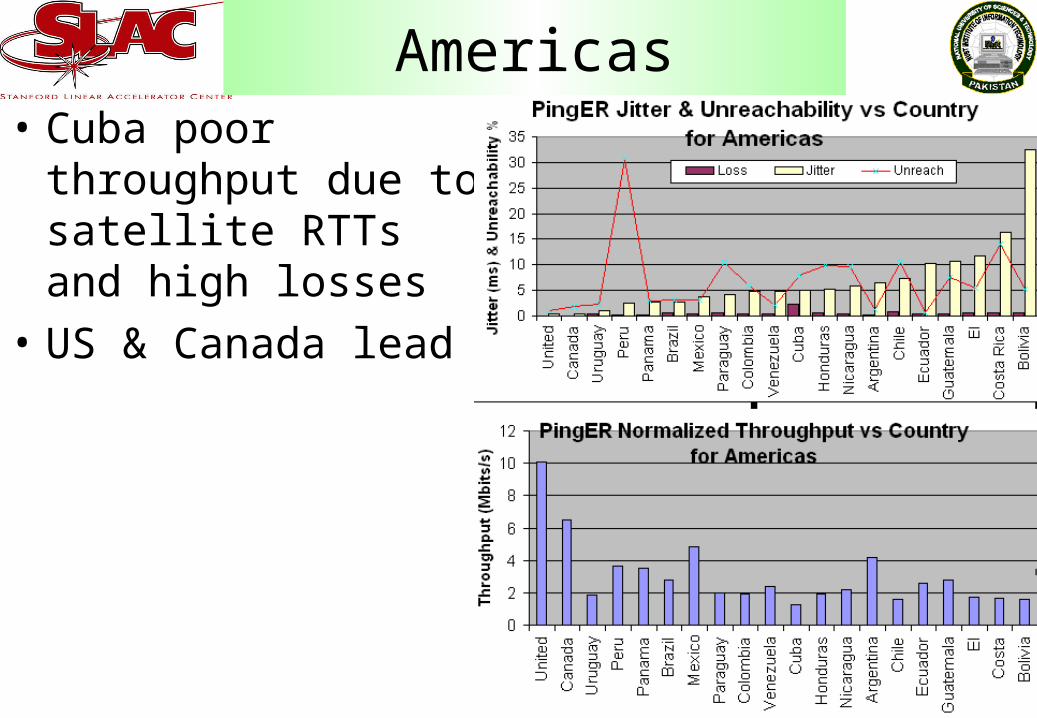
Americas• Cuba poor throughput
due to satellite RTTs and high losses
• US & Canada lead