Embed Size (px)
Citation preview

This article was downloaded by: [Indian Institute of Technology Guwahati]On: 26 March 2014, At: 22:54Publisher: RoutledgeInforma Ltd Registered in England and Wales Registered Number: 1072954 Registeredoffice: Mortimer House, 37-41 Mortimer Street, London W1T 3JH, UK
The Journal of Development StudiesPublication details, including instructions for authors andsubscription information:http://www.tandfonline.com/loi/fjds20
Quantifying the Qualitative:Eliciting Expert Input to Develop theMultidimensional Poverty AssessmentToolAlasdair Cohena & Michaela Saisanab
a University of California, Berkeley, USAb European Commission, Joint Research Centre, Ispra, ItalyPublished online: 20 Nov 2013.
To cite this article: Alasdair Cohen & Michaela Saisana (2014) Quantifying the Qualitative: ElicitingExpert Input to Develop the Multidimensional Poverty Assessment Tool, The Journal of DevelopmentStudies, 50:1, 35-50, DOI: 10.1080/00220388.2013.849336
To link to this article: http://dx.doi.org/10.1080/00220388.2013.849336
PLEASE SCROLL DOWN FOR ARTICLE
Taylor & Francis makes every effort to ensure the accuracy of all the information (the“Content”) contained in the publications on our platform. However, Taylor & Francis,our agents, and our licensors make no representations or warranties whatsoever as tothe accuracy, completeness, or suitability for any purpose of the Content. Any opinionsand views expressed in this publication are the opinions and views of the authors,and are not the views of or endorsed by Taylor & Francis. The accuracy of the Contentshould not be relied upon and should be independently verified with primary sourcesof information. Taylor and Francis shall not be liable for any losses, actions, claims,proceedings, demands, costs, expenses, damages, and other liabilities whatsoever orhowsoever caused arising directly or indirectly in connection with, in relation to or arisingout of the use of the Content.
This article may be used for research, teaching, and private study purposes. Anysubstantial or systematic reproduction, redistribution, reselling, loan, sub-licensing,systematic supply, or distribution in any form to anyone is expressly forbidden. Terms &Conditions of access and use can be found at http://www.tandfonline.com/page/terms-and-conditions

Quantifying the Qualitative: Eliciting Expert Inputto Develop the Multidimensional PovertyAssessment Tool
ALASDAIR COHEN* & MICHAELA SAISANA***University of California, Berkeley, USA, **European Commission, Joint Research Centre, Ispra, Italy
ABSTRACT This article discusses the participatory creation of the Multidimensional Poverty Assessment Tool(MPAT), a survey-based thematic indicator developed in China and India. The core of the article focuses on theuse of expert elicitation to inform the construction of MPAT’s household and village surveys, the cardinalisation ofsurvey responses, and the weighting scheme design. This is followed by a discussion of the potential pitfalls ofexpertise in development, the decision not to aggregate MPAT into an index, creating locally relevant povertylines, and ideas for future research. The article closes with a summary of lessons learned.
1. Introduction: Multidimensional Poverty, Indicators and Participation
Poverty is relative and multidimensional. Given its complexity, multidimensional nature and theconnections with history, context, politics and power, understanding and measuring poverty is by nomeans straightforward (Bossert, Chakravarty, & D’Ambrosio, 2009; Bourguignon & Chakravarty,2003; Narayan, Pritchett, & Kapoor, 2009; Roe, 1998; Streeten & Burki, 1978).
Many development researchers suggest two steps for poverty assessment: (1) determine who ispoor; and (2) measure/quantify their poverty. Sen (1976) arguably catalysed this approach in hisseminal paper ‘Poverty: An Ordinal Approach to Measurement’. Decades later there is still debate onhow best to accomplish these steps (Bossert et al., 2009) and, indeed, an ‘index of poverty’ (Sen,1976, p. 219) is not always the desired end result. Income remains the most commonly used indicatorof poverty. However, even if accurately measured (a difficult and costly feat in many areas), incomedoes not provide a reliable proxy for poverty (Bourguignon & Chakravarty, 2003; Sullivan, 2006; Sen,2000). Let us briefly consider, then, two well-known multidimensional, index-based approaches usedfor country-level comparisons.
The United Nations Development Program’s (UNDP) Human Development Index (HDI)1 is perhapsthe best known welfare indicator. It combines three dimensions (health, living standards and educa-tion) which are built on four indicators (life expectancy at birth, gross national income per capita, andmean years of schooling and expected years of schooling). Some have questioned the real policyimpact of HDI country rankings (Srinivasan, 1994) and others the extent to which the HDI is actuallybased on Sen’s ‘relatively abstract formulations in terms of functionings and capabilities’ (Ravallion,2010, p. 9). Debates and critiques notwithstanding (Chowdhury & Squire, 2006; Klugman, Rodríguez,& Choi, 2011), what is particularly relevant for our discussions here is the HDI’s use of equal weightsto aggregate the HDI’s indicators, as opposed to expert weights. Chowdhury and Squire (2006) elicitedexpert suggestions to examine alternative weighting schemes for the HDI (as well as the Commitmentto Development Index [CDI]) and found that the expert weights approximated the equal weightingscheme of the HDI (though less so for the CDI).
Correspondence Address: Alasdair Cohen, University of California, Berkeley, Department of Environmental Science, Policy &Management, 140 Mulford Hall, Berkeley, CA 94720, USA. Email: [email protected]
The Journal of Development Studies, 2014Vol. 50, No. 1, 35–50, http://dx.doi.org/10.1080/00220388.2013.849336
© 2014 Taylor & Francis
Dow
nloa
ded
by [
Indi
an I
nstit
ute
of T
echn
olog
y G
uwah
ati]
at 2
2:54
26
Mar
ch 2
014
The second index of note is the Multidimensional Poverty Index (MPI) which also uses equalweights. Recently, researchers at the University of Oxford (Alkire and Santos, 2010), in coordinationwith UNDP and others, expanded on the HDI’s mandate and created the MPI, an application of theAlkire and Foster (2011a) methodology which attempts to reconcile Sen’s ‘identification step’ in thecontext of multiple poverty dimensions (Alkire & Foster, 2011b). The MPI is based on 10 indicatorswhich are organised under the three dimensions of health (nutrition and child mortality), education(years of schooling and children enrolled) and living standards (cooking fuel, toilet facility, wateraccess, electricity, flooring material and assets).2 A poverty/deprivation score is measured for eachindicator, and these deprivations are summed and then aggregated with equal weights across thepopulation in question. The MPI was initially used to calculate scores for 104 countries, though themethodology may also be used for local level poverty measurement (Alkire & Foster, 2011b; Ferreira,2011). The MPI’s weighting scheme was subjected to a robustness test, which found that while thepoverty estimates changed, the country rankings were relatively constant (Alkire, Santos, Seth, &Yalonetzky, 2010).
Measuring multiple dimensions is important, yet as Ravallion (2011, p. 16) argues, ‘recognising thatpoverty is not just about lack of household command over market goods does not imply that one needsto collapse the multiple dimensions into one (unidimensional) index’. Indeed, we ought to questionhow much any one (over)simplified number can reveal about ‘poverty’ in any given region. In contrastto the HDI and MPI, the Multidimensional Poverty Assessment Tool (MPAT) uses purpose-builtsurveys, an expert-based weighting scheme and is not aggregated into an index.
To date, most of the expert elicitation literature deals with better understanding, measuring andforecasting uncertainty in economics and public health. However, this research can also inform thedesign of poverty assessment tools. But, before delving into the core content of this article, it must benoted that developing an indicator to quantify some of the core constructs surrounding rural poverty isjust one option for trying to simplify and organise this complexity. There is an extensive literature onthe use of participatory methods to support poverty assessment as well as project planning andimplementation at the micro (field) level and at more macro (political economic) levels (Chambers,1995, 2008; Cleaver, 1999; Cooke & Kothari, 2001; Hart, 2001; Hickey & Mohan, 2004; Mohan &Stokke, 2000; Szal, 1979). In spite of the many difficulties inherent in securing balanced participation(for example, Kapiriri, Norheim, & Heggenhougen, 2003), participatory approaches often offer anuanced means of assessing local poverty and perceptions of poverty.
There is a growing body of research on eliciting input from ‘the poor’ themselves and then usingthese qualitative data to make statistical inferences (for example, Barahona & Levy, 2003). Othershave used such participatory approaches to generate poverty lines (for example, Hargreaves et al.,2007; Narayan et al., 2009; Noble, Wright, Magasela, & Ratcliffe, 2008; Wright, Noble, & Magasela,2007) or set health priorities (Kapiriri et al., 2003). And others have also suggested using valuationsderived from poor people’s opinions to create poverty assessment tools (see Boltvinik [1998] for adiscussion of related expert elicitation methods).
However, due to the need to have a standardised, quantifiable, approach for use across regions andcountries, MPAT’s design team adopted an expert-based approach. In light of the subjective nature ofsuch an endeavour, poverty related indicators should be based on sound theoretical foundations withwell-operationalised conceptions of what is being measured and how, accompanied by transparentaggregation rules and weights. In addition to explaining the elicitation methods used to develop MPAT,we hope this article will also help bridge the cited gap (Leal, Wordsworth, Legood, & Blair, 2007)between theoretical elicitation approaches and those actually used.
The article is structured as follows. Section II describes MPAT’s purpose and architecture. The nextsections detail how expert input was elicited to create purpose-built household and village surveys(Section 3), assign cardinal scores and aggregation rules to survey item responses (Section 4), andfinally arrive at a weighting scheme for aggregating the subcomponents (Section 5). In Section 6 webriefly address how expertise in development frames problems and solutions in certain ways, whyMPAT does not distil all the information into a single number, and offer ideas on how to use MPAT to
36 A. Cohen & M. Saisana
Dow
nloa
ded
by [
Indi
an I
nstit
ute
of T
echn
olog
y G
uwah
ati]
at 2
2:54
26
Mar
ch 2
014

create local level poverty lines. We close by putting forward ideas for additional research andsummarising lessons learned.
2. MPAT’s Purpose, Architecture and Data Sources
MPAT was designed to support poverty alleviation project planning, design, management, monitoringand evaluation. Specifically, MPAT is a survey-based thematic indicator built on household and villagelevel data. Indicators are calculated for each household and then averaged for each village and theentire area/project. The tool was developed in 2008–2009 by an international consortium led by theInternational Fund for Agricultural Development (IFAD), a specialised agency of the United Nations(UN) and a ‘working paper’ version was released in early 2010 (Cohen, 2009b).MPAT provides an assessment along 10 dimensions of poverty (see Figure 1) that are fundamental
to rural life, livelihoods and well-being. MPAT is meant to be comprehensive and multidimensional.For these reasons, MPAT was developed as a ‘thematic indicator’, whereby the values for the 10components are not further aggregated into a single number (Cohen, 2010).
Each of MPAT’s 10 components is itself a composite indicator comprised of three subcomponents(with the exception of ‘Farm Assets’ that can have three or four subcomponents depending on thehousehold). The subcomponents are built on questions from the MPAT Household Survey and theMPAT Village Survey. The survey response items (mostly categorical, but also numerical) areconverted to a 1–10 scale, with 10 being the best achievable score. Survey responses for a givenhousehold are then aggregated into subcomponent scores using weighted arithmetic averages (andscaled up to 10–100 for greater precision). Finally, subcomponent scores are aggregated into compo-nent scores using weighted geometric averages (for details, see Cohen [2009b]; IFAD, in press).
To better understand how this works, consider the expert-led cardinalisation (that is, convertingordinal and nominal categorical data to cardinal data)3 for the ‘Domestic Water Supply’ Accesssubcomponent (#2.3). This subcomponent builds on two questions from the MPAT HouseholdSurvey. The first asks about the time needed to collect water for drinking and cooking. The answer,in minutes, is divided into intervals which are assigned values from 1–10. For example, the interval of11–20 minutes receives a value of 8.5 and the interval of 21–30 minutes a value of 6.5. The secondquestion has to do with ability to pay fees (if applicable) to access the household’s primary watersource, and thus the responses are categorical, with a response of ‘Always’ being assigned a value of10. The expert weighting scheme for calculating the subcomponent dictates that the first question(access time) receives a weight of 60 per cent and the second question the remaining 40 per cent (using
Figure 1. MPAT’s indicators: components and subcomponents (source: Cohen, 2009a).
Eliciting Expert Input to Develop the Multidimensional Poverty Assessment Tool 37
Dow
nloa
ded
by [
Indi
an I
nstit
ute
of T
echn
olog
y G
uwah
ati]
at 2
2:54
26
Mar
ch 2
014
a weighted arithmetic average), with the score then scaled to 10–100. Finally, all three ‘DomesticWater Supply’ subcomponent scores are aggregated into a component score using a weightedgeometric average.
3. Using Expert Input to Design the MPAT Household and Village Surveys
In 2007, a draft MPAT framework was created and sector-specific experts were invited to form asounding board to support the tool’s creation. Experts were primarily sought for a combination ofnormative and instrumental expertise in order to provide guidance on what should be measured foreach component (which aspects of rural poverty are most important) and how best to measure it(which data or proxies). Consequently, individuals were recruited due to their experience with povertyassessment work in less-developed countries and/or their sector-specific expertise (for example, inagriculture and soil science, micro credit, water management and so on). Particular attention was paidto ensuring participation of both international and regional experts, since the goal was to incorporate awide range of perspectives, backgrounds and experiences into the tool’s development. Winkler andClemen (2004, p. 174) note that the variability of expert input decreases as both the number ofmethods and experts increases, but that overall ‘the gains are much greater from multiple experts thanfrom multiple methods’. Of the 63 experts invited, 39 (62%) agreed to join the sounding board, thoughthe degree of participation varied over the course of the project. 4
Most board members came from UN agencies, research institutes and universities. In hindsight, weshould have used a more representative sampling procedure for recruitment, rather than a conveniencesample. One option would have been to develop a ‘sampling frame’ of potential experts, with aconsistent number per sector, and then randomly select and invite the required number from that largergroup (multiplied by 30–40% to address non-response). Even so, self-selection bias would likely stillhave been an issue (for example, Chowdhury and Squire, [2006, p. 764] reported a 53% expertresponse rate from a similar solicitation effort). However, in 2007 MPAT’s future utility was stillunknown, and thus it was easier to recruit willing experts by way of formal and informal professionalnetworks.
The first task of the sounding board was to help define MPAT’s framework and suggest surveyquestions. Unavoidably, in requesting input from experts a number of heuristics will bias theinformation received; for example, availability and anchoring heuristics (Kadane & Wolfson, 1998;Schwarz & Sudman, 1996). Indeed, the method of eliciting expert opinion itself is important, sincedifferent methods will introduce varying degrees of bias. A psychometrics consultant was recruited tocreate a primer5 on bias and heuristics which was emailed to board members along with theinstructions for how to create MPAT’s subcomponents and survey items (including examples ofappropriate and inappropriate questions). Ensuring timely feedback from such a large group ofprofessionals volunteering their time was also an issue, though almost everyone did provide feedbackeventually.
The board’s suggestions for subcomponents and survey items were compiled and distributed at theproject’s start-up workshop (September 2008, Beijing) to provide the starting point for the surveydesign (contributors’ names were omitted to avoid potentially biasing workshop participants). Thisworkshop yielded MPAT’s basic architecture with multiple and overlapping survey items for eachsubcomponent. Iterative field testing in rural China and India was then used to fine-tune the surveys.
Besides the experts, enumerators and respondents who participated in the repeated testing of thesurveys in China and India provided invaluable input for MPAT’s development. However, as touchedon above, since MPAT was designed to provide a standardised assessment of key dimensions of ruralpoverty across less-developed countries (an admittedly challenging goal), the project team felt itwould have been counterproductive to solicit input from the rural poor in China and India specifically,since they would, understandably, prioritise local specific issues. After five iterations of testing andrevision in different areas of rural China and India, the MPAT pilot was conducted in the spring of2009 (n = 527 households).
38 A. Cohen & M. Saisana
Dow
nloa
ded
by [
Indi
an I
nstit
ute
of T
echn
olog
y G
uwah
ati]
at 2
2:54
26
Mar
ch 2
014
4. Eliciting Expert Input for MPAT’s Survey Item Cardinalisation
As Welsch (2002, p. 477) noted in a paper on expert valuation, ‘well-being has no natural units’. Sincethe MPAT data from the village and household surveys was mostly categorical, and the notion of ‘themore the better’ was not always evident in the response scales, translating the survey responses tocomparable scales across questions was accomplished through expert consultation. Furthermore,MPATwas not intended to rank households or villages as such, but rather to identify which dimensionsof poverty would likely require support in different regions at different scales. Consequently, popularstatistical methods of normalisation, or cardinalisation, could not be applied (as, for example, reviewedin Agresti [2007]; Boltvinik [1998]; OECD [2008]).
Expert opinion was therefore used to identify both the preference-relation and the intensity ofpreference between the possible answers to survey questions. As the literature on expert elicitationsuggests, it is important to provide would-be contributors with examples of what is desired in clear andsimple language and to elicit quantities with which they are already familiar (Leal et al., 2007;O’Hagan, 1998). Though it was assumed that MPAT contributors were familiar with Likert scales,they were provided instructions and examples to guide them through the process of assigning cardinalscores and suggesting weights for aggregating the survey items into subcomponents (see Cohen,2009a, Annex VII). We believe that this may represent one of the few cases in which expert input wassought at this level of indicator development.
A brief side note is warranted here, since there are potential problems related to the use ofcorrelation analysis for data falling on non-ratio Likert scales (that is, without a meaningful zeropoint), an issue perhaps first flagged by Schmidt (1973). The key problem, as Evans (1991, p. 13) putit, is that ‘simple correlations are not an appropriate way to assess the relationship between a multi-plicative composite and an outside variable’. Trauer and Mackinnon (2001) point out that this alsoapplies to latent variable models, such as factor analysis (a statistical approach used in indicatordevelopment). However, to be clear, in this case we are not discussing correlations between a multi-plicative index and outside variables. We mention this, then, as a point of caution for othersconsidering similar research/methods.
For MPAT, the experts’ suggestions were first rendered anonymous and then distributed to partici-pants at the 2009 New Delhi workshop. Participants were divided in groups of three to four people todebate the suggested cardinal scores and survey item aggregations, keeping in mind the many contextsand countries where MPAT could be used. Due to time constraints not all cardinalisations werediscussed, and even for those reviewed a perfect consensus rarely emerged. Overall, the processwas closer to art than science and, ultimately, it fell upon the lead author to make many of the finaldecisions. This was most often accomplished by taking the average value suggested by the sector-specific experts, with judgments made in areas where there was no obvious consensus and highvariability.6
At this stage of MPAT’s development input from multiple experts was elicited over two stages (pre-workshop and during the workshop) using, essentially, a single method. While there is support for thisin the literature (Winkler & Clemen, 2004), in hindsight using another method to collect the sameinput from contributors would have allowed us to analyse the consistency of some of their suggestions(perhaps then only using inputs with high inter-rater reliability).
Another option would have been the Delphi Method (Dalkey & Helmer, 1963; Landeta, 2006).Once board members had provided their suggestions, these could have been compiled, averaged andthen shared with the group again (opinion feedback), accompanied by a second request for input –with the option of repeating this step a third or fourth time, or until some sort of stopping criterion wasmet. Those areas which still lacked consensus could have been shared with participants at the Delhiworkshop so as to more efficiently use that limited time.
A final issue relates to the often ordered nature of the survey responses and accompanying expert-derived cardinal scores (usually from ‘worst case’ to ‘best case’). It would be reasonable to suggestthat a linear scaling method from 1 to 10 would be a simpler and equally suitable method. With thispossible critique in mind, during the statistical validation of the pilot data from China and India, we
Eliciting Expert Input to Develop the Multidimensional Poverty Assessment Tool 39
Dow
nloa
ded
by [
Indi
an I
nstit
ute
of T
echn
olog
y G
uwah
ati]
at 2
2:54
26
Mar
ch 2
014

also calculated intensity of preference using a linear scaling with equal distances between responses,while assuming that the preference relationships of the responses as decided by the experts wereappropriate. We then compared the results of this linear scaling to the expert-led cardinal scores.
To give an example, in the ‘Health and Healthcare’ Quality subcomponent (#3.3), a question fromthe village survey (administered to village health care staff) asks: ‘Does each centre usually haveenough medical supplies to provide adequate healthcare?’ with the possible answers ‘Never’ (1),‘Rarely’ (2), ‘Sometimes’ (3), ‘Often’ (4), and ‘Always’ (5). In both the expert-based and linearscaling, the response codes ‘Never’ (1) and ‘Always’ (5) receive 1 and 10 points respectively (theminimum and maximum values). However, the intermediate responses receive different scores; forexample, ‘Sometimes’ (3) receives a score of 4 points under the expert-based valuation but 5.5 pointsunder the linear scaling (see Table 1).
These differences were analysed across all survey items and the use of expert scaling usuallyresulted in significant differences for the majority of the indicators included in MPAT as compared tolinear scaling (Saisana & Saltelli, 2010). Consequently, the Standardised MPAT is based on the expert-based scores, as well as on expert-derived weightings.
5. Eliciting Expert Input for MPAT’s Weighting Scheme
The other main task of the 2009 Delhi workshop was to try to reach a consensus on the weights foraggregating MPAT’s subcomponents into their respective components. There is much discussion anddebate on the use of expert weights versus equal weights in indicator construction (for example,Cooke, 1991; Saisana & Tarantola, 2002; Srinivasan, 1994; Trauer & Mackinnon, 2001), and thedecision to use equal weights could arguably be considered an implicit expert weighting scheme.
Ahead of the second MPAT workshop, feedback from board members and other developmentprofessionals on the weights for subcomponents was solicited using a template sent by email(Cohen, 2009a, Annex VII); experts were asked to decide which subcomponents ought be givenrelative priority when aggregated to the component score by assigning each a proportion out of 100.Forty experts from 10 countries and 28 organisations provided weighting suggestions prior to theDelhi workshop. Unfortunately, we do not know the response rate, since in addition to inviting boardmembers to participate, UNDP-India helped solicit input from one of their email-based networks. Thisalso partially explains the disproportionate number of Indian nationals who submitted weightingsuggestions, discussed below.
In hindsight, it might have been preferable to use a budget allocation approach based on simpleratios for the weightings, rather than prompting respondents to arrive at a total of 100 per cent acrossthe subcomponents (converting the ratios to percentages later). The Delphi method could have beenused as well to help corral expert opinions more tightly through one or more iterations of opinionfeedback.
Table 1. Example of expert and linear based cardinalisation of survey responses
MPAT (v.6) Village Survey, question #54 Answer Answer code Expert score Linear score
‘Does each center usually have enoughmedical supplies to provide adequatehealth care?’*
Never 1 1 1Rarely 2 2 3.25Sometimes 3 4 5.5Often 4 6.5 7.75Always 5 10 10
Note: *Enumerator supervisors administer the MPAT Village Surveys and are trained to understand the nuancesrelated to the questions; they then select the pre-coded answer which most closely matches the respondent’sanswer (details are in the MPAT User’s Guide).
40 A. Cohen & M. Saisana
Dow
nloa
ded
by [
Indi
an I
nstit
ute
of T
echn
olog
y G
uwah
ati]
at 2
2:54
26
Mar
ch 2
014
Another option is the analytic hierarchy process (AHP) which also provides a means of identifyinginconsistencies in expert suggestions on weights. AHP is based on the use of ordinal pairwisecomparisons with expert preference expressed on a scale of one to nine, with an eigenvector techniquethen used to calculate the relative weights based on expert inputs (Salty, 1980). As such, expertcontributors have less control in establishing the weights directly, since they are calculated as opposedto assigned (as in budget allocation methods).
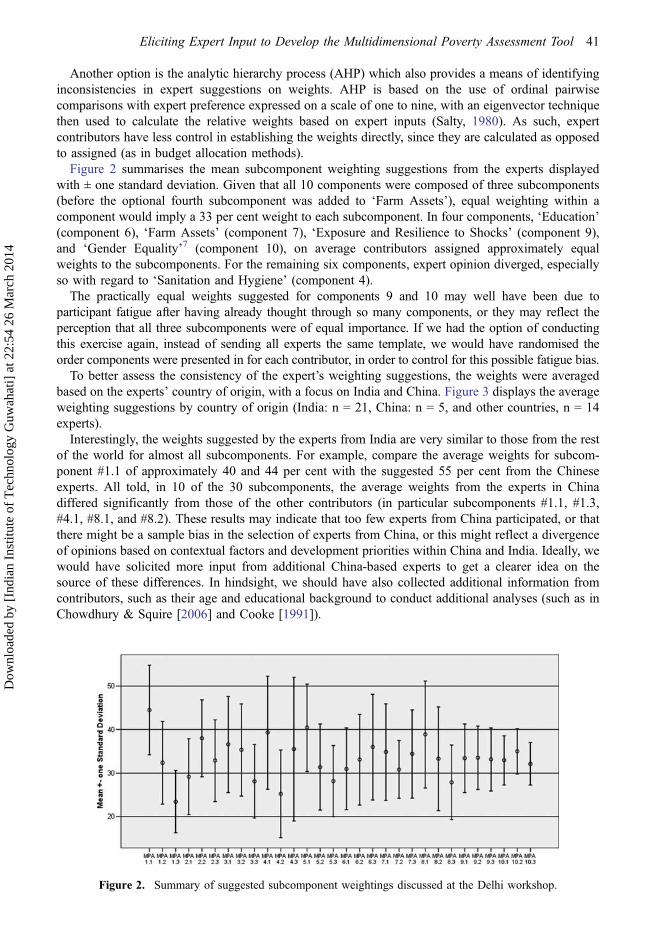
Figure 2 summarises the mean subcomponent weighting suggestions from the experts displayedwith ± one standard deviation. Given that all 10 components were composed of three subcomponents(before the optional fourth subcomponent was added to ‘Farm Assets’), equal weighting within acomponent would imply a 33 per cent weight to each subcomponent. In four components, ‘Education’(component 6), ‘Farm Assets’ (component 7), ‘Exposure and Resilience to Shocks’ (component 9),and ‘Gender Equality’7 (component 10), on average contributors assigned approximately equalweights to the subcomponents. For the remaining six components, expert opinion diverged, especiallyso with regard to ‘Sanitation and Hygiene’ (component 4).
The practically equal weights suggested for components 9 and 10 may well have been due toparticipant fatigue after having already thought through so many components, or they may reflect theperception that all three subcomponents were of equal importance. If we had the option of conductingthis exercise again, instead of sending all experts the same template, we would have randomised theorder components were presented in for each contributor, in order to control for this possible fatigue bias.
To better assess the consistency of the expert’s weighting suggestions, the weights were averagedbased on the experts’ country of origin, with a focus on India and China. Figure 3 displays the averageweighting suggestions by country of origin (India: n = 21, China: n = 5, and other countries, n = 14experts).
Interestingly, the weights suggested by the experts from India are very similar to those from the restof the world for almost all subcomponents. For example, compare the average weights for subcom-ponent #1.1 of approximately 40 and 44 per cent with the suggested 55 per cent from the Chineseexperts. All told, in 10 of the 30 subcomponents, the average weights from the experts in Chinadiffered significantly from those of the other contributors (in particular subcomponents #1.1, #1.3,#4.1, #8.1, and #8.2). These results may indicate that too few experts from China participated, or thatthere might be a sample bias in the selection of experts from China, or this might reflect a divergenceof opinions based on contextual factors and development priorities within China and India. Ideally, wewould have solicited more input from additional China-based experts to get a clearer idea on thesource of these differences. In hindsight, we should have also collected additional information fromcontributors, such as their age and educational background to conduct additional analyses (such as inChowdhury & Squire [2006] and Cooke [1991]).
Figure 2. Summary of suggested subcomponent weightings discussed at the Delhi workshop.
Eliciting Expert Input to Develop the Multidimensional Poverty Assessment Tool 41
Dow
nloa
ded
by [
Indi
an I
nstit
ute
of T
echn
olog
y G
uwah
ati]
at 2
2:54
26
Mar
ch 2
014

An avenue for future research would be to conduct a simple ranking exercise of MPAT’s 10components by groups of development experts and rural poor in the same country/countries, andthen compare the rankings to better understand the potential utility of conducting participatoryweighting design nationally, with and without rural communities, to develop country specific MPATweights.
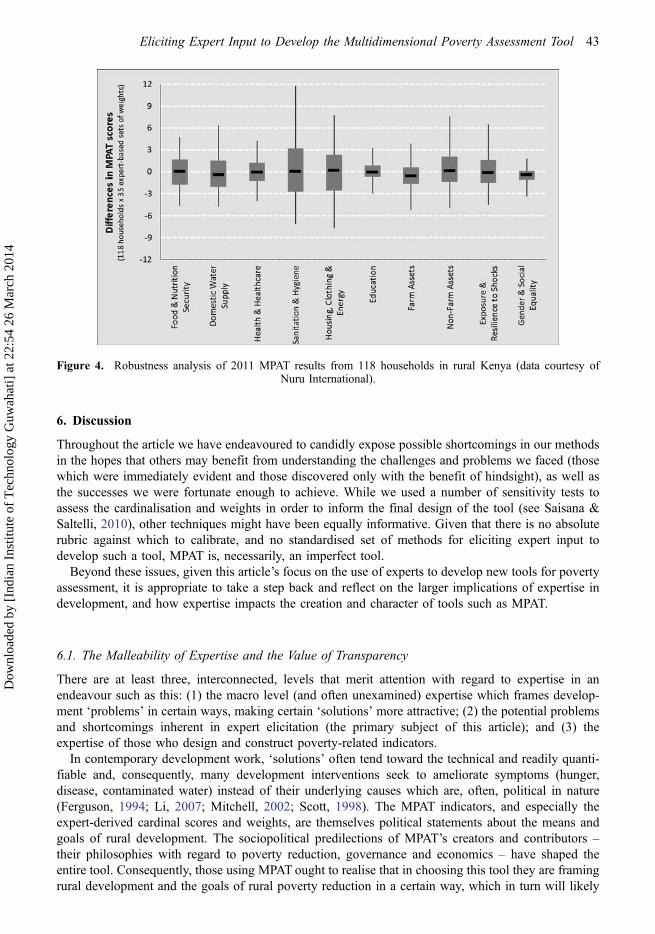
In the end, in most cases MPAT uses the average expert weights shown in Figure 2. The robustnessof MPAT to different weights was tested using pilot data from villages in China and India (Saisana &Saltelli, 2010). Here, we present the results from a random sample of four villages in Kenya (total of118 households from MPAT data collected in 2011). The sample of 35 expert weighting schemes usedincludes those from India (n = 21) and other countries (n = 14); we excluded the five experts fromChina due to the potential bias issues discussed above. Hence, for each household 35 scores werecalculated for each of the 10 components, corresponding to a different expert-driven set of weights.The differences between any of these scores and the reference MPAT score were calculated for eachhousehold and component.
Figure 4 summarises the results of the robustness analysis based on those differences. The black lineis the median across all households and sets of weights, and the boxes include 50 per cent of the cases(from the 25th to the 75th percentile). The 90 per cent confidence intervals are displayed by thevertical lines. Thus, a median close to zero with a small box and a short vertical line indicates anMPAT component that is robust to changes in the subcomponents weights (within the space of theexpert sample).
The most sensitive MPAT components to the choice of the weights are ‘Sanitation and Hygiene’,‘Housing, Clothing and Energy’, ‘Non-farm Assets’ and ‘Exposure and Resilience to Shocks’. Themost robust components are ‘Education’ and ‘Gender and Social Equality’. Yet, even for the mostsensitive components, the impact on the poverty estimates is moderate. In fact, for all MPATcomponents, the median is close to zero, and the boxes are only ±3 points. In addition, the Pearsoncorrelation coefficients between the MPAT scores and those obtained using single expert-basedweights range from 0.95 to 1.00 for all 10 components. This demonstrates that all 10 componentsmeasured by MPAT are not driven by the weights, when these are changed within reasonable limits.
Figure 3. Average expert weights based on contributors’ country of origin.
42 A. Cohen & M. Saisana
Dow
nloa
ded
by [
Indi
an I
nstit
ute
of T
echn
olog
y G
uwah
ati]
at 2
2:54
26
Mar
ch 2
014
6. Discussion
Throughout the article we have endeavoured to candidly expose possible shortcomings in our methodsin the hopes that others may benefit from understanding the challenges and problems we faced (thosewhich were immediately evident and those discovered only with the benefit of hindsight), as well asthe successes we were fortunate enough to achieve. While we used a number of sensitivity tests toassess the cardinalisation and weights in order to inform the final design of the tool (see Saisana &Saltelli, 2010), other techniques might have been equally informative. Given that there is no absoluterubric against which to calibrate, and no standardised set of methods for eliciting expert input todevelop such a tool, MPAT is, necessarily, an imperfect tool.
Beyond these issues, given this article’s focus on the use of experts to develop new tools for povertyassessment, it is appropriate to take a step back and reflect on the larger implications of expertise indevelopment, and how expertise impacts the creation and character of tools such as MPAT.
6.1. The Malleability of Expertise and the Value of Transparency
There are at least three, interconnected, levels that merit attention with regard to expertise in anendeavour such as this: (1) the macro level (and often unexamined) expertise which frames develop-ment ‘problems’ in certain ways, making certain ‘solutions’ more attractive; (2) the potential problemsand shortcomings inherent in expert elicitation (the primary subject of this article); and (3) theexpertise of those who design and construct poverty-related indicators.
In contemporary development work, ‘solutions’ often tend toward the technical and readily quanti-fiable and, consequently, many development interventions seek to ameliorate symptoms (hunger,disease, contaminated water) instead of their underlying causes which are, often, political in nature(Ferguson, 1994; Li, 2007; Mitchell, 2002; Scott, 1998). The MPAT indicators, and especially theexpert-derived cardinal scores and weights, are themselves political statements about the means andgoals of rural development. The sociopolitical predilections of MPAT’s creators and contributors –their philosophies with regard to poverty reduction, governance and economics – have shaped theentire tool. Consequently, those using MPAT ought to realise that in choosing this tool they are framingrural development and the goals of rural poverty reduction in a certain way, which in turn will likely
Figure 4. Robustness analysis of 2011 MPAT results from 118 households in rural Kenya (data courtesy ofNuru International).
Eliciting Expert Input to Develop the Multidimensional Poverty Assessment Tool 43
Dow
nloa
ded
by [
Indi
an I
nstit
ute
of T
echn
olog
y G
uwah
ati]
at 2
2:54
26
Mar
ch 2
014

favour certain strategies for poverty reduction over others. This may all go without saying, but it is toooften not said.
It follows, then, that a different project management team and different group of experts would havecreated a different tool. Given this, and that there is no ‘perfect’ method for developing suchindicators, ‘the key to ensuring that others have an understanding of how any given indicator isboth necessarily flawed and potentially useful is, in a word, transparency’ (Cohen, 2010, p. 893).As part of MPAT’s development as an open-source tool, an Excel spreadsheet which automatically
calculates MPAT’s indicators is provided on the IFAD website (www.ifad.org/mpat). The defaultvalues and weights are those arrived at through the process of expert elicitation described herein –what we refer to as the Standardised MPAT. Yet the cardinal scores and subcomponent weights can bechanged by users, allowing them to create a customised MPAT which may better reflect localconditions or priorities. A caveat here is that ‘expertise’ can be manipulated to deliver desired results,and it would not be difficult to adjust MPAT’s cardinal scores and weights so that the final MPATscores appeared high/positive for a given area, whereas the Standardised MPAT would have yieldedlower scores. Ideally then, customised MPAT results should always be presented alongside, or overlaidwith, standardised results. This warning is mentioned to further highlight the need for users to lookbehind the curtain at the inner workings which produce the MPAT results for a given household,village, district or project.
6.2. Measuring Rural Poverty with One Number?
Ravallion (2010, 2011) has questioned the value of aggregating multiple poverty-related dimensionsinto an index, suggesting that the sum may not be greater than the parts, and that ‘dashboard’approaches may therefore be preferable. Others (Ferreira, 2011) suggest that dashboard approachesmiss out on the information provided by joint distributions of poverty/deprivation. There is somethingto be said for both points of view, and of course the context will undoubtedly dictate which approach ismore suitable.
With regard to MPAT, aggregating the 10 components into a single index, though perhaps temptingfor policy consumption, was deemed conceptually unsuitable from the onset of the project (Cohen,2010). It was nonetheless discussed extensively during the development of MPAT, from both theore-tical and statistical points of view. Correlation analysis and scatterplots between the 10 componentssuggest that they account for different aspects of rural poverty, and that there is little overlap ofinformation between them. This is evident in the non-significant correlations between the 10 compo-nents (using the 2009 pilot data from China and India) – see Table 2.
Though, the 10 components are closely interrelated, since they measure key aspects of rural poverty,statistically this is exactly the desired outcome: at least moderate correlation within components, andweak correlation between them. If one attempted to merge these 10 components into a single number,its resulting utility for project support would be of dubious value. The community of compositeindicator developers may find this case quite interesting, as it suggests that a final composite indicatorshould not be seen as a goal in every instance. Indeed, as our work with MPAT illustrates, it issometimes preferable to stop the aggregation procedure at the component level.
6.3. Using MPAT to Create Local Level Poverty Lines
Since the release of the ‘working paper’ version of MPAT in early 2010, a number of agencies haveused MPAT and some have asked IFAD how to use the results to set poverty lines. On the MPAT Excelspreadsheet, results are presented using colour codes such that scores under 30 (lowest values) arehighlighted in red, those between 30 and 59 in orange, 60 to 79 yellow, and 80 to 100 green. Thesecolour codes allow for the quick identification of which sectors, regions, villages or even householdsmay require support – but they are not ‘poverty lines’.
Given the context-specific nature of poverty, it would be imprudent to create an absolute numericalline based on MPAT values for all regions/countries, such that those below are poor, and those above
44 A. Cohen & M. Saisana
Dow
nloa
ded
by [
Indi
an I
nstit
ute
of T
echn
olog
y G
uwah
ati]
at 2
2:54
26
Mar
ch 2
014

Tab
le2.
Pearson’scorrelationcoefficientsbetweenthe10
MPA
Tcompo
nents
Foo
dandnu
trition
security
Dom
estic
water
supp
lyHealth
and
health
care
Sanitatio
nand
hygiene
Hou
sing
and
energy
Edu
catio
nFarm
assets
Non
-farm
assets
Exp
osureand
Resilience
toshocks
1.Foo
dandnu
trition
security
2.Dom
estic
water
supp
ly0.06
3.Health
andhealth
care
–0.13
0.35
*4.
Sanitatio
nand
hygiene
–0.01
0.23
0.32
*
5.Hou
sing
andenergy
0.23
0.11
0.08
–0.04
6.Edu
catio
n0.10
0.19
0.18
0.07
0.20
7.Farm
assets
0.20
0.42
*0.26
0.21
0.16
0.14
8.Non
-farm
assets
0.13
0.13
0.18
0.08
0.05
0.08
0.27
*9.
Exp
osureand
resilienceto
shocks
0.08
–0.01
–0.02
–0.07
0.14
–0.10
0.07
–0.14
10.Genderequality
0.08
0.21
0.04
–0.21
0.22
0.19
0.10
0.01
0.17
Notes:*S
ignificant
coefficientsaregreaterthan
0.27
(p<0.05
,n=52
7).
Spearman
rank
correlations
arevery
similarto
thePearson
coefficientsrepo
rted
here.
Eliciting Expert Input to Develop the Multidimensional Poverty Assessment Tool 45
Dow
nloa
ded
by [
Indi
an I
nstit
ute
of T
echn
olog
y G
uwah
ati]
at 2
2:54
26
Mar
ch 2
014

not. That said, generally speaking one could say that a community scoring in the green range (80–100)is likely in a relatively good position with regard to people’s well-being and access to social services.In addition, since MPAT is designed to support monitoring and evaluation, MPAT scores can provideindications of where the situation has improved, or worsened (assuming the Standardised MPAT isused at two or more time intervals). This can be seen, for example, by comparing MPAT results fromthe same region at two time points, as in Figure 5.
The MPAT scores and colour codes, then, are meant to serve as general guidelines, not concretesignposts. That said, agencies may wish to use MPAT scores to create local-level poverty lines.
One approach would be to form a consultative group of local and national experts to set numericalgoalposts for their interventions. Thus, one project might decide that scores of 70 or more aresufficiently high with regard to their objectives for ‘Food and Nutrition Security’ as measured byMPAT, but scores of 80 or higher would be needed with regard to ‘Domestic Water Supply’. This couldalso be facilitated by using some of the participatory approaches mentioned in this article’s introductionfor demarcating local-level poverty lines with MPAT indicator scores and possibly calibrating themagainst poverty lines developed with approaches such as the ‘Ladder of Life’ (Narayan et al., 2009).
6.4. Future Research and Unanswered Questions
This article discussed methods for recruiting experts and soliciting their input, but how ought one bestdetermine the minimum expert sample size? One option would be to determine the minimum numberof experts for which the weight’s standard deviation would not significantly change. As far as creatinga representative sample, above we suggest one approach (creating a sampling frame of potentialexperts), but what guidelines should be established for participants to ensure sufficient expertise? Thatis, how ought one determine the inclusion criteria for experts in a given domain? Surely ‘years ofexperience’ alone would be insufficient, so how to best balance quantity (experience) with quality(depth of understanding)?
Figure 5. Comparing baseline and mid-point MPAT results in rural Kenya, n = 480 households; insufficient datafor 'Education' component comparison (data courtesy of Nuru International).
46 A. Cohen & M. Saisana
Dow
nloa
ded
by [
Indi
an I
nstit
ute
of T
echn
olog
y G
uwah
ati]
at 2
2:54
26
Mar
ch 2
014

Similarly, in addition to the suggestion of comparing local (poor) people’s suggested rankings withthose of regional development experts, it would be worthwhile to compare different sources ofexpertise for each sector of interest. For example, with regard to water supply, do the weightssuggested by hydrologists differ from those of epidemiologists, or anthropologists or economists? Ifso, how ought one determine which sector-specific expertise is most appropriate for a given applica-tion? Should a variety of experts be invited to suggest weightings and subsequent sensitivity analysisbe used to determine which subset of experts provided the most robust weightings? Or would it bemore appropriate to make these decisions before expert input is solicited?
With regard to MPAT specifically, at what point should the weightings be re-evaluated? That is, atwhat point in the future will the weights no longer be applicable for most regions? Already we haveseen that the Millennium Development Goals have spurred countries to focus their efforts on specificsectors; as the forthcoming Sustainable Development Goals continue to provide such developmentguidance, at what point will it be necessary to conduct another exercise to adjust MPAT’s weights?
7. Conclusions
In this article we discussed how expert elicitation can be used for bottom–up, survey-based, multi-dimensional poverty indicator development (see Table 3 for a summary of key points). This type of
Table 3. Summary of key issues, lessons learned and suggestions
Concept/area Lessons learned Related literature
Multiple experts,multiple methods
Overall, it is better to use multiple elicitation methods andmultiple experts, but it appears multiple experts provide morevalue than multiple methods.
(Winkler and Clemen,(2004)
Don’t expect fullparticipation
62% per cent of invited Board members agreed to participate(53% in Chowdhury and Squire’s 2006 study) meaning self-selection bias certainly played a role. Compensating expertsmight increase participation.
(Chowdhury and Squire,(2006)
Diverse butbalancedcontributors
We recommend choosing experts with a balance of diversebackgrounds (gender, age, profession, education, country oforigin, and so forth) and collecting information on thesecharacteristics to later analyse as possible sources of bias (aswe did with country of origin).
(R. Cooke, (1991)
Psychometrics andsurveys
Responsibly designing new surveys is complicated; as such werecommend recruiting a psychometrics expert to assist withsurvey design so as to limit the bias introduced by the surveysthemselves.
(Schwarz and Sudman,(1996)
Randomizise theorder of tasks
When distributing forms/templates to contributors for weights orcardinalisation, randomizise the order of the tasks so as tocontrol for participant fatigue (or other bias based onordering).
Cardinalisation andscales
Use multiple experts and, ideally, multiple methods. The DelphiMethod would likely be helpful in quickly condensingcardinalisation inputs. Similarly, consider eventualaggregation methods when determining the cardinal scorescales (for example, 0–5, 1–5, 1–10) and compare expert-based results with linear scaling when/as appropriate.
(Dalkey and Helmer,(1963); Landeta,(2006)
Setting weights When soliciting expert input for indicator weights it is probablypreferable to use a relative, ratio-based, budget allocationapproach, in one or more steps (Delphi Method) rather than a100% sum approach – it may also be useful to use an analytichierarchy process.
(Salty, (1980); OECD,(2008)
Index vs. dashboard It is not always appropriate or desirable to strive for amultidimensional poverty index – in cases, a thematicindicator (a dashboard approach) may be more appropriate.
(Ravallion, (2011)
Eliciting Expert Input to Develop the Multidimensional Poverty Assessment Tool 47
Dow
nloa
ded
by [
Indi
an I
nstit
ute
of T
echn
olog
y G
uwah
ati]
at 2
2:54
26
Mar
ch 2
014

approach can yield useful results, but the process itself is by no means straightforward. Participatoryindicator design is a necessarily imperfect, and sometimes messy, process from which ‘consensus’eventually emerges. Indeed, soliciting input from a wide range of people at different organisations withdifferent incentives for contributing to a project is challenging. What is more, there is no pre-existingrubric to calibrate the new tool. Consequently, one has to rely on statistical analysis and in-fieldassessments to try to ensure the tool is measuring what is intended.
An additional benefit of the expert elicitation approaches we used is that those who contributed toMPAT’s creation gained a sense of ownership, since their suggestions were incorporated into the toolin highly visible ways. This in turn helped perpetuate their willingness to support the project as itunfolded, and bolstered the confidence of potential users and collaborating government agencies withregard to the tool’s utility.
At this writing, IFAD is working to incorporate feedback on MPAT from the last few years and fromrecent case studies (in Bangladesh and Mozambique), to create a final version of the tool, slated forrelease in 2014. With regard to future research, we are considering using recent and forthcomingMPAT data sets to explore the utility of using MPAT scores to analyse joint distributions of depriva-tions by household. Given that this is still a relatively nascent field, hopefully the lessons learned fromour efforts thus far will better elucidate the path forward for future research.
Acknowledgements
This article benefited from extensive referee comments for which the authors are grateful. Manypeople offered their time and energy to support MPAT’s 2008–2009 development, especially ThomasRath, as well as Rudolph Cleveringa, Mattia Prayer-Galletti, Shaheel Rafique, Roxanna Samii, SunYinhong and other colleagues at IFAD and other agencies (acknowledged in detail in the MPAT Bookat http://www.ifad.org/mpat/resources/book.pdf). The corresponding author also extends thanks to JeffRomm for his support of this work and sage advice. This work was originally funded by IFAD, DFID,Fulbright and government agencies in China and India.
Notes
1. For more information, see: http://hdr.undp.org/en/statistics/indices/.2. For more information, see: http://hdr.undp.org/en/statistics/mpi/.3. Both authors have also referred to this cardinalisation processes as ‘normalisation’ in past publications, since, while most of
the MPAT survey items fall on categorical scales, they are not always ordinal/linear.4. Board members were not financially compensated for participation (except for travel and lodging expenses for those who
attended workshops). The interested reader may consult the acknowledgements section (pp. 12–17) of the MPAT Book (http://www.ifad.org/mpat/resources/book.pdf) for a list of contributors.
5. Available in Annex I of the MPAT Book (http://www.ifad.org/mpat/resources/book.pdf).6. In the interests of transparency and reproducibility, all of the survey item cardinalisations and aggregation rules are presented
in the MPAT User’s Guide (available on the http://www.ifad.org/mpat website); in light of the debatable nature of the cardinalscores and weightings MPAT users are also encouraged to examine and change them as appropriate (to create a customizedMPAT).
7. For MPAT v.6, this was called ‘Gender Equality’; in subsequent iterations it was extended and renamed ‘Gender and SocialEquality’.
References
Agresti, A. (2007). Categorical data analysis (2nd ed.). Hoboken: Wiley.Alkire, S., & Foster, J. (2011a). Counting and multidimensional poverty measurement. Journal of Public Economics, 95,
476–487.Alkire, S., & Foster, J. (2011b). Understandings and misunderstandings of multidimensional poverty measurement. Journal of
Economic Inequality, 9, 289–314.Alkire, S., & Santos, M. E. (2010). Acute multidimensional poverty: A new index for developing countries. In. Oxford: Oxford
Poverty and Human Development Initiative. “Working Paper No. 38” Pages 1–133 (July, 2010)
48 A. Cohen & M. Saisana
Dow
nloa
ded
by [
Indi
an I
nstit
ute
of T
echn
olog
y G
uwah
ati]
at 2
2:54
26
Mar
ch 2
014

Alkire, S., Santos, M. E., Seth, S., & Yalonetzky, G. (2010). Is the Multidimensional Poverty Index robust to different weights?In Oxford Poverty and Human Development Initiative. University of Oxford. Retrieved from http://www.ophi.org.uk.
Barahona, C., & Levy, S. (2003). How to generate statistics and influence policy using participatory methods in research:Reflections on work in Malawi, 1999–2002. Brighton: Institute of Development Studies.
Boltvinik, J. (1998). Poverty measurement methods – an overview. In. New York: United Nations Development Program.Bossert, W., Chakravarty, S. R., & D’Ambrosio, C. (August 17, 2009, pages 1–21 2009). Multidimensional poverty and material
deprivation. In. Montreal: University of Montreal. Available at: ftp://www.econ.bgu.ac.il/Courses/Labor_Marcet_Policy-_Selected_Issues/lectures/articles/boltvinik_measurement%201998.pdf
Bourguignon, F., & Chakravarty, S. R. (2003). The measurement of multidimensional poverty. Journal of Economic Inequality,1, 25–49.
Chambers, R. (1995). Poverty and livelihoods: Whose reality counts? Environment and Urbanization, 7, 173–204.Chambers, R. (2008). Revolutions in development inquiry. London: Earthscan.Chowdhury, S., & Squire, L. (2006). Setting weights for aggregate indices: An application to the commitment to development
index and human development index. Journal of Development Studies, 42, 761–771.Cleaver, F. (1999). Paradoxes of participation: Questioning participatory approaches to development. Journal of International
Development, 11, 597–612.Cohen, A. (2009a). The Multidimensional Poverty Assessment Tool: Design, development and application of a new framework
for measuring rural poverty. Rome: IFAD.Cohen, A. (2009b). The Multidimensional Poverty Assessment Tool: User’s guide (working paper). In. Rome: IFAD. (http://
www.ifad.org/mpat/resources/user.pdf). 1–100.Cohen, A. (2010). The Multidimensional Poverty Assessment Tool: A new framework for measuring rural poverty. Development
in Practice, 20, 887–897.Cooke, B., & Kothari, U. (2001). Participation: The new tyranny? New York and London: Zed Books.Cooke, R. (1991). Experts in uncertainty: Opinion and subjective probability in science. New York: Oxford University Press.Dalkey, N., & Helmer, O. (1963). An experimental application of the Delphi method to the use of experts. Management Science,
9, 458–467.Evans, M. (1991). The problem of analyzing multiplicative composites. The American Psychologist, 46, 6.Ferguson, J. (1994). The anti-politics machine: ‘Development’, depoliticization, and bureaucratic power in Lesotho.
Minneapolis, MN: University of Minnesota Press.Ferreira, F. (2011). Poverty is multidimensional. But what are we going to do about it? Journal of Economic Inequality, 9,
493–495.Hargreaves, J. R., Morison, L. A., Gear, J. S. S., Makhubele, M. B., Porter, J. D. H., Busza, J., Watts, C., Kim, J. C., & Pronyk,
P. M. (2007). Hearing the voices of the poor: Assigning poverty lines on the basis of local perceptions of poverty.A quantitative analysis of qualitative data from participatory wealth ranking in rural South Africa. World Development,35, 212–229.
Hart, G. (2001). Development critiques in the 1990s: Culs de sac and promising paths. Progress in Human Geography, 25,649–658.
Hickey, S., & Mohan, G. (2004). Participation: From tyranny to transformation? New York: Zed Books.IFAD. (in press). The Multidimensional Poverty Assessment Tool: User’s guide. Rome: The International Fund for Agricultural
Development.Kadane, J., & Wolfson, L. J. (1998). Experiences in elicitation. Journal of the Royal Statistical Society: Series D
(The Statistician), 47, 3–19.Kapiriri, L., Norheim, O. F., & Heggenhougen, K. (2003). Public participation in health planning and priority setting at the
district level in Uganda. Health Policy and Planning, 18, 205–213.Klugman, J., Rodríguez, F., & Choi, H.-J. (2011). The HDI 2010: New controversies, old critiques. Journal of Economic
Inequality, 9, 249–288.Landeta, J. (2006). Current validity of the Delphi method in social sciences. Technological Forecasting and Social Change, 73,
467–482.Leal, J., Wordsworth, S., Legood, R., and Blair, E. (2007). Eliciting expert opinion for economic models: An applied example.
Value in Health, 10, 195–203.Li, T. (2007). The will to improve: Governmentality, development, and the practice of politics. Durham, NC and London: Duke
University Press.Mitchell, T. (2002). Rule of experts: Egypt, techno-politics, modernity. Berkeley, CA, and Los Angeles, CA: University of
California Press.Mohan, G., & Stokke, K. (2000). Participatory development and empowerment: The dangers of localism. Third World Quarterly,
21, 247–268.Narayan, D., Pritchett, L., & Kapoor, S. (2009). Moving out of poverty: Success from the bottom up. Washington, DC: World
Bank.Noble, M. W. J., Wright, G. C., Magasela, W. K., & Ratcliffe, A. (2008). Developing a democratic definition of poverty in South
Africa. Journal of Poverty, 11, 117–141.O’Hagan, A. (1998). Eliciting expert beliefs in substantial practical applications. Journal of the Royal Statistical Society: Series
D (The Statistician), 47, 21–35.
Eliciting Expert Input to Develop the Multidimensional Poverty Assessment Tool 49
Dow
nloa
ded
by [
Indi
an I
nstit
ute
of T
echn
olog
y G
uwah
ati]
at 2
2:54
26
Mar
ch 2
014

OECD. (2008). Handbook on constructing composite indicators: Methodology and user guide. In: OECD and EuropeanCommission Joint Research Centre. Printed in (Paris) France by “OECD Publications”. Pages 1–158
Ravallion, M. (2010). Mashup indices of development. In. “Policy Research Working Paper 5432” (September 2010), availableon the WB website. Pages 1–37. Washington, DC: The World Bank.
Ravallion, M. (2011). On multidimensional indices of poverty. In. “Policy Research Working Paper 5580” (February 2011).Pages 1–20. Washington, DC: The World Bank.
Roe, E. (1998). Taking complexity seriously: Policy Analysis, triangulation, and sustainable development. Boston, MA: KluwerAcademic.
Saisana, M., & Saltelli, A. (2010). The Multidimensional Poverty Assessment Tool (MPAT): Robustness issues and criticalassessment. In EUR Report 24310 EN. Luxenbourg: European Commission, JRC-IPSC, Italy.
Saisana, M., & Tarantola, S. (2002). State-of-the-art report on current methodologies and practices for composite indicatordevelopment. In: European Commission, Joint Research Centre, Institute for the Protection and the Security of the Citizen,Technological and Economic Risk Management Unit. EUR Report 20408 EN. Luxembourg: European Commission, JRC-IPSC, Italy.
Salty, T. (1980). The analytic hierarchy process: Planning, priority setting, resource allocation. New York: McGraw-Hill.Schmidt, F. L. (1973). Implications of a measurement problem for expectancy theory research. Organizational Behavior and
Human Performance, 10, 243–251.Schwarz, N., & Sudman, S. (1996). Answering questions: Methodology for determining cognitive and communicative processes
in survey research. San Francisco, CA: Jossey-Bass.Scott, J. C. (1998). Seeing like a state: How certain schemes to improve the human condition have failed. New Haven, CT, and
London: Yale University Press.Sen, A. (1976). Poverty: An ordinal approach to measurement. Econometrica, 44, 219–231.Sen, A. (2000). Development as freedom. New York: Anchor.Srinivasan, T. N. (1994). Human development: A new paradigm or reinvention of the wheel? The American Economic Review,
84, 238–243.Streeten, P., & Burki, S. J. (1978). Basic needs: Some issues. World Development, 6, 411–421.Sullivan, C. (2006). Do investments and policy interventions reach the poorest of the poor? In P. Rogers (Ed.),Water crisis: Myth
or reality? (vol. 1, pp. 221–231). London: Taylor and Francis.Szal, R. (1979). Popular participation, employment and the fulfilment of basic needs. International Labour Review, 118, 27–38.Trauer, T., & Mackinnon, A. (2001). Why are we weighting? The role of importance ratings in quality of life measurement.
Quality of Life Research, 10, 579–585.Welsch, H. (2002). Preferences over prosperity and pollution: Environmental valuation based on happiness surveys. Kyklos, 55,
473–494.Winkler, R. L., & Clemen, R. T. (2004). Multiple experts vs multiple methods: Combining correlation assessments. Decision
Analysis, 1, 167–176.Wright, G., Noble, M., & Magasela, W. (2007). Towards a democratic definition of poverty: Socially perceived necessities in
South Africa. Cape Town: HSRC Press.
50 A. Cohen & M. Saisana
Dow
nloa
ded
by [
Indi
an I
nstit
ute
of T
echn
olog
y G
uwah
ati]
at 2
2:54
26
Mar
ch 2
014


![Quantifying Resilience in ATM - SESAR JU · transport was the ‘resilience engineering’ paradigm introduced in 2006 [11], which led to (broader) qualitative modelling of resilience](https://img.pdfslide.net/doc/110x75/5e780c1ebfaa3e71155ae230/quantifying-resilience-in-atm-sesar-ju-transport-was-the-aresilience-engineeringa.jpg)