Embed Size (px)
Citation preview

Quantifying Vent Gas Quantifying Vent Gas FootprintsFootprints
Bruce Peachey, P.Eng.Bruce Peachey, P.Eng.PTAC’s Green ToolboxPTAC’s Green Toolbox
September 29-30th, 2003September 29-30th, 2003

Heavy Oil Vent Quantification Project Project Background Summary of Project Objectives Key Issues and Quantification Factors What Standards are Being Developed? Where we are now? Where we go from here?

Background Nexen Sponsored JIP: Launched through PTAC Target is to Economically Reduce Methane Vents
• First need to understand how much methane there is
Current Participants:• Nexen; Husky; ExxonMobil; Petrovera; CNRL• Budget $75k
Invited Participation by AEUB and SIR Intended that results be made public through
Industry Standards

Methane is Important in Both Alta and Sask
230Mt
16Mt
48Mt 23Mt
160Mt
69Mt
Kyoto Target for Canada?
Emissions?
Population? 69Mt
23Mt
Alta Upstream*Oil&GasTotal &
Methane*
Methane reduction is important- No matter what the target
18Mt9Mt
Sask Upstream*Oil&GasTotal &
Methane*
*Oil &Gas Sector based on NRCan 1997-2020 Emission’s Projection for 2000
Alberta’s ShareOf National Target?
Based on…….?

Vent Quantification Project Main result is to improve quality and
consistency of heavy oil vent gas numbers in use
• Both Produced and Vented Better understand variability observed in vent
measurements and reasons for it• To help understand the numbers and to reduce
variability Increase ability to forecast vent volumes to
facilitate mitigation• Economically manage the opportunities and the
risks

Standards Needed to Improve Data
Estimated Range of Rates Reported for a Well Actually Producing 1000m3/d
0
500
1000
1500
2000
2500
3000
3500
4000
4500
Do Nothing Level 1 - Mininum 24hr test/yr
Level 2 - ImplementBasic Standards
Level 3 - Stabilize &Understand Vents
Pro
du
ce
d G
as
(m
3/d
)
+/- 50%
+/- 20%+/- 10%
+400?% to -100?%
Saskatchewan
Alberta

Key Findings - Factor #1
Well Profile Types (24-hour tests)• Type A - Best Results - Repeatable GOR’s• Type B - Pumped-off wells (Assumed)• Type C - Gas Well Behaviour• Type D - Mix of Behaviours - Operational Impacts?
• Type F - Difficult to Explain at this Point

Type A - Avg 694 m3/d (720-684) Est. 75-80% of wells
541
0
2
4
6
8
10
12
Average Rate = 694 m3/dMax = 720Min = 684
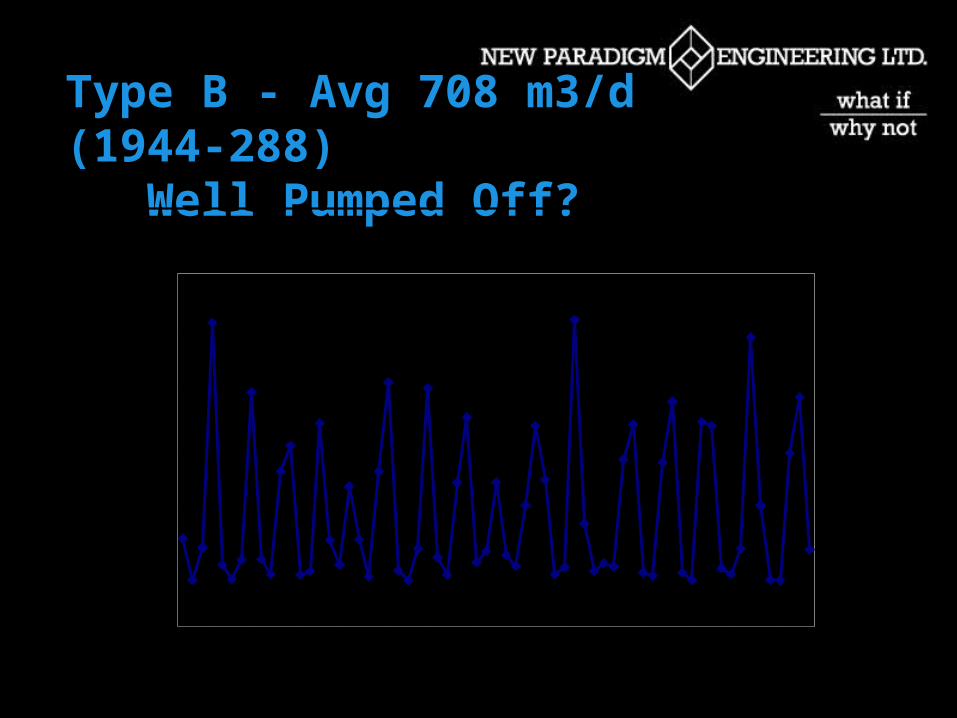
Type B - Avg 708 m3/d (1944-288) Well Pumped Off?
455
0
5
10
15
20
25
30

Type C - Gas Well BehaviourWells on Same Lease; Tested at the Same Time; Diverted from Compression
Three Wells in Same Section - Same time interval
0
50
100
150
200
250
300
350
400
450
500
10:2
0:00
11:0
0:00
11:4
0:00
12:2
0:00
13:0
0:00
13:4
0:00
14:2
0:00
15:0
0:00
15:4
0:00
16:2
0:00
17:0
0:00
17:4
0:00
18:2
0:00
19:0
0:00
19:4
0:00
20:2
0:00
21:0
0:00
21:4
0:00
22:2
0:00
23:0
0:00
23:4
0:00
0:20
:00
1:00
:00
1:40
:00
2:20
:00
3:00
:00
3:40
:00
4:20
:00
5:00
:00
5:40
:00
6:20
:00
Gas Flow Averages31,635 m3/d3,409 m3/d2,997 m3/d
Rates (m3/d)Well #1 Avg 25,635 (31,680-23,400)Well #2 Avg 3,409 (11,664 - 1,728)Well #3 Avg 2,997 (10,080 - 1,944)
Well #1
Well #2
Well #3

Type D - Operational Changes?
521
0
2
4
6
8
10
12
14
16
18
20
10:0
0:00
11:0
0:00
12:0
0:00
13:0
0:00
14:0
0:00
15:0
0:00
16:0
0:00
17:0
0:00
18:0
0:00
19:0
0:00
20:0
0:00
21:0
0:00
22:0
0:00
23:0
0:00
0:00
:00
1:00
:00
2:00
:00
3:00
:00
4:00
:00
5:00
:00
6:00
:00
7:00
:00
Average Rate = 557 m3/dMax = 1296Min = 288
514
0
1
2
3
4
5
6
7
8
8:40
:00
9:40
:00
10:4
0:00
11:4
0:00
12:4
0:00
13:4
0:00
14:4
0:00
15:4
0:00
16:4
0:00
17:4
0:00
18:4
0:00
19:4
0:00
20:4
0:00
21:4
0:00
22:4
0:00
23:4
0:00
0:40
:00
1:40
:00
2:40
:00
3:40
:00
4:40
:00
5:40
:00
6:40
:00
Average Rate = 225 m3/dMax = 540 m3/dMin = 108 m3/d
Example 1 - Type C?Vent Valve Adjustment?Avg 225 m3/d(540-108)
Pump Speed Change?Example 2 - Type A? or B?Avg 557 m3/d(1,296-288)

Type F - Avg 1,253 m3/d (6,264-0)Older wells? - Pumping Problems? Trapped Flow? Vent on Another Well Shut-in?
533
0
10
20
30
40
50
60
70
80
90
100
8:00
:00
9:00
:00
10:0
0:00
11:0
0:00
12:0
0:00
13:0
0:00
14:0
0:00
15:0
0:00
16:0
0:00
17:0
0:00
18:0
0:00
19:0
0:00
20:0
0:00
21:0
0:00
22:0
0:00
23:0
0:00
0:00
:00
1:00
:00
2:00
:00
3:00
:00
4:00
:00
5:00
:00
6:00
:00
7:00
:00
Average Rate = 1253 m3/dMax = 6264Min =0

Key Findings - Factor #2 Impacts of Well Phases (Working Theory)
• Early Production - Near well oil being produced, fine foam (Dream Whip)
• Established Cold Heavy Oil Production (CHOP) - Sand production causes flow channels or wormholes, coarse foam (Beer suds)
• Late Production - Oil and gas separate in the reservoir, slug flow, trapped flow, interwell communication (End of the shaving foam can)

Well #2 - Early Phase & Established
Well #2 2001
0
200
400
600
800
1000
1200
7/5/
01
7/12
/01
7/19
/01
7/26
/01
8/2/
01
8/9/
01
8/16
/01
8/23
/01
8/30
/01
9/6/
01
9/13
/01
9/20
/01
9/27
/01
10/4
/01
10/11
/01
10/1
8/01
10/2
5/01
11/1
/01
11/8
/01
11/1
5/01
Gas
Rat
e M
3/d
0
20
40
60
80
100
120
140
160
GO
R &
Oil
Rat
e (m
3/d)
GAS
GOR
PROD_VOL
Well #2
0
200
400
600
800
1000
1200
6/10
/02
6/17
/02
6/24
/02
7/1/
02
7/8/
02
7/15
/02
7/22
/02
7/29
/02
8/5/
02
8/12
/02
8/19
/02
8/26
/02
9/2/
02
9/9/
02
9/16
/02
9/23
/02
9/30
/02
10/7
/02
10/1
4/02
Gas
Rat
e (m
3/d
)
0.00
20.00
40.00
60.00
80.00
100.00
120.00
140.00
160.00
GO
R &
Oil
Rat
e (m
3/d
)
GAS
GOR
PROD_VOL
Summer 2001No gas venting from annulus
All from tank?
Summer 2002Gas venting from annulus
Relatively Stable GOR

Well #3 - Established CHOP Production
Well#3 2001
0
100
200
300
400
500
600
7/5/
01
7/12
/01
7/19
/01
7/26
/01
8/2/
01
8/9/
01
8/16
/01
8/23
/01
8/30
/01
9/6/
01
9/13
/01
9/20
/01
9/27
/01
10/4
/01
10/11
/01
10/1
8/01
10/2
5/01
11/1
/01
11/8
/01
11/1
5/01
Gas
Rat
e (m
3/d
)
0
20
40
60
80
100
120
140
160
GO
R &
Oil
Rat
e (m
3/d
)
GAS
PROD_VOL
GOR
Well #3
0
100
200
300
400
500
600
6/7/
02
6/14
/02
6/21
/02
6/28
/02
7/5/
02
7/12
/02
7/19
/02
7/26
/02
8/2/
02
8/9/
02
8/16
/02
8/23
/02
8/30
/02
9/6/
02
9/13
/02
9/20
/02
9/27
/02
10/4
/02
10/11
/02
Gas
Rat
e (m
3/d
)
0
20
40
60
80
100
120
140
160
GO
R &
Oil
Rat
e (m
3/d
)
GAS
PROD_VOL
GOR
Likely bad oil rate 2 recorded instead of 7
Summer 2001Stable GOR
Summer 2002Higher oil and gas rates
Same stable GOR

Well #4 - Instability due to Pump
#4 2001
0
100
200
300
400
500
600
700
800
7/6/
01
7/13
/01
7/20
/01
7/27
/01
8/3/
01
8/10
/01
8/17
/01
8/24
/01
8/31
/01
9/7/
01
9/14
/01
9/21
/01
9/28
/01
10/5
/01
10/1
2/01
10/1
9/01
10/2
6/01
11/2
/01
11/9
/01
11/1
6/01
Gas
Rat
e (m
3/d
)
0
20
40
60
80
100
120
140
160
180
GO
R &
Oil
Rat
e (m
3/d
)
Gas
GOR
PROD_VOL
Well #4 GOR
0
100
200
300
400
500
600
700
800
6/8/
02
6/15
/02
6/22
/02
6/29
/02
7/6/
02
7/13
/02
7/20
/02
7/27
/02
8/3/
02
8/10
/02
8/17
/02
8/24
/02
8/31
/02
9/7/
02
9/14
/02
9/21
/02
9/28
/02
10/5
/02
10/1
2/02
Gas
Rat
e (m
3/d
)
0
20
40
60
80
100
120
140
160
180
GO
R &
Oil
Rat
e (m
3/d
)
Gas
PROD_VOL
GOR
Only Recorded Pump Speed Changes over 17 months:01-06-01 to 01-09-21 - 220 rpm01-09-22 to 02-02-11 - 200 rpm02-02-12 to 02-08-16 - 145 rpm02-08-17 to 02-11-01 - 135 rpm (see arrow)
Orifice Plate Change
Summer 2001Stable GOR
Summer 2002Pump Failing then ReplacedCauses Type D/F Behaviour

Well #5 - Transition Between Phases
Well#5 2001
0
100
200
300
400
500
600
700
800
900
6/15
/01
6/22
/01
6/29
/01
7/6/
01
7/13
/01
7/20
/01
7/27
/01
8/3/
01
8/10
/01
8/17
/01
8/24
/01
8/31
/01
9/7/
01
9/14
/01
9/21
/01
9/28
/01
10/5
/01
10/1
2/01
10/1
9/01
10/2
6/01
11/2
/01
11/9
/01
11/1
6/01
Gas
Rat
e (m
3/d
) &
RP
M
0
20
40
60
80
100
120
140
160
180
GO
R &
Oil
Rat
e (m
3/d
)
Gas
SPM_RPM
PROD_VOL
GOR
Well #5 GOR
0
100
200
300
400
500
600
700
800
900
Gas
Rat
e (m
3/d)
0
20
40
60
80
100
120
140
160
180
GO
R &
Oil
Rate
(m3/
d) Gas
SPM_RPM
PROD_VOL
GOR
Summer 2001Transition from Early Phase
Balance of Gas to Tank?
Summer 2002Production Stabilizing
GOR Becoming more Stable

Well #6 and #7 - Late Phase CHOP Lost?
Well #6
0
500
1000
1500
2000
2500
3000
3500
Date
Gas
Pro
du
ctio
n (
m3/
d)
0
1
2
3
4
5
6
7
8
Oil
& W
ater
Pro
du
ctio
n (
m3/
d)
Gas(m3/d)
Oil (m3)
28 per. Mov. Avg. (Gas(m3/d))
28 per. Mov. Avg. (Oil (m3))
Well #7
0
500
1000
1500
2000
2500
3000
3500
4000
Date
Gas
Pro
du
ctio
n (
m3/
d)
0
2
4
6
8
10
12
14
Oil
Pro
du
ctio
n (
m3/
d)
Gas(m3/d)
Oil (m3/d)
28 per. Mov. Avg. (Gas(m3/d))
28 per. Mov. Avg. (Oil (m3/d))
Oil = 0.44 m3/dGOR = 1193 m3/m3WOR=0.8 m3/m3
Oil = 0.82 m3/dGOR = 1495 m3/m3WOR=2.1 m3/m3

Key Findings - Factors #3-6 Obtaining a Well GOR
• Accounting for Fuel Use - Should be proportional to production and single source
• Tank Vents - Suggested add 5% to Type A for Established CHOP Phase. Others?????
• Meters Used - Standardized methods and configurations for various types of meters used.
• Oil Rate Used - Ensure rate is stable and matches conditions during the period of gas measurement.

Suggested Format for Standards Basic Content for each Key Area
• Why – The standard is necessary• When – Is the standard applied • Who – Is responsible for what; who is affected• What – Should be done in what order• Where – Should the standard be used• How – Should the work be done
Clear Language – Minimum length to do the job Adjust based on end-user targeted
• Operators, technical staff, management, admin

Key Area – Regulations and Assessment Separate Standards for each Province Target – Those who manage operations Content:
• Minimum spec for triggers to require a test• Measurement accuracy required• Frequency of testing• Royalty rules• Any mandated assessment requirements for
conservation or license impacts

Key Area – Criteria for a Successful Test Should be the same independent of province Target – Field Technical, Operators, 3rd Party
Testers Content:
• Description of flow types and causes• Description of allowable Type A
» Deviation from average
• Data collected to document test and allow adjustment for fuel use etc.
• Checklist• What to do if test not acceptable

Key Area – Testing Non-A Type Independent of Province Target – Technical staff controlling testing Type C – Gas Well Behaviour
• Initial test procedure with imposed step change in pressure (up or down)
• Standards for continuous testing Type F – Sporadic Gas Flow
• Needs more work to define• Assess by grouping wells in an area?• Simultaneous testing of wells thought to be
linked?

Key Area - Metering Equipment By type of meter being used Target – Technical staff controlling testing Content:
• Basic properties of meter• Minimum features meter should have• Minimum specs for test set-up• Set-up based on flow ranges and stream being
measured – Tank, total or vent to atmosphere• Calculations and factors to be used specific to
heavy oil and low pressures

Key Area – Maintaining Revising Standards Separate for H.O. Producers or Integrate with
other Standards Groups? Target – Industry group of knowledgeable people Content:
• Reference to available information on each issue area
• Triggers to revise standards• Issues to investigate further• Consensus process for setting and rolling-out
revisions

Example - Photon Control – New Atmospheric Gas Flow Meters
1” pipe optical gas flow meterTCPL & Daniel 4” optical plate
Based on technology developed by NOVABeing developed by Photon Control - Vancouver Project supported by Husky for Vents

Where are we now? Working on drafts of standards Investigating some issues that are still
unresolved Documenting observations to date Defining potential follow-up projects to
improve quality of information and analysis Planning for roll out of standards once they
are completed and reviewed by participants.

Where do we go from here? Producers need to assess use of vent gas
measurement to:• Produce more oil - Improved understanding of CHOP Mechanism
• Reduce operating costs - Use gas to monitor pump operation and extend run life
Move the standards into widespread use Once initial standards are implemented
monitor results and revise standards if necessary
Vent Gas Footprints - Summary Defining the footprint of an emission stream
can lead to insights and understanding Collaboration provides insights by bringing
in data and opinions from a number of sources.
Results should lead to increased vent gas conservation and improve the economics of heavy oil production
Similar methods might be applied to other vent streams (Dehydrators and Tanks)

Acknowledgements Nexen (Garry Mann et al) for initiating the
project CNRL, ExxonMobil, Husky and Petrovera
for seeing the benefits of collaboration AEUB and SIR contacts for participating Support from PTAC to launch Support from ADOA Consulting

Contact Information
New Paradigm Engineering Ltd.
10444 - 20 Avenue
Edmonton, Alberta
Canada T6J 5A2
tel: 780.448.9195
fax: 780.462.7297
email: [email protected] or [email protected]
web: www.newparadigm.ab.ca