Embed Size (px)
Citation preview
RESEARCH PAPER
Quantitation of five organophosphorus nerve agent metabolitesin serum using hydrophilic interaction liquid chromatographyand tandem mass spectrometry
Elizabeth I. Hamelin & Nicholas D. Schulze & Rebecca L. Shaner &
Rebecca M. Coleman & Richard J. Lawrence & Brian S. Crow &
E. M. Jakubowski & Rudolph C. Johnson
Received: 25 November 2013 /Revised: 7 February 2014 /Accepted: 17 February 2014# Springer-Verlag Berlin Heidelberg (outside the USA) 2014
Abstract Although nerve agent use is prohibited, concernsremain for human exposure to nerve agents duringdecommissioning, research, and warfare. Exposure can bedetected through the analysis of hydrolysis products in urineas well as blood. An analytical method to detect exposure tofive nerve agents, including VX, VR (Russian VX), GB(sarin), GD (soman), and GF (cyclosarin), through the analy-sis of the hydrolysis products, which are the primary metab-olites, in serum has been developed and characterized. Thismethod uses solid-phase extraction coupled with high-performance liquid chromatography for separation and isoto-pic dilution tandem mass spectrometry for detection. An un-common buffer of ammonium fluoride was used to enhanceionization and improve sensitivity when coupled with hydro-philic interaction liquid chromatography resulting in detectionlimits from 0.3 to 0.5 ng/mL. The assessment of two qualitycontrol samples demonstrated high accuracy (101–105%) andhigh precision (5–8 %) for the detection of these five nerveagent hydrolysis products in serum.
Keyword Organophosphorus nerve agents . Metabolites .
Serum . Exposure
Introduction
Organophosphorus nerve agents are highly toxic compoundsthat were originally developed as potent pesticides in the1930s. Since that initial discovery, more nerve agents havebeen synthesized and stockpiled for warfare purposes.Although use of these compounds has been limited in recentyears [1], concerns remain that nerve agents will be used fornonsanctioned warfare or terrorist activities. Stockpilesthroughout the world are gradually being decommissioned[1], and laboratory research to improve treatments for exposedpersons is being pursued [2, 3]. These activities may result inaccidental human contact with nerve agents; therefore, theimproved and expanded ability to assess human exposure tonerve agents is needed.
Following entry into the human body, nerve agents areeither hydrolyzed or bound to acetylcholinesterase, butyryl-cholinesterase, and other nonspecific proteins. The binding tothe acetylcholinesterase is the action that results in symptomsincluding miosis, seizures, and potentially death [1]. Thehydrolysis products, also known as nerve agent metabolites,are readily excreted in the urine, but have also been detected inblood [4–6]. More specifically, human exposure to VX wasidentified in serum using gas chromatography/mass spectrom-etry (GC/MS) to measure the hydrolysis product, ethylmethylphosphonic acid. In this exposure case which resultedin death, the amount of metabolite from VX was determinedto be 125 μg/mL [5]. Additionally, the hydrolysis productswere detected in minipig blood using liquid chromatography-
Published in the topical collection Analysis of Chemicals Relevant to theChemical Weapons Convention with guest editors Marc-Michael Blumand R. V. S. Murty Mamidanna.
E. I. Hamelin (*) :R. L. Shaner :B. S. Crow :R. C. JohnsonDivision of Laboratory Sciences, National Center for EnvironmentalHealth, Centers for Disease Control and Prevention, 4770 BufordHwy, Atlanta, GA 30341, USAe-mail: [email protected]
N. D. Schulze : R. M. ColemanORISE (Oak Ridge Institute for Science and Education), Oak Ridge,TN 37831, USA
R. J. Lawrence : E. M. JakubowskiU.S Army Edgewood Chemical Biological Center, R&TDirectorate,Aberdeen Proving Ground, Aberdeen, MD 21010, USA
Anal Bioanal ChemDOI 10.1007/s00216-014-7702-2

tandem mass spectrometry (LC/MS/MS) [4] following expo-sures to sarin and cyclosarin.
These hydrolysis compounds have been extensively quan-titated in urine through various analytical methods. Gas chro-matography coupled with mass spectrometry or tandem massspectrometry has been used with success, although a deriva-tization step is required [7–9]. To avoid the additional deriv-atization, liquid chromatography coupled with mass spec-trometry or tandem mass spectrometry has been applied,achieving sensitivities on the order of pg/mL in urine [10–13].
In most cases, sample preparation, including liquid-liquidextraction (LLE) and solid-phase extraction (SPE), was nec-essary to achieve these low levels of detection. Solid-phaseextraction was cited more often than LLE, most likely due tothe ease of use and potential for automation. The differentsolid-phase extraction methods used for these compoundsincluded aqueous normal phase [10, 11], reversed phase [4],anion exchange [12, 14], and zirconia [14, 15]. However, forthe extraction of nerve agent metabolites from serum, onlyLLE and reversed-phase SPE were used [4–6].
An analysis method which includes the other nerve agentmetabolites resulting from soman and VR exposure is needed,since only three nerve agent metabolites, EMPA, IMPA, andCMPA, were previously quantitated in serum [4–6]. Althoughthe amount of metabolite present in biological matrices hasnot been related to dose in humans, a quantitative value is stilldesired to obtain as much information regarding the relativeamount of exposure as possible to differentiate between ex-posed and unexposed persons. Given this focus, an assay withhigh sensitivity is desired above a quantitative method de-signed to capture all exposure levels. Additionally, this meth-od should detect exposure to all five nerve agents within asingle, high-throughput, and automated analysis. This studydocuments the development of a SPE-LC/MS/MS analysis forfive nerve agent hydrolysis products in human serum whichare indicative of exposure to sarin (GB), soman (GD),cyclosarin (GF), VX, and VR.
Methods and materials
Materials
The analytes evaluated for this method were the following:ethyl methylphosphonic acid (EMPA, CAS 1832-53-7), themetabolite of VX (O-ethyl S-(2-diisopropylaminoethyl)methylphosphonothioate, CAS 50782-69-9); isopropylmethylphosphonic acid (IMPA, CAS 1832-54-8), the metabo-lite of GB (isopropyl methylphosphonofluoridate CAS 107-44-8); pinacolyl methylphosphonic acid (PMPA, CAS 616-52-4),the metabolite of GD (pinacolyl methylphosphonofluoridate,CAS 96-64-0); cyclohexyl methylphosphonic acid (CMPA,CAS 1932-60-1), the metabolite of GF (cyclohexyl
methylphosphonofluoridate, CAS 329-99-7); and2-(methyl)propyl methylphosphonic acid (MMPA, CAS1604-38-2), the metabolite of VR (O-2-(methyl)propyl S-2-(diethylaminoethyl) methylphosphonothioate, CAS 159939-87-4).
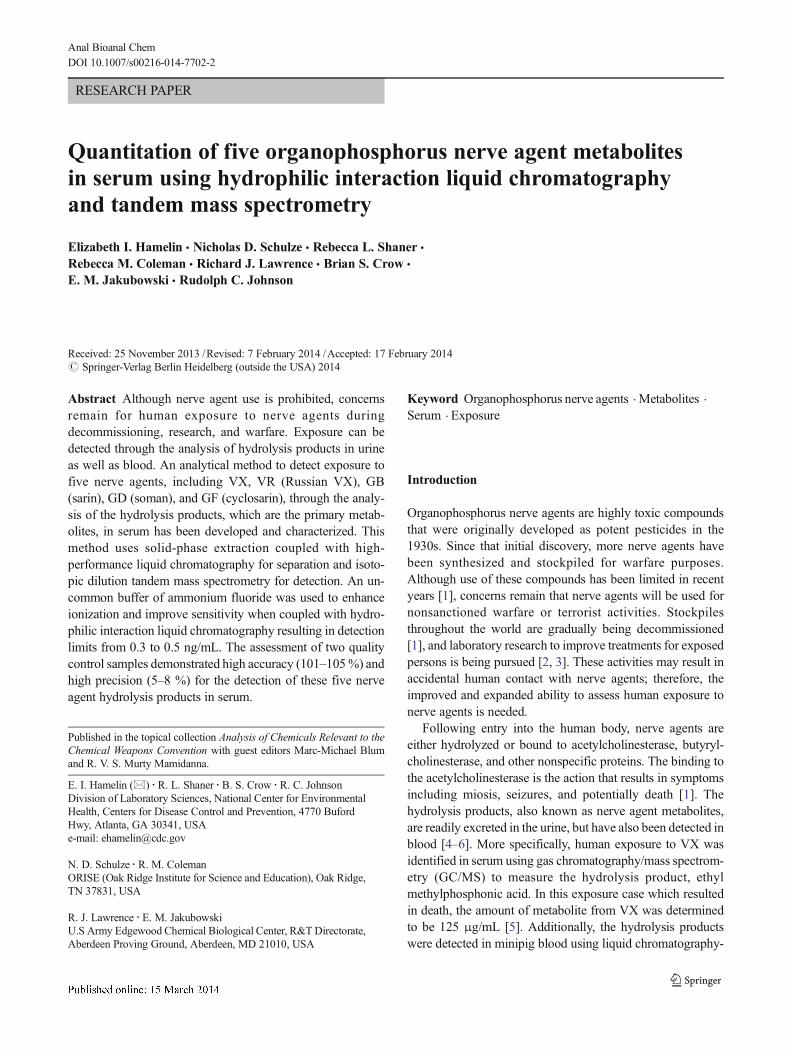
The internal standards were isotopically labeled as follows:EMPA, ethyl-D5; IMPA, isopropyl-13C3; PMPA,trimethylpropyl-13C6; CMPA, cyclohexyl-13C6; and IMPA,methylphosphonyl-13C. The structures of the organophospho-rus metabolites and internal standards are shown in Fig. 1.
The analytical calibrators were prepared at concentrationsof 0.5, 1.0, 2.0, 5.0, 10, 25, 50, and 100 ng/mL of each analytein serum; the quality control samples were prepared at 4.0 and40 ng/mL of each analyte in serum. A primary stock (20 μg/mL of each analyte in methanol) purchased from CerilliantCorporation (Round Rock, TX) was used to make stocksolution I (4.0 μg/mL) and stock solution II (0.2 μg/mL).Stock solution I was prepared by aliquoting 400 μL of a20-μg/mL stock to a glass vial containing 1,600 μL of serum.The second stock solution was prepared by pipetting 100 μLof stock solution I to a glass vial containing 1,900 μL ofserum. Calibrators of 0.5, 1.0, 2.0, and 5.0 ng/mL were madeby aliquoting 25, 50, 100, and 250 μL, respectively, of stocksolution II to 10.0-mL volumetric flasks. Calibrators of 10, 25,50, and 100 ng/mL were prepared by delivering 25, 63, 125,and 250 μL, respectively, of stock solution I to their appro-priate 10.0-mL volumetric flask. Quality control low (4.0 ng/mL) and quality control high (40 ng/mL) were prepared byadding 200 μL of stock solution II and 100 μL of stocksolution I, respectively, to 10.0-mL volumetric flasks. Anadditional solution was prepared at 0.25 ng/mL in serum toevaluate the limits of detection for the assay, by delivering17 μL of stock solution II to a 10.0-mL volumetric flask.Spiked samples, 0.75 and 3.0 ng/mL, were prepared byaliquoting 37.5 and 150 μL of stock solution II to theirrespective 10.0-mL volumetric flask. Spiked samples, 15,70, and 90 ng/mL were prepared by delivering 37.5, 175,and 225 μL of stock solution I into their respective 10.0-mLvolumetric flasks. All volumetric flasks were filled to 10.0 mLusing serum purchased from Tennessee Blood ServicesCorporation (Memphis, TN). The serum was pooled from fivedonors, shipped at 4 °C, received 2 days later, and subsequent-ly stored at −20 °C until use. Once prepared, all fortifiedsamples, calibrators, and quality control samples were main-tained at −20 °C.
Internal standard was prepared by dilution of a 500-ng/mLaqueous mixture (Cerilliant Corporation, Round Rock, TX) toa concentration of 23.8 ng/mL in DI water.
Organic-free 18.2-MΩ type I water from a purifier pur-chased from Aqua Solutions, Inc. (Jasper, GA) was used inthese studies. Pelletized 98 % ammonium fluoride was pur-chased from Alfa Aesar (Ward Hill, MA) and molecularbiology-grade DEPC-treated 5 M ammonium acetate from
E.I. Hamelin et al.
CalBiochem (La Jolla, CA). High-performance liquid chro-matography (HPLC)-grade acetonitrile and methanol werepurchased from Tedia (Fairfield, OH). All human serum waspurchased from Tennessee Blood Services Corporation(Memphis, TN).
Sample preparation
To prepare samples for extraction, 25 μL of a 23.8-ng/mLinternal standard was aliquoted into each well of a 2-mL 96-well Nunc plate. Fifty microliters of a well-mixed serum wasadded to the internal standard, followed by 1,000 μL ofacetonitrile. The plate was sealed using a sheet of ThermoScientific Adhesive PCR Sealing Foil (Hudson, NH) andvortexed for 5 min on a ThermoLab Systems Wellmix(Hudson, NH). The Nunc plate was then centrifuged for5 min at 3,000 rpm.
The solid-phase extractionwas automated by using the LifeScience Zephyr (Hopkinton, MA). The Phenomenex StrataSi-1 SPE 96-well plate (55 μM, 70 Å, 100 mg) was pretreatedwith 1,000 μL of 25 % water in acetonitrile, followed by1,000 μL of acetonitrile. The entire sample mixture withprecipitate was then loaded to the SPE 96-well plate andrinsed by a two-step process of 1,000 μL of acetonitrile,followed by 1,000 μL of 7 % water in acetonitrile. Thesolutions were pulled through the SPE 96-well plate usingvacuum. The analytes were then eluted with 1,000 μL of 28%water in acetonitrile and collected in a clean 96-well Nuncplate.
The eluent was heated at 70 °C under 25 L/min of nitrogenin a TurboVap for 30 minutes and then evaporated to drynessafter increasing the flow rate to 70 L/min. The lower initialflow rate eliminated solvent splashing. The sample was thenreconstituted in 100 μL of 5 % water in acetonitrile, mixed bypipetting twice, and transferred to a 150-μL 96-well PCRplate and sealed.
Instrumental analysis
The HPLC separation was performed using an Agilent 1200HPLC with a well-plate autosampler (Santa Clara, CA). AWaters Atlantis® HILIC 2.1-mm×50-mmwith 3-μm particles(70 % porosity) HPLC column was used (Milford, MA). Thishydrophilic interaction chromatography (HILIC) column con-sists of high-purity, nonbonded silica particles. The injectorwas programmed to draw 20 μL of sample, and the injectorneedle was washed for 10 s in the wash port using 50 % waterin acetonitrile. The sample was then injected onto the columnusing an isocratic mobile phase consisting of 92 % acetonitrileand 8 % 1.0 mM ammonium fluoride with an initial flow rateof 500 μL/min. Following elution of the analytes, the flow ratewas increased to 1,000 μL/min at 3.01 min to remove any lateeluting impurities. The flow rate returned to 500 μL/min at5.01 min to ensure stable pressure for the following injection.This method allows a 5-min injection-to-injection cycle time.
The mass spectrometric analysis was performed using anAPI 4000 triple quadrupole QTrap mass spectrometer fromApplied Biosystems (Foster City, CA) controlled by Analystsoftware. The mass spectrometer was operated in multiple-
PMPA
OCH2CH3
P
O
OH CH3
OCD2CD3
P
O
OH CH3
O
P
O
OH CH3
CH3 CH3
O
P
O
OH CD3
CH3 CH3
O
P
O
OH CH3
CH3
CH3 O
P
O
OH CH3
CH3
CH3O
P
O
OH CH3
CH3
CH3 CH3
CH3
O
P
O
OH CH3
CH3
CH3 CH3
CH3
P CH3OH
O
P CH3OH
O
EMPA EMPA ISTD
MMPA MMPA ISTD
CMPA CMPA ISTD
PMPA ISTD IMPA IMPA ISTD
Fig. 1 Structures of nerve agentmetabolites and correspondinginternal standards, asterisk=13C
Quantitation of five organophosphorus nerve agent metabolites

reactionmonitoring (MRM)mode using negative electrosprayionization with assisted heating. The specific operating con-ditions are listed in Table 1 with the proposed fragment ions.
The specific settings used were curtain gas (CUR), 10 psi;nebulizer gas (GS1), 40 psi; turbo gas (GS2), 40 psi; GS2temperature (TEM), 550 °C; collision gas, nitrogen; collisiongas (CAD), Medium, producing a gas pressure reading of3.3×10−5 Torr; ion spray potential (IS), −4,500 V; entrancepotential (EP), −10; and interface heater (IHE), on.
The data were analyzed using Analyst 1.5.2, which wasprovided with the instrument. This software is used to reviewthe chromatograms for retention times, baselines, and possibleinterferences. Quantitative analysis of the data by automatedand manual integrations, linear regression, and calculation ofaccuracies and correlation coefficients was also performedwith this software package. The chromatographic data weresmoothed three times prior to integration with a bunchingfactor between 1 and 3 and fitted by linear regression using1/x weighting.
Safety precautions
The techniques and materials in this method do not pose anyspecial hazards. General considerations include exercisinguniversal precautions, such as wearing appropriate personalprotective equipment, when handling chemicals and serumsamples. The high voltage employed in the electrospray ion-ization should also be considered a hazard, and the safetyinterlocks provided by the instrument manufacturer shouldnot be altered. For instrument-specific safety concerns, pleaseconsult the manufacturer.
Results and discussion
Sample preparation
Initial evaluation of a protein precipitation using acetonitrileor acetone for the sample preparation of these compoundsfrom serum resulted in lower sensitivities than desired. Asexposures may be small and/or a sample may be collectedmany hours to days following exposure, it is important to havethe highest sensitivity possible. Additionally, the presence ofinterfering matrix components was detected in select transi-tions, which would negatively impact the specificity of theanalysis. To accomplish the goals of sensitivity and specific-ity, additional sample preparation was necessary.
Solid-phase extraction was selected for sample preparationdue to automation and high-throughput potentials. The initialsolvents and volumes used for the extraction were selectedfrom Swaim et al. [10] from urine sample extraction. Thesorbent was conditioned with 1,000 μL of 25 % water inacetonitrile, followed by 1,000 μL of acetonitrile. After thesample mixture (comprised of 100 μL of serum, 25 μL ofinternal standard solution, and 1,000 μL of acetonitrile) wasloaded, the sorbent was rinsed with 1,000 μL of acetonitrile,followed by 1,000 μL of 10 % water in acetonitrile. Finally,the compounds were eluted using 1,000 μL of 25 % water inacetonitrile and collected in a 2-mL 96-well Nunc plate. Usinga serum matrix fortified at 10 ng/mL, each step within thesolid-phase extraction protocol was then evaluated in triplicatefor optimal recovery. To evaluate the loading step, 50 μL ofserum was diluted with acetonitrile, with additional deionizedwater as needed, to yield an aqueous solution of 7, 12, and17 %. The 7 % aqueous loading solution resulted in the
Table 1 Mass spectrometrictransitions and parameters Analyte Precursor
ion (m/z)Production (m/z)
Declusteringpotential (V)
Collisionenergy (V)
Collision cell exitpotential (V)
EMPA–quantitation 123 95 −50 −18 −7EMPA–confirmation 123 79 −50 −36 −11EMPA–internal std 128 96 −50 −20 −7IMPA–quantitation 137 95 −55 −20 −7IMPA–confirmation 137 79 −55 −54 −11MIPA–internal std 140 95 −55 −20 −7MMPA–quantitation 151 95 −70 −22 −13MMPA–confirmation 151 77 −70 −28 −13MMPA–internal std 155 99 −70 −22 −13PMPA–quantitation 179.1 95 −50 −24 −15PMPA–confirmation 179.1 77 −50 −46 −13PMPA–internal std 185.1 95 −50 −24 −15CMPA–quantitation 177.1 95 −60 −28 −15CMPA–confirmation 177.1 63 −60 −54 −15CMPA–internal std 183.1 95 −60 −28 −15
E.I. Hamelin et al.
highest responses with no detected breakthrough. Next, thesecond wash step was assessed at acetonitrile content rangingfrom 93 to 83%. The wash step of 93% of acetonitrile yieldedthe highest recoveries with minimal losses detected. No ad-justments were made to the elution composition as completeelution was achieved in one step with the 25 % water/75 %acetonitrile mixture. Final extraction recoveries, determined at10.0 ng/mL and calculated by the ratio of the measuredconcentration to the spiked concentration, were as follows:EMPA, 88 % (standard deviation of 17); IMPA, 76 % (13);MMPA, 92 % (9.6); PMPA, 94 % (10); and CMPA, 95 %(7.7). With the optimized solid-phase extraction parameters,no analyte was detected within the two captured wash steps.Following the elution, a second elution step was evaluated toremove the analytes still remaining on the SPE. This secondelution showed minimal (<1 %) amounts of PMPA, CMPA,and MMPA; approximately 5 % of EMPA; and no detectableIMPA remained on the SPE following the initial elution.
Separation and detection
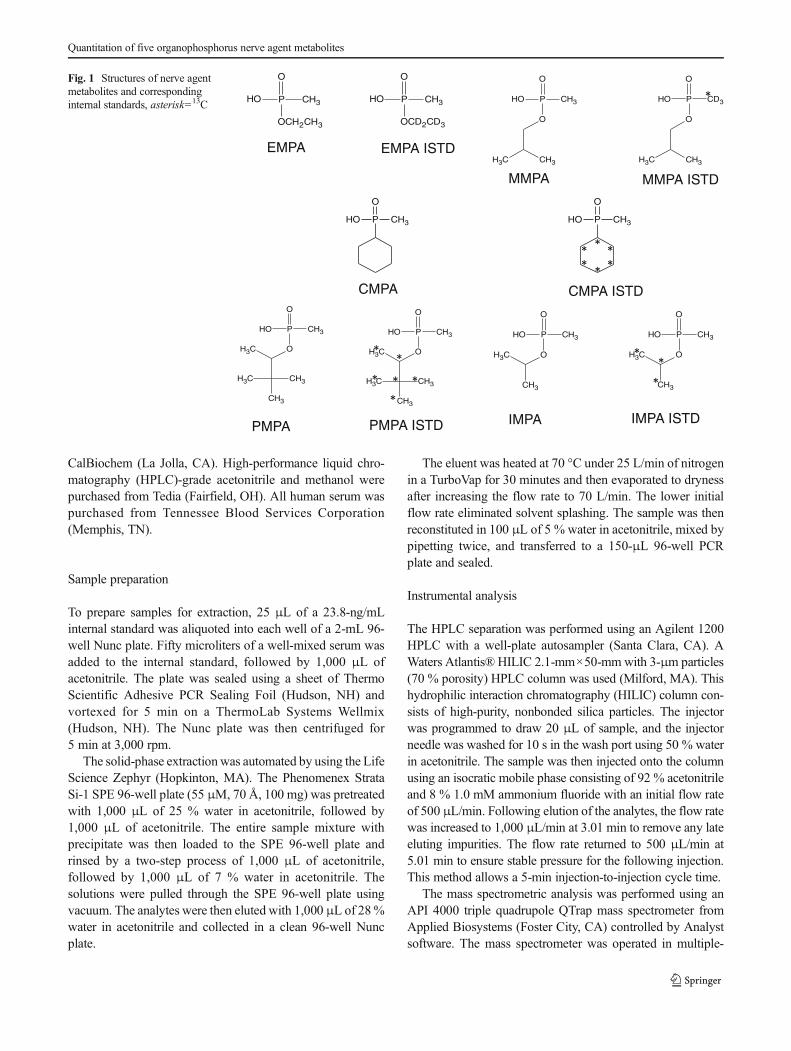
Previous studies have reported successful separation of thesecompounds with HILIC chromatography using an isocraticammonium acetate buffer coupled with acetonitrile (14 %20 mM ammonium acetate/86 % acetonitrile) as the mobilephase [10, 11]. This mobile-phase composition was used as astarting point for the separation of these compounds and isshown in Fig. 2b. Since the mass spectrometric intensity ofthese compounds has been augmented with the addition ofvarious solvents [16] post column, alternative buffers wereinvestigated to determine if increases in response could beachieved. Ammonium fluoride has been reported to result inthe ionization of additional compounds and may, in fact,enhance ionization when using negative electrospray [17,18]. With this information, the HILIC chromatographic sepa-ration was evaluated replacing the 20-mM ammonium acetatebuffer with 1-mM ammonium fluoride buffer. This changeresulted in an increased signal for all compounds (Table 2),with an average of 7.7-fold improvement in peak area
response; a standard deviation of the peak area responsebetween the compounds was found to be 0.77. Using the 1-mM ammonium fluoride increased retention, therefore, tominimize runtime, the isocratic mobile-phase compositionwas adjusted to 8 % 1 mM ammonium fluoride and 92 %acetonitrile to achieve retention factors of 4.6–6.1 (Fig. 2a).This change also resulted in further 2-fold signal increase fromthe 14 % ammonium fluoride mobile phase, which is equiv-alent to at least a 10-fold signal increase (Table 2), indicatingthe impact of higher acetonitrile content on the ionizationefficiency of these compounds.
Method characterization
Twenty sets of calibrators with QC samples were extractedand analyzed by LC-MS/MS to determine the precision andbias of this method over time. Multiple analysts were preparednot more than two standard sets with QC samples per day overa period of 36 days. Quality control characterization data arepresented in Table 3. The inter-day relative standard devia-tions for both quality control samples for all five compoundswere below 8 %, and the accuracy was between 101 and105 % for all compounds. These results confirm that thismethod provides acceptable precision and accuracy for thesecompounds according to the FDA Bioanalytical MethodDevelopment Guidelines [19].
0.5 1.0 1.5 2.0 2.5 3.0 3.5 4.0 4.5
Time, min
0.0
7.0e5
1.3e6
Inten
sity, cps
0.5 1.0 1.5 2.0 2.5 3.0 3.5 4.0 4.5
Time, min
0.0
7.0e5
1.3e6
Inten
sity, cps MMPA EMPA
IMPA
PMPA
CMPAMMPA
EMPA
IMPA
PMPA
CMPAa b
Fig. 2 Chromatograms of a 100-ng/mL calibrator in serumcontaining five nerve agentmetabolites in different mobile-phase compositions: a 8 %ammonium fluoride (1 mM)/92%acetonitrile and b 14 %ammonium acetate (20 mM)/86 % acetonitrile
Table 2 Peak area response relative to the buffer composition of 14% 20mM ammonium acetate with 86 % acetonitrile
Ammonium fluoride(1 mM, 14 %) with86 % acetonitrile
Ammonium fluoride(1 mM, 8 %) with92 % acetonitrile
EMPA 7.46 1.81
IMPA 7.24 1.86
MMPA 8.42 1.47
PMPA 8.68 1.39
CMPA 6.92 1.46
Quantitation of five organophosphorus nerve agent metabolites
Limits of detection
The limits of detection (LOD) for the five compounds wereestimated using low-level spiked serum with concentrationsfrom 0.25 to 1.0 ng/mL. Each low-level spiked sample wasanalyzed 20 times within a 2-week period, with not more thanfive replicates within 1 day. The absolute values of the stan-dard deviations were then plotted versus the concentrationwith the intercept of the least-squares fit of this line equal toS0 with 3S0 being the LOD [20]. The LODs for this methodwere determined and reported in Table 3. These estimates,ranging from 0.25 to 0.50 ng/mL, exceed those of othermethods developed for serum which reported limits of detec-tion from 3.9 to 30 ng/mL for EMPA [5, 6] and 16 ng/mL forPMPA and CMPA [7].
Sample analysis
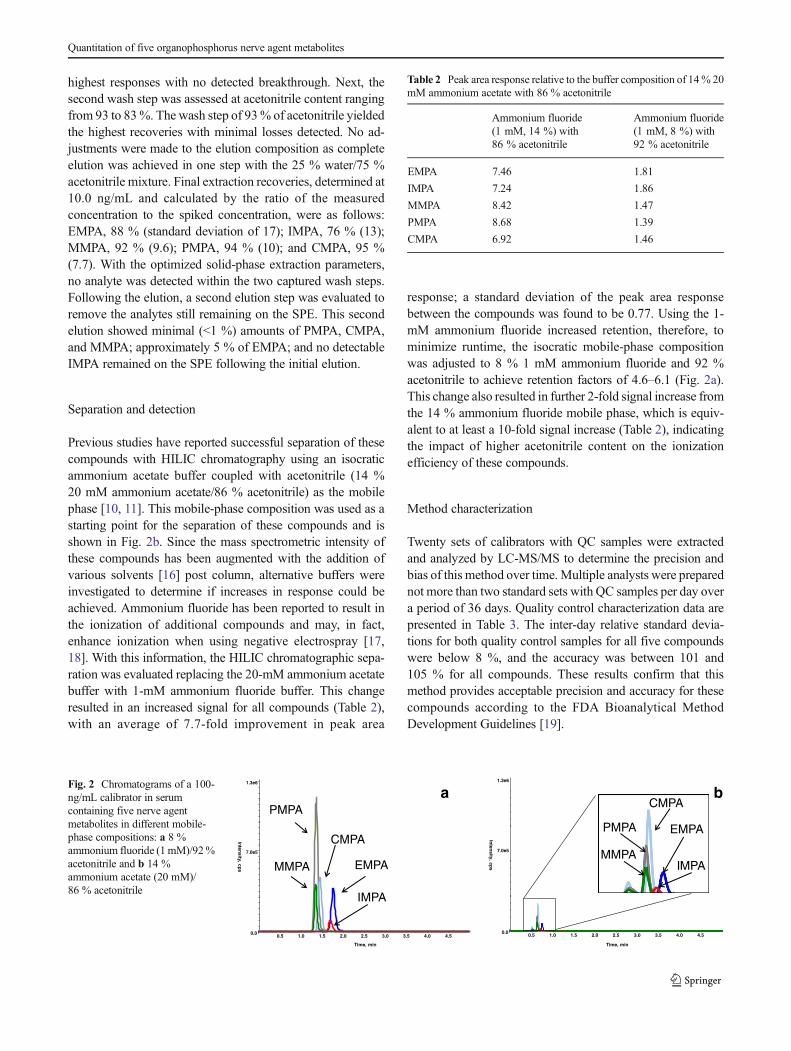
One hundred individual serum samples were extracted andanalyzed to evaluate the presence of nerve agent metabolitesin the serum of persons with no known exposure. A represen-tative sample is shown in Fig. 3. No peaks were observedabove the lowest calibration point; therefore, results above thedetection limit would indicate that an exposure to these com-pounds has occurred.
To evaluate accuracy and precision across the calibrationrange, serum samples were prepared at the following concen-trations: 0.75, 3, 15, 70, and 90 ng/mL. These samples wereextracted and analyzed five times to generate the statisticaldata presented in Table 4. The relative standard deviations forall five levels were less than 10 %, with the exception of the0.75-ng/mL spike of IMPA which resulted in a variance of18 %. Similarly, the four highest levels resulted in accuracybetween 96 and 112 %. However, for the lowest spikedsample at a concentration of 0.75 ng/mL, the accuracies werebetween 78 and 93 %. This drop in accuracy and increase in
variability at the low concentration may be due to the close-ness of the value to the limit of detection.
To widen the application of this method to samples with ametabolite concentration greater than 100 ng/mL, a 4.0-μg/mL fortified sample was prepared in serum. This sample wasdiluted to 4.0 and 40.0 ng/mL using blank serum; the dilutedsamples were then extracted and analyzed in triplicate. Theaverage quantitated values ranged from 3.91 to 4.27 ng/mLand 39.5–41.8 ng/mL for the two levels. When the quantitatedvalues were calculated with the dilution factor, the accuraciesranged from 97.8 to 106 %.
The stability of these compounds in serum stored for6 months at −20 °C was evaluated at 4.0 and 40.0 ng/mL.The stored samples were analyzed in triplicate and quantitatedrelative to freshly prepared calibrators. The concentrations ofthe two levels were within the 10.0 % of the original spikedconcentration for all five analytes. Given the variability of themethod, these results indicated that the metabolites were sta-ble for at least 6 months stored frozen.
Limitations
Due to a high background response resulting from theammonium fluoride buffer, the initial transition selectedfor CMPA (177>79m/z) did not result in a discernible peak
Table 3 Mean, precision (relative standard deviation), accuracy, andlimit of detection (LOD) values for five nerve agent metabolites in serum(n=20)
Analyte Sample Mean Precision (%) Accuracy (%) LOD
IMPA QC low 4.07 8.24 101.7 0.4QC high 40.2 5.51 100.4
PMPA QC low 4.20 5.53 104.9 0.3QC high 40.85 6.37 101.9
CMPA QC low 4.13 5.41 103.3 0.5QC high 40.7 6.10 101.6
EMPA QC low 4.07 7.03 101.6 0.5QC high 40.3 6.21 101.0
MMPA QC low 4.06 5.18 101.4 0.4QC high 40.5 5.72 101.2
0.5 1.0 1.5 2.0 2.5 3.0 3.5 4.0 4.5Time, min
0
4500
8000
Inten
sity, cps
0.5 1.0 1.5 2.0 2.5 3.0 3.5 4.0 4.5Time, min
0.00
5.5E3
1.05e4
Inten
sity, cps
a
b
EMPAMMPA
IMPAPMPA
CMPA
Fig. 3 Chromatograms of a 0.5-ng/mL serum calibrator containing fivenerve agent metabolites (a) and blank serum (b)
E.I. Hamelin et al.

within the reportable range. An alternative transition of177>63m/z was evaluated; however, this new transitionwas only detectable to about 1 ng/mL due to the limitedsignal. Similarly, the confirmatory ion for PMPA was notconsistently identified below 2 ng/mL due to a high back-ground response. Previous publications have indicated thatthis background may be attributed to the impurities withinthe ammonium fluoride used for the buffer and potentiallythe interaction of this buffer with the stationary phase [18].It should be noted that these issues were only detected in theconfirmatory ions and do not affect the reported limits ofdetection for these compounds.
Conclusions
A method to detect exposure to five nerve agents, includ-ing VX, VR, soman (GD), sarin (GB), and cyclosarin(GF) in serum has been developed and evaluated. Thenovel use of ammonium fluoride as the mobile-phasebuffer increased the ionization of the compounds up to10-fold over the use of ammonium acetate, which sub-stantially increased the sensitivity of this assay. Both theresulting precision and accuracy, 8 % and 100–105 %respectively, were within FDA recommendations. Sinceno peaks were detected within 100 individual serum sam-ples with no known exposure to nerve agents, a responseabove the limit of detection is indicative of exposure tonerve agents. Given the potential for blood to clot andlyse, often due to poor handling or storage, which wouldimpact the quality of the serum, future studies are planned
to apply this assay to quantitate nerve agent exposure innonideal blood matrices.
Disclaimer The findings and conclusions in this report are those of theauthors and do not necessarily represent the views of the Centers forDisease Control and Prevention. Use of trade names is for identificationonly and does not imply endorsement by the Centers for Disease Controland Prevention, the Public Health Service, or the US Department ofHealth and Human Services.
References
1. (1989) Medical aspects for chemical and biological warfare; Eds.Office of The Surgeon General: Washington DC
2. Pan H, Hu XZ, Jacobowitz DM, Chen C, McDonough J, Van ShuraK, Lyman M, Marini AM (2012) Alpha-linolenic acid is a potentneuroprotective agent against soman-induced neuropathology.Neurotoxicology 33:1219–1229
3. Perkins MW, Pierre Z, Sabnekar P, Sciuto AM, Song J,Soojhawon I, Oguntayo S, Doctor BP, Nambiar MP (2012)Aerosolized delivery of oxime MMB-4 in combination with atro-pine sulfate protects against soman exposure in guinea pigs. InhalToxicol 24:539–549
4. Evans RA, Jakubowski EM, Muse WT, Matson K, Hulet SW,Mioduszewski RJ, Thomson SA, Totura AL, Renner JA, CrouseCL (2008) Quantification of sarin and cyclosarin metabolites isopro-pyl methylphosphonic acid and cyclohexyl methylphosphonic acidin minipig plasma using isotope-dilution and liquid chromatography-time-of-flight mass spectrometry. J Anal Toxicol 32:78–85
5. Tsuchihashi H, Katagi M, Nishikawa M, Tatsuno M (1998)Identification of metabolites of nerve agent VX in serum collectedfrom a victim. J Anal Toxicol 22:383–388
6. Noort D, Hulst AG, Platenburg DH, Polhuijs M, Benschop HP(1998) Quantitative analysis of O-isopropyl methylphosphonic acid
Table 4 Mean, precision, andaccuracy of spiked serum samples(n=5)
Concentration (ng/mL) EMPA IMPA MMPA PMPA CMPA
0.75 Mean 0.58 0.61 0.64 0.66 0.70
Precision (%) 5.3 18.1 9.9 6.0 2.4
Accuracy (%) 77.7 81.8 85.5 88.0 93.1
3 Mean 3.22 2.87 3.04 3.16 3.23
Precision (%) 3.0 4.3 3.9 3.5 3.1
Accuracy (%) 107.3 95.8 101.3 105.5 107.7
15 Mean 16.6 16.2 15.8 16.7 16.7
Precision (%) 8.2 8.0 8.1 8.9 8.0
Accuracy (%) 110.8 108.0 105.1 111.6 111.1
70 Mean 78.1 76.1 74.7 77.6 77.5
Precision (%) 4.4 4.6 5.0 4.5 4.3
Accuracy (%) 111.5 108.7 106.8 110.8 110.8
90 Mean 99.8 96.7 95.6 98.2 99.7
Precision (%) 1.9 2.8 2.6 3.2 3.7
Accuracy (%) 110.9 107.4 106.2 109.1 110.8
Quantitation of five organophosphorus nerve agent metabolites
in serum samples of Japanese citizens allegedly exposed to sarin:estimation of internal dosage. Arch Toxicol 72:671–675
7. Barr JR, Driskell WJ, Aston LS, Martinez RA (2004) Quantitation ofmetabolites of the nerve agents sarin, soman, cyclohexylsarin, VX,and Russian VX in human urine using isotope-dilution gaschromatography-tandem mass spectrometry. J Anal Toxicol 28:372–378
8. Shih ML, Smith JR, McMonagle JD, Dolzine TW, Gresham VC(1991) Detection of metabolites of toxic alkylmethylphosphonates inbiological samples. Biol Mass Spectrom 20:717–723
9. Driskell WJ, Shih M, Needham LL, Barr DB (2002) Quantitation oforganophosphorus nerve agent metabolites in human urine usingisotope dilution gas chromatography-tandem mass spectrometry. JAnal Toxicol 26:6–10
10. Swaim LL, Johnson RC, Zhou Y, Sandlin C, Barr JR (2008)Quantification of organophosphorus nerve agent metabolites usinga reduced-volume, high-throughput sample processing format andliquid chromatography-tandem mass spectrometry. J Anal Toxicol32:774–777
11. Mawhinney DB, Hamelin EI, Fraser R, Silva SS, Pavlopoulos AJ,Kobelski RJ (2007) The determination of organophosphonate nerveagent metabolites in human urine by hydrophilic interaction liquidchromatography tandem mass spectrometry. J Chromatogr B 852:235–243
12. Ciner FL, McCord CE, Plunkett RW Jr, Martin MF, Croley TR(2007) Isotope dilution LC/MS/MS for the detection of nerve agentexposure in urine. J Chromatogr B 846:42–50
13. Read RW, Black RM (1999) Rapid screening procedures for thehydrolysis products of chemical warfare agents using positive andnegative ion liquid chromatography-mass spectrometry with
atmospheric pressure chemical ionisation. J Chromatogr A 862:169–177
14. Kanaujia PK, Pardasani D, Tak V, Purohit AK, Dubey DK (2011)Selective enrichment of the degradation products of organophospho-rus nerve agents by zirconia based solid-phase extraction. JChromatogr A 1218:6612–6620
15. Li P, Hu B, Li X (2012) Zirconia coated stir bar sorptive extractioncombined with large volume sample stacking capillary electrophoresis-indirect ultraviolet detection for the determination of chemical warfareagent degradation products in water samples. J Chromatogr A 1247:49–56
16. Mawhinney DB, Stanelle RD, Hamelin EI, Kobelski RJ (2007)Enhancing the response of alkyl methylphosphonic acids in negativeelectrospray ionization liquid chromatography tandem mass spec-trometry by post-column addition of organic solvents. J Am SocMass Spectrom 18:1821–1826
17. Rannulu NS, Cole RB (2012) Novel fragmentation pathwaysof anionic adducts of steroids formed by electrospray anionattachment involving regioselective attachment, regiospecificdecompositions, charge-induced pathways, and ion-dipolecomplex intermediates. J Am Soc Mass Spectrom 23:1558–1568
18. Yanes O, Tautenhahn R, Patti GJ, Siuzdak G (2011) Expandingcoverage of the metabolome for global metabolite profiling. AnalChem 83:2152–2161
19. (2001) Guidance for industry, “bioanalytical method validation”,Department of Health and Human Services, Food and DrugAdministration
20. Taylor JK (1987) Quality assurance of chemical measurements. BocaRaton, CRC LLC
E.I. Hamelin et al.