Embed Size (px)
Citation preview
1 Process NMR Associates – 1H qNMR Kombucha Analysis
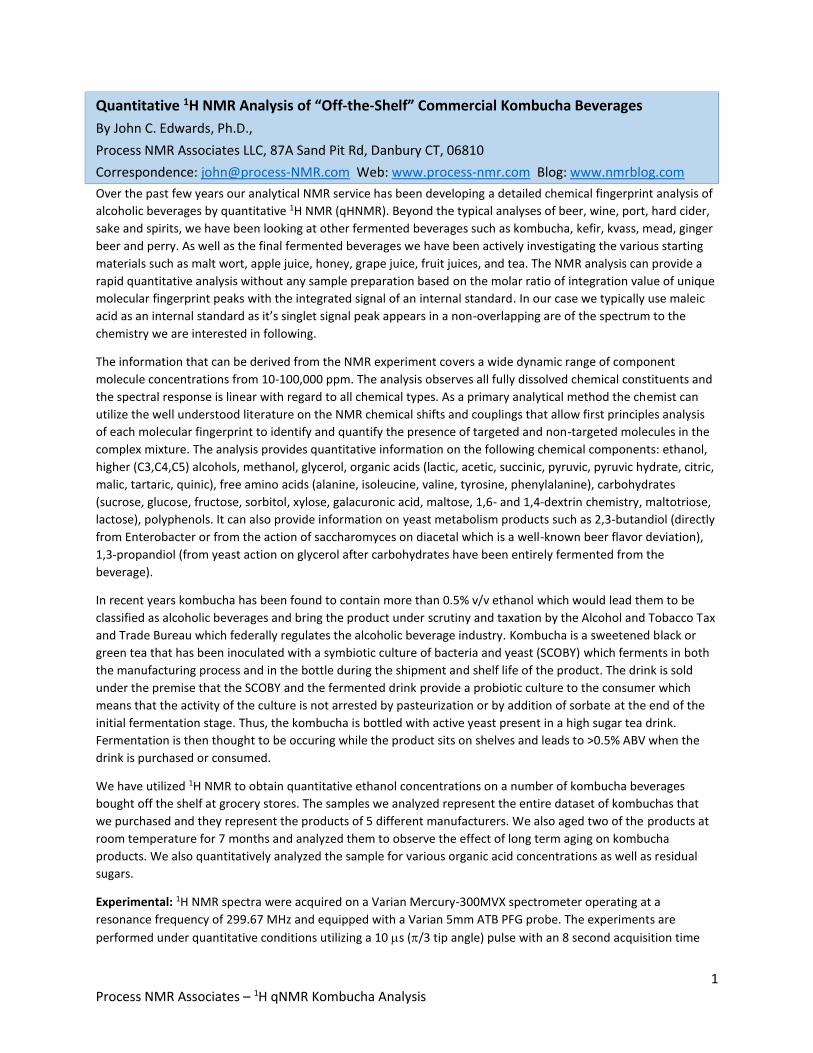
Quantitative 1H NMR Analysis of “Off-the-Shelf” Commercial Kombucha Beverages
By John C. Edwards, Ph.D.,
Process NMR Associates LLC, 87A Sand Pit Rd, Danbury CT, 06810
Correspondence: [email protected] Web: www.process-nmr.com Blog: www.nmrblog.com
Over the past few years our analytical NMR service has been developing a detailed chemical fingerprint analysis of
alcoholic beverages by quantitative 1H NMR (qHNMR). Beyond the typical analyses of beer, wine, port, hard cider,
sake and spirits, we have been looking at other fermented beverages such as kombucha, kefir, kvass, mead, ginger
beer and perry. As well as the final fermented beverages we have been actively investigating the various starting
materials such as malt wort, apple juice, honey, grape juice, fruit juices, and tea. The NMR analysis can provide a
rapid quantitative analysis without any sample preparation based on the molar ratio of integration value of unique
molecular fingerprint peaks with the integrated signal of an internal standard. In our case we typically use maleic
acid as an internal standard as it’s singlet signal peak appears in a non-overlapping are of the spectrum to the
chemistry we are interested in following.
The information that can be derived from the NMR experiment covers a wide dynamic range of component
molecule concentrations from 10-100,000 ppm. The analysis observes all fully dissolved chemical constituents and
the spectral response is linear with regard to all chemical types. As a primary analytical method the chemist can
utilize the well understood literature on the NMR chemical shifts and couplings that allow first principles analysis
of each molecular fingerprint to identify and quantify the presence of targeted and non-targeted molecules in the
complex mixture. The analysis provides quantitative information on the following chemical components: ethanol,
higher (C3,C4,C5) alcohols, methanol, glycerol, organic acids (lactic, acetic, succinic, pyruvic, pyruvic hydrate, citric,
malic, tartaric, quinic), free amino acids (alanine, isoleucine, valine, tyrosine, phenylalanine), carbohydrates
(sucrose, glucose, fructose, sorbitol, xylose, galacuronic acid, maltose, 1,6- and 1,4-dextrin chemistry, maltotriose,
lactose), polyphenols. It can also provide information on yeast metabolism products such as 2,3-butandiol (directly
from Enterobacter or from the action of saccharomyces on diacetal which is a well-known beer flavor deviation),
1,3-propandiol (from yeast action on glycerol after carbohydrates have been entirely fermented from the
beverage).
In recent years kombucha has been found to contain more than 0.5% v/v ethanol which would lead them to be
classified as alcoholic beverages and bring the product under scrutiny and taxation by the Alcohol and Tobacco Tax
and Trade Bureau which federally regulates the alcoholic beverage industry. Kombucha is a sweetened black or
green tea that has been inoculated with a symbiotic culture of bacteria and yeast (SCOBY) which ferments in both
the manufacturing process and in the bottle during the shipment and shelf life of the product. The drink is sold
under the premise that the SCOBY and the fermented drink provide a probiotic culture to the consumer which
means that the activity of the culture is not arrested by pasteurization or by addition of sorbate at the end of the
initial fermentation stage. Thus, the kombucha is bottled with active yeast present in a high sugar tea drink.
Fermentation is then thought to be occuring while the product sits on shelves and leads to >0.5% ABV when the
drink is purchased or consumed.
We have utilized 1H NMR to obtain quantitative ethanol concentrations on a number of kombucha beverages
bought off the shelf at grocery stores. The samples we analyzed represent the entire dataset of kombuchas that
we purchased and they represent the products of 5 different manufacturers. We also aged two of the products at
room temperature for 7 months and analyzed them to observe the effect of long term aging on kombucha
products. We also quantitatively analyzed the sample for various organic acid concentrations as well as residual
sugars.
Experimental: 1H NMR spectra were acquired on a Varian Mercury-300MVX spectrometer operating at a
resonance frequency of 299.67 MHz and equipped with a Varian 5mm ATB PFG probe. The experiments are
performed under quantitative conditions utilizing a 10 s (/3 tip angle) pulse with an 8 second acquisition time
2 Process NMR Associates – 1H qNMR Kombucha Analysis
and a 7 second relaxation delay. 64 transients were acquired over a spectral window of 8 kHz at a controlled
temperature of 27oC. Water suppression was achieved by pre-saturation and this can affect the quantitation of
glucose in the samples under these conditions.
Sample preparation: Samples were purchased “off the shelf” at local grocery stores and were analyzed the same
day that they were purchased. Samples were prepared by 1) degassing the samples by repeated vortex agitation,
2) samples are equilibrated at 27oC before pipetting to allow a mass to volume conversion to be utilized to
calculate the %ABV utilizing an ethanol density value of 0.7816 kg/L, 3) pipetting 175l of kombucha beverage into
a 5mm NMR tube, 4) adding 100l of a 100mg/ml solution of maleic acid (99.5% - Sigma Aldrich) in D2O (99.8%D),
and 5) addition of 375l of D2O (99.8%D – Cambridge Isotopes Laboratories). The final samples were thoroughly
mixed using a vortex mixer. Two of the kombucha samples were purchased in duplicate and not opened
immediately but stored at room temperature for 7 months before being analyzed. These stored samples were
compared with the same samples that were opened and analyzed immediately after purchase.
Calculations: Component concentrations were calculated on a mg/L basis based on a knowledge of the
concentration of maleic acid internal standard present in the sample (10mg) using the following equation:
Component Concentration (C) in mg/L = 0.995 x 10 x ((IC/NC)/(IMA/NMA)) x (MC/MMA) x (1,000,000/175)
Where 10 mg is the mass of maleic acid used as the internal standard, IC = integral of the component peak, NC =
number of protons represented in the component peak, IMA = integral of maleic acid internal standard, NMA =
number of protons represented in the maleic acid integral (2), Mc = molecular weight of the component, MMA =
molecular weight of maleic acid (116.1 amu). Other aspects of the equation are – 175l of sample must be
adjusted to 1 liter (1,000,000 l), and the whole must be multiplied by 0.995 as the maleic acid can only be
guaranteed to be 99.5% pure. The ethanol content is calculated based on a weight per volume basis (mg/L) and
then a calculation is performed to convert this weight/volume concentration to a volume/volume basis using a
density value of 0.7816 kg/L to convert the weight of ethanol to the volume of ethanol.
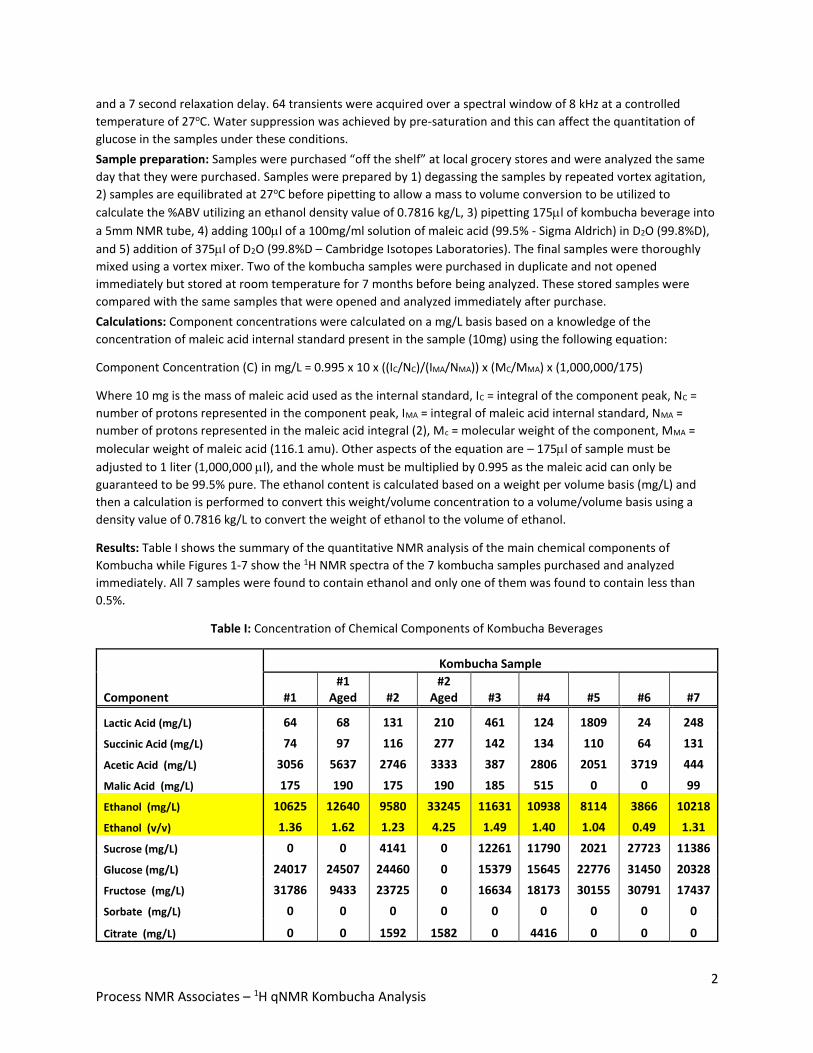
Results: Table I shows the summary of the quantitative NMR analysis of the main chemical components of
Kombucha while Figures 1-7 show the 1H NMR spectra of the 7 kombucha samples purchased and analyzed
immediately. All 7 samples were found to contain ethanol and only one of them was found to contain less than
0.5%.
Table I: Concentration of Chemical Components of Kombucha Beverages
Kombucha Sample
Component #1 #1
Aged #2 #2
Aged #3 #4 #5 #6 #7
Lactic Acid (mg/L) 64 68 131 210 461 124 1809 24 248
Succinic Acid (mg/L) 74 97 116 277 142 134 110 64 131
Acetic Acid (mg/L) 3056 5637 2746 3333 387 2806 2051 3719 444
Malic Acid (mg/L) 175 190 175 190 185 515 0 0 99
Ethanol (mg/L) 10625 12640 9580 33245 11631 10938 8114 3866 10218
Ethanol (v/v) 1.36 1.62 1.23 4.25 1.49 1.40 1.04 0.49 1.31
Sucrose (mg/L) 0 0 4141 0 12261 11790 2021 27723 11386
Glucose (mg/L) 24017 24507 24460 0 15379 15645 22776 31450 20328
Fructose (mg/L) 31786 9433 23725 0 16634 18173 30155 30791 17437
Sorbate (mg/L) 0 0 0 0 0 0 0 0 0
Citrate (mg/L) 0 0 1592 1582 0 4416 0 0 0
3 Process NMR Associates – 1H qNMR Kombucha Analysis
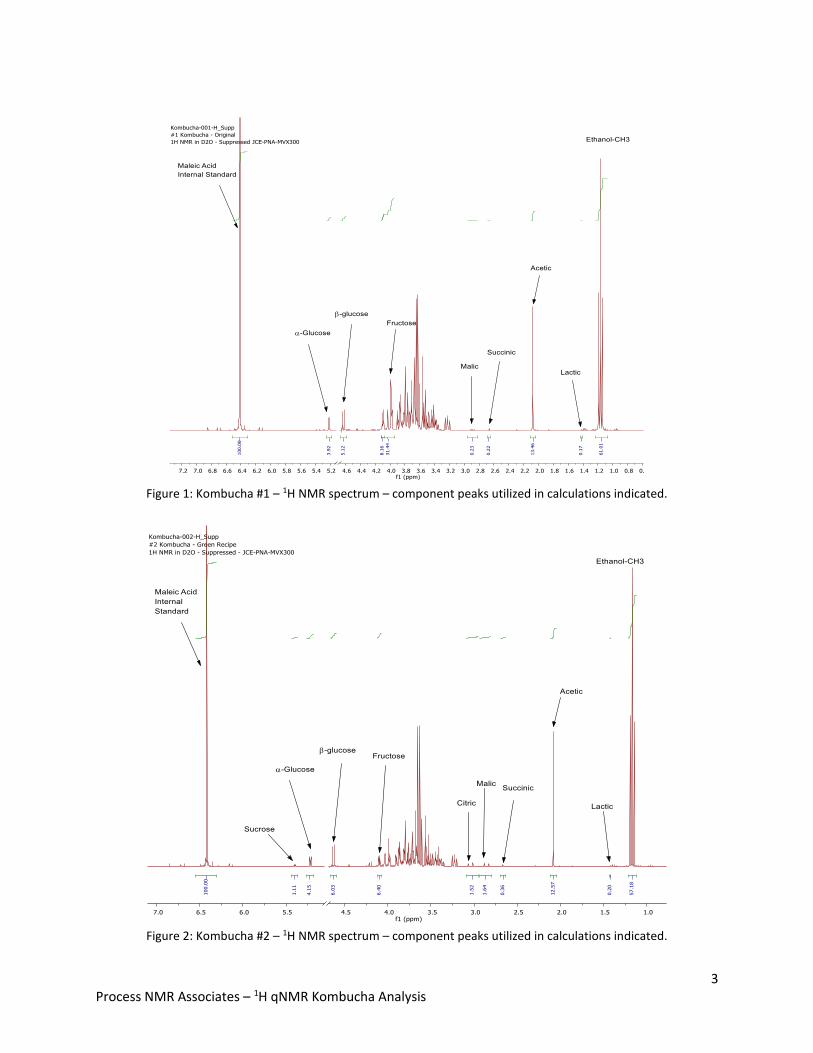
Figure 1: Kombucha #1 – 1H NMR spectrum – component peaks utilized in calculations indicated.
Figure 2: Kombucha #2 – 1H NMR spectrum – component peaks utilized in calculations indicated.
4 Process NMR Associates – 1H qNMR Kombucha Analysis
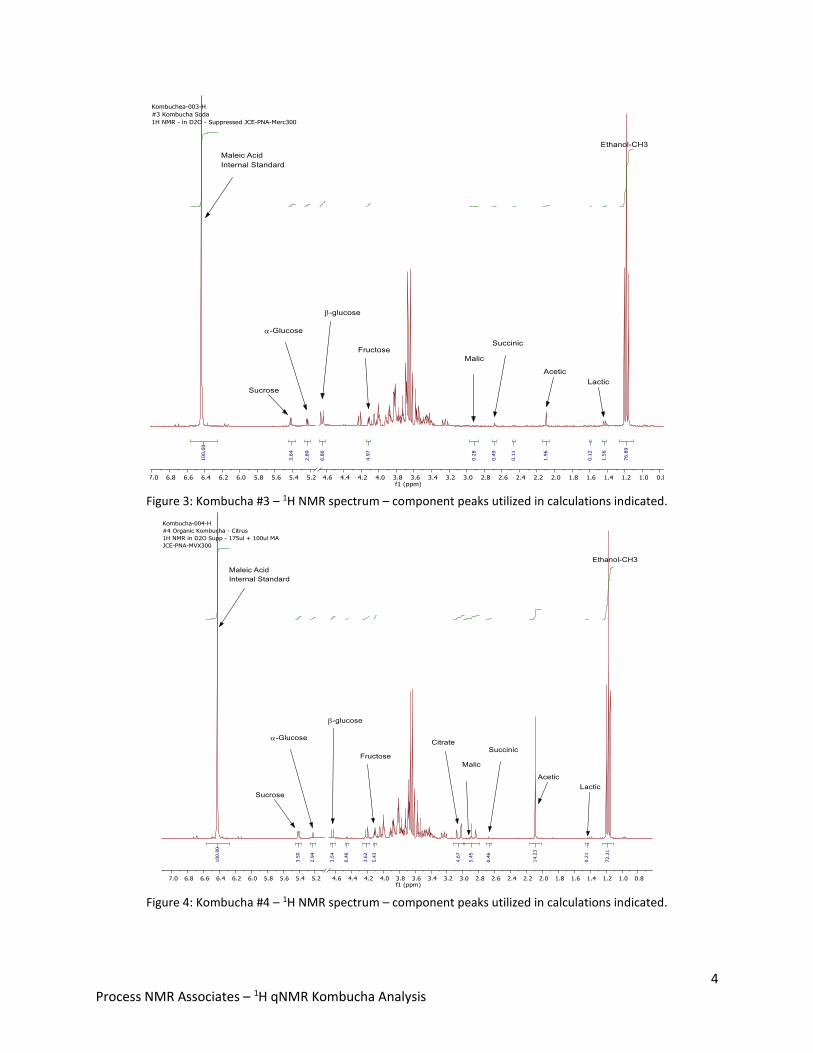
Figure 3: Kombucha #3 – 1H NMR spectrum – component peaks utilized in calculations indicated.
Figure 4: Kombucha #4 – 1H NMR spectrum – component peaks utilized in calculations indicated.
5 Process NMR Associates – 1H qNMR Kombucha Analysis
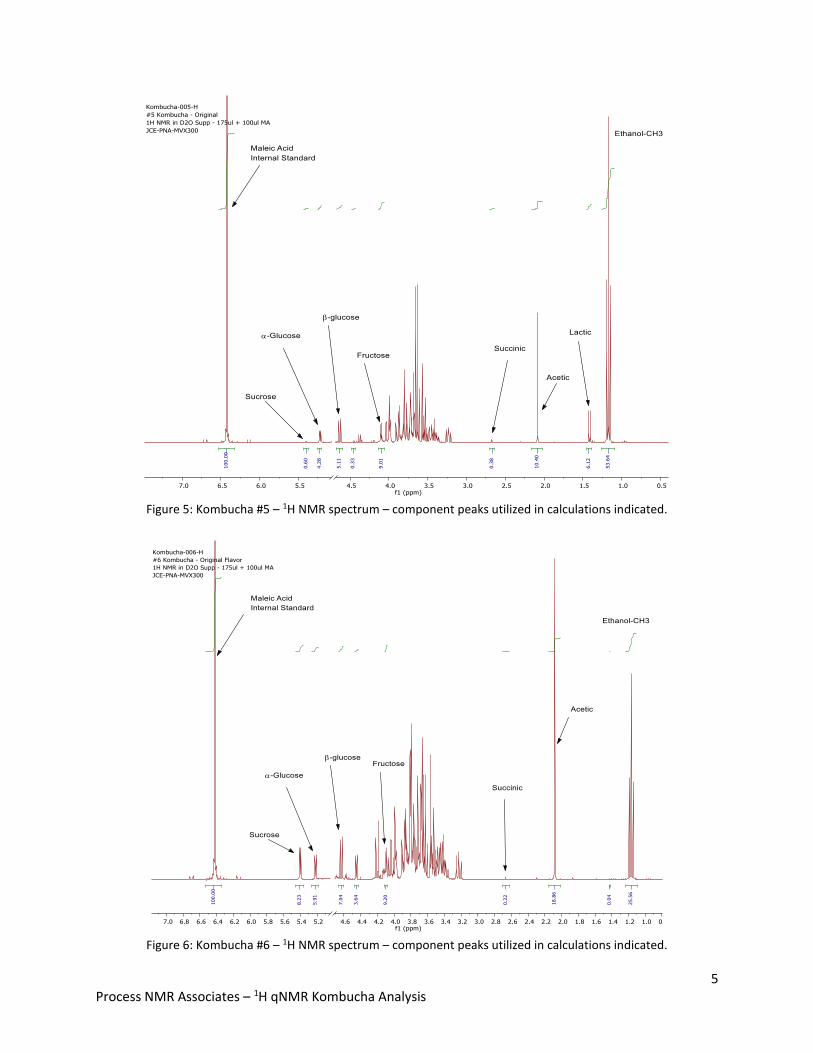
Figure 5: Kombucha #5 – 1H NMR spectrum – component peaks utilized in calculations indicated.
Figure 6: Kombucha #6 – 1H NMR spectrum – component peaks utilized in calculations indicated.
6 Process NMR Associates – 1H qNMR Kombucha Analysis
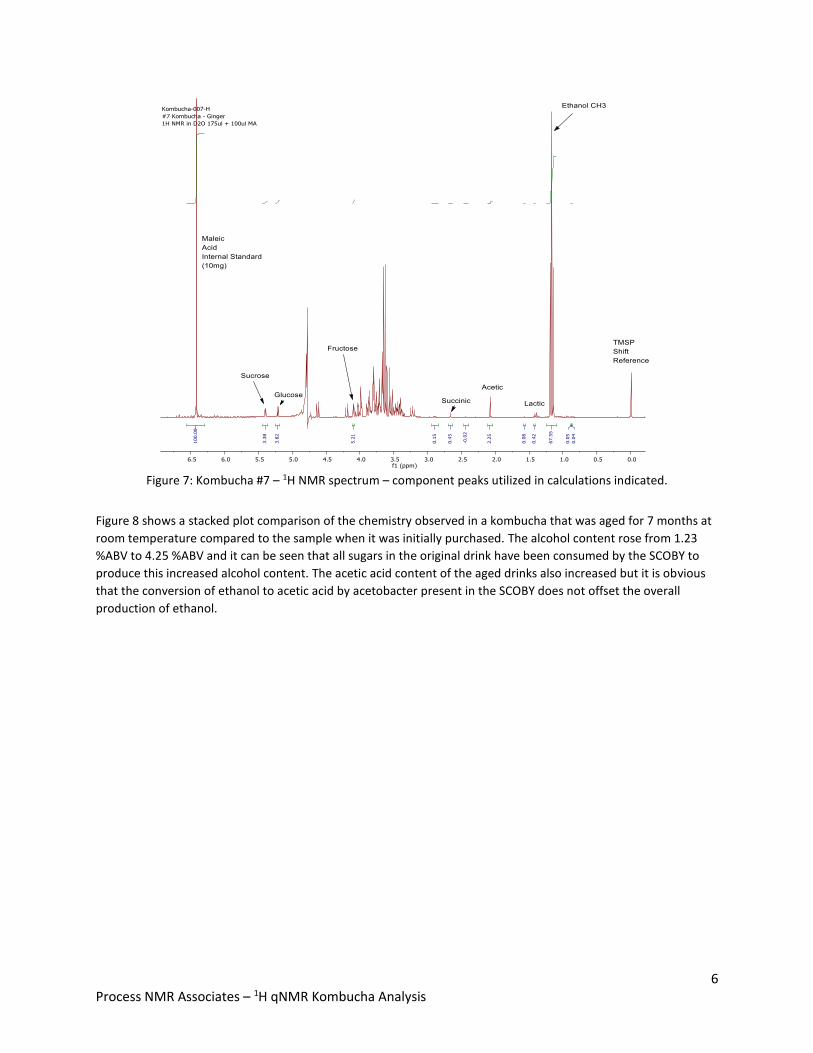
Figure 7: Kombucha #7 – 1H NMR spectrum – component peaks utilized in calculations indicated.
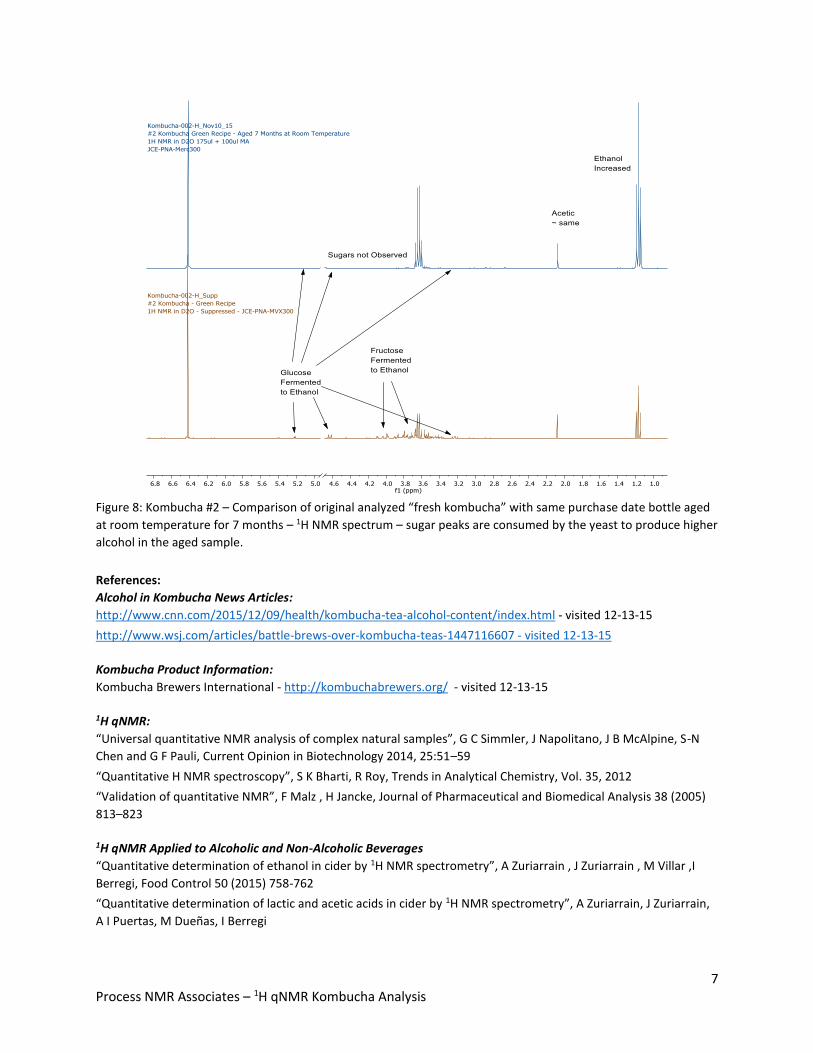
Figure 8 shows a stacked plot comparison of the chemistry observed in a kombucha that was aged for 7 months at
room temperature compared to the sample when it was initially purchased. The alcohol content rose from 1.23
%ABV to 4.25 %ABV and it can be seen that all sugars in the original drink have been consumed by the SCOBY to
produce this increased alcohol content. The acetic acid content of the aged drinks also increased but it is obvious
that the conversion of ethanol to acetic acid by acetobacter present in the SCOBY does not offset the overall
production of ethanol.
7 Process NMR Associates – 1H qNMR Kombucha Analysis
Figure 8: Kombucha #2 – Comparison of original analyzed “fresh kombucha” with same purchase date bottle aged
at room temperature for 7 months – 1H NMR spectrum – sugar peaks are consumed by the yeast to produce higher
alcohol in the aged sample.
References:
Alcohol in Kombucha News Articles:
http://www.cnn.com/2015/12/09/health/kombucha-tea-alcohol-content/index.html - visited 12-13-15
http://www.wsj.com/articles/battle-brews-over-kombucha-teas-1447116607 - visited 12-13-15
Kombucha Product Information:
Kombucha Brewers International - http://kombuchabrewers.org/ - visited 12-13-15
1H qNMR:
“Universal quantitative NMR analysis of complex natural samples”, G C Simmler, J Napolitano, J B McAlpine, S-N
Chen and G F Pauli, Current Opinion in Biotechnology 2014, 25:51–59
“Quantitative H NMR spectroscopy”, S K Bharti, R Roy, Trends in Analytical Chemistry, Vol. 35, 2012
“Validation of quantitative NMR”, F Malz , H Jancke, Journal of Pharmaceutical and Biomedical Analysis 38 (2005)
813–823
1H qNMR Applied to Alcoholic and Non-Alcoholic Beverages
“Quantitative determination of ethanol in cider by 1H NMR spectrometry”, A Zuriarrain , J Zuriarrain , M Villar ,I
Berregi, Food Control 50 (2015) 758-762
“Quantitative determination of lactic and acetic acids in cider by 1H NMR spectrometry”, A Zuriarrain, J Zuriarrain,
A I Puertas, M Dueñas, I Berregi
8 Process NMR Associates – 1H qNMR Kombucha Analysis
“Identification and quantification of the main organic components of vinegars by high resolution 1H NMR”
spectroscopy, A Caligiani , D Acquotti , G Palla , V Bocchi, Analytica Chimica Acta 585 (2007) 110–119
“NMR-based metabolomics in wine science”, Y-S Hong, Magn. Reson. Chem. 2011,49, S13–S21
“1H NMR-based metabolomic characterization during green tea (Camellia sinensis) fermentation”, J-E Lee , B-J Lee ,
J-O Chung , H-J Shin , S-J Lee , C-H Lee ⁎, Y-S Hong, Food Research International 44 (2011) 597–604
“NMR methods for beer characterization and quality control”, J E Rodrigues, A M Gil, Magn. Reson. Chem. 2011,
49, S37–S45
“Metabolomic profiling of Cheonggukjang during fermentation by 1H NMR spectrometry and principal components
analysis”, H-K Choi, J-H Yoon , Y-S Kim , D Y Kwon, Process Biochemistry 42 (2007) 263–266
“Quantification of organic acids in beer by nuclear magnetic resonance (NMR)-based methods”, J E A Rodrigues , G
L Erny , A S Barros , V I Esteves , T Brandão , A A Ferreira , E Cabrita , A M Gil, Analytica Chimica Acta 674 (2010)
166–175
“Monitoring a commercial fermentation with proton nuclear magnetic resonance spectroscopy with the aid of
chemometrics”, S Clark , N W Barnett , M Adams , I B Cook , G A Dyson , G Johnston, Analytica Chimica Acta 563
(2006) 338–345
“Quality control of beer using high-resolution nuclear magnetic resonance spectroscopy and multivariate analysis”,
D W Lachenmeier, W Frank, E Humpfer, H Schafer, S Keller, M Mortter, Manfred Spraul, Eur. Food Res. Technol.
(2005) 220:215–221
“1H NMR spectroscopy for profiling complex carbohydrate mixtures in non-fractionated beer”, B O. Petersen , M
Nilsson , M Bøjstrup , O Hindsgaul , S Meier, Food Chemistry 150 (2014) 65–72.
“Regulatory Control of Energy Drinks Using 1H NMR Spectroscopy”, Y B Monakhova, T Kuballa, H Reusch, K Wegert
G Winkler, D W Lachenmeier, Lebensmittelchemie 66, 129–168 (2012)
“Qualitative and Quantitative Control of Honeys Using NMR Spectroscopy and Chemometrics”, M Ohmenhaeuser,
Y B Monakhova, T Kuballa, D W Lachenmeier, ISRN Analytical Chemistry Volume 2013, Article ID 825318,
“Qualitative and Quantitative Control of Carbonated Cola Beverages Using 1H NMR Spectroscopy” P Maes, Y B
Monakhova, and D W Lachenmeier, T Kuballa, H Reusch, J. Agric. Food Chem. 2012, 60, 2778−2784