Embed Size (px)
Citation preview
Quantitative analysis of membrane and secretory protein processing and
intracellular transport
DENNIS A. NOE*
The Johns Hopkins Oncology Center, Room 1-120, 600 N. Wolfe St, Baltimore, MD 21205, USA
and JOANN C. DELENICK
6286 Yale Station, Neiv Haven, CT 06520, USA
* Author for correspondence
Summary
Quantitative experimental data from studies ofintracellular processing and transport of secretoryand membrane proteins are only rarely evaluatedusing kinetic modelling. Instead, the analysis ofsuch data is usually limited to calculating either theapparent half-life or the transit time. Neither ofthese parameters accurately measures rates of cel-lular processing or transport. This paper describesa formal approach for the calculation of rate con-stants, half-lives and lag times for single and se-quential processing and transport steps. General-
ized kinetic models are presented that can be usedto analyse data from both pulse-chase and continu-ous incubation experiments with labelled aminoacids or sugars. The results from a number ofpublished studies are reanalysed using the modelsto demonstrate the usefulness of kinetic modellingin the routine analysis of experimental data.
Key words: protein kinetics, intracellular transport, kineticmodel.
Introduction
Quantitative data generated in experimental studies ofintracellular processing and transport of membrane andsecretory proteins are most often analysed without math-ematical modelling. The resulting dependence uponsemiquantitative analytic approaches and imprecise kin-etic parameters, such as apparent half-life and transittime, has prevented the statistically rigorous descriptionof kinetic events. Data analysis using quantitative kineticmodels permits rigorous descriptions to be made andpermits the reliable interlaboratory comparison of kineticparameter values (Berman, 1963; Rescigno & Beck,1987). In addition, kinetic models can be used insimulation studies to generate quantitative predictions ofa protein's kinetic behaviour. In this paper, a compart-mental analytic approach (Godfrey, 1983; Jacquez, 1985)has been employed to construct kinetic models that have abroad applicability to studies of the biosynthetic process-ing and transport of proteins. These models can be usedto analyse data from both pulse-chase and continuousincubation experiments with labelled amino acids orsugars. Using any of the inexpensive, easy-to-learn soft-ware programs currently available for non-linear re-Journal of Cell Science 92, 449-459 (1989)Printed in Great Britain © The Company of Biologists Limited 1989
gression analysis, it is possible for the models to be usedin any laboratory possessing a microcomputer.
Kinetic analysis
Compartmental kinetic modelling (glossary, Table 1)Compartmental modelling of biological systems consistsof representing the system as a set of compartmentsinteracting with each other through the transfer of asubstance. Each compartment in a compartmental modelis a defined pool of the substance of interest. A compart-ment may be defined by its location, in which case it is ananatomic compartment, or by its kinetic behaviour, inwhich case it is a kinetic compartment. Within eachcompartment the substance behaves in a homogeneousfashion; that is, the substance behaves as though it mixesrandomly in the pool, with each molecule of the sub-stance having an equal likelihood of undergoing transfer.In physiological studies, where concentrations of sub-stances are measured, kinetic compartments are charac-terized by the apparent volume of distribution of thesubstance and the intercompartmental clearance rates ofthe substance. In cell-biological studies, where pool sizesare measured, kinetic compartments are characterized
449
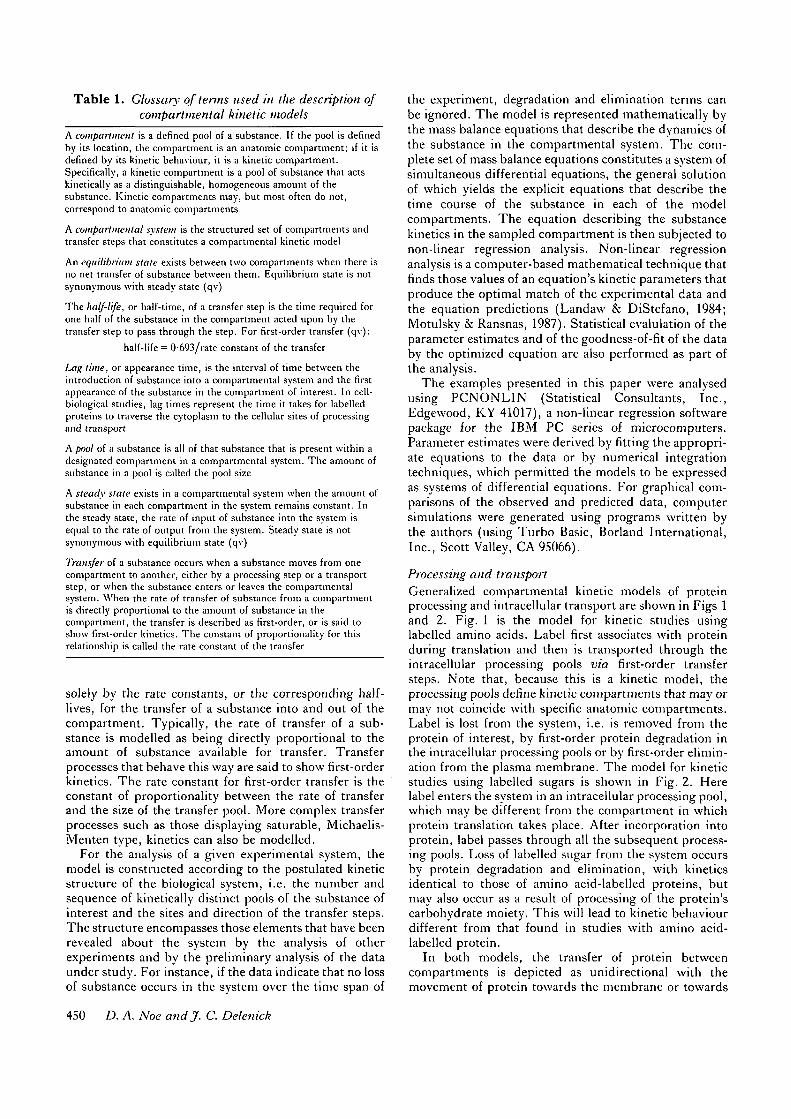
Table 1. Glossary of terms used in the description ofcompartmental kinetic models
A compartment is a defined pool of a substance. If the pool is definedby its location, the compartment is an anatomic compartment; if it isdefined by its kinetic behaviour, it is a kinetic compartment.Specifically, a kinetic compartment is a pool of substance that actskinetically as a distinguishable, homogeneous amount of thesubstance. Kinetic compartments may, but most often do not,correspond to anatomic compartments
A compartmental system is the structured set of compartments andtransfer steps that constitutes a compartmental kinetic model
An equilibrium state exists between two compartments when there isno net transfer of substance between them. Equilibrium state is notsynonymous with steady state (qv)
The half-life, or half-time, of a transfer step is the time required forone half of the substance in the compartment acted upon by thetransfer step to pass through the step. For first-order transfer (qv):
half-life = 0693/rate constant of the transfer
I^ag time, or appearance time, is the interval of time between theintroduction of substance into a compartmental system and the firstappearance of the substance in the compartment of interest. In cell-biological studies, lag times represent the time it takes for labelledproteins to traverse the cytoplasm to the cellular sites of processingand transport
A pool of a substance is all of that substance that is present within adesignated compartment in a compartmental system. The amount ofsubstance in a pool is called the pool size
A steady state exists in a compartmental system when the amount ofsubstance in each compartment in the system remains constant. Inthe steady state, the rate of input of substance into the system isequal to the rate of output from the system. Steady state is notsynonymous with equilibrium state (qv)
Transfer of a substance occurs when a substance moves from onecompartment to another, either by a processing step or a transportstep, or when the substance enters or leaves the compartmentalsystem. When the rate of transfer of substance from a compartmentis directly proportional to the amount of substance in thecompartment, the transfer is described as first-order, or is said toshow first-order kinetics. The constant of proportionality for thisrelationship is called the rate constant of the transfer
solely by the rate constants, or the corresponding half-lives, for the transfer of a substance into and out of thecompartment. Typically, the rate of transfer of a sub-stance is modelled as being directly proportional to theamount of substance available for transfer. Transferprocesses that behave this way are said to show first-orderkinetics. The rate constant for first-order transfer is theconstant of proportionality between the rate of transferand the size of the transfer pool. More complex transferprocesses such as those displaying saturable, Michaelis-Menten type, kinetics can also be modelled.
For the analysis of a given experimental system, themodel is constructed according to the postulated kineticstructure of the biological system, i.e. the number andsequence of kinetically distinct pools of the substance ofinterest and the sites and direction of the transfer steps.The structure encompasses those elements that have beenrevealed about the system by the analysis of otherexperiments and by the preliminary analysis of the dataunder study. For instance, if the data indicate that no lossof substance occurs in the system over the time span of
the experiment, degradation and elimination terms canbe ignored. The model is represented mathematically bythe mass balance equations that describe the dynamics ofthe substance in the compartmental system. The com-plete set of mass balance equations constitutes a system ofsimultaneous differential equations, the general solutionof which yields the explicit equations that describe thetime course of the substance in each of the modelcompartments. The equation describing the substancekinetics in the sampled compartment is then subjected tonon-linear regression analysis. Non-linear regressionanalysis is a computer-based mathematical technique thatfinds those values of an equation's kinetic parameters thatproduce the optimal match of the experimental data andthe equation predictions (Landaw & DiStefano, 1984;Motulsky & Ransnas, 1987). Statistical evaluation of theparameter estimates and of the goodness-of-fit of the databy the optimized equation are also performed as part ofthe analysis.
The examples presented in this paper were analysedusing PCNONLIN (Statistical Consultants, Inc.,Edgewood, KY 41017), a non-linear regression softwarepackage for the IBM PC series of microcomputers.Parameter estimates were derived by fitting the appropri-ate equations to the data or by numerical integrationtechniques, which permitted the models to be expressedas systems of differential equations. For graphical com-parisons of the observed and predicted data, computersimulations were generated using programs written bythe authors (using Turbo Basic, Borland International,Inc., Scott Valley, CA 95066).
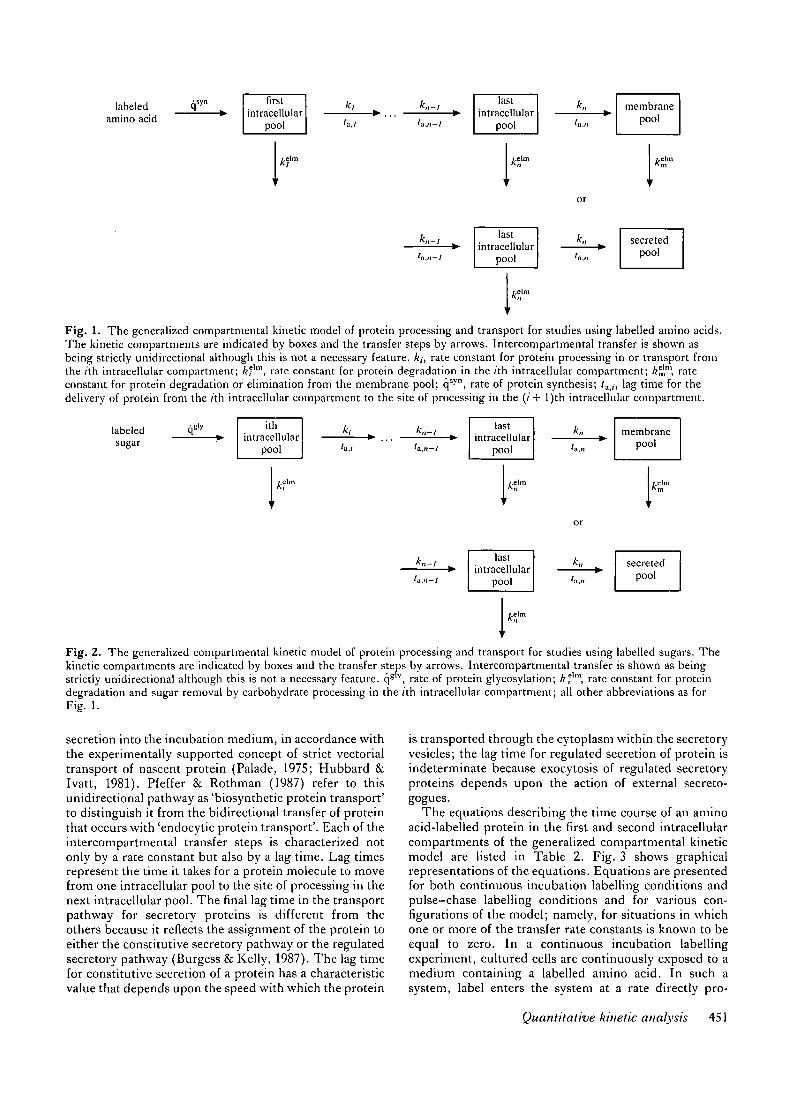
Processing and transportGeneralized compartmental kinetic models of proteinprocessing and intracellular transport are shown in Figs 1and 2. Fig. 1 is the model for kinetic studies usinglabelled amino acids. Label first associates with proteinduring translation and then is transported through theintracellular processing pools via first-order transfersteps. Note that, because this is a kinetic model, theprocessing pools define kinetic compartments that may ormay not coincide with specific anatomic compartments.Label is lost from the system, i.e. is removed from theprotein of interest, by first-order protein degradation inthe intracellular processing pools or by first-order elimin-ation from the plasma membrane. The model for kineticstudies using labelled sugars is shown in Fig. 2. Herelabel enters the system in an intracellular processing pool,which may be different from the compartment in whichprotein translation takes place. After incorporation intoprotein, label passes through all the subsequent process-ing pools. Loss of labelled sugar from the system occursby protein degradation and elimination, with kineticsidentical to those of amino acid-labelled proteins, butmay also occur as a result of processing of the protein'scarbohydrate moiety. This will lead to kinetic behaviourdifferent from that found in studies with amino acid-labelled protein.
In both models, the transfer of protein betweencompartments is depicted as unidirectional with themovement of protein towards the membrane or towards
450 D. A. Noe andjf. C. Delenick
labeledamino acid
qsyn firstintracellular
pool
k, ^
k.i
kn-l ^
'a,,,-/
lastintracellular
pool
A",, t membranepool
/.elm
kn-l ^
fa.,,-/
lastintracellular
pool
i.elmKnt
kn
'».„secreted
pool
Fig. 1. The generalized compartmental kinetic model of protein processing and transport for studies using labelled amino acids.The kinetic compartments are indicated by boxes and the transfer steps by arrows. Intercompartmental transfer is shown asbeing strictly unidirectional although this is not a necessary feature, k,, rate constant for protein processing in or transport fromthe /th intracellular compartment; kfm, rate constant for protein degradation in the /th intracellular compartment; k^"\ rateconstant for protein degradation or elimination from the membrane pool; qsyn, rate of protein synthesis; /„,,-, lag time for thedelivery of protein from the /th intracellular compartment to the site of processing in the (/+ l)th intracellular compartment.
abeled qgly
sugar
ithintracellular
pool
kfm
k, kn-,
'a,i 'a,n —/
* „ - , „la,n-l
lastintracellular
pool
•
/.elm
r
lastintracellular
pool
i
/.elm
k,,
'a.n
or
A:,,
'a.,,
memtpo
seerspo
raneol
/-elm
t
tedol
Fig. 2. The generalized compartmental kinetic model of protein processing and transport for studies using labelled sugars. Thekinetic compartments are indicated by boxes and the transfer steps by arrows. Intercompartmental transfer is shown as beingstrictly unidirectional although this is not a necessary feature. qs y , rate of protein glycosylation; kfn\ rate constant for proteindegradation and sugar removal by carbohydrate processing in the /th intracellular compartment; all other abbreviations as forFig. 1.
secretion into the incubation medium, in accordance withthe experimentally supported concept of strict vectorialtransport of nascent protein (Palade, 1975; Hubbard &Ivatt, 1981). Pfeffer & Rothman (1987) refer to thisunidirectional pathway as 'biosynthetic protein transport'to distinguish it from the bidirectional transfer of proteinthat occurs with 'endocytic protein transport'. Each of theintercompartmental transfer steps is characterized notonly by a rate constant but also by a lag time. Lag timesrepresent the time it takes for a protein molecule to movefrom one intracellular pool to the site of processing in thenext intracellular pool. The final lag time in the transportpathway for secretory proteins is different from theothers because it reflects the assignment of the protein toeither the constitutive secretory pathway or the regulatedsecretory pathway (Burgess & Kelly, 1987). The lag timefor constitutive secretion of a protein has a characteristicvalue that depends upon the speed with which the protein
is transported through the cytoplasm within the secretoryvesicles; the lag time for regulated secretion of protein isindeterminate because exocytosis of regulated secretoryproteins depends upon the action of external secreto-gogues.
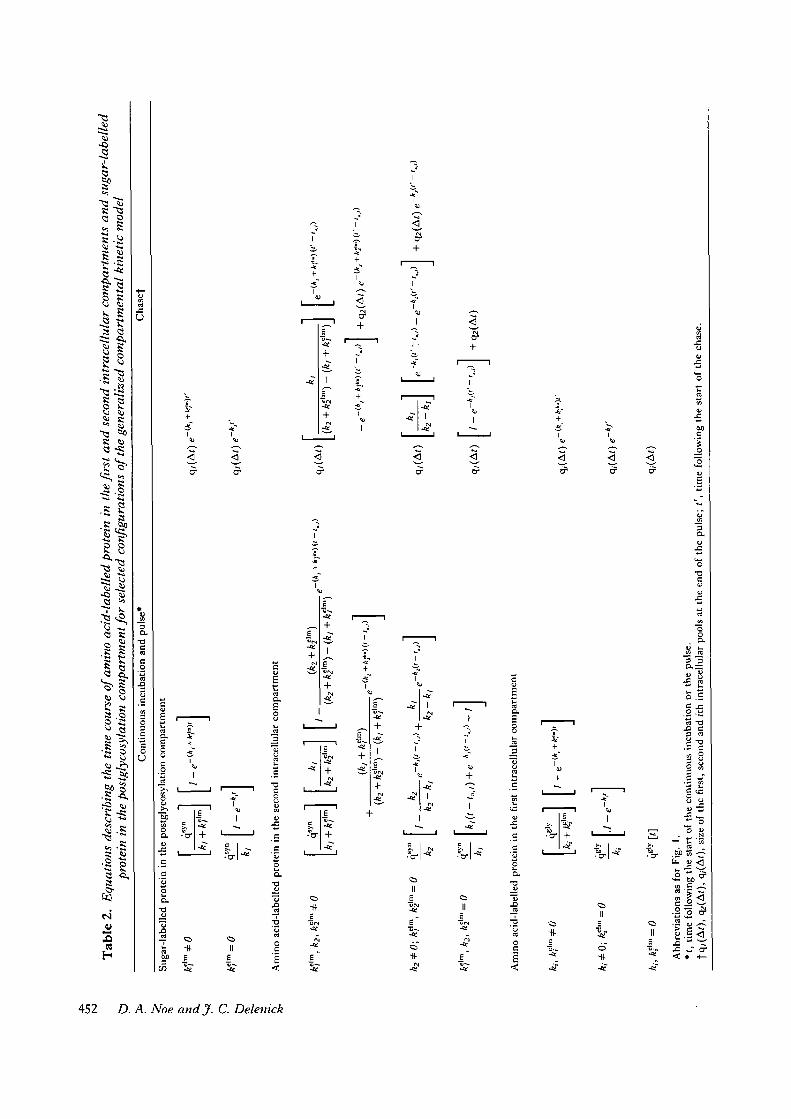
The equations describing the time course of an aminoacid-labelled protein in the first and second intracellularcompartments of the generalized compartmental kineticmodel are listed in Table 2. Fig. 3 shows graphicalrepresentations of the equations. Equations are presentedfor both continuous incubation labelling conditions andpulse-chase labelling conditions and for various con-figurations of the model; namely, for situations in whichone or more of the transfer rate constants is known to beequal to zero. In a continuous incubation labellingexperiment, cultured cells are continuously exposed to amedium containing a labelled amino acid. In such asystem, label enters the system at a rate directly pro-
Quantitative kinetic analysis 451
First intracellularcompartment
Second intracellularcompartment
Time Time
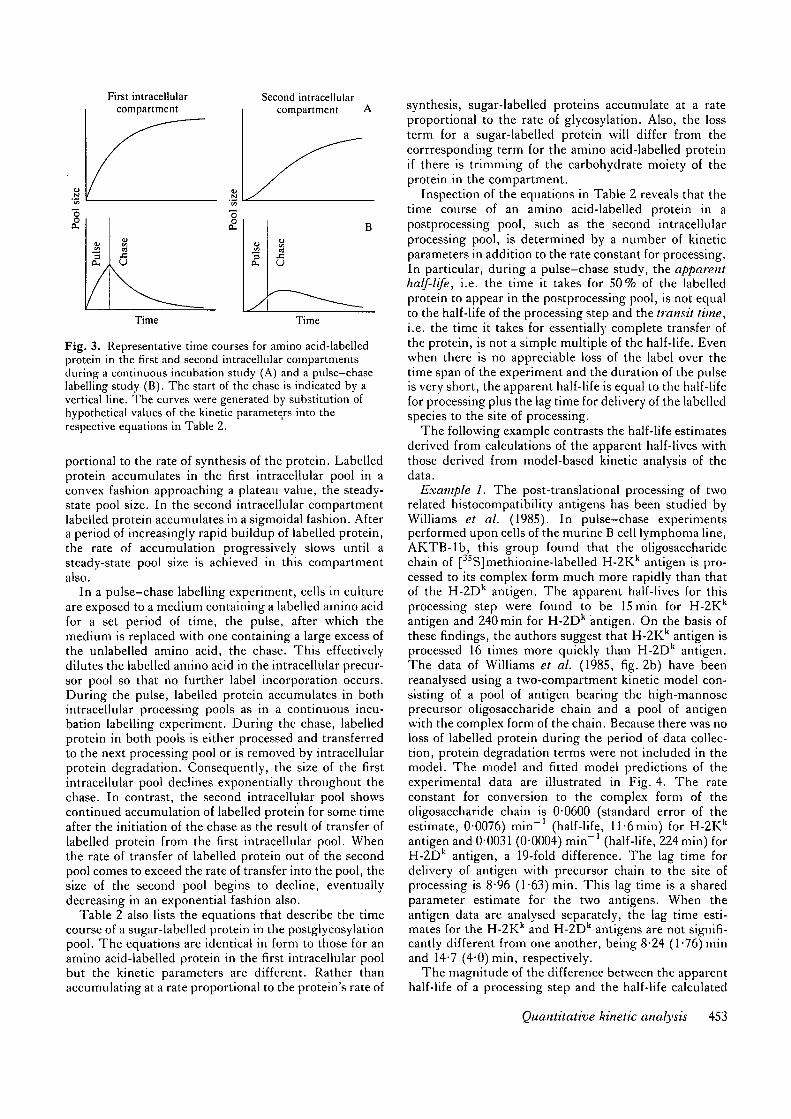
Fig. 3. Representative time courses for amino acid-labelledprotein in the first and second intracellular compartmentsduring a continuous incubation study (A) and a pulse—chaselabelling study (B). The start of the chase is indicated by avertical line. The curves were generated by substitution ofhypothetical values of the kinetic parameters into therespective equations in Table 2.
portional to the rate of synthesis of the protein. Labelledprotein accumulates in the first intracellular pool in aconvex fashion approaching a plateau value, the steady-state pool size. In the second intracellular compartmentlabelled protein accumulates in a sigmoidal fashion. Aftera period of increasingly rapid buildup of labelled protein,the rate of accumulation progressively slows until asteady-state pool size is achieved in this compartmentalso.
In a pulse-chase labelling experiment, cells in cultureare exposed to a medium containing a labelled amino acidfor a set period of time, the pulse, after which themedium is replaced with one containing a large excess ofthe unlabelled amino acid, the chase. This effectivelydilutes the labelled amino acid in the intracellular precur-sor pool so that no further label incorporation occurs.During the pulse, labelled protein accumulates in bothintracellular processing pools as in a continuous incu-bation labelling experiment. During the chase, labelledprotein in both pools is either processed and transferredto the next processing pool or is removed by intracellularprotein degradation. Consequently, the size of the firstintracellular pool declines exponentially throughout thechase. In contrast, the second intracellular pool showscontinued accumulation of labelled protein for some timeafter the initiation of the chase as the result of transfer oflabelled protein from the first intracellular pool. Whenthe rate of transfer of labelled protein out of the secondpool comes to exceed the rate of transfer into the pool, thesize of the second pool begins to decline, eventuallydecreasing in an exponential fashion also.
Table 2 also lists the equations that describe the timecourse of a sugar-labelled protein in the postglycosylationpool. The equations are identical in form to those for anamino acid-labelled protein in the first intracellular poolbut the kinetic parameters are different. Rather thanaccumulating at a rate proportional to the protein's rate of
synthesis, sugar-labelled proteins accumulate at a rateproportional to the rate of glycosylation. Also, the lossterm for a sugar-labelled protein will differ from thecorrresponding term for the amino acid-labelled proteinif there is trimming of the carbohydrate moiety of theprotein in the compartment.
Inspection of the equations in Table 2 reveals that thetime course of an amino acid-labelled protein in apostprocessing pool, such as the second intracellularprocessing pool, is determined by a number of kineticparameters in addition to the rate constant for processing.In particular, during a pulse-chase study, the apparenthalf-life, i.e. the time it takes for 50% of the labelledprotein to appear in the postprocessing pool, is not equalto the half-life of the processing step and the transit time,i.e. the time it takes for essentially complete transfer ofthe protein, is not a simple multiple of the half-life. Evenwhen there is no appreciable loss of the label over thetime span of the experiment and the duration of the pulseis very short, the apparent half-life is equal to the half-lifefor processing plus the lag time for delivery of the labelledspecies to the site of processing.
The following example contrasts the half-life estimatesderived from calculations of the apparent half-lives withthose derived from model-based kinetic analysis of thedata.
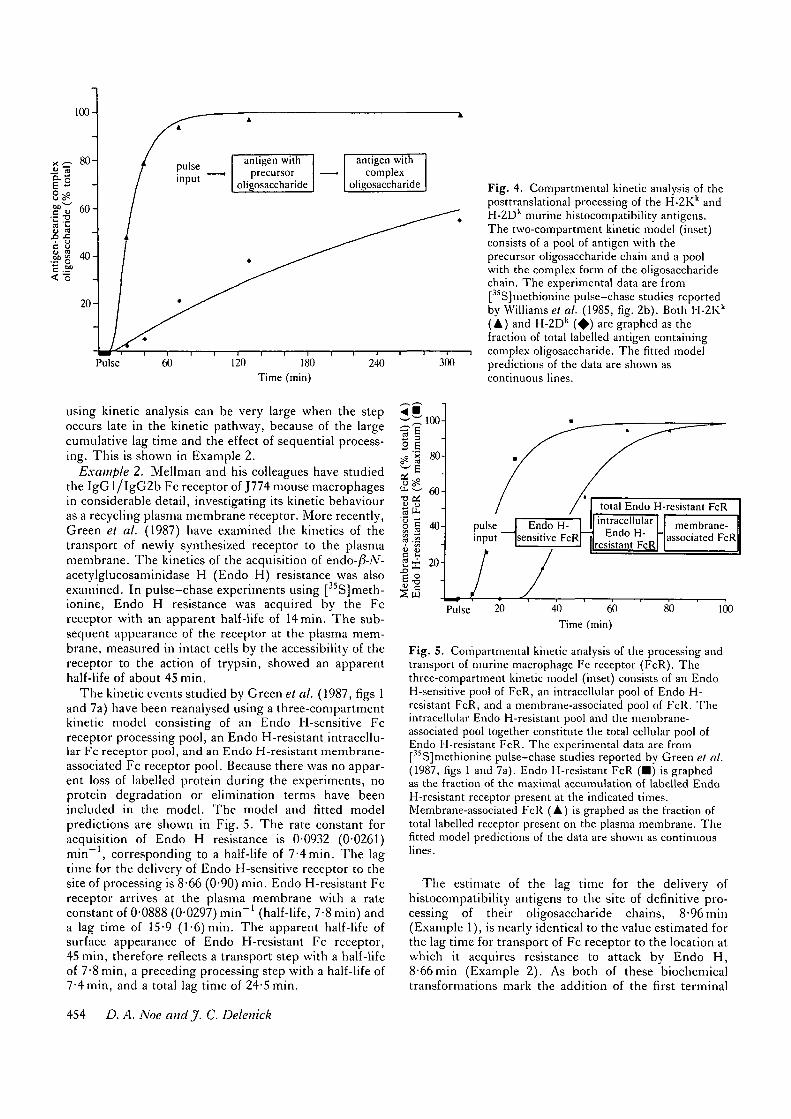
Example 1. The post-translational processing of tworelated histocompatibility antigens has been studied byWilliams et al. (1985). In pulse-chase experimentsperformed upon cells of the murine B cell lymphoma line,AKTB-lb, this group found that the oligosaccharidechain of [ SJmethionine-labelled H-2K antigen is pro-cessed to its complex form much more rapidly than thatof the H-2Dk antigen. The apparent half-lives for thisprocessing step were found to be 15 min for H-2Kk
antigen and 240 min for H-2Dk antigen. On the basis ofthese findings, the authors suggest that H-2Kk antigen isprocessed 16 times more quickly than H-2Dk antigen.The data of Williams et al. (1985, fig. 2b) have beenreanalysed using a two-compartment kinetic model con-sisting of a pool of antigen bearing the high-mannoseprecursor oligosaccharide chain and a pool of antigenwith the complex form of the chain. Because there was noloss of labelled protein during the period of data collec-tion, protein degradation terms were not included in themodel. The model and fitted model predictions of theexperimental data are illustrated in Fig. 4. The rateconstant for conversion to the complex form of theoligosaccharide chain is 0-0600 (standard error of theestimate, 0-0076) min"1 (half-life, ll-6min) for H-2Kk
antigen and 0-0031 (0-0004) min"1 (half-life, 224 min) forH-2Dk antigen, a 19-fold difference. The lag time fordelivery of antigen with precursor chain to the site ofprocessing is 8-96 (1-63) min. This lag time is a sharedparameter estimate for the two antigens. When theantigen data are analysed separately, the lag time esti-mates for the H-2Kk and H-2Dk antigens are not signifi-cantly different from one another, being 8-24 (1-76) minand 14-7 (4-0) min, respectively.
The magnitude of the difference between the apparenthalf-life of a processing step and the half-life calculated
Quantitative kinetic analysis 453
100-
antigen withprecursor
oligosaccharide
antigen withcomplex
oligosaccharide
Pulse 180Time (min)
240 300
Fig. 4. Compartmental kinetic analysis of theposttranslational processing of the H-2Kk andH-2D k murine histocompatibility antigens.The two-compartment kinetic model (inset)consists of a pool of antigen with theprecursor oligosaccharide chain and a poolwith the complex form of the oligosaccharidechain. T h e experimental data are from[35S]methionine pulse-chase studies reportedby Williams et al. (1985, fig. 2b) . Both H-2Kk
( A ) and H-2D k ( • ) are graphed as thefraction of total labelled antigen containingcomplex oligosaccharide. T h e fitted modelpredictions of the data are shown ascontinuous lines.
using kinetic analysis can be very large when the stepoccurs late in the kinetic pathway, because of the largecumulative lag time and the effect of sequential process-ing. This is shown in Example 2.
Example 2. Mellman and his colleagues have studiedthe IgGl/lgG2b Fc receptor of J774 mouse macrophagesin considerable detail, investigating its kinetic behaviouras a recycling plasma membrane receptor. More recently,Green et al. (1987) have examined the kinetics of thetransport of newly synthesized receptor to the plasmamembrane. The kinetics of the acquisition of endo-/3-iV-acetylglucosaminidase H (Endo H) resistance was alsoexamined. In pulse-chase experiments using [35S]meth-ionine, Endo H resistance was acquired by the Fcreceptor with an apparent half-life of 14 min. The sub-sequent appearance of the receptor at the plasma mem-brane, measured in intact cells by the accessibility of thereceptor to the action of trypsin, showed an apparenthalf-life of about 45 min.
The kinetic events studied by Green et al. (1987, figs 1and 7a) have been reanalysed using a three-compartmentkinetic model consisting of an Endo H-sensitive Fcreceptor processing pool, an Endo H-resistant intracellu-lar Fc receptor pool, and an Endo H-resistant membrane-associated Fc receptor pool. Because there was no appar-ent loss of labelled protein during the experiments, noprotein degradation or elimination terms have beenincluded in the model. The model and fitted modelpredictions are shown in Fig. 5. The rate constant foracquisition of Endo H resistance is 0-0932 (0-0261)min~ , corresponding to a half-life of 7-4min. The lagtime for the delivery of Endo H-sensitive receptor to thesite of processing is 8-66 (0-90) min. Endo H-resistant Fcreceptor arrives at the plasma membrane with a rateconstant of 0-0888 (0-0297) min"1 (half-life, 7-8 min) anda lag time of 15-9 (1-6) min. The apparent half-life ofsurface appearance of Endo H-resistant Fc receptor,45 min, therefore reflects a transport step with a half-lifeof 7-8 min, a preceding processing step with a half-life of7-4 min, and a total lag time of 24-5 min.
If2 E
II13.2
100-
80-
60-
•
40-
20-
•
/
pulseinput
. / ,
/Endo H-
sensitive FcR
/
_
total Endo H-resistant FcRintracellular
Endo H-Iresistant FcR
-membrane-
associated FcR
Pulse 20 40 60Time (min)
100
Fig. S. Compartmental kinetic analysis of the processing andtransport of murine macrophage Fc receptor (FcR). Thethree-compartment kinetic model (inset) consists of an EndoH-sensitive pool of FcR, an intracellular pool of Endo H-resistant FcR, and a membrane-associated pool of FcR. Theintracellular Endo H-resistant pool and the membrane-associated pool together constitute the total cellular pool ofEndo H-resistant FcR. The experimental data are from[35S]methionine pulse-chase studies reported by Green et al.(1987, figs 1 and 7a). Endo H-resistant FcR ( • ) is graphedas the fraction of the maximal accumulation of labelled EndoH-resistant receptor present at the indicated times.Membrane-associated FcR (A) is graphed as the fraction oftotal labelled receptor present on the plasma membrane. Thefitted model predictions of the data are shown as continuouslines.
The estimate of the lag time for the delivery ofhistocompatibility antigens to the site of definitive pro-cessing of their oligosaccharide chains, 8-96 min(Example 1), is nearly identical to the value estimated forthe lag time for transport of Fc receptor to the location atwhich it acquires resistance to attack by Endo H,8-66 min (Example 2). As both of these biochemicaltransformations mark the addition of the first terminal
454 D. A. Noe andjf. C. Delenick
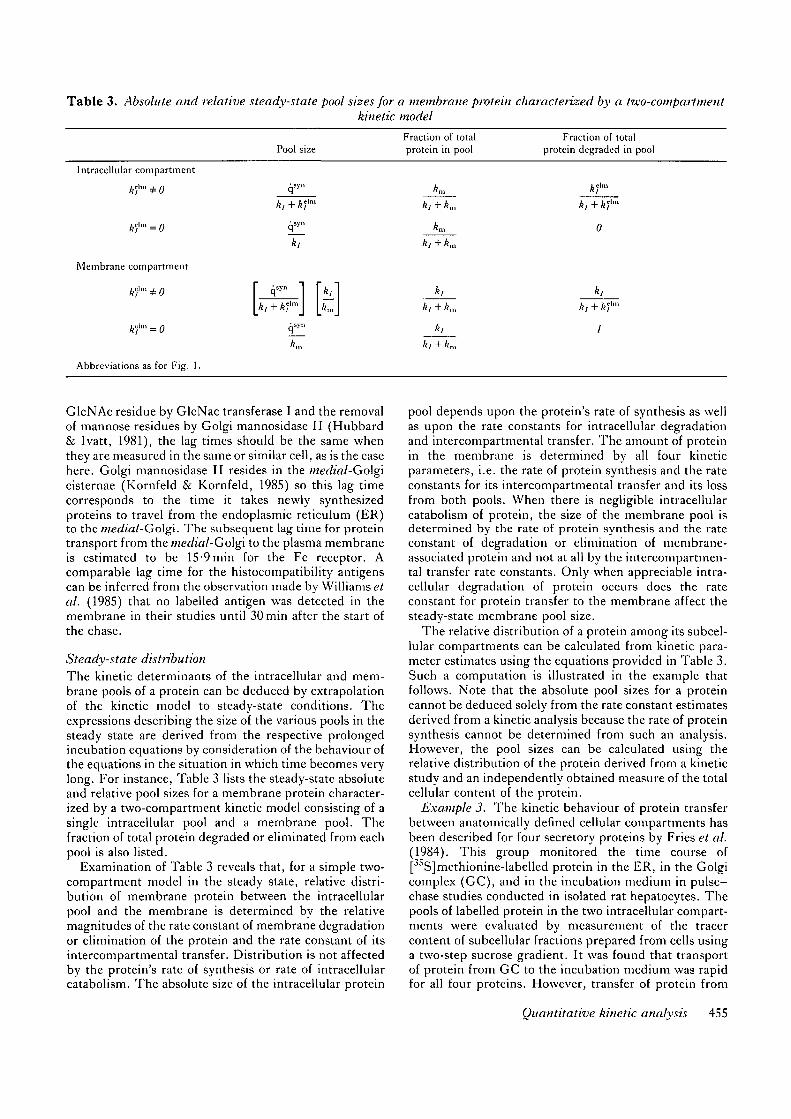
Table 3. Absolute and relative steady-state pool sizes for a membrane protein characterized by a two-compartmentkinetic model
Intracellular compartment
kf'" * 0
ft?'1" = 0
Membrane compartment
kfm + 0
k,m = 0
Abbreviations as for Fig. 1.
rb
Pool size
qsy-
ki+kf"'
qsyn
ft/
q5yn 1 Mq - n
Am
Fraction of totalprotein in pool
Am
ft, + ftm
Amft, + ft,,,
A,h, 4- h
A,
ft, + ft,,,
Fraction of totalprotein degraded in pool
k,+kf'"
0
A,
k, + k?"
1
GlcNAc residue by GlcNac transferase I and the removalof mannose residues by Golgi mannosidase II (Hubbard& Ivatt, 1981), the lag times should be the same whenthey are measured in the same or similar cell, as is the casehere. Golgi mannosidase II resides in the medial-Golgicisternae (Kornfeld & Kornfeld, 1985) so this lag timecorresponds to the time it takes newly synthesizedproteins to travel from the endoplasmic reticulum (ER)to the medial-Golgi. The subsequent lag time for proteintransport from the medial-Go\gi to the plasma membraneis estimated to be 15-9 min for the Fc receptor. Acomparable lag time for the histocompatibility antigenscan be inferred from the observation made by Williams etal. (1985) that no labelled antigen was detected in themembrane in their studies until 30 min after the start ofthe chase.
Steady-state distributionThe kinetic determinants of the intracellular and mem-brane pools of a protein can be deduced by extrapolationof the kinetic model to steady-state conditions. Theexpressions describing the size of the various pools in thesteady state are derived from the respective prolongedincubation equations by consideration of the behaviour ofthe equations in the situation in which time becomes verylong. For instance, Table 3 lists the steady-state absoluteand relative pool sizes for a membrane protein character-ized by a two-compartment kinetic model consisting of asingle intracellular pool and a membrane pool. Thefraction of total protein degraded or eliminated from eachpool is also listed.
Examination of Table 3 reveals that, for a simple two-compartment model in the steady state, relative distri-bution of membrane protein between the intracellularpool and the membrane is determined by the relativemagnitudes of the rate constant of membrane degradationor elimination of the protein and the rate constant of itsintercompartmental transfer. Distribution is not affectedby the protein's rate of synthesis or rate of intracellularcatabolism. The absolute size of the intracellular protein
pool depends upon the protein's rate of synthesis as wellas upon the rate constants for intracellular degradationand intercompartmental transfer. The amount of proteinin the membrane is determined by all four kineticparameters, i.e. the rate of protein synthesis and the rateconstants for its intercompartmental transfer and its lossfrom both pools. When there is negligible intracellularcatabolism of protein, the size of the membrane pool isdetermined by the rate of protein synthesis and the rateconstant of degradation or elimination of membrane-associated protein and not at all by the intercompartmen-tal transfer rate constants. Only when appreciable intra-cellular degradation of protein occurs does the rateconstant for protein transfer to the membrane affect thesteady-state membrane pool size.
The relative distribution of a protein among its subcel-lular compartments can be calculated from kinetic para-meter estimates using the equations provided in Table 3.Such a computation is illustrated in the example thatfollows. Note that the absolute pool sizes for a proteincannot be deduced solely from the rate constant estimatesderived from a kinetic analysis because the rate of proteinsynthesis cannot be determined from such an analysis.However, the pool sizes can be calculated using therelative distribution of the protein derived from a kineticstudy and an independently obtained measure of the totalcellular content of the protein.
Example 3. The kinetic behaviour of protein transferbetween anatomically defined cellular compartments hasbeen described for four secretory proteins by Fries et al.(1984). This group monitored the time course of[35S]methionine-labelled protein in the ER, in the Golgicomplex (GC), and in the incubation medium in pulse-chase studies conducted in isolated rat hepatocytes. Thepools of labelled protein in the two intracellular compart-ments were evaluated by measurement of the tracercontent of subcellular fractions prepared from cells usinga two-step sucrose gradient. It was found that transportof protein from GC to the incubation medium was rapidfor all four proteins. However, transfer of protein from
Quantitative kinetic analysis 455
ER to GC varied greatly in its rapidity among theproteins studied. By fitting a three-compartment kineticmodel to the data, the authors were able to calculateestimates of the half-lives for transfer from ER to GC:14min for albumin, 73min for transferrin, 80min forprealbumin, and 137 min for retinol-binding-protein(RBP). The half-lives for transfer from GC to theincubation medium were similar for all the proteins,between 5 and 20 min.
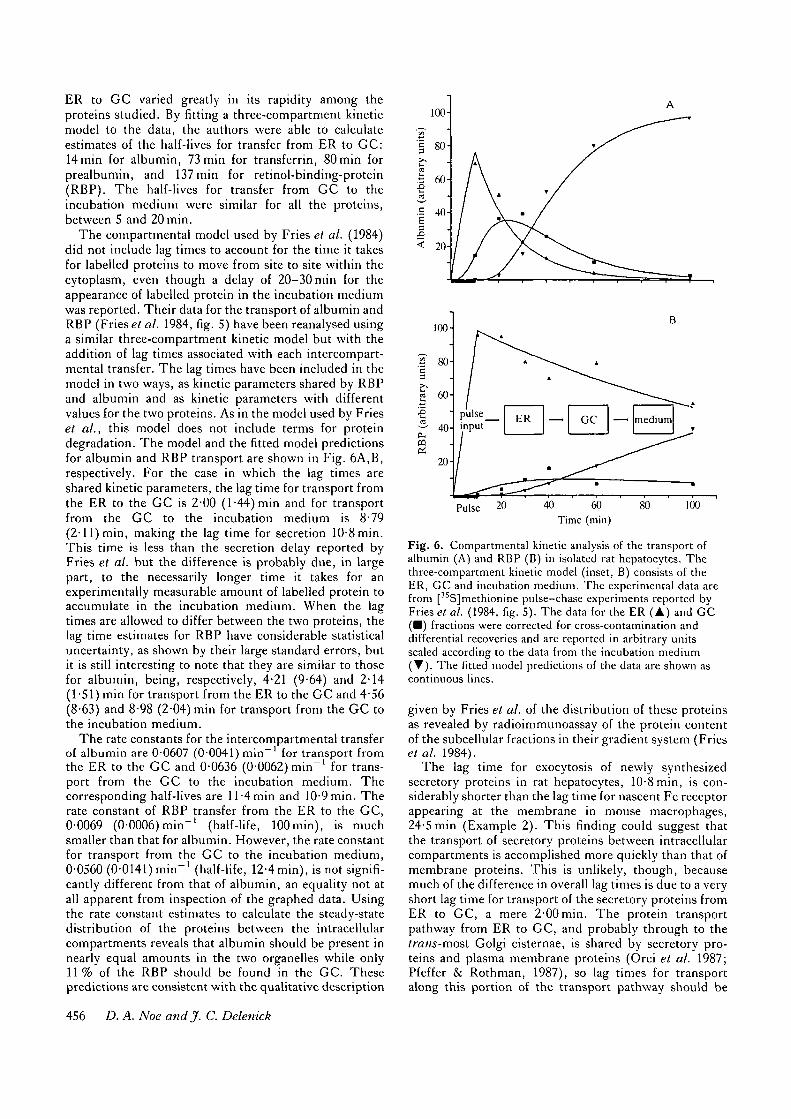
The compartmental model used by Fries et al. (1984)did not include lag times to account for the time it takesfor labelled proteins to move from site to site within thecytoplasm, even though a delay of 20-30min for theappearance of labelled protein in the incubation mediumwas reported. Their data for the transport of albumin andRBP (Fries et al. 1984, fig. 5) have been reanalysed usinga similar three-compartment kinetic model but with theaddition of lag times associated with each intercompart-mental transfer. The lag times have been included in themodel in two ways, as kinetic parameters shared by RBPand albumin and as kinetic parameters with differentvalues for the two proteins. As in the model used by Frieset al., this model does not include terms for proteindegradation. The model and the fitted model predictionsfor albumin and RBP transport are shown in Fig. 6A,B,respectively. For the case in which the lag times areshared kinetic parameters, the lag time for transport fromthe ER to the GC is 2-00 (1-44) min and for transportfrom the GC to the incubation medium is 8-79(2-11) min, making the lag time for secretion 10-8min.This time is less than the secretion delay reported byFries et al. but the difference is probably due, in largepart, to the necessarily longer time it takes for anexperimentally measurable amount of labelled protein toaccumulate in the incubation medium. When the lagtimes are allowed to differ between the two proteins, thelag time estimates for RBP have considerable statisticaluncertainty, as shown by their large standard errors, butit is still interesting to note that they are similar to thosefor albumin, being, respectively, 4-21 (9-64) and 2-14(1-51) min for transport from the ER to the GC and 4-56(8-63) and 8-98 (2-04) min for transport from the GC tothe incubation medium.
The rate constants for the intercompartmental transferof albumin are 0-0607 (0-0041) min"1 for transport fromthe ER to the GC and 0-0636 (0-0062) min"1 for trans-port from the GC to the incubation medium. Thecorresponding half-lives are 11-4 min and 10-9 min. Therate constant of RBP transfer from the ER to the GC,0-0069 (0-0006) min"1 (half-life, lOOmin), is muchsmaller than that for albumin. However, the rate constantfor transport from the GC to the incubation medium,0-0560 (0-0141) min"1 (half-life, 12-4 min), is not signifi-cantly different from that of albumin, an equality not atall apparent from inspection of the graphed data. Usingthe rate constant estimates to calculate the steady-statedistribution of the proteins between the intracellularcompartments reveals that albumin should be present innearly equal amounts in the two organelles while only11% of the RBP should be found in the GC. Thesepredictions are consistent with the qualitative description
Pulse 40 60Time (min)
Fig. 6. Compartmental kinetic analysis of the transport ofalbumin (A) and RBP (B) in isolated rat hepatocytes. Thethree-compartment kinetic model (inset, B) consists of theER, GC and incubation medium. The experimental data arefrom [ SJmethionine pulse—chase experiments reported byFries et al. (1984, fig. 5). The data for the ER (A) and GC(• ) fractions were corrected for cross-contamination anddifferential recoveries and are reported in arbitrary unitsscaled according to the data from the incubation medium( T ) . The fitted model predictions of the data are shown ascontinuous lines.
given by Fries et al. of the distribution of these proteinsas revealed by radioimmunoassay of the protein contentof the subcellular fractions in their gradient system (Friesetal. 1984).
The lag time for exocytosis of newly synthesizedsecretory proteins in rat hepatocytes, 10-8 min, is con-siderably shorter than the lag time for nascent Fc receptorappearing at the membrane in mouse macrophages,24-5 min (Example 2). This finding could suggest thatthe transport of secretory proteins between intracellularcompartments is accomplished more quickly than that ofmembrane proteins. This is unlikely, though, becausemuch of the difference in overall lag times is due to a veryshort lag time for transport of the secretory proteins fromER to GC, a mere 2-00 min. The protein transportpathway from ER to GC, and probably through to thetrans-mosl Golgi cisternae, is shared by secretory pro-teins and plasma membrane proteins (Orci et al. 1987;Pfeffer & Rothman, 1987), so lag times for transportalong this portion of the transport pathway should be
456 D. A. Noe andjf. C. Delenick
100-
PulseTime (min)
equal for both. It is more likely that the difference in thelag times arises from differences between the two celltypes or the two species.
Degradation and eliminationLoss of labelled protein has not been considered in thekinetic models discussed in the foregoing examples be-cause the authors did not report any loss. However, lossof label is often seen. Indeed, the removal of labelledprotein is sometimes the feature of interest in an exper-iment, such as in studies of intracellular catabolism ofprotein and of membrane protein turnover. Loss ofprotein from the system can be considered by inclusion ofappropriate loss terms in the equations describing theprotein's time course in the compartments under study.Table 2 shows the forms that the kinetic equations takewhen degradation or elimination of protein can occurfrom any compartment. These formulations are particu-larly useful, since it is often not known from which poolor pools protein is lost. If, in a kinetic analysis, theestimate of the rate constant for protein loss from acompartment is significantly larger than zero, it can beinferred that a kinetically meaningful loss of protein doestake place in the compartment. (Unfortunately, withnon-linear regression analysis, the significance of anestimate cannot be defined with the statistical rigourpossible with linear regression analysis (Metzler, 1981;Motulsky & Ransnas, 1987).)
If sufficient data of adequate quality have been col-lected, reliable estimates of the rate constants for proteinloss can be obtained. There are both theoretical limits tothe identifiability of parameter values for any givenexperimental design and practical limits to estimating thevalues from data showing measurement variability (Car-son et al. 1983). For instance, analysis of the simple two-compartment membrane protein kinetic model discussedearlier reveals that both compartments, the intracellularprotein pool and the membrane pool, must be monitoredin order to quantify the loss of protein from each. Thus,an experiment designed to measure only one pool could
45
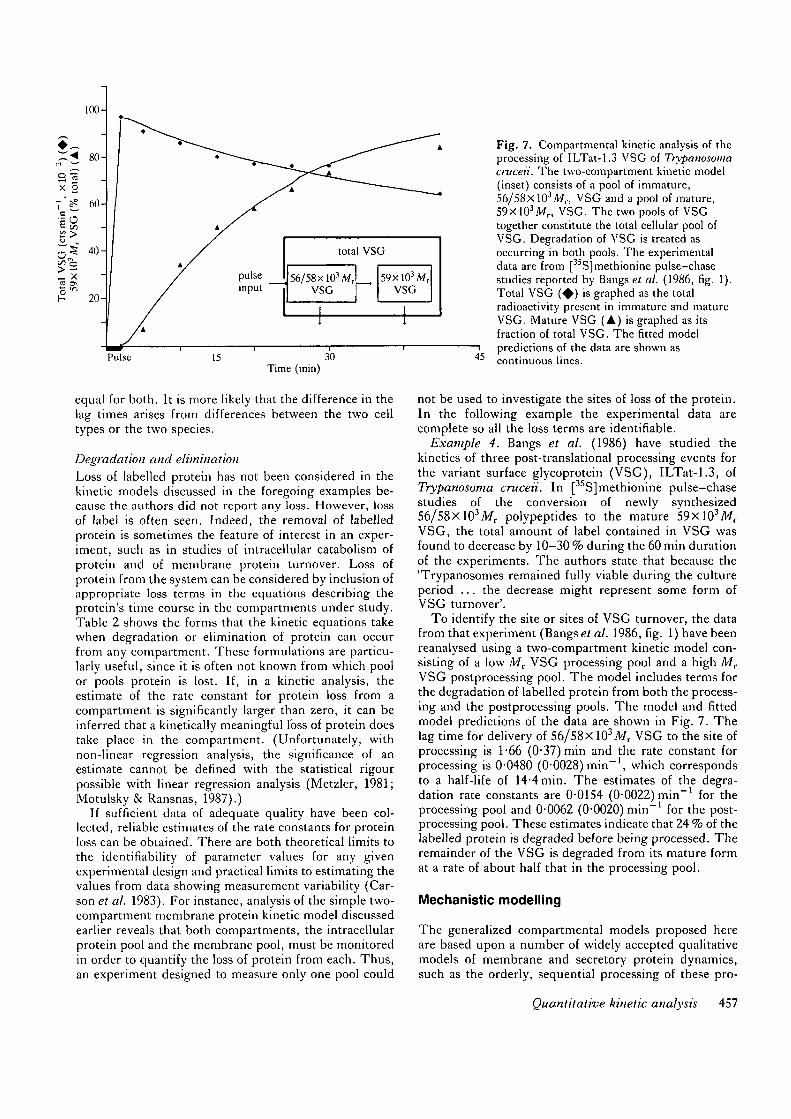
Fig. 7. Compartmental kinetic analysis of theprocessing of ILTat-1.3 VSG of Trypauosomacmceii. The two-compartment kinetic model(inset) consists of a pool of immature,56/58xlO3Mr, VSG and a pool of mature,59xlO3Afr, VSG. The two pools of VSGtogether constitute the total cellular pool ofVSG. Degradation of VSG is treated asoccurring in both pools. The experimentaldata are from [35S]methionine pulse-chasestudies reported by Bangs et al. (1986, fig. 1).Total VSG ( • ) is graphed as the totalradioactivity present in immature and matureVSG. Mature VSG (A) is graphed as itsfraction of total VSG. The fitted modelpredictions of the data are shown ascontinuous lines.
not be used to investigate the sites of loss of the protein.In the following example the experimental data arecomplete so all the loss terms are identifiable.
Example 4. Bangs et al. (1986) have studied thekinetics of three post-translational processing events forthe variant surface glycoprotein (VSG), ILTat-1.3, ofTrypanosoma cruceii. In [35S]methionine pulse-chasestudies of the conversion of newly synthesized56/58xlO3Mr polypeptides to the mature 59xlO3Mr
VSG, the total amount of label contained in VSG wasfound to decrease by 10-30 % during the 60 min durationof the experiments. The authors state that because the'Trypanosomes remained fully viable during the cultureperiod . . . the decrease might represent some form ofVSG turnover'.
To identify the site or sites of VSG turnover, the datafrom that experiment (Bangs et al. 1986, fig. 1) have beenreanalysed using a two-compartment kinetic model con-sisting of a low Mv VSG processing pool and a high MT
VSG postprocessing pool. The model includes terms forthe degradation of labelled protein from both the process-ing and the postprocessing pools. The model and fittedmodel predictions of the data are shown in Fig. 7. Thelag time for delivery of 56/58X 103Mr VSG to the site ofprocessing is 1 -66 (0-37) min and the rate constant forprocessing is 0-0480 (0-0028) min"1, which correspondsto a half-life of 14-4 min. The estimates of the degra-dation rate constants are 0-0154 (0-0022) min"1 for theprocessing pool and 0-0062 (0-0020) min"1 for the post-processing pool. These estimates indicate that 24 % of thelabelled protein is degraded before being processed. Theremainder of the VSG is degraded from its mature format a rate of about half that in the processing pool.
Mechanistic modelling
The generalized compartmental models proposed hereare based upon a number of widely accepted qualitativemodels of membrane and secretory protein dynamics,such as the orderly, sequential processing of these pro-
Quantitative kinetic analysis 457
teins and the vectorial transport of the proteins to themembrane and medium, respectively. The models arenot mechanistic, however, in that explicit mechanisms ofprocessing and transport are not considered. Despitethis, the models perform very well, as demonstrated inthe examples. This may mean that the data analysed donot reflect the presumably subtle and complex mechan-isms by which processing and transport occur or it couldmean that, under the experimental conditions employedin the studies, the biological system does indeed behaveaccording to the first-order kinetics stipulated in themodels.
To explore this question, the data of Williams et al.(1985, fig. 2b) have been examined in terms of a mechan-istic model in which the intracellular transport of proteinfrom ER to GC requires binding to a transport moleculethat has different binding affinities for different proteins.This mechanism was advanced by Fitting & Kabat (1982)to explain the kinetic behaviour of the intracellulartransport of viral membrane glycoproteins and has gainedpopularity as an explanation for the diversity in the ratesof processing and transport of both membrane andsecretory proteins (Lodish, 1988). The kinetic represen-tation of this mechanism consists of four pools, three ofwhich are in the ER (a pool of labelled protein, a pool ofunbound transporter, and a pool of labelled proteinbound to the transporter) and a pool of labelled protein inthe GC. Because the pool of unbound transporter ismuch larger than the pool of labelled protein in a tracerexperiment, the pool size of the unbound transporter canbe considered to be constant and binding of labelledprotein to the transporter can be treated as first-order.Dissociation of transporter-bound protein in the ER andrelease of transporter-bound protein to the GC arecharacterized by first-order kinetics. Because it can beassumed that the pool of labelled protein bound to thetransporter is small, the sum of the rate constants fordissociation within the ER and release to the GC must belarger than the rate constant for binding (Riggs, 1963).This means that the mechanistic model reduces to eitherof two kinetic models. If the rate constant for pro-tein-transporter dissociation is not small, then a three-compartment kinetic model is appropriate: labelled pro-tein is exchanged bidirectionally between the unboundand transporter-bound pools in the ER and unidirectio-nally from the transporter-bound pool to the GC pool, allthe rate constants being first-order. If the rate constantfor protein-transporter dissociation is small, then therate constant for release into the GC must be largerelative to it and to the rate constant for binding, and atwo-compartment model is appropriate: labelled proteinpasses by first-order transfer to the GC pool.
Regression analysis of the experimental data for thedifferential processing of the two histocompatibility anti-gens studied by Williams et al. (1985) reveals that thethree- and two-compartment kinetic models fit the dataequally well. However, to achieve a satisfactory fit of thedata using the three-compartment model, the pool size oftransporter-bound protein must be unrealistically large,approximately 15 % of the size of the total ER pool in thesteady state. This suggests that the three-compartment
model does not apply here. Therefore, if the transfer ofthese proteins is in fact mediated by a transport molecule,the rate constant for dissociation must be small, resultingin kinetic behaviour well represented by the two-com-partment model, a model identical to the kinetic modelused in Example 1. This shows how a model constructedwithout reference to a specific mechanism may, neverthe-less, accurately model the kinetic consequences of themechanism. Of course, Fitting & Kabat's (1982) pro-posed transfer mechanism may be incorrect in its presentform and the success of the compartmental approach inthe modelling of these data may arise from being a goodrepresentation of the actual mechanism of transfer. Onlyfurther experimental work will answer that question.
References
BANGS, J. D., ANDREWS, N. W., HART, G. W. & ENGLUND, P. T.(1986). Posttranslational modification and intracellular transport ofa Trypanosome variant surface glycoprotein. J. Cell Biol. 101,725-734.
BERMAN, M. (1963). The formulation and testing of models. Ann. N.Y.Acad. Sci. 108, 182-194.
BURGESS, T. L. & KELLY, R. B. (1987). Constitutive and regulatedsecretion of proteins. A. Rev. Cell Biol. 3, 243-293.
CARSON, E. R., COBELLI, C. & FINKELSTEIN, L. (1983). The
Mathematical Modeling of Metabolic and Endocrine Svstems, pp.113-117. New York: John Wiley & Sons.
FITTING, T. & KABAT, D. (1982). Evidence for a glycoprotein signalinvolved in transport between subcellular organelles. J. biol. Chem.257, 14011-14017.
FRIES, E., GUSTAFSSON, L. & PETERSON, P. A. (1984). Four
secretory proteins synthesized by hepatocytes are transported fromendoplasmic reticulum to Golgi complex at different rates. EMBOJ. 3, 147-152.
GODFREY, K. (1983). Compartmental Models and Their Application.London: Academic Press.
GREEN, S. A., ZIMMER, K. P., GRIFFITHS, G. & MELMAN, I. (1987).Kinetics of intracellular transport and sorting of lysosomalmembrane and plasma membrane proteins. J. Cell Biol. 105,1227-1240.
HUBBARD, S. C. & IVATT, R. J. (1981). Synthesis and processing ofasparagine-linked oligosaccharides. A. Rev. Biochem. 50, 555-583.
JACQUEZ, J. A. (1985). Compartmental Analysis in Biology andMedicine, 2nd edn. Ann Arbor: University of Michigan Press.
KORNFELD, R. & KORNFELD, S. (1985). Assembly of asparagine-linked oligosaccharides. A. Rev. Biochem. 54, 631-664.
LANDAW, E. M. & DISTEFANO, J. J. Ill (1984). Multiexponential,multicompartmental, and noncompartmental modeling. II. Dataanalysis and statistical considerations. Am. J. Phvsiol. 246,R665-R677.
LODISH, H. F. (1988). Transport of secretory and membraneglycoproteins from the rough endoplasmic reticulum to the Golgi.J.biol. Chem. 263, 2107-2110.
METZLER, C. M. (1981). Statistical properties of kinetic estimates. InKinetic Data Analysis (ed. L. Endrenyi), pp. 25-37. New York:Plenum Press.
MOTULSKY, H. J. & RANSNAS, L. A. (1987). Fitting curves to datausing nonlinear regression: a practical and nonmathematicalreview. Fedn Am. Socs exp. Biol. 1, 365-374.
ORCI, L., RAVAZZOLA, M., AMHERDT, M., PERRELET, A., POWELL,
S. K., QUINN, D. L. & MOORE, H.-P. H. (1987). The trans-maslcisternae of the Golgi complex: a compartment for sorting ofsecretory and plasma membrane proteins. Cell 51, 1039-1051.
PALADE, G. (1975). Intracellular aspects of the process of protein.Science 189, 347-358.
PFEFFER, S. R. & ROTHMAN, J. E. (1987). Biosynthetic proteintransport and sorting by the endoplasmic reticulum and Golgi. A.
458 D. A. Noe andj. C. Delenick
Rev. Biochem. 56, 829-852. Intracellular transport of membrane glycoproteins: two closelyRESCIONO, A. & BECK, J. S. (1987). The vise and abuse of models. J. related histocompatibility antigens differ in their rates of transit to
Phannacokin. Biophann. 15, 327-340. the cell surface, j . Cell Biol. 101, 725-734.RIGGS, D. S. (1963). The Mathematical Approach to Physiological
Problems, p. 275. Cambridge, MA: MIT Press. (Received 21 August 198S -Accepted, in revised form, 2 DecemberWILLIAMS, D. B., SWIEDLER, S. J. & HART, G. W. (1985). 19SS)
Quantitative kinetic analysis 459