Embed Size (px)
Citation preview

Quantitative Analysis of Additives in Low Density Polyethylene Using On-line
Supercritical Fluid Extraction /Supercritical Fluid Chromatography
Lucy Ying Zhou
Thesis submitted to the Faculty of the Virginia Polytechnic Institute and
State University in partial fulfillment of the requirements for the degree of
Master of Science
in
Chemistry
Larry T. Taylor, Chair
Harry Dorn
Harold M. McNair
June 1998
Blacksburg, Virginia
Keywords: Supercritical, Extraction, Chromatography, On-line, Polymer additives, HPLC
Copyright 1998, Lucy Y. Zhou

Quantitative Analysis of Additives in Low Density Polyethylene Using On-line
Supercritical Fluid Extraction /Supercritical Fluid Chromatography
Lucy Ying Zhou
(ABSTRACT)
Polymer additives exemplify many classes of compounds which possess a wide
variety of chemical (i.e., phenols, amides, esters) and physical (i.e., volatility, solubility)
properties. They are incorporated into polyolefins and other such polymeric materials for a
number reasons: (a) to prevent degradation by ultraviolet light, heat, and oxygen; (b) to
aid in the processing of the polymer; and (c) to modify the physical properties of the
polymer. Since the purity and amount of additive can affect polymer properties, it is very
important to characterize and quantify additives in polymer products. Traditional liquid
solvent/polymer extraction methods, which involve dissolution/precipitation, are time-
consuming, uneconomical, and the recoveries are significantly lower than 90%.
In recent years, analysis with supercritical fluids (SFs) has emerged as an
alternative analytical technique because SFs afford higher diffusivity and lower viscosity.
In this research, an on-line Supercritical Fluid Extraction (SFE)/Supercritical Fluid
Chromatography (SFC) system was assembled to provide efficient extraction and
separation of polymer additives with quantitative results. The effects of various SFE/SFC
parameters, such as trapping temperature, injection temperature, extraction pressure and
temperature, dynamic extraction time, and fluid flow rate on extraction and separation
efficiencies of different additive standards (i.e., BHT, BHEB, Isonox 129, Irganox 1076
and Irganox 1010) were investigated. Optimized conditions were employed to
quantitatively extract additives from LDPE. Identification of additives was performed by
comparing the retention time with each additive standard. Results obtained from on-line
SFE/SFC were compared to results from off-line SFE/High Performance Liquid
Chromatography (HPLC) and off-line Enhanced Solvent Extraction (ESE)/HPLC.

iii
This thesis is dedicated to
Haiqing, Amy, Dad, Mom, and Tong

iv
Acknowledgments
I would like to extend thanks and appreciation to Dr. Larry T. Taylor for his
guidance and confidence throughout my graduate studies. The friendship and support of
everyone, Dr. Mehdi Ashraf-Khorassani, Dr. Rose Shi, Dr. Phyllis Eckard, Ms. Shelly
Porter, Ms. Karen Yang, Ms. Lori McDaniel, Ms. Negin Nazem, Ms. Angela Pinto, Mr.
Dan Brannegan, and Mr. Mark Stone, in Taylor’s group was also invaluable to me.
To all my family I extend my deepest thanks for their constant support. The first of
all is my husband Haiqing Yuan for his encouragement, inspiration and love. Without him
I couldn’t overcome difficulties during the tough times. A very special thank you
expresses to Mom, Dad and my brother for their love and support. Lastly, I would like to
thank my lovely daughter Amy whose smiling face has been my source of happiness.
Also, I would like to acknowledge my committee members for their time and
guidance.

v
Table of Contents
Page
Abstract ii
Acknowledgments iv
List of Figures vi
List of Tables viii
I. Introduction 1
A. Extraction and Separation with Supercritical Fluids 1
a. Supercritical Fluids 1
b. Supercritical Fluid Extraction 4
c. Supercritical Fluid Chromatography 8
d. On-line Supercritical Fluid Extraction/ Supercritical Fluid
Chromatography 13
B. Polymer Additives 16
a. Polymer Additives 16
b. Polymer Additive Analysis 28
II. Quantitative Analysis of Different Additives from Low Density Polyethylene 35
A. Introduction 35
B. Experimental 35
C. Results and Discussion 47
D. Conclusions 79
Vita 80

vi
List of Figures
Figure Description Page
1.1 Solid-liquid-gas-supercritical fluid phase diagram 2
1.2 Basic scheme of SFE system 6
1.3 Schematic diagram of SFC system 10
1.4 Van Deemter plots for SFC and HPLC 11
1.5 Schematic diagram of on-line SFE/SFC 15
1.6 Chemical structure of hindered phenols 20
1.7 Hindered phenolic types 22
1.8 The chain terminating mechanism of BHT 23
1.9 The mechanism of secondary additives 24
1.10 The relative volatilities of BHT and Irganox 1010 27
2.1A Schematic diagram of on-line SFE/SFC (extraction mode) 37
2.1B Schematic diagram of on-line SFE/SFC (injection mode) 39
2.2 On-line SFE/SFC chromatogram of spiked sand 40
2.3 Schematic diagram of ESE 43
2.4 An example of Excel statistics worksheet 46
2.5 Chromatograms of impurities in CO2 tanks 48
2.6 Chromatograms of memory effect 50
2.7 SFE/SFC after various cleaning steps 51
2.8 Comparison of different trapping protocols 53
2.9 Effect of trapping temperatures on trapping efficiency 55
2.10 Chromatograms at different desorption temperatures 56
2.11 Effect of extraction pressure on extraction efficiency 58
2.12 Effect of extraction temperature on extraction efficiency 60
2.13 Effect of fluid flow rate on collection efficiency 62
2.14 Effect of extraction time on extraction efficiency 63

vii
2.15 Calibration curves of additive standard from spiked sand 65
2.16 On-line SFE/SFC chromatogram of LDPE sample 68
2.17 Extraction profile of LDPE sample 69
2.18 The transformation when dimerization of BHT occurs 72
2.19 Off-line SFE/HPLC chromatogram of LDPE sample 73

viii
List of Tables
Table Description Page
1.1 Features of various solvents at the critical point 3
1.2 Comparison of the physical properties of supercritical CO2 and
those of ordinary gases and liquids 5
1.3 Classification of additives 17
1.4 Major commercial antioxidants 19
1.5 Physical properties of five target antioxidants 26
2.1 Peak area for calibration curves 66
2.2 %Recovery of additives from LDPE with on-line SFE/SFC 71
2.3 %Recovery of additives from LDPE with off-line SFE/HPLC 75
2.4 %Recovery of additives from LDPE with off-line ESE/HPLC 77
2.5 Concentration of additives from LDPE sample 78

1
Chapter 1
Introduction
Extraction and Separation with Supercritical Fluids
Supercritical Fluids
A typical phase diagram for a pure substance (Figure 1.1) shows the temperature
and pressure region where the substance occurs as a single phase [viz., solid (s), liquid (l)
or gas (g)]. There are three curves describing the sublimation, melting and boiling
processes. The three curves intersect at the so-called triple point (TP), where the solid,
liquid, and gaseous phases coexist in equilibrium. Points along the curves (between the
phases) define the equilibrium between two of the phases. The boiling curve starts at the
TP and ends at the critical point (CP). The critical pressure (Pc) is defined as the
maximum pressure at which a liquid can be converted to a gas by an increase in
temperature. Whereas the critical temperature (Tc) is the highest temperature at which a
gas can be converted to a liquid by an increase in pressure. We can therefore define a
supercritical fluid (SF) as any substance that is above its critical pressure and critical
temperature. The region of pressures and temperatures above Pc and Tc is called the
supercritical region 1.
The critical point is characteristic for each substance. Table 1.1 2 lists the critical
pressure and temperature for various solvents, as well as the fluid density at the critical
point, which is called the critical density (ρc) 1. By far the most common fluid used in
supercritical fluid extraction (SFE) and supercritical fluid chromatography (SFC) is
carbon dioxide (CO2). The critical parameters of CO2 are about 31oC and 73 atm, which
are easily obtained in the laboratory. In addition, CO2 is nonflammable, nontoxic, less
expensive than reagent grade liquid solvents, readily available in a high state of purity,
and environmentally friendly 1.
1 Taylor L.T. (1996) Supercritical Fluid Extraction, John Wiley & Sons, Inc., New York2 Luque de Castro M.D., Valcarcel M., Tena M.T. (1994) Analytical Supercritical Fluid Extraction,Springer-Verlag, Berlin

2
Figure 1.1. Solid-liquid-gas-supercritical fluid phase diagram. (Taken from ref. 1)
Sublimation
Melting
VaporizationTP

3
Table 1.1. Features of various solvents at the critical point. (Taken from ref. 2)
Solvents Tc (oC) Pc (bar) ρρc (g/mL)
Inorganic
Carbon dioxide 31.1 72 0.47
Dinitrogen monoxide 36.5 70.6 0.45
Ammonia 132.5 109.8 0.23
Water 374.2 214.8 0.32
Sulfur hexafluoride 45.5 38
Helium -268 2.2 0.07
Xenon 17 56.9 1.11
Hydrocarbons
Methane -82 46 0.169
Propane 96.7 42.4 0.22
Ethylene 11 50.5 0.2
Benzene 288.9 98.7 0.302
Toluene 319 41.1 0.292
Alcohols
Methanol 239 78.9 0.27
Isopropyl alcohol 235.3 47.6 0.273
Ethers
Ethyl methyl ether 164.7 47.6 0.272
Tetrahydrofuran 267 50.5 0.32
Halides
Trifluoromethane 26 46.9 0.52
Dichlorodifluoromethane 111.7 109.8 0.558
Chlorotrifluoromethane 28.8 214.8 0.58
Trichlorofluoromethane 196.6 28.9 0.554
Miscellaneous
Acetonitrile 275 47 0.25
Pyridine 347 56.3 0.312

4
A SF exhibits physicochemical properties intermediate between those of a liquid
and a gas. The physical properties of a gas, liquid and SF are compared in Table 1.2 1.
The density of a SF which is always close to the typical values for liquids, depends on the
pressure and temperature to which it is subjected. The high density is responsible for the
good solvating power of SFs, where interactions between the fluid and solute molecules
are quite strong. SFs have more favorable hydrodynamic properties than those of liquids
because supercritical viscosity values are more like those of gases 1. On the other hand,
their near-zero surface tension allows them to readily penetrate porous solids and packed
beds. For constant column dimensions, the pressure drop along an SFC column is typically
ten times smaller than it is in liquid chromatography (LC), however, ten times greater than
in gas chromatography (GC) 3.The diffusion coefficients of solutes in SFs are between
those displayed for liquids and gases. Mass transfer relative to a liquid is rapid in SFs
because diffusivities of SFs are higher than those of liquids 1. In conclusion, the properties
of gas-like diffusivity and viscosity, coupled with liquid-like density, combined with the
pressure and temperature-dependent solvating power of SFs lead to more expeditious and
efficient analytical extraction and separation.
Supercritical Fluid Extraction
Figure 1.2 shows a schematic diagram illustrating the basic elements of a
supercritical fluid extraction (SFE) 2. A gas cylinder provides a source of SF (e.g., CO2).
Both syringe and reciprocating pumps can be used as solvent delivery systems. For the
instrumentation used in this thesis, a syringe pump was employed. Although syringe
pumps are relatively expensive, they deliver pulse-free flow over a large range of flow
rates 1. A supplementary modifier pump is used if the analyte/matrix to be extracted
requires a polar modifier. Stainless steel or fused silica tubing is used to connect the
various parts of the extraction apparatus.
The extraction chamber or vessel is the compartment where the sample is placed
3 Hawthorne S.B., Miller D.J., Langenfeld J.J. (1990) J. Chromatogr. Sci. 28, 2

5
Table 1.2. Comparison of the physical properties of supercritical CO2 and those of
ordinary gases and liquids. (Taken from ref. 1)
Density(g/cm3)
Viscosity(g/cm⋅s)
Diffusion coefficient(cm2/s)
Gases 0.0001-0.002 0.0001-0.0003 0.1-0.4
Supercritical CO2 Tc, Pc 0.47 0.0003 0.0007
Tc, 6Pc 1.0 0.001 0.0002
Liquids 0.6-1.6 0.002-0.03 0.000002-0.00002

6
Fluid reservoir
Pump
Extraction vessel
Restrictor
Collector On-line interface
Figure 1.2. Basic scheme of SFE system. (Taken from ref. 2)

7
for subjection to the action of the SF. It must be capable of withstanding high pressure
(300-600 atm) 1. The extraction vessel is usually a stainless steel cylinder of varying length
and inner diameter. The high pressure rating and the absence of leaks are characteristic of
SFE vessels 1. The vessel is in turn placed in a temperature-controlled zone, which is
required, since the critical temperature of most SFs is above room temperature.
The pressure change from supercritical conditions in the extraction vessel to the
prevailing atmospheric conditions is effected via an interface known as a restrictor.
Commercially available restrictors are of two types: fixed restrictors, which are
manufactured in various designs (e.g., linear, tapered, integral, pinhole, and frit), and
variable restrictors 1. Heating of the restrictor is usually required to avoid plugging
through freezing. In the on-line SFE/SFC system used in this research, a linear fused silica
capillary was employed as a vessel outlet restrictor.
Following the restrictor is a trapping device. There are three basic types of SFE
systems characterized by the way in which the solutes are isolated from the SFE media
used 4. In the first type, solutes are separated from the extraction media based on pressure
reduction, which causes a solubility decrease. In the second type, a temperature change is
used to bring about a decrease in solubility from the extraction media, and in the third type
solutes are absorbed onto an appropriate absorbate. Often a combination of the first and
second types is used, where after extraction the SF is simply evaporated to leave the
solutes of interest. The simplest way of collection is when the restrictor outlet is inserted
through the septum of a collection vial containing a few milliliters of solvent. The most
common way of collection is solid phase trapping. The materials used for this purpose are
column packings or inert surfaces. The solid phase trapping system is often heated or
cooled depending on the volatility of the target analytes. In any case, this collection mode
involves an additional step which is desorption of the analytes from the adsorbent by
elution with a small amount of solvent for subsequent analysis or, alternatively, thermal
4 Saito M., Hondo T., Yamauchi Y. (1988) Fractionation by coupled micro-supercritical fluid extractionand supercritical fluid chromatography, Supercritical Fluid Chromatography, ed. Smith R.M., RSCChemistry Monographs, London
8
desorption and sweeping of the trap by the eluent if an on-line coupled system is used. The
trapping temperature depends on whether the analytes are to be isolated from the fluid.
The collection chamber should be sealed in order to avoid losses of the analytes. In this
research, a cryogenic trap served as the interface between SFE and SFC. Thermal
desorption and sweeping the trap with SF CO2 was employed to flush analytes onto the
SFC column.
Contact between the SF and sample from which extraction takes place can be
established in a static or dynamic mode 1. In a static extraction, the sample matrix is
soaked in a fixed amount of SF. This type of extraction is often compared to a teabag in a
cup of water. In a dynamic extraction, SF continuously passes through the sample matrix.
This is analogous to a coffee maker 1. Typically a dynamic extraction can be more
exhaustive than a static extraction. SFE can be performed in the dynamic mode, static
mode or a combination of the two.
In order to develop an efficient and quantitative extraction method, many
experimental parameters must be optimized. The extraction pressure is an important
variable because the density, and hence the solvating power of SF is directly related to the
pressure. The effect of temperature is more complicated than that of pressure. Increasing
the temperature increases the diffusion coefficients of the solutes, whereas at the same
time it also decreases the density. In addition, the considerations of fluid flow rate,
addition of a modifier, and extraction time should be explored to achieve highest
recoveries.
Supercritical Fluid Chromatography
Supercritical fluid chromatography (SFC) may be defined as a form of
chromatography (i.e., a physical separation method based on partitioning of an analyte
between the mobile phase and the stationary phase) in which the mobile phase is subjected
to pressures and temperatures near or above the critical point for the purpose of enhancing

9
the mobile phase solvating power 5. A schematic of a SFC system is shown in Figure 1.35. The use of SFs as chromatographic mobile phases was first reported in 1962 by Klesper,
Corwin and Turner 6. However, early development in this field was slow due to
experimental problems in using SFs, the lack of commercially available SFC
instrumentation, and its being overshadowed by the simultaneous growth of high
performance liquid chromatography (HPLC) 7. The recent resurgence of interest in SFC is
due to the potential advantages afforded by the unique characteristics of the mobile phase
in SFC over GC and HPLC, and more importantly, it has been augmented by increased
technology in pumps and detectors for SFC.
The best way to illustrate these attributes of SFC is a direct comparison with
HPLC. Figure 1.4 shows Van Deemter plots for HPLC and SFC on the same packed
column under the same operating temperature 8. The Figure indicates that higher analyte
diffusivity results in higher optimum average linear velocities (µopt) for SFs than for liquids,
which results in increased speeds of analysis for SFC as compared to HPLC. When
compared to HPLC, higher analyte diffusivity causes narrower chromatographic peaks,
which results in increased detector sensitivity 8,9.
Lower viscosity of SFs causes a lower column pressure drop across a SFC column
than that observed using the same column for HPLC. Therefore longer packed columns
can be possibly used in SFC to increase total efficiency.
GC-like open-tubular columns have been also used in SFC. The bonded phases of
SFC open tubular capillary columns typically are cross-linked more than are those of GC
columns. This protects the stationary phase from being stripped by the harsher
supercritical mobile phases. The use of capillary columns has advantages over packed
5 Lee M.L., Markides K.E. (1990) Analytical Supercritical Fluid Chromatography and Extraction, ed.Chromatography Conferences, Inc., Provo, Utah6 Klesper E., Corwin A.H., Turner D.A. (1962) J. Org. Chem. 27, 7007 Novotny M. (1981) Chromatographia 14, 6798 Gere D.R. (1983) Science 222, 2539 Gere D.R. (1983) Assay of caffeine in beverages by supercritical fluid chromatography, Hewlett-PackardPublication No. 43-5953-1695, 1-6

10
Highpressure
pump
Oven
Detector Recorder
Column
Sampleintroduction
system
Figure 1.3. Schematic diagram of SFC system. (Taken from ref. 5)

11
Figure 1.4. Van Deemter plots for chromatographic data from SFC and HPLC elution ofpyrene. (Taken from ref. 8)
The plate height measurements were made using the same ODS column, the sameoperating temperature (40oC), and the same solute (pyrene). The mobile phase for theHPLC separation was acetonitrile:water (70:30 by volume); the mobile phase for the SFCseparation was carbon dioxide at the average density 0.75 g/cm3. These conditions provideapproximately the same capacity factor (k´) for pyrene in both cases.

12
columns in SFC just as in GC. Capillary columns generally produce sharper
chromatographic peaks than packed columns, which results in improved separation and
detector sensitivity. Potentially, the main advantages capillary column SFC has over
packed column SFC is that longer capillary columns can be used. Thus, the separations
using capillary columns can be performed using a greater number of theoretical plates, i.e.,
increased efficiency. The low pressure drop and open-tubular nature of the capillary allow
very long columns (e.g., 60 m) to be used. Packed columns, however, can handle higher
sample-loading capacity, which can yield lower detection limits and higher flow rates, thus
shortening analysis time.
Density and density gradients control elution in SFC where both pressure and
temperature can be adjusted to obtain the desired densities. This is an advantage over GC
methodology in which temperature is virtually the only adjustable parameter. A wide range
of densities in SFC yields greater mobile phase solvation than do the inert gases used in
GC. SFC does not suffer from volatility limitations as GC does. SFC is a particularly good
technique for analysis of thermally labile, reactive or involatile materials, because
separations are performed at low temperatures. In addition, SFC mobile phases can be
modified to enhance solvating power.
One of the principal benefits of SFC is the flexibility of using both GC and HPLC
detectors. For inorganic mobile phases such as CO2, ammonia, and xenon, a universal
flame ionization detector (FID) commonly is chosen. However, organically modified SFC
mobile phases must be avoided with this detector. Other GC detectors commonly applied
to SFC include nitrogen, phosphorous, flame photometric, Fourier transform-infrared (FT-
IR) spectrometric, and mass spectrometric (MS). Many LC detectors are useful for mobile
phases that are incompatible with the GC type detectors. Ultra-violet (UV) absorbance,
fluorescence, and refractive index (RI) detectors are compatible with SFC.

13
On-line Supercritical Fluid Extraction /Supercritical Fluid Chromatography
SFE is generally not selective enough to isolate specific solutes from the matrix
without further clean-up or resolution from co-extracted species prior to qualitative and
quantitative analysis. Consequently, for analytical applications, SFE is usually used in
conjunction with chromatographic techniques, to improve the overall selectivity of the
process in isolating specific solutes. SFE combined with chromatography can be either
“off-line” or “on-line”. In the off-line process, SFE takes place as a separate and isolated
process to the chromatography. Whereas in the on-line process, SFE and chromatography
are coupled to form an integrated process. In other words, the extracted species are
passed directly to the chromatograph, usually via a trap or sample loop and a valve-
switching device.
Among all these coupling techniques, on-line SFE/SFC is the most feasible
combination. One obvious advantage is that the solvent used to inject the sample on the
column is the same as the mobile phase 10, the primary requisite for effective coupling of
two techniques (viz., compatibility between the output of the first system and input of the
second) is met. The first on-line SFE/SFC system was introduced by Sugiyama et al. 11
and, separately, Skelton et al. 12. Sugiyama et al. investigated a direct coupling of SFE to
SFC through two six-way valves, a injector valves, and an extract trap loop. They
demonstrated that the on-line system allowed the analyst to apply raw and/or solid
samples to the system to obtain chromatogram of sample extracts. Skelton et al. described
an alternative method whereby both extraction of the sample and introduction of the
extract onto the column was accomplished on-line using only the supercritical fluid mobile
phase. This sampling technique was made possible by a simple valving scheme which ties
directly the extraction vessel, the injector, the packed column and the detector. Different
samples (e.g., coal and coffee) were conducted with this on-line valving scheme, giving
10 Jackson W.P., Markides K.E., Lee M.L. (1986) J. High Resolut. Chromatogr. Chromatogr. Commun. 9,213.11 Sugiyam K., Saito M., Hondo T., Senda M. (1985) J. Chromatogr. 332, 10712 Skelton R.J. Jr., Johnson C.C., Taylor L.T. (1986) Chromatographia 21, 3

14
the results similar to the off-line, traditional methods. The efficient, fast and selective
extraction capabilities of SFs allow quantitative extraction and direct transfer of selected
solutes to the column, often without the need for further sample treatment or clean-up.
In addition to the above, major advantages of on-line SFE/SFC are enhanced
capabilities that are normally beyond the scope of either technique when used separately.
These enhanced capabilities include 1) suitability for trace analysis, 2) sample preparation
with minimal sample contamination, 3) the ability to rapidly extract and directly analyze
unstable and oxidation sensitive solutes, and 4) on-line automation of the sample
preparation step with the chromatographic analysis step 13.
The on-line SFE/SFC is nearly always achieved through the on-line linkage of a
SFE vessel through a valve switching system, although other means for the direct
introduction of SFE extracts such as the thermal modulation interface, developed by Mitra
and Wilson 14, have been used for capillary SFC. Figure 1.5 shows the configuration for
the on-line SFE/SFC system used in our work. The switching valves allow the extracted
sample to be collected in a cryogenic accumulator while the same pump delivers the SF.
The SF acts as the mobile phase for chromatography and the extracts are focused on the
cryogenic trapping interface located prior to the chromatographic column. The purpose of
the cryofocusing is to concentrate the solutes of interest into a narrow band for “injection”
onto the SFC, leading to better detection limits, easier quantitation and more
reproducibility 13,15-16. After extraction and collection, the valves are actuated and the trap
temperature ballistically raised by means of an external heating system. In this way, the SF
transfers the extracted substances from the trap to the analytical column.
13 Ashraf-Khorassani M., Levy J.M. (1990) J. High Resolut. Chromatogr. 13,74214 Mitra S., Wilson N.K. (1990) J. Chromatrogr.Sci. 28,18215 Xie Q.L., Markides K.E., Lee M.L. (1989) J. Chromatrogr.Sci. 27,36516 Yocklovich S.G., Saner S.F., Levy E.J. (1989) Amer. Lab 5, 26

15
Figure 1.5. Schematic diagram of on-line SFE/SFC used in our study.
Trap
Vessel
Main CO2
1
2
3
4
FIDInjector
Column
1
23 4
5
6
789
10
injectionextraction
Vent CO2
Oven
To SFC

16
Polymer Additives
Polymer Additives
Since the early stages of the development of the polymer industry, it was realized
that useful products could only be obtained if certain additives were incorporated into the
polymer matrix 17. The term “additive” is used here to describe those materials, which are
physically dispersed in a polymer matrix without affecting significantly the molecular
structure of the polymer 17. Table 1.3 shows the convenient classification of additives into
groups and subdivision according to their more precise functions.
The factor which most of all determines product quality and output in polymer
processing is resistance of the polymer to thermal degradation. The degradative effects of
oxidation can be so devastating that without the presence of antioxidants, some polymers
are rendered completely useless 17.
Before discussing antioxidants, however, let us look more closely at the oxidative
degradation process. The term “degradation” is used here to denote any chemical process,
which alters the chemical structure of the polymer in a manner that leads to a deterioration
in its physical properties 17. Polymeric degradation brought about by the effects of heat,
oxygen, mechanical shearing, or radiation typically occurs via a free radical mechanism 18.
(1) Initiation step: Production of free radicals
RH (Polymer)Energy
R + H
It can occur in any one of the various phases of a polymer’s life circle: polymerization,
processing, and end use.
(2) Propagation step: Radicals interact with polymer chains
17 Mascia L. (1974) The Role of Additives in Plastics, Edward Arnold Ltd., London18 Lutz J.T. Jr. (1989) Thermoplastic Polymer Additives, ed., Marcel Dekker, Inc., New York and Basel

17
Table 1.3. Classification of additives. (Taken from ref.17)
Group Function
i) Additives which assist processing 1) Processing stabilizer
2) Lubricants (internal, external)
3) Processing aids and flow promoters
4) Thixotropic agents
ii) Additives which modify the bulk 1) Plasticizers or flexibilizers
mechanical properties 2) Reinforcing fillers
3) Toughening agents
iii) Additives used to reduce formulation 1) Particulate fillers
2) Diluents and extenders
iv) Surface property modifiers 1) Antistatic agents
2) Slip additives
3) Anti-wear additives
4) Anti-block additives
5) Adhesion promoters
v) Optical property modifiers 1) Pigments and dyes
2) Nucleating agents
vi) Anti-aging additives 1) Anti-oxidants
2) UV stabilizers
3) Fungicides
vii) Miscellaneous 1) Blowing agents
2) Flame retardants
18
R O2 ROO
ROO RH ROOH
R
ROOH RO OH
RO
RH
ROH
HO
RH
HOH
R
+
+
+
+
+ +
+
+ R
(3) Termination step: Deactivation of free radicals
R
O 2ROO
ROOR
+
+
R
2
R-R
ROOR
ROOR +
The last step above represents crosslinking, which increases the molecular weight of the
polymer; this type of degradation manifests itself as brittleness, gellation, and decreased
elongation.
C
R
R
OR
R
C
R
O + R
The above represents chain scission, which results in a decrease in molecular weight,
leading to increased melt flow and reduced tensile strength.
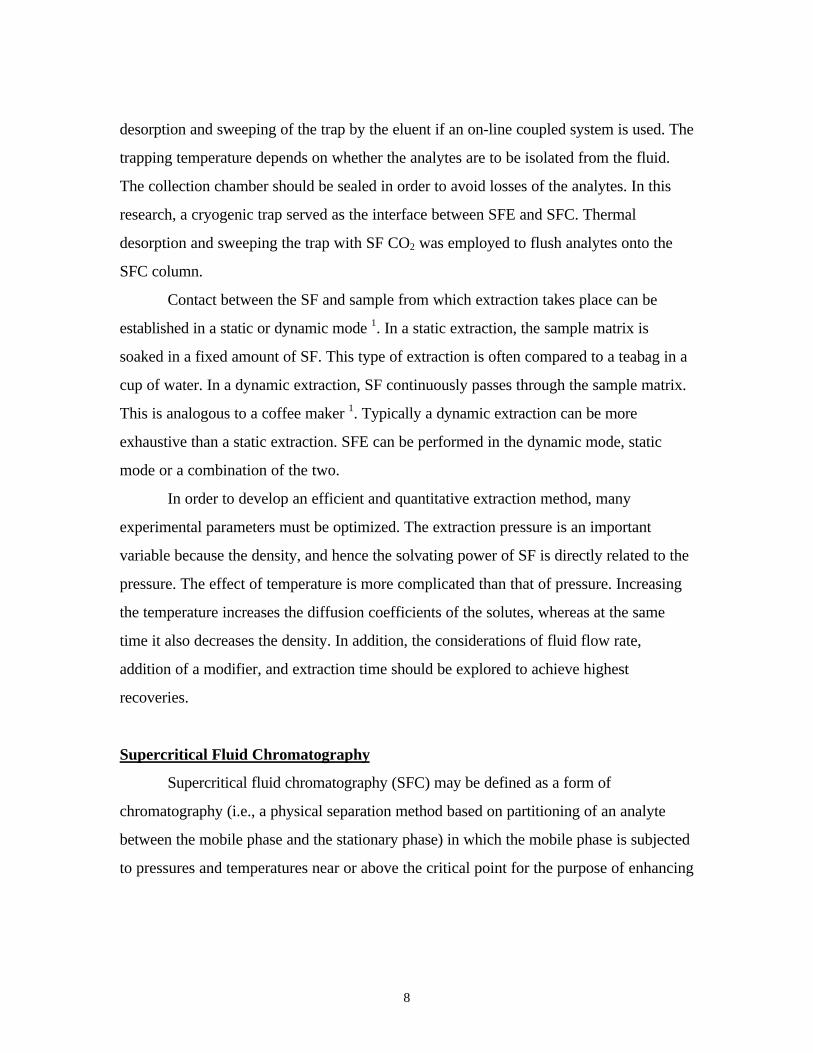
Antioxidants do not completely eliminate oxidative degradation, but they markedly
retard the rate of autoxidation by interfering with radical propagation 18. Two general
classifications can be used to categorize antioxidants: primary (chain terminating) and
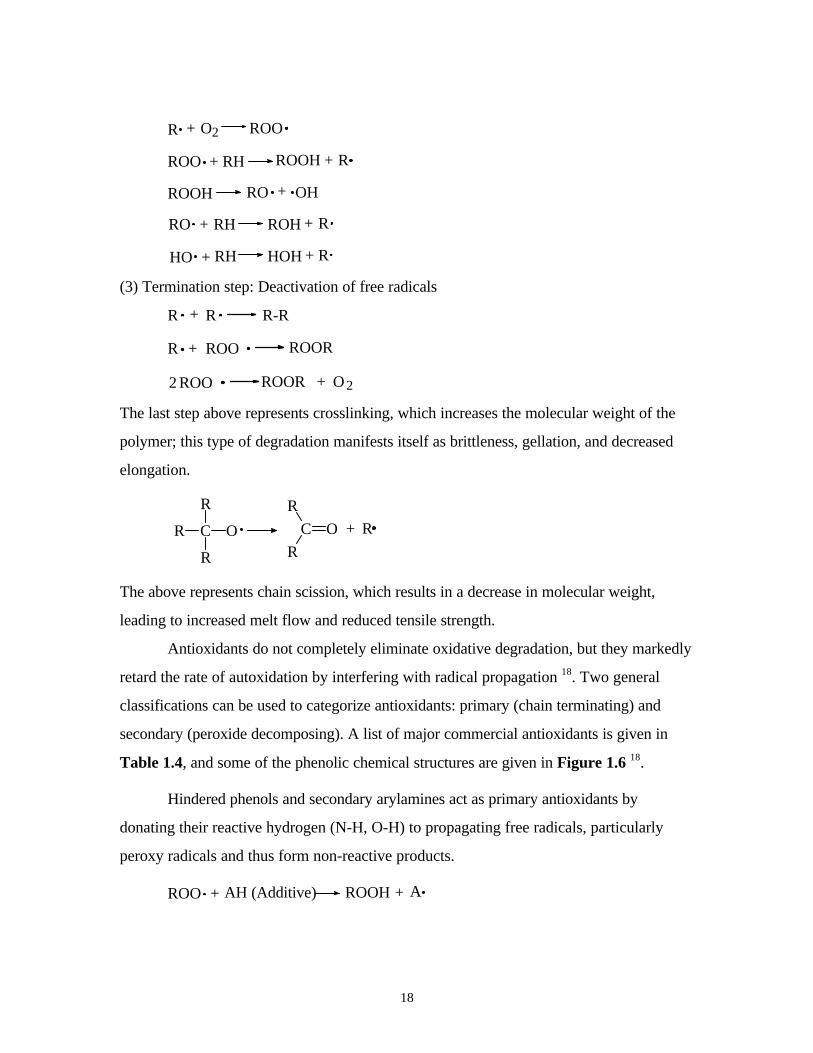
secondary (peroxide decomposing). A list of major commercial antioxidants is given in
Table 1.4, and some of the phenolic chemical structures are given in Figure 1.6 18.
Hindered phenols and secondary arylamines act as primary antioxidants by
donating their reactive hydrogen (N-H, O-H) to propagating free radicals, particularly
peroxy radicals and thus form non-reactive products.
ROO + +ROOHAH (Additive) A
19
Table 1.4. Major commercial antioxidants. (Taken from Ref. 18)
Registeredtrade name
Chemical name MW Physicalform
Supplier
PhenolicsBHT 2,6-di-t-butyl-4-methylphenol 220 Solid VariousBHEB 2,6-di-t-butyl-4-ethylphenol 234 Solid VariousIsonox 132Vanox 1320
2,6-di-t-butyl-4-sec-butylphenol
262 Liquid Neville ChemicalCompanySchenectadyR.T.Vanderbilt
Cyanox 425 2,2’-methylenebis(4-ethyl-6-t-butylphenol
368.5 Solid AmericanCyanamid
Isonox 129Vanox 1290
2,2’-Ethylidenebis-(4,6-di-t-butylphenol)
438 Solid SchenectadyR.T. Vanderbilt
Irganox 1076Naugard 76Oxi-Chek 116
Octadecyl 3,5-di-t-butyl-4-hydroxyhydrocinnamate
531 Solid Ciba-GeigyUniroyal-ChemicalFerro
Irganox 1010 Terakis [methylene-3-(3,5-di-t-butyl-4-hydroxyphenyl)propionate] methane
1178 Solid Ciba-Geigy
AminesWingstay 29Vulkanox
p-oriented styrenateddiphenylamine
320 Liquid/Solid
GoodyearMobay
Agerite DPPDNaugard JPermanaxDPPD
N,N’-diphenyl-p-phenylene-diamine
260 Solid R.T. VanderbiltUniroyal ChemicalVulnax
ThioestersCyanox 711ArgusDTDTDPEvastab 13
Ditridecyl thiodipropionate 543 Liquid AmericanCyanamidArgusEvans
Seenox 412-S Pentaerythritoltetrakis [3-(dodecylthio)propionate
1162 Solid Argus
PhosphitesWeston 618Mark 5060
Distearylpentaerythritoldiphosphite
732 Solid Sandoz
Ultranox 626 Bis(2,4-di-t-butyl)pentaerythritol diphosphite
604 Solid Borg-Warner

20
Figure 1.6. Chemical structures of hindered phenols.
OH
CH3
BHT
OH
C2H5
BHEB
CH
CH3
OH OH
Isonox 129
OH
(CH2)2 COC18H37
O
Irganox 1076
OH (CH2)2 COCH2
O
C
4
Irganox 1010

21
This mechanism holds mainly for phenol derivatives; in these cases the inactive radical (A·)
is stabilized by resonance:
O
R1 R2
R3
O
R2
R3
R1R1
R3
R2
O O
R1 R2
R3
This mechanism has not been well established for arylamines, except in a few cases 18.
Hindered phenolics are the more preferred type of primary antioxidants for
thermoplastics. This group can be further categorized into the forms illustrated in Figure
1.7: (1) simple phenolics, (2) bis-phenolics, (3) polyphenolics, and (4) thiobisphenolics 18.
The most familiar hindered phenol, by far, is 2,6-di-t-butyl-4-methylphenol, also
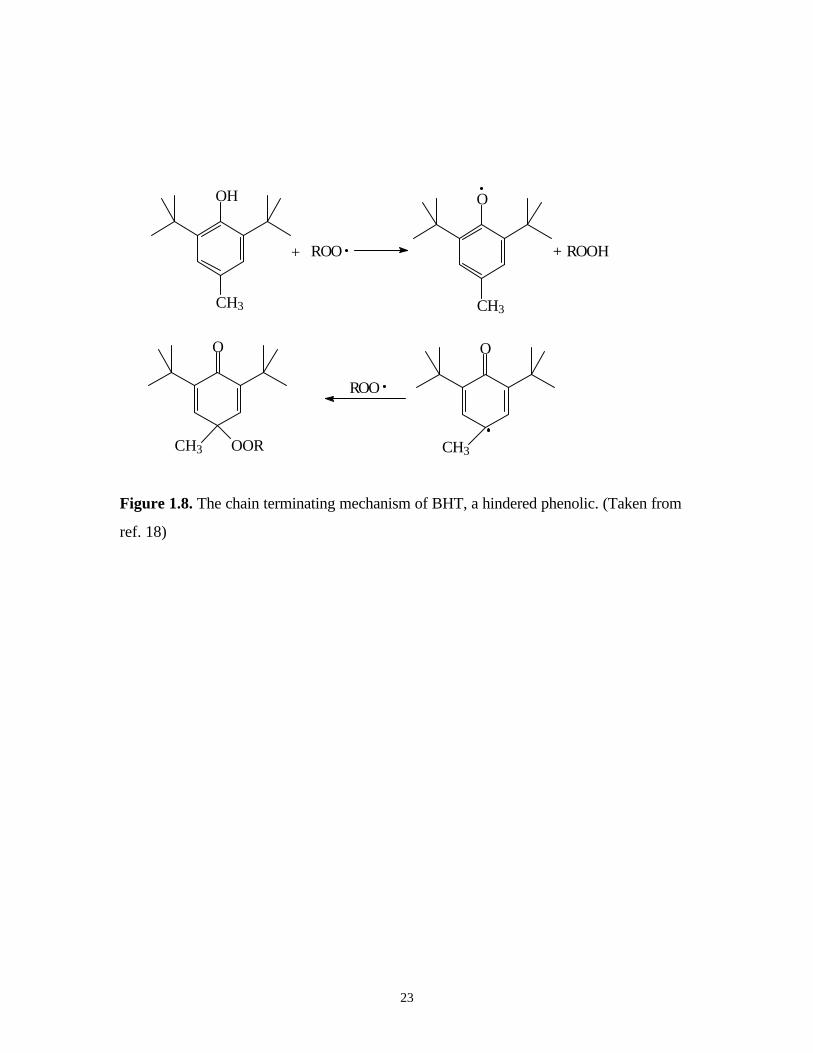
widely known by its trade name, BHT. Figure 1.8 shows the chain terminating mechanism
of BHT 18.
Secondary antioxidants are also termed preventive stabilizers, because they prevent
the proliferation of alkoxy and hydroxy radicals by decomposing hydroperoxides 17. Many
sulfur and phosphorous compounds can in fact act as secondary antioxidants and the most
notable types are organophosphites and thioesters (Table 1.4). The mechanism of their
reaction is complex but there seems to be some agreement that peroxides are reduced to
alcohols and are, therefore, deactivated in the manner shown in Figure 1.9 17.
There are also other types of additives (Table 1.3) incorporated within polymers,
such as antiblocking agents. Antiblocks are necessary to avoid the polymer film sticking to
itself as a result of storage in roll form. Typical antiblocks can be silica, talc, or
diatomaceous earth.

22
OH
R1 R2
R3
OH
R3
R4
OH
R1
R2
CH2
R2
OH
R1
R3 C
4
R2
OH
R1
S
R3
OH
R4
(1) (2)
(3) (4)
Figure 1.7. Hindered phenolic types: (1) simple phenolics, (2) bis-phenolics, (3)
polyphenolics, and (4) thiobisphenolics. (Taken from ref. 18)
23
Figure 1.8. The chain terminating mechanism of BHT, a hindered phenolic. (Taken from
ref. 18)
OH
CH3
ROO+
OORCH3
O
O
CH3
+ ROOH
CH3
O
ROO

24
CHOOH
+
++
+
+
P(OR)3 O=P(OR)3
RSH RS
RS
CHOH
CHOO CHOOH
CHOO CH OOSR (stable product)
Figure 1.9. The mechanism of secondary additives. (Taken from ref. 17)

25
Several types of additives may be employed in a single polymer product. For
example, both primary and secondary antioxidants, UV stabilizers, antiblocks, antistatic
agents, blowing agents, and flame retardants may all be incorporated into low density
polyethylene (LDPE) to maintain its performance.
In this research, we dealt with a primary antioxidant package that contained five
different hindered phenols [i.e., BHT, BHEB, Isonox 129, Irganox 1076, and Irganox
1010 (Table 1.4 and Figure 1.7)]. More specific physical properties of these antioxidants
are tabulated in Table 1.5. In general, the molecular weight of the compound will be
related to its temperature stability 19. For instance, BHT has a molecular weight of 220 as
compared with Irganox 1010 that has a molecular weight of 1178. Irganox 1010 would
have a higher thermal stability than BHT. The relative volatilities of each are demonstrated
in Figure 1.10 18. This antioxidant additive package was incorporated into an LDPE
product in order to avoid oxidative degradation.
19 Becker R.F., Burton L.P.J., Amos S.E. (1996) Polypropylene Handbook, ed. Moore E.P. Jr., MontellU.S.A., Inc.

26
Table 1.5. Physical properties of five target antioxidants.
Name Melting point(oC)
Boiling point(oC)
Comment
BHT 69-70 265 -
BHEB 44-45 275 -
Isonox 129 162-164 - -
Irganox 1076 49-52 - No decomposition after eight hours at185 oC in air
Irganox 1010 120 - Stable at temperature in excess of 316 oCin air

27
Figure 1.10. The relative volatilities of BHT and Irganox 1010. (Taken from ref. 18)
Thermogravimetric analyses (TGA) were conducted at a heating rate of 20oC per minutein an atmosphere of air.

28
Polymer Additive Analysis
As the purity and amount of additives incorporated into a polymer product affect
the properties of the polymer, there is a need for reliable and rapid analytical methods to
characterize the additives and to determine the amount of additive present.
Analysis of polymer additives can be complicated owing to their physical
properties and the added problem of quantitative and reproducible extraction of the
additives from the polymer matrix. Traditional liquid solvent/polymer extraction methods
are time-consuming and uneconomical. They involve dissolution of the polymer in a hot
solvent such as toluene 20 or decalin 21, followed by precipitation of the high molecular
weight fraction with an alcohol or by cooling. The optimal recoveries are usually low
(<90%). Further separation is usually required prior to analysis. Analysis by GC is limited22 because of the problems in eluting non-volatile, high molecular weight additives.
Aluminum-clad high temperature capillary GC columns have been used but such methods
have been found to lack reproducibility 23. Owing to the relatively high molecular weight,
reactivity, polarity, thermolability, and volatility of certain additives, LC has been the most
commonly used chromatographic technique 24-27. Unfortunately, many additives show little
UV absorption. Because of the lack of a universal LC detector 28 and, in some cases poor
resolution, LC has not proved ideal. Because of the low concentrations and complicated
structures of additives, spectroscopic methods 29 and mass spectrometry (MS) have
proved unsuccessful.
20 British Standards 2782 (1965) BS Institution, London, Part 4, method 405D21 Schabron J.F., Fenska L.E. (1980) Anal. Chem. 52, 141122 DiPasquale G., Giambelli L., Sothenhni A., Pailla R. (1985) J. High Resolut. Chromatogr. Chromatogr.Commun. 8, 61823 Cortes H.J., Bell B.M., Pfeiffer C.D., Graham J.D. (1989) J. Microcol. Sep. 1, 27824. Dong M.W., DiCesare J.L. (1983) Plastics Engineering 2, 2525 Baylocq D., Majcherczyk C., Pellerin F. (1985) Ann. Pharm. Fr. 43, 32926 Howard J. (1971) J. Chromatogr. 55, 1527 Hanely M.A., Dark W.A. (1980) J. Chromatogr. 18, 66528 Schaborn J.F., Smith V.J., Ware J.L. (1982) J. Liq. Chromatogr. 5, 61329 Freitag W., Fresenius Z. (1983) Anal. Chem. 316, 495

29
Recent studies 30 have shown that SFE was at least as efficient as conventional
liquid/solid extraction, and less time-consuming. SFC techniques have been demonstrated
to be highly useful for determination of polymer additives 31, particularly owing to the
ability to use mass-sensitive FID.
Coupling SFE to SFC has become a most widely used two-dimensional technique
in this field. Off-line SFE still dominates over on-line determination of additives, an
important reason being the need for representative sample sizes. Small samples, however,
allow a high linear velocity in the extractor, reducing the extraction time, and also diminish
the build-up of extracted polymer material in restrictors and tubing. Thus, on-line
SFE/SFC for determination of additives in polymers has a considerable growth potential.
Ashraf-Khorassani et al. 13,32-33 investigated quantitative determination of a variety
of polymer additives using the technique of SFE/cryogenic trapping/SFC. A polyethylene
glycol (PEG) silica based packed column was used for SFC separation and FID was
employed for detection. Extraction efficiencies of polymer additives from a number of
different matrices were measured by varying the extraction conditions. Trapping
efficiencies of the cryogenic accumulator were determined. Calibration curves of spiked
pure LDPE pellets were determined. About 14 different polymer additives from different
polymer matrices (e.g., LDPE. styrofoam, and propellant stabilizers) were quantified, the
recoveries were greater than 92%, except for hexabromocyclododecan (HBCD) in
styrofoam, which was 86%. Normal hydrocarbons have been determined by the
hyphenated technique. It was found that the amount of material extracted and detected
was directly proportional to the volume of sample placed in the extraction vessel. Peak
areas with good relative standard deviation (%RSD<5.4, n=3) were reported.
Various polyethylene (PE) and polypropylene (PP) samples from several
30 Hirata Y., Okamoto Y. (1989) J. Microcol. Sep. 1, 4631 Markides K.E., Lee M.L. (1988) The 1988 workshop on supercritical fluid chromatography, Park City,Utah.32 Ashraf-Khorassani M., Boyer D.S., Levy J.M. (1991) J. Chromatogr. Sci. 29, 51733 Ashraf-Khorassani M., Kumar M.L., Koebler D.J., Williams GP (1990) J. Chromatogr. Sci. 28, 599

30
manufacturers were extracted using on-line SFE/SFC by Ryan et al. 34. Extraction
efficiencies of greater than 92% were obtained for ten different additives including BHT
and Irganox 1010. The recovery was relative to commercially available data. After
extraction the additives were trapped on an accumulator column containing cyano-
trapping material. Separation was achieved using a packed octyl column. Both FID and
UV detection were used. Linear calibration curves for quantitation were constructed by
extracting additive standards spiked onto quartz wool in the extraction vessel. Different
extraction pressure and time were employed for the extractions of polymer samples while
extraction temperature, accumulation temperature, and desorption temperature remained
constant.
Cotton et al. 35 described the quantitative extraction and separation of additives
and oligomers from PP and a number of other polymers. Fused silica capillary columns
were used to perform the SFC separation at 120oC with pressure programming.
Quantitative extraction of additives from PP was investigated at five different extraction
pressures, at constant flow rate and temperature (i.e., 70oC). Below 50 atm, extraction
was negligible; between 50-200 atm, Tinuvin 326 and 770 were extracted, along with
small quantities of oligomers, although not in the ratio anticipated from their relative
concentration in the material. High pressures led to the extraction of all the additives
present. The relative peak area was calculated to compare with the relative composition. It
was found that the integrated peak areas corresponded well with the actual concentration.
The mass and the coefficient of variation (%RSD=8) for extraction and chromatography
of the extracted cyclic trimer were determined, however, no quantitation method was
reported.
The use of on-line SFE/SFC was described by Hirata et al. 36. A packed capillary
column (fused silica tubing packed with ODS) was employed. PE film was extracted with
34 Ryan T.W., Yocklovich S.G., Watkins J.C., Levy E.J. (1990) J. Chromatogr. 505, 27335 Cotton N.J., Bartle K.D., Clifford A.A., Ashraf S., Moulder R., Dowle C.J. (1991) J. High Resolut.Chromatogr. 14, 16436 Hirata Y., Nakata F., Horihata M. (1988) J. High Resolut. Chromatogr. Chromatogr. Commun. 11, 81

31
supercritical CO2 and the analytes were trapped on a 15 cm length uncoated fused silica
tubing. By coupling a 5 cm section of this tubing to a packed capillary column and using
direct injection, they were able to confirm that the extracts were efficiently trapped in the
first 5 cm section, even at an extraction temperature of 65oC. The feasibility of extending
the technique to quantitative studies was also demonstrated. However, no quantitative
data were reported in this research.
In a further study by Daimon and Hirata 37, the use of uncoated and differently
coated (film thickness) capillaries for concentrating extracted solutes was evaluated by
comparing the recoveries of C12 to C20 alkanes at room temperature. The capillary with a
0.25 µm film was determined to be the most efficient trap. The effects of trapping
temperature and extraction time on trapping efficiency were also studied using n-paraffin
standards and polymer additive standards. They found that cooling the trapping tube
during extraction would improve the trapping efficiencies. They also found that extraction
efficiency of the additives from PP increased with increasing temperature. By varying
extraction pressure and temperature, selective extraction was performed. However, no
quantitative data were reported.
The variable character of the system’s CO2 gas flow rates over time due to
deposition of material at the restrictor outlets caused detector calibrations and split ratios
to change has been noticed by Baner et al. 38. The concentration of CO2 in air at the FID
and split restrictor outlets was measured in order to provide a basis for reproducible work
with the on-line SFE/SFC system. The extraction conditions were optimized by extracting
Biopol under the same pressure at different CO2 gas flow rates. Triacetin (TA) standards
with on-line SFE/SFC gave a recovery of 96.4% relative to the amount placed in the
extraction vessel with a coefficient of variation of 19.7%. When extracting TA from
Biopol polymer, 7.3% TA (w/w) with a coefficient of variation of 19% was obtained
compared to the actual TA content of 6.8%. Commercial PP films were extracted to test
37 Daimon H., Hirata Y. (1991) Chromatographia 32, 54938 Baner L., Bucherl T., Ewender J., Franz R. (1992) J. Supercritical Fluids 5, 213

32
the system. They also found 0.79% extractable material was in PP film with on-line
SFE/SFC compared to 0.51% with Soxhlet extraction. It was found that 3.0 and 9.5% of
the total chromatogram area units for Irganox 1076 and 1010 respectively were obtained
compared to 2.9 and 20.3% with Soxhlet extraction. The coefficient of variation of
Irganox 1076 and 1010 were 25 and 15% respectively.
On-line SFE/SFC has also been described by MacKay and Smith 39 using cryogenic
trapping to concentrate analytes at the top of the analytical column prior to
chromatography. Four chlorinated organophosphate flame retardants present in
polyurethane foams were analyzed. Both FID and MS were employed to confirm the
identity of the retardants. An external calibration with standards injected into SFC was
prepared for on-line quantitative extraction. Good recoveries were obtained for all
retardants except Amgard V6 from “Safegard” due to its low solubility in supercritical
CO2.
Oudsema and Poole 40 reported on-line SFE/SFC with formic acid modified CO2 to
determine an organotin stabilizer in a rigid polyvinyl chloride (PVC). A cyanopropyl
packed column was used for separation. A solution of formic acid was loaded by syringe
into the pump cylinder head to achieve 0.3% (v/v). A cryogenic stainless steel precolumn
was used as a trap. The influence of temperature, pressure, and time on the extraction of
the dimethyltin additive in a sample was investigated. Raising the temperature to 90oC
from 60oC resulted in a fast extraction. At pressures greater than 150 atm the recovery of
the analyte was unaffected by increasing pressure at 90oC, which indicated that at the
effective fluid density, the solubility was sufficiently high that the analytes reaching the
surface of the polymer particles were rapidly transported to the interface for cryotrapping.
A small reduction in recovery was observed for extraction times longer than 60 min at
90oC and 175 atm. Trapping temperatures greater than 30oC were not adequate for
quantitative trapping. The concentration of the additive was determined to be 1.45% with
39 MacKay G.A., Smith R.M. (1993) Analyst 118, 74140 Oudsema J.W. Poole C.F. (1993) J. High Resolut. Chromatogr. 16,198

33
an RSD of 2.9% (n=6). However, no actual concentration was reported.
In order to obtain high extraction efficiency, polymer samples are usually ground,
shaved or filed to increase the surface area. It is time-consuming and, in many cases, may
result in thermal degradation of some analytes through the heat produced. In order to
avoid these problems, MacKay and Smith 41 demonstrated a method for the quantitative
analysis of Tinuvin P from unplasticized PVC film using an internal standard with an on-
line SFE/SFC system. The internal standard which would be extracted at the same or
similar rate to the analyte, could be incorporated into the polymer matrix, then the ratio in
an incomplete extraction could be used to determine the initial concentration. Tinuvin 326
was selected as an internal standard because it has similar properties as the target analyte,
namely, similar solubility, diffusion rate, similar interaction with the polymer matrix and
similar FID response. The response ratio of the analyte to the internal standard was
determined by a solution containing the same concentration of each compound with SFC.
A single point calibration was employed. The internal standard was then incorporated into
the bulk plastic sheet , therefore, complete extraction was not necessary to gain
quantitative information with good reproducibility (standard deviation = 4.3%) in a short
extraction time. However, no recovery was reported. In addition, incorporation of the
internal standard introduced additional sample preparation stages such as dissolving the
polymer in solvent and evaporating the solvent, which might detract from the usefulness of
this method of assay.
In our study, efforts have been made to quantify different additives in LDPE using
on-line SFE/SFC. In the first part of the study, spiking experiments (on sand) were
performed to investigate the influence of different traps and trapping temperature,
injection temperature, extraction pressure, extraction temperature, fluid flow rate, and
extraction time upon trapping and extraction efficiencies. The second part of our study
involved quantitation of the additives from LDPE using previously determined conditions.
41 MacKay G.A. Smith R.M. (1995) J. High Resolut. Chromatogr. 18, 607

34
Off-line SFE/HPLC and off-line ESE/HPLC was conducted in the third part to compare
with the on-line SFE/SFC technique.

35
Chapter 2
Quantitative Analysis of Additives from Low Density Polyethylene
Introduction
On-line SFE/SFC with pure CO2 was employed to analyze and quantitate different
additives in LDPE. The influences of trap packings, trapping temperature, extraction
pressure and temperature, extraction time, fluid flow rate, and thermal desorption
temperature were investigated. Optimized conditions were employed to quantitatively
extract the additives from LDPE. Off-line SFE/HPLC and off-line Enhanced Solvent
Extraction (ESE)/HPLC were conducted on the same sample. The results obtained from
on-line SFE/SFC were compared to those from off-line SFE/HPLC and off-line
ESE/HPLC. The main objective of this study was to develop a quantitation method using
on-line SFE/SFC to analyze polymer additives from LDPE product.
Experimental
Material
The following polymer additives were analyzed: BHT, BHEB, Isonox 129,
Irganox 1076, and Irganox 1010. The chemical name, chemical structure, and physical
properties were given in Table 1.4, Figure 1.7, and Table 1.5.
Additive standard mixtures at various concentrations were prepared using
methylene chloride (CH2Cl2) as solvent. An additive standard mixture with a concentration
of 5000 ppm for each additive standard was first made and successively diluted to
encompass additive concentrations of 100-5000 ppm.
Additive standards were provided by Quantum Chemical Corporation (Cincinnati,
OH), as well as the LDPE sample (20 mesh), originally containing approximately 1000
ppm of each additive. The glass transition temperature of LDPE is well below ambient
temperature, and the melting point is 106-115oC.

36
Methods
On-line SFE/SFC
An Isco-Suprex (Lincoln, NE) MPS/225 SFE/SFC consisting of a supercritical
fluid extractor, cryogenic collection trap (CC), and supercritical fluid chromatograph was
utilized to perform on-line extraction, collection, and separation. The SFE/CC/SFC system
consisted of a 0.16 mL stainless steel extraction vessel and a cryogenic collection tube
measuring 30 × 1.0 mm i.d., which had the capabilities of rapid cooling to –50oC
(200oC/min) and ballistic heating up to 200oC (250oC/min). A Deltabond cyano column,
100×1.0 mm i.d., 5 µm particle size, was used to provide the SFC separation. Pure CO2
with helium headspace was used as the mobile phase.
In addition to the above, the SFE/CC/SFC assembly was composed of three
electronically actuated valves (ten-port, two-position valve; five-port, four-position
selector valve; and four-port, two-position injector valve). Schematic diagrams of the
extraction, cryogenic collection trap, valving, and chromatographic column in the
extraction/collection mode and in the injection/separation mode are shown in Figure 2.1.
In the extraction/collection position (Figure 2.1A), CO2 from the syringe pump enters the
tee. Tubing from one outlet of the tee leads CO2 to the injector valve for use only in
conventional SFC applications. Tubing from the other outlet of the tee goes through the
five-port, four-position selector valve to the extraction vessel. The extracted components
carried by CO2 pass through a linear fused silica restrictor to the ten-port, two-position
valve, and then into the cryogenic collection trap, which is cooled as low as –50oC with
industrial-grade CO2. All of the extracted materials are then collected in the cryogenic
trap, while the expanded CO2 gas from the cryogenic collection trap is vented through the
ten-port valve into the atmosphere.
After extraction is completed, the system pump pressure is reduced from the
extraction pressure (e.g., 450 atm) to the starting pressure (e.g., 100 atm) for

37
Figure 2.1A. Schematic diagram of on-line SFE/SFC, extraction/collection mode.
Trap
Vessel
Main CO2
1
2
3
4
FIDInjector
Column
1
23 4
5
6
789
10
injection extraction
Vent CO2
plugged
oven
From Pump
To Injector
38
chromatography. During this re-equilibration period, the sample remains in the cryogenic
collection trap. Upon reaching equilibrium the ten-port and five-port selector valves are
switched simultaneously to the injection/separation mode (Figure 2.1B). In this
configuration, CO2 passes through the tee, the selector valve, and the ten-port valve into
the cryogenic trap, which is then ballistically heated to desorption temperature (e.g.,
180oC). After backflushing, CO2 carries the extracted components from the trap back to
the ten-port valve and into the packed chromatographic column. The sample passes
through a tapered fused silica restrictor before it reaches the FID, while depressurized CO2
is vented out from FID to the atmosphere.
An additive standard mixture was spiked onto about 0.3 g Ottawa sand (Fisher
Scientific, Fairlawn, NJ) contained in the 0.16 mL extraction vessel to investigate the
effects of various parameters (e.g., trap and trapping temperature, extraction pressure,
temperature, time, fluid flow rate, etc.) upon extraction efficiency and collection
efficiency. Experiments were performed in triplicate. The SFC conditions were previously
developed in our lab to separate the five additives efficiently. Figure 2.2 shows one on-
line SFE/SFC chromatogram of sand spiked with the additive standards.
The following extraction and chromatography conditions were employed for on-
line SFE/SFC:
SFE conditions:
Extraction fluid: 100% CO2
Pressure: 350, 450 atm
Oven temperature: 80, 100oC
Time: 10, 20, 30, 40, 50 min
Cryogenic trapping temperature: -50, –40, -25, -5, 5 oC
Flow rate: 0.65, 2.0 mL/min

39
Figure 2.1B. Schematic diagram of on-line SFE/SFC, injection/separation mode.
Trap
Vessel
Main CO2
1
2
3
4
FIDInjector
Column
1
23 4
5
6
789
10
injection extraction
Vent CO2
plugged
oven
From Pump
To Injector

40
Figure 2.2. On-line SFE/SFC chromatogram of spiked sand with additive standards.1. BHT, 2. BHEB, 3. Isonox 129, 4. Irganox 1076, 5. Irganox 1010.SFE conditions: 450 atm, 100oC, 30 min, trapping at –40oC.SFC/FID conditions: desorption at 180oC, pressure programming: 100 atm for 3min, 100-330 atm in 7 min, 330-450 atm in 1.5 min, oven at 100oC, Deltabond cyano, 100×1.0mm, 5 µm dp., FID detection at 350oC.
41
SFC conditions:
Pressure programming: 100 atm for 3 min
100-330 atm in 7 min
330-450 atm in 1.5 min
450 atm for 5 min
Oven temperature: 100 oC
Desorption temperature: 100, 180 oC
Column: 100×1.0 mm i.d., 5 µm dp
Deltabond cyano
Spiked sand was also employed to prepare calibration curves for quantitation. The
spiked sand was air dried for about one minute. The LDPE sample was subjected to on-
line SFE/SFC to obtain qualitative and quantitative results of the target additives. All
experiments were performed in triplicate. Identification was achieved by comparing the
retention time of each additive standard.
Off-line SFE/HPLC
An Isco-Suprex AP44 automated extraction system equipped with an automatic
variable restrictor and Accutrap collection system was used with the following
conditions previously developed by Quantum Chemical Corporation:
Extraction fluid: 100% CO2
Oven temperature: 100oC
Pressure: 450 atm
Restrictor temperature: 75oC
Vessel size: 5 mL
Liquid flow rate: 1.5 mL/min
Dynamic extraction time: 30 min
Solid phase trap: octadecyl silica (ODS) at 0oC
Trap desorb temperature: 25oC

42
Trap rinse: 5 mL 50/50 ethylacetate/acetonitrile
The extraction vessel was filled to approximately 80% of the volume with Ottawa
sand. For the LDPE polymer sample, 500 mg was added onto the sand. A small dead
volume was necessary due to expansion of the polymer during extraction.
For the HPLC portion of the analyses, a Hewlett Packard (Wilmington, DE) series
1050 HPLC was used with the following parameters:
Column: 150×3.9 mm, 5 µm dp, C18
Column temperature: 50oC
UV detector: 200 nm
Mobile phase: Gradient from 75/25 (v/v) CH3CN/H2O to 100% CH3CN in
5 min, hold 100% CH3CN for 14 min, return to 75/25 (v/v)
CH3CN/H2O at 19.01 min
Flow rate: 1.5 mL/min
Sample loop: 10 µL
All solvents were HPLC grade and were obtained from Fisher Scientific (Fair
Lawn, NJ).
Quantitation was accomplished by using an external calibration. The LDPE sample
was also subjected to off-line SFE/HPLC. All experiments were performed in triplicate.
However, the sample size used in off-line SFE/HPLC was much larger (500 mg vs. 2.0
mg) than that in on-line SFE/SFC.
Off-line ESE/HPLC
An Isco SFX 220 SFE system (Figure 2.3) was modified to conduct ESE. The
system consisted of two syringe pumps and an oven. A 10 mL extraction vessel was
placed in the oven. A static extraction was performed at 200 atm and 100oC for 30 min
with 10 mL 50/50 ethylacetate/CH3CN. The extract along with the solvent was collected
in a vial, and 10 mL CO2 was used to flush the solvent out of the extraction vessel. The

43
Figure 2.3. Schematic diagram of ESE system used in our study.
Pump1
Vessel
Pump2Solvent CO2
Oven
Collection Vial
Load sample into cell
Hold sample at pressure and temp
Fill cell with solvent
Heat and pressurize cell
Pump clean solvent into vial
Purge solvent from vessel with CO2
Extract ready for analysis
Check valves

44
tube after the extraction vessel was easily clogged with the messy extracts. Post-extraction
clean-up was therefore necessary. The sample used for ESE was 500 mg.
Data Analysis
F-test and t-test were employed to statistically analyze the data obtained from the
experiments. An F-test is a method for comparing two population variances, i.e., the
random errors (precision) of two sets of data. The F-test considers the ratio of the two
sample variances, i.e., the ratio of the squares of the standard deviations. The quantity
calculated (F) is given by:
Where S1 and S2 are the standard deviations of each data set. S1 and S2 are
allocated in the equation so that Fcalc is always ≥ 1. If the calculated value F exceeds a
certain critical F value, which depends on the size of both the samples, the significance
level and the type of test performed, then the precisions of two data sets are significantly
different.
Two-sample assuming unequal variances t-test is a method to determine whether
two sample means are equal. This form of t-test assumes that the variances of both ranges
of data are unequal and is referred to as a heteroscedastic. Two-sample assuming equal
variances t-test is a method to determine whether two-sample means are equal when the
variances of both ranges of data are equal, which is referred to as a homoscedastic. A F-
test was always performed first to determine whether there was significant difference in
precision between two data sets. Either type of t-test was then performed to determine
whether equivalent data were obtained at different conditions. Paired two-sample for
means is a method to determine whether a sample’s means were distinct, and does not
assume that the variances of both populations from which the data sets are drawn are
equal. This form of t-test was performed to determine if different methods provided
FS
Scalc = 1
2
22
(Equation 1)

45
equivalent results when all analytes were concerned. The following equation is used to
calculate t value:
Where x1 and x2 are the average values of each of the two data sets, Sp is the
pooled standard deviation, and n1 and n2 are the number of data points in each set. If the
calculated t value exceeds critical t value, the means of two data sets are significantly
different.
The confidence level used for F-test and t-test in this work was 95% 42.
Figure 2.4 shows an example of Microsoft Excel statistics worksheet to compare
the percent recoveries of Isonox 129 obtained from on-line SFE/SFC and off-line
SFE/HPLC. The F-test was performed to obtain the calculated F value, 817, which
exceeds the critical F value, 19, therefore, the precision obtained from off-line SFE/HPLC
for Isonox 129 was much better than that from on-line SFE/SFC. Next the t-test for two-
sample assuming unequal variances was employed to determine whether the means were
significantly different. The calculated t value, 1.294, is smaller than the critical t value,
which means equivalent percent recoveries were obtained from two methods for Isonox
129.
42 Miller J.C., Miller J.N. (1988) Statistics for Analytical Chemistry John Wiley & Sons, Inc., New York
tx x
Sn n
calc
p
=−
+
1 2
1 2
1 1(Equation 2)

46
%Recovery of Isonox 129on-line SFE/SFC 63 80 96off-line SFE/HPLC 67 67 68
F-Test Two-Sample for Variances
Variable 1 Variable 2Mean 79.7 67.3Variance 272.3 0.3Observations 3 3df 2 2F 817.000P(F<=f) one-tail 0.001F Critical one-tail 19.000
t-Test: Two-Sample Assuming Unequal Variances
Variable 1 Variable 2Mean 79.7 67.3Variance 272.3 0.3Observations 3 3Hypothesized MeanDifference
0
df 2t Stat 1.294P(T<=t) one-tail 0.163t Critical one-tail 2.920P(T<=t) two-tail 0.325t Critical two-tail 4.303
Figure 2.4. An example of Excel statistics worksheet.

47
Results and Discussion
On-line SFE/SFC
CO2 impurities
One important consideration with an on-line SFE/SFC system is the impurities in
CO2. In a standard SFC, the low concentration level of hydrocarbon impurities in the
mobile phase cannot be detected by FID, When a UV detector is employed, hydrocarbons
cannot be detected either, due to the lack of a chromophore. Interestingly, the high
molecular weight hydrocarbon (i.e., C18-C30) 33,43 impurities in SFE/SFC grade CO2 are
accumulated in the cryogenic trap.
To study this issue, on-line SFE/SFC/FID was conducted with three different tanks
of CO2. A total of 15 g of CO2 was passed through the cryogenic collection system from
each cylinder, and the impurities in CO2 were collected at –25oC for 30 min. After
collection of the impurities, a SFC chromatogram was obtained for each tank. It was
observed (Figure 2.5) that the level of impurities varied from tank to tank. It is important
to note that if the level of impurities in CO2 is too high it may interfere with the peaks in
the sample chromatogram.
In order to eliminate the interferences from the impurities, a stainless steel column
measuring 25×2.5 cm i.d. was used as a filter before the CO2 entered the on-line SFE/SFC
system. It contained ¾ activated carbon (4-12 mesh) and ¼ adsorption alumina (80-200
mesh), which was suggested by Air Products & Chemicals Inc., to adsorb the hydrocarbon
impurities in CO2 tank. Figure 2.5D shows a chromatogram obtained from on-line
SFE/SFC/FID of 15 g of CO2 with the filter. The same conditions as above were
employed, and no obvious impurity peaks were observed.
Memory Effect
Another issue with the on-line SFE/SFC system is the so-called “memory effect”,
which is defined as the failure to remove of extracted analytes even after several purges of
43 Engelhardt H., Zapp J., Kolla P. (1991) Chromatographia 32, 527

48
Figure 2.5. Chromatograms of impurities in CO2 tanks, integration at same attenuation 3.
SFE conditions: 450 atm, 100oC, 30 min, trapping at –25oC.SFC/FID conditions: desorption at 180oC, pressure programming: 100 atm for 3min, 100-330 atm in 7 min, 330-450 atm in 1.5 min, oven at 100oC, Deltabond cyano, 100×1.0mm, 5 µm dp, FID detection at 350oC.
(with filter)

49
the system with extraction fluid. The deleterious effect may not present itself immediately,
but rather when experimental conditions are changed. The undesired result may show up,
for example, as an unexplained analyte peak in a further chromatogram due to removal of
the old analyte from the various places. For the system conducted with the same analytes,
bad quantitation reproducibility may occur.
Previous study by Hume-Kirschner et al. 44 showed that cleaning the trapping
system with liquid CH2Cl2 in a modified on-line SFE/SFC could eliminate this “memory
effect”. However, the simple test performed in that study to demonstrate the effect of
cleaning was not of sufficient extraction time (5 min) for the trace residues to be enriched
enough to be detected. In our study, at least 30 min extraction time was employed;
therefore, the test extraction time should be no shorter than 30 min.
In our work, the dried spiked sand was extracted at 450 atm and 100oC for 30 min,
and chromatography was conducted with pressure programming. Following this SFE/SFC
performance, the vessel was removed and replaced with a zero dead volume union to
make sure that no interferences from possible residue in the vessel was seen. Then another
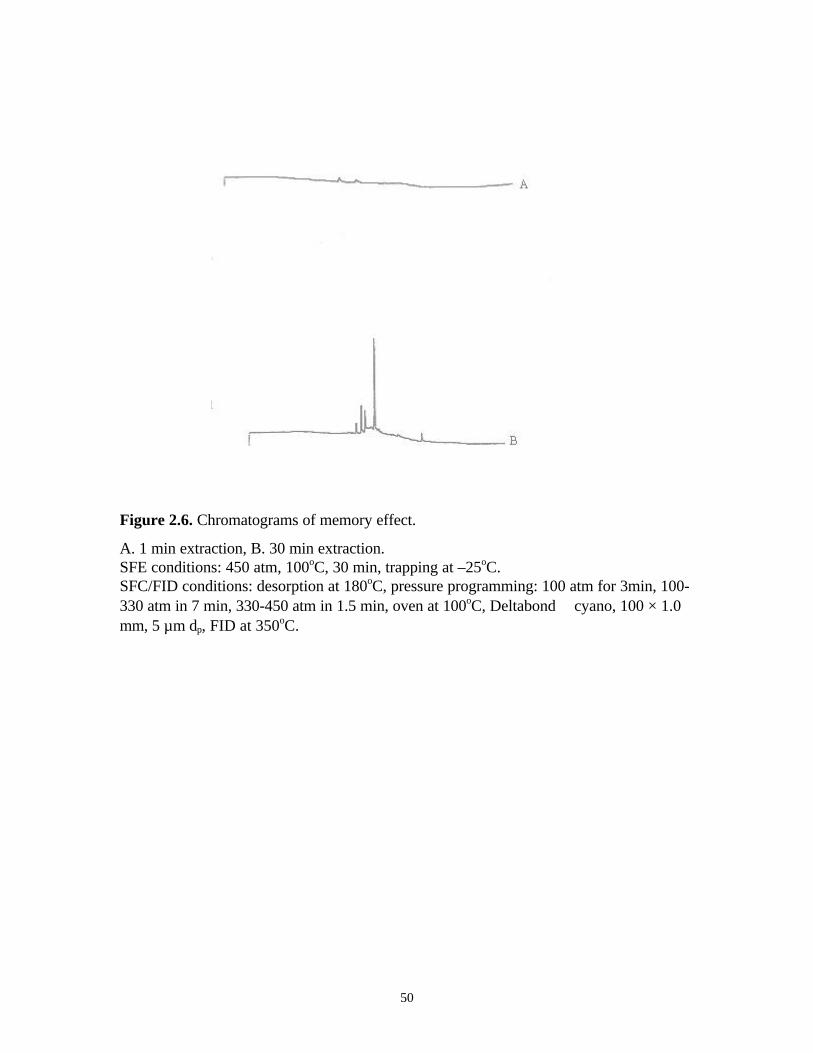
similar SFE/SFC was performed. Figure 2.6 shows the chromatograms of the extractions
of the “blank” system for 1 min and 30 min. As can be seen, the “memory effect” was
exhibited when the 30 min extraction was conducted.
In order to eliminate this problem, several efforts were made, including changing
the pre-trap restrictor, washing the extraction lines with CH2Cl2, and sonicating the rotor
of the ten-port valve in CH2Cl2. All cleaning solvent was collected, concentrated, and
injected into the SFC, but no analyte peaks were observed. After drying all the parts, with
the union in place of the vessel, a 30 min extraction was performed followed by
chromatography. Small quantities of residues were still evident. Figure 2.7 shows the
chromatograms after each cleaning step.
This process indicated that the residual (samples) could deposit unpredictably in
some “dead space” (e.g., spaces between the restrictor tip and fitting, etc.) of the system,
44 Hume-Kirschner C., Jordan S.L., Taylor L.T. (1993) Unpublished Results
50
Figure 2.6. Chromatograms of memory effect.
A. 1 min extraction, B. 30 min extraction.SFE conditions: 450 atm, 100oC, 30 min, trapping at –25oC.SFC/FID conditions: desorption at 180oC, pressure programming: 100 atm for 3min, 100-330 atm in 7 min, 330-450 atm in 1.5 min, oven at 100oC, Deltabond cyano, 100 × 1.0mm, 5 µm dp, FID at 350oC.

51
Figure 2.7. SFE/SFC after various cleaning steps.A. Changing pre-trap restrictor, B. Flushing trapping line with CH2Cl2, C. Sonicating the
valveSFE conditions: 450 atm, 100oC, 30 min, trapping at –25oC.SFC/FID conditions: desorption at 180oC, pressure programming: 100 atm for 3min, 100-330 atm in 7 min, 330-450 atm in 1.5 min, oven at 100oC, Deltabond cyano, 100 × 1.0mm, 5 µm dp, FID at 350oC.
52
which are very difficult to reach by regular flushing with CO2 or solvent. However, the
“memory effect” may not affect the results significantly when the sample concentration is
sufficiently high.
Consideration of cryogenic trapping
Generally, the success of on-line SFE/SFC greatly depends on the trapping
techniques to recover the extracted analytes from the expanded gas flow after
depressurization, particularly when the analytes are volatile. The primary objective of this
part of the work was to evaluate the efficiency of an empty cryogenic trap and a cryogenic
trap filled with glass wool.
An ODS solid phase trap works great in off-line SFE systems. It seemed logical at
first that ODS particles could probably be packed into the empty cryogenic trap of the on-
line SFE/SFC system to improve collection efficiency. However, backpressure was found
to suck the small particles into the valve and column and ruin them when the system is
switched from SFE mode to SFC mode. In addition, some polymer additives are difficult
to desorb from ODS with pure CO2 when SFC is performed 37. Organic solvents such as
CH2Cl2, CH3CN, and CH3OH were used in off-line SFE to rinse the analytes out of the
ODS trap.
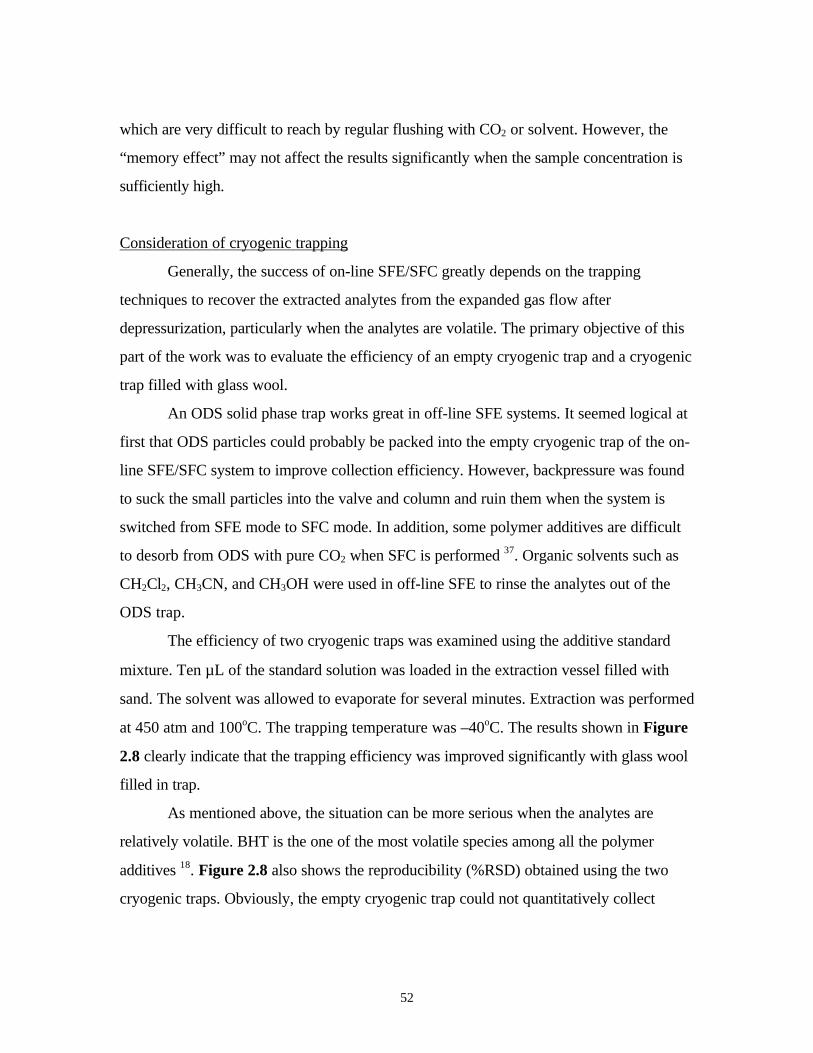
The efficiency of two cryogenic traps was examined using the additive standard
mixture. Ten µL of the standard solution was loaded in the extraction vessel filled with
sand. The solvent was allowed to evaporate for several minutes. Extraction was performed
at 450 atm and 100oC. The trapping temperature was –40oC. The results shown in Figure
2.8 clearly indicate that the trapping efficiency was improved significantly with glass wool
filled in trap.
As mentioned above, the situation can be more serious when the analytes are
relatively volatile. BHT is the one of the most volatile species among all the polymer
additives 18. Figure 2.8 also shows the reproducibility (%RSD) obtained using the two
cryogenic traps. Obviously, the empty cryogenic trap could not quantitatively collect
53
Figure 2.8. Comparison of different trapping protocols (Spiked sand).
SFE conditions: 100% CO2, 450 atm, 100oC, 30 min, trapping at -40oC,SFC/FID conditions: desorption at 180oC, pressure programming: 100 atm for 3min, 100-330 atm in 7 min, 330-450 atm in 1.5 min, oven at 100oC,Deltabond cyano 100 × 1.0 mm i.d., 5 µm dp, FID at 350oC.
-1
1
3
5
7
9
11
13
15
BHT BHEB Isonox 129 Irganox 1076 Irganox 1010
Additives
Raw
Are
a (x
105 )
Empty trapTrap filled with glass wool

54
volatile analytes such as BHT and BHEB. Therefore, the cryogenic trap filled with glass
wool was employed in the following study.
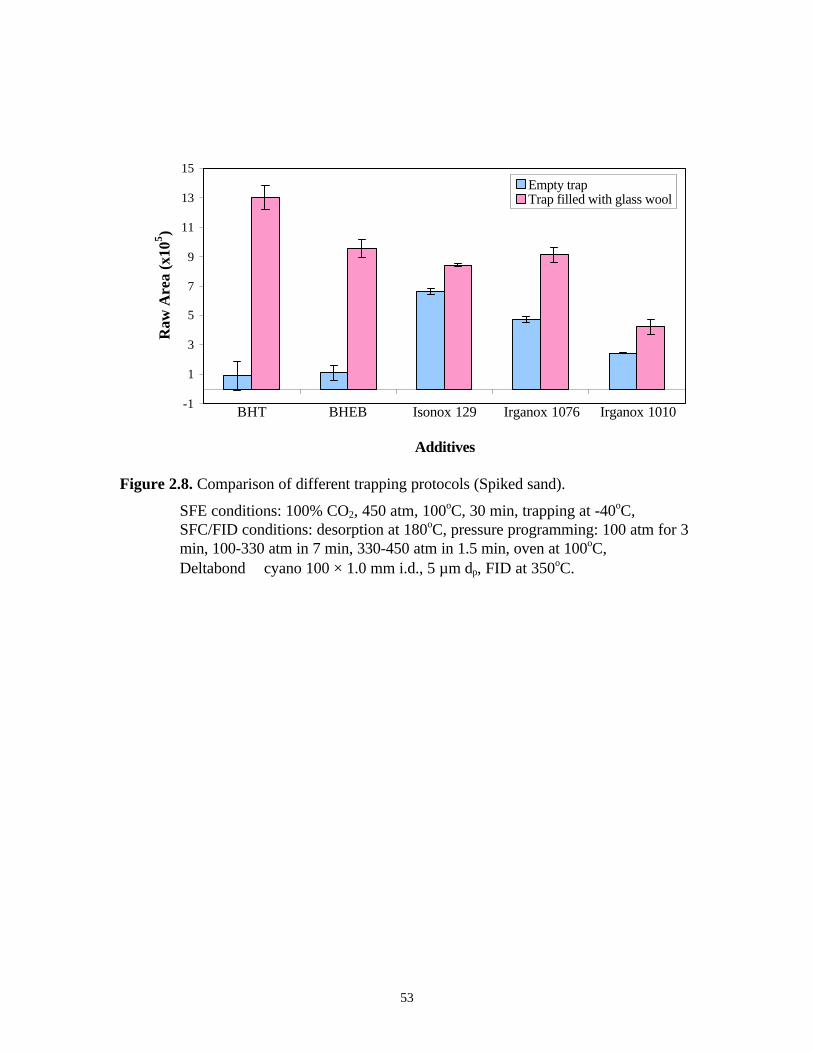
The effect of trapping temperature on trapping efficiency was next investigated by
spiking 10 µL of the 500 ppm additive standard mixture onto the sand. Extraction was
performed at 450 atm and 100oC. The extracts were collected at different trapping
temperatures (i.e., -50, -40, -25, -5, 5oC). After 30 min extraction/collection, the SFE/SFC
valves were switched to the injection mode and collected materials were backflushed at
180oC to the separation column.
As can be seen in Figure 2.9, the effect of trapping temperature on the collection
of relatively volatile species such as BHT and BHEB was profound. At trapping
temperatures higher than –40oC, dramatic decreases in peak area were observed due to
their relatively high volatilities. The analytes easily vented out of the trap with the
expanded CO2 at the higher temperatures. On the other hand, no significant difference was
found for the collection of Isonox 129, Irganox 1076, and Irganox 1010 at different trap
temperatures due to their stabilities at relatively high temperature. Therefore, the
cryogenic trap was maintained at –40oC to ensure adequate trapping of this additive
package.
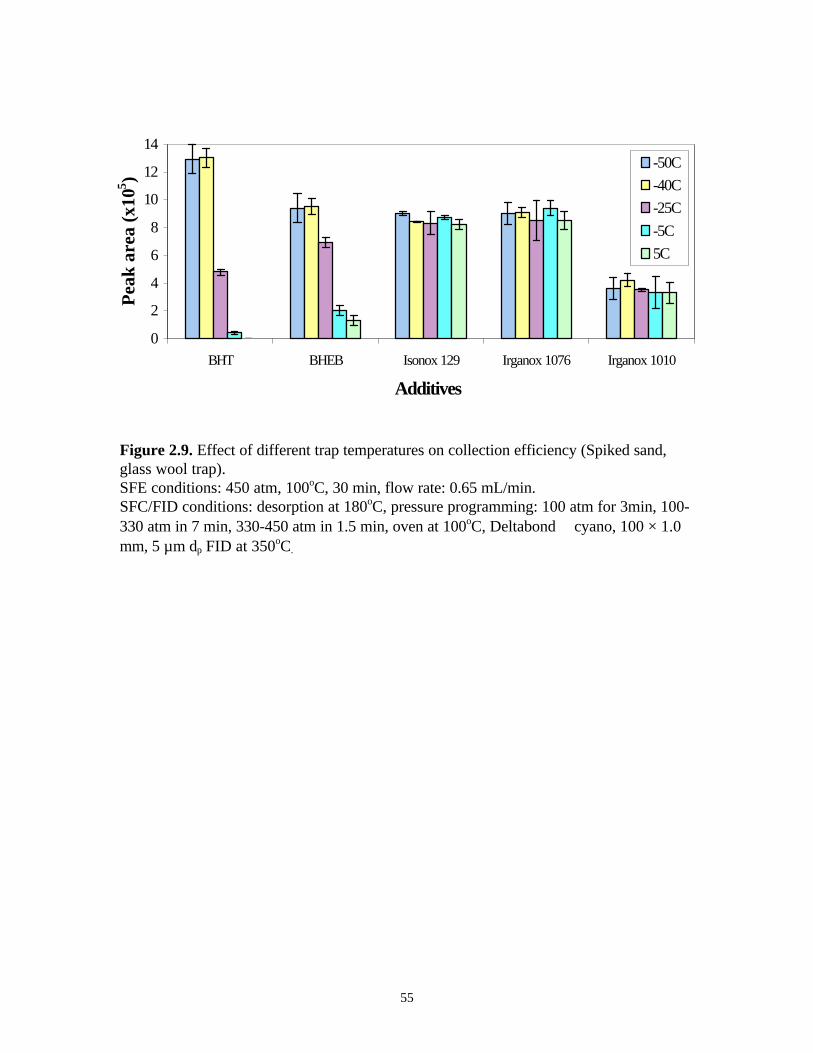
The heating of the cryogenic collection trap prior to SFC was also investigated. In
order to show the effect of heating at different temperatures on the efficiency of removing
the extracts from the trap to the SFC column, the spiked sand was extracted and collected
at -40oC. After 30 min of collection, the system was switched to the SFC injection mode
while the cryogenic trap was billastically heated to 100oC. A second SFC injection was
performed with the thermal desorption temperature at 180oC without any additional
extraction. The chromatograms are shown in Figure 2.10. By comparing the peak areas,
we found even for volatile analytes such as BHT and BHEB, 2-3% of the extracted
amount was left in the trap after the first injection at 100oC. The unremoved amounts after
the first injection of Isonox 129, Irganox 1076, and Irganox 1010 were 21%, 11%, and
9%, respectively.
55
Figure 2.9. Effect of different trap temperatures on collection efficiency (Spiked sand,glass wool trap).SFE conditions: 450 atm, 100oC, 30 min, flow rate: 0.65 mL/min.SFC/FID conditions: desorption at 180oC, pressure programming: 100 atm for 3min, 100-330 atm in 7 min, 330-450 atm in 1.5 min, oven at 100oC, Deltabond cyano, 100 × 1.0mm, 5 µm dp FID at 350oC.
0
2
4
6
8
10
12
14
BHT BHEB Isonox 129 Irganox 1076 Irganox 1010
Additives
Pea
k ar
ea (
x105 )
-50C
-40C
-25C
-5C
5C
56
Figure 2.10. On-line SFE/SFC chromatogram of sand spiked with additive standards atdifferent desorption temperatures.A. 100oC, B. 180oC.1. BHT, 2. BHEB, 3. Isonox 129, 4. Irganox 1076, 5. Irganox 1010.SFE conditions: 450 atm, 100oC, 30 min, trapping at –40oC.SFC/FID conditions: pressure programming: 100 atm for 3min, 100-330 atm in 7 min,330-450 atm in 1.5 min, oven at 100oC, Deltabond cyano, 100×1.0 mm, 5 µm dp, FIDdetection at 350oC.
Remaining in the trap after first injection
1) BHT: 2%
2) BHEB: 3%
3) Isonox 129: 21%
4) Irganox 1076: 11%
5) Irganox 1010: 9%
First desorption@100oC Second desorption@180oCwithout additional extraction
1 2 3 45
1 2
3
4
5
PA
PA PA2
1 2
100%+
×
PA: Peak Area

57
When the injection was first performed at 180oC, a following second run showed that no
significant amount of the analytes was left in the trap.
This result suggested that although lower SFE temperatures resulted in higher
solvating power, the removal of the analytes from the trap area to the SFC column was
dominated by not only the solubility in the fluid but also the higher temperature.
Optimization of Extraction Parameters
The main factors affecting the efficiency of extraction of the additives from
polymers are the solubility of the additives in the fluid and the rate of mass transfer of the
additives out of the polymer matrix 35,37,45,46. In the absence of specific additive-polymer
matrix interaction (e.g., sand instead of polymer matrix), the extraction will primarily be
controlled by pressure, temperature, and time, as well as fluid flow rate.
In our study, the effects of extraction pressure, temperature, time, and fluid flow
rate were investigated by spiking the additive standards onto the sand using the optimized
trap conditions. Results from the optimization study are summarized in Figure 2.11-2.14.
As seen in Figure 2.11, increasing the extraction pressure from 350 to 450 atm at
constant extraction temperature leads to a statistical increase in the extraction of Irganox
1076 and Irganox 1010, while no significant variation in the extraction yields of the other
three additives was observed. These results suggested that at 350 atm and 100oC, the
density, and hence the solvating power of CO2, was sufficiently high for the extraction of
low molecular weight analytes such as BHT, BHEB, and Isonox 129. Further increase of
the pressure didn’t result in a further increase of the extraction yield. Apparently the effect
of pressure on the extraction of high molecular weight species (i.e., Irganox 1076 and
Irganox 1010) was more pronounced than that observed for low molecular weight
analytes. It appeared that at 350 atm and constant temperature the solubilities of Irganox
1076 and Irganox 1010 in CO2 were not sufficiently high. Increasing the pressure from
45 Bartle K.D., Boddington T., Clifford A.A., Hawthorne S.B. (1992) J. Supercritical Fluids 5, 20746 Bartle K.D., Boddington T., Clifford A.A., Cotton N.J. (1991) Anal. Chem. 63, 2371

58
Figure 2.11. Effect of extraction pressure on extraction efficiency (Spiked sand).SFE conditions: 100oC, 30 min, trapping at –40oC, flow rate: 0.65 mL/min.SFC/FID conditions: desorption at 180oC, pressure programming: 100 atm for 3min, 100-330 atm in 7 min, 330-450 atm in 1.5 min, oven at 100oC, Deltabond cyano, 100 × 1.0mm, 5 µm dp, FID at 350oC.
0
2
4
6
8
10
12
14
BHT BHEB Isonox 129 Irganox 1076 Irganox 1010
Additives
Pea
k ar
ea (
x105 )
350 atm450 atm

59
350 to 450 atm (density from 0.72 to 0.80 g/mL) caused the extraction rates to increase
significantly. For BHT, BHEB, and Isonox 129, above a certain pressure value at constant
temperature, it seemed that the solubility of the components in the SF is no longer the
rate-limiting parameter for extraction, whereas for Irganox 1076 and Irganox 1010, the
solubility may always be the rate-limiting parameter for the extraction even at quite high
pressure due to their relatively poor solubility in CO2 because of their high molecular
weight 47.
The effects of temperature at constant pressure are even more complicated than
the effect of pressure at constant temperature. Increasing temperature decreases solute-
fluid interaction, which results in a decreased solvating power. Whereas at the same time it
also decreases solute-solute interaction, which results in an increased solubility. Therefore
two competing factors affect the extraction of the solute in the SF.
One important point must be kept in mind is special consideration for extraction
temperature when real polymer samples are dealt. The glass transition temperature (Tg)
and melt temperature (Tm) of polymer sample should be taken into account. The extraction
efficiency of a polymer is enhanced above its Tg and is increased still further above the
polymer Tm 48. A temperature above the Tg results in enough molecular motion in the
amorphous phase of the polymer so that the SF can diffuse into the region easily.
However, a temperature higher than the Tm is not practical because once the crystalline
phase of the phase melts, clogging the extraction system and possibly ruining the
extraction vessel may easily happen. The LDPE sample used in this work has a Tg well
below ambient temperature and its Tm=106-115oC. Therefore, the highest temperature
practical for this work was below 106oC.
As shown in Figure 2.12, the extraction efficiency at 450 atm increased
considerably for Irganox 1076 and Irganox 1010 when the temperature was raised from
47 Kurnik R.T., Holla S.J., Reid R.C. (1981) J. Chem. Eng. Data 26 4748 McHugh M.A. Krukonis V.J. (1986) Supercritical Fluid Extraction: Principles and Practice,Butterworths: Boston

60
Figure 2.12. Effect of extraction temperature on extraction efficiency (Spiked sand).SFE conditions: 450 atm, 30 min, trapping at –40oC, flow rate: 0.65 mL/min.SFC/FID conditions: desorption at 180oC, pressure programming: 100 atm for 3min, 100-330 atm in 7 min, 330-450 atm in 1.5 min, oven at 100oC, Deltabond cyano, 100 × 1.0mm, 5 µm dp, FID at 350oC.
0
2
4
6
8
10
12
14
16
BHT BHEB Isonox 129 Irganox 1076 Irganox 1010
Additives
Pea
k ar
ea (
x105 ) 80C
100C

61
80 to 100oC. Apparently, under these conditions, disrupting solute-solute interaction
dominated the increase in the extraction of high molecular weight species in CO2.
Meanwhile, the extraction of BHT, BHEB, and Isonox 129 did not noticeably change with
a temperature change, which suggested the extraction didn’t vary very much with
temperature at sufficiently high pressure due to their low molecular weight and small
molecular size.
In the experiments described above, the pre-trap restrictor used was a piece of 25
cm × 25 µm fused silica capillary to afford a liquid fluid flow rate 0.65 mL/min. In order
to investigate the effect of fluid flow rate on the extraction efficiency, the restrictor was
replaced by a 50 µm fused silica capillary 25 cm long to obtain a higher fluid flow rate
(i.e., 2.0 mL/min). A different extraction time was employed for the different fluid flow
rates so that the amount of CO2 used for each extraction was the same. The results are
shown in Figure 2.13. Apparently, faster flow resulted in lower collection efficiency,
because the extracted analytes easily vented out in the form of aerosol with the expanded
CO2 gas flow.
Experiments were also conducted to optimize the extraction time for the additive
standards. For this purpose, 10 µL of the additive standard mixture was spiked onto the
sand. The extraction was conducted at 450 atm and 100oC. The liquid CO2 flow rate was
0.65 mL/min. The extracted components were collected at –40oC. The duration of each
extraction was 10 min. As can be seen in Figure 2.14, the extraction of BHT and BHEB
was completed in 10 min. No increase in the extraction yields of Isonox 129, Irganox
1076, and Irganox 1010 after a total 30 min extraction indicated that 30 min was sufficient
time for the extraction of spiked sand.
In summary, lower trap temperature, higher extraction pressure, higher extraction
temperature, and lower fluid flow rate with longer extraction time resulted in higher
extraction efficiency. The optimum extraction conditions for spiked sand are reviewed
below:

62
Figure 2.13. Effect of liquid flow rate on collection efficiency (Spiked sand).SFE conditions: 450 atm, 100oC, 30 min, trapping at –40oC.SFC/FID conditions: desorption at 180oC, pressure programming: 100 atm for 3min, 100-330 atm in 7 min, 330-450 atm in 1.5 min, oven at 100oC, Deltabond cyano, 100 × 1.0mm, 5 µm dp, FID at 350oC.
0
2
4
6
8
10
12
14
16
BHT BHEB Isonox 129 Irganox 1076 Irganox 1010
Additives
Raw
Are
a (x
105 )
0.65 mL/min (30 min)
2.0 mL/min (10 min)

63
Figure 2.14. Effect of extraction time on extraction efficiency (Spiked sand).SFE conditions: 450 atm, 100oC, 10 min × 5, trapping at –40oC.SFC/FID conditions: desorption at 180oC, pressure programming: 100 atm for 3min, 100-330 atm in 7 min, 330-450 atm in 1.5 min, oven at 100oC, Deltabond cyano, 100 × 1.0mm, 5 µm dp, FID at 350oC.
0
2
4
6
8
10
12
14
16
18
20
BHT BHEB Isonox 129 Irganox 1076 Irganox 1010Additives
Raw
Are
a (x
105)
10 min
20 min
30 min
40 min
50 min

64
Pressure: 450 atm
Temperature: 100oC
Flow rate: 0.65 mL/min
Dynamic extraction time: 30 min
Trapping temperature: -40oC
Creation of calibration curves for additive standards
Traditionally, there are several standardization techniques employed in the practice
of chromatographic analyses, external standards, internal standards, and standard addition.
Direct injection external calibration is sensitive to variations in the matrix, and therefore is
unsuitable for many matrix systems due to the so-called matrix effect 49. Simply stated, the
matrix effect is the manner in which the analytes interact with the sample matrix. 50. If the
analytes or the matrix is changed, then the matrix effect also changes. Internal standards
and standard addition can overcome the matrix effect, however, a homogeneous mixture
of standard and sample is difficult to obtain if solid samples are analyzed 49. To overcome
these problems, three point calibration curves of spiked sand with the additive standards
were established in the range of 1-3 µg of each additive standard. Ten µL of the standard
solution with various concentrations was applied via a microsyringe onto the sand in the
extraction vessel. The solvent was evaporated at room temperature before the extraction
vessel was pressurized. The extraction was conducted under the previously optimized
conditions. Peak area counts versus the amount of the additive standards was plotted to
provide a curve, the slope of which was an area response factor (area counts/µg additive)
that could be compared directly to area counts observed in actual polymer samples.
Figure 2.15 shows the calibration curves of BHT, BHEB, Isonox 129, Irganox 1076, and
Irganox 1010, respectively, as well as the correlation coefficients which were greater than
0.9. The numerical data are given in Table 2.1.
49 Klaffenbach P., Bruse C., Coors C., Kronenfeld D., Schulz H. (1997) LC/GC 15, 105250 Markelov M., Guzowski J.P. Jr. (1993) Anal. Chim. Acta 276, 235

65
Figure 2.15. Calibration curves of additive standard from spiked sand.SFE conditions: 450 atm, 100oC, 30 min, trapping at –40oC.SFC/FID conditions: desorption at 180oC, pressure programming: 100 atm for 3min, 100-330 atm in 7 min, 330-450 atm in 1.5 min, oven at 100oC, Deltabond cyano, 100 × 1.0mm, 5 µm dp, FID at 350oC.
R2 = 0.9867
0
1
2
3
4
5
6
0 1 2 3 4
Additive amount (ug)
Peak
are
a (x
105)
BHT R2 = 0.998
0
2
4
6
8
10
0 1 2 3 4
Additive amount (ug)
Peak
are
a (x
105 ) BHEB
R2 = 0.9971
0
5
10
15
20
0 1 2 3 4Additive amount (ug)
Peak
are
a (x
105) Isonox 129 R
2 = 0.9976
0
5
10
15
20
0 1 2 3 4Additive amount (ug)
Peak
are
a (x
105 ) Irganox 1076
R2 = 0.9954
0
2
4
6
0 1 2 3 4Additive amount (ug)
Peak
are
a (x
105)
Irganox 1010

66
Table 2.1. Peak area (×105) for calibration curves of spiked sand.
SFE conditions: 100% CO2, 450atm, 100oC, 30 min, trapping at -40oCSFC/FID conditions: desorption at 180oC, pressure programming:100 atm for 3 min, 100-330 atm in 7 min, 330-450 atm in 1.5 min, oven at100oC, Deltabond cyano 100 × 1.0 mm i.d., 5 µm dp, FID at 350oC.
Additive amount 1 µg 2 µg 3 µg
BHT 1.69 (4.5) 3.63 (5.8) 4.92 (11)
BHEB 2.53 (4.3) 5.42 (8.3) 7.89 (0.6)
Isonox 129 5.11 (14) 10.6 (2.9) 15.1 (4.8)
Irganox 1076 5.03 (11) 10.4 (5.3) 16.7 (1.8)
Irganox 1010 1.44 (3.6) 3.06 (1.7) 4.34 (3.1)
( ) indicates %RSD, n=3

67
Linearity of the calibration is very important. When the calibration is linear and
passes through the origin, an area response factor can be calculated using a single point
calibration.
Quantitation of additives from LDPE sample
The goal of this portion of the work was to quantitatively extract the additives
from the LDPE sample under the previously optimized conditions for spiked sand. First,
the extraction profile was obtained to determine the suitable extraction time for the
polymer sample.
The LDPE sample provided by Quantum Corp.(Cincinnati, OH) was previously
ground to 20 mesh, the large surface area is very important for transportation of the
analytes to the bulk fluid 51. Therefore the sample was extracted as it was received.
In order to make the extracted additive concentration fall into the linear range of
the calibration curves obtained with spiked sand, approximately 2 mg of the LDPE sample
was employed for each extraction. Another reason for the use of a small sample size was
to avoid clogging of the small i.d. fused silica restrictor and overloading the column.
Figure 2.16 shows a representative on-line SFE/SFC chromatogram of the LDPE sample.
The extraction profile obtained for the additives from the LDPE sample using the
optimized conditions is shown in Figure 2.17. It was found that the extraction of the
relatively volatile and low molecular weight species such as BHEB was exhaustive in 15
min. This result suggested that the extraction of low molecular weight species was only
solubility limited. However, for the extraction of the other three additives, Isonox 129,
Irganox 1076, and Irganox 1010, which are nonvolatile and have higher molecular
weights, the extraction profile was very typical of an extraction both solubility and
diffusion limited. The initial extraction of the three additives occurred rapidly (in the first
15 min), which suggested that the extraction was dependent upon the solubility of the bulk
51 Bartle K.D., Clifford A.A., Hawthorne S.B., Langenfeld J.J., Miller D.I., Robinson R. (1990) J.Supercritical Fluids 27, 143

68
Figure 2.16. On-line SFE/SFC/FID chromatogram of LDPE sample (2.0 mg).1. BHEB, 2. Isonox 129, 3. Irganox 1076, 4. Irganox 1010.SFE conditions: 450 atm, 100oC, 15 min, trapping at –40oC.SFC/FID conditions: desorption at 180oC, pressure programming: 100 atm for 3min, 100-330 atm in 7 min, 330-450 atm in 1.5 min, oven at 100oC, Deltabond cyano, 100×1.0mm, 5 µm dp, FID at 350oC.

69
I II III
* Mass extracted was determined via calibrations for spiked sand, %Recoverywas calculated relative to vendor stated results.
Figure 2.17. Extraction profile of LDPE sample.SFE conditions: 450 atm, 100oC, 15 min×4, trapping at –40oC.SFC/FID conditions: desorption at 180oC, pressure programming: 100 atm for 3min, 100-330 atm in 7 min, 330-450 atm in 1.5 min, oven at 100oC, Deltabond cyano, 100×1.0mm, 5 µm dp, FID at 350oC.
0
20
40
60
80
100
0 15 30 45 60 75Time (min)
%R
ecov
ery*
BHT
Isonox 129
Irganox 1076
Irganox 1010I II III
70
analytes in the SF (region I). Region II is an intermediate region where the extraction
process was slower, which indicated that the extraction was enthalpically controlled (i.e.,
analyte-matrix interaction must be disrupted). A transition to diffusion limited kinetics also
took place in this region. The extraction was much slower after 45 min (region III), which
represented when the extraction process was truly diffusion-controlled 1. Therefore, for
these three additives, 60 min was deemed a sufficient extraction time.
The percent recoveries under optimized SFE/SFC conditions of the additives from
the LDPE sample are given in Table 2.2. The mass extracted was obtained from
comparison with the calibration curves of spiked sand. The recoveries were calculated
based on the original additive concentration provided by the manufacturer. Only BHEB,
Isonox 129, Irganox 1076, and Irganox 1010 were quantified. BHT was not detected
(ND), most likely due to the transformation of BHT radicals to dimer, which is not
extractable 18. Figure 2.18 shows the transformation when dimerization of BHT occurs.
Recoveries greater than 80% for each additive were achieved by the on-line SFE/SFC
technique. However, the precision was quite low due to the very small sample size,
approximately 2.0 mg. The inhomogeneous distribution of the additives in the polymer
product could also result in low analysis precision.
Off-line SFE/HPLC
In the analysis using the on-line SFE/SFC system, a very small sample size was
employed, which was believed to be the cause of the low precision. In this portion of the
study, we tried to examine another technique, off-line SFE/HPLC, which can be used for
large sample sizes.
A 500 mg sample of the LDPE, approximately 250 times that employed in the on-
line SFE/SFC, was subjected to off-line SFE/HPLC. The extracts must be analyzed within
24 hours to avoid possible degradation of unstable species. Figure 2.19 shows an off-line
SFE/HPLC chromatogram of the extract of the LDPE sample. The additive percent

71
Table 2.2. Percent recovery of the additives from LDPE sample with on-line SFE/SFC.
SFE conditions: 100% CO2, 450atm, 100oC, 60 min, trapping at -40oC,sample size: 2 mgSFC/FID conditions: desorption at 180oC, pressure programming: 100 atmfor 3 min, 100-330 atm in 7 min, 330-450 atm in 1.5 min, oven at 100oC,Deltabond cyano 100×1.0 mm i.d., 5 µm dp, FID at 350oC.
Mass extracted was determined via calibrations for spiked sand, %Recoverywas calculated relative to vendor stated results
% Recovery (%RSD, n=3)
BHT ND
BHEB 93(18)
Isonox 129 80(21)
Irganox 1076 83(18)
Irganox 1010 92(12)

72
Figure 2.18. The transformation when dimerization of BHT occurs. (Taken from ref. 18)
OH
CH3
+ OOR
O
CH3
O
CH3
O
CH
O
CH
OH
CH2
OH
CH2
CH2
O

73
Figure 2.19. Off-line SFE/HPLC/UV chromatogram of LDPE sample (500mg).1. BHT, 2. BHEB, 3. Isonox 129, 4. Irganox 1010, 5. Irganox 1076.SFE conditions: 100% CO2, 450 atm, 100oC, 30 min, ODS trapping at 0oC, flow rate: 1.5mL/min, rinse with 5 mL ethylacetate/CH3CN.HPLC conditions: 150×3.9 mm, 5 µm dp RP C18, at 50oC, UV detector at 200 nm, mobilephase gradient from 75/25 (v/v) CH3CN/H2O to 100% CH3CN in 5 min, hold 100%CH3CN for 14 min, return to 75/25 (v/v) CH3CN/H2O at 19.01 min.

74
recoveries are given in Table 2.3, as well as those obtained from the on-line SFE/SFC.
Lower recoveries were obtained with the off-line SFE/HPLC method because the
coextracted oligomer could precipitate from the rinse solution and occlude a significant
portion of the analytes. Heating the polymer extract solution would be helpful to dissolve
the oligomer as well as the analytes. However, extreme care will be essential since some of
the additives are thermally unstable. Higher recoveries were obtained with the on-line
SFE/SFC method, most likely due to the fewer number of experimental steps and
therefore the reduction in sample handling compared to the off-line SFE/HPLC. Also the
use of the cryogenic collection trap eliminated the problem of the coextracted oligomer
precipitating and occluding the analytes from the rinse solution. However, the presence of
the coextracted oligomer from the SFE could render subsequent chromatographic
integration deviation. This problem can be partially overcome by use chromatographic
detectors having a specificity for the analyte of interest. In this case, a UV detection will
be working. The recoveries from two techniques are comparable, except for Irganox
1076. However, the precision obtained from the off-line SFE/HPLC was much better
compared to that from the on-line SFE/SFC. The different precisions obtained with the
two techniques is believed to arise from the sample size difference, i.e., about 250 times
amount of sample employed in off-line SFE/HPLC compared to the on-line SFE/SFC.
Off-line ESE/HPLC
Enhanced Solvent Extraction (ESE), also known as Accelerated Solvent
Extraction (ASE™), is a new extraction method that significantly streamlines sample
preparation. A commonly used solvent is pumped into the extraction cell containing the
sample, which is then brought to an elevated temperature and pressure. Minutes later, the
extract is transferred from the heated cell to a standard collection vial for clean-up or
analysis. the entire extraction process is fully automated and performed in minute for fast
and easy extraction with low solvent consumption. ESE has been demonstrated to be
equivalent to existing extraction methodologies such as Soxhlet and automated Soxhlet
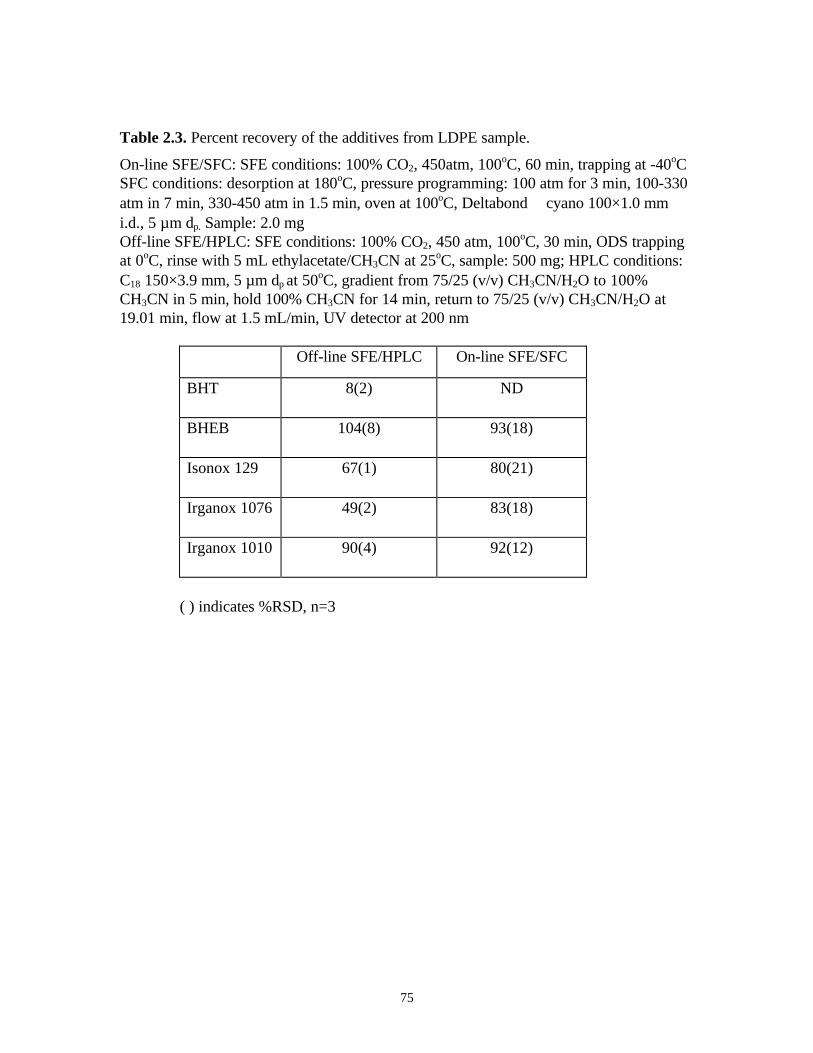
75
Table 2.3. Percent recovery of the additives from LDPE sample.
On-line SFE/SFC: SFE conditions: 100% CO2, 450atm, 100oC, 60 min, trapping at -40oCSFC conditions: desorption at 180oC, pressure programming: 100 atm for 3 min, 100-330atm in 7 min, 330-450 atm in 1.5 min, oven at 100oC, Deltabond cyano 100×1.0 mmi.d., 5 µm dp. Sample: 2.0 mgOff-line SFE/HPLC: SFE conditions: 100% CO2, 450 atm, 100oC, 30 min, ODS trappingat 0oC, rinse with 5 mL ethylacetate/CH3CN at 25oC, sample: 500 mg; HPLC conditions:C18 150×3.9 mm, 5 µm dp at 50oC, gradient from 75/25 (v/v) CH3CN/H2O to 100%CH3CN in 5 min, hold 100% CH3CN for 14 min, return to 75/25 (v/v) CH3CN/H2O at19.01 min, flow at 1.5 mL/min, UV detector at 200 nm
Off-line SFE/HPLC On-line SFE/SFC
BHT 8(2) ND
BHEB 104(8) 93(18)
Isonox 129 67(1) 80(21)
Irganox 1076 49(2) 83(18)
Irganox 1010 90(4) 92(12)
( ) indicates %RSD, n=3

76
for most RCRA (Resource Conservation and Recovery ACT) analytes from solid and
semi-solid samples 52.
In our work, a 500 mg sample of LDPE was also subjected to the off-line
ESE/HPLC process. Table 2.4 and Table 2.5 show the additive results in percent
recovery and concentration (ppm), respectively. Comparable results were obtained with
on-line SFE/SFC, off-line SFE/HPLC, and off-line ESE/HPLC, except for Irganox 1076.
However, in ESE process, the tube easily clogged with the messy extracts. Therefore,
clean-up of the system after the extraction was required.
52 Application Notes 324 (1996) Dionex Corp.

77
Table 2.4. Percent recovery of the additives from LDPE sample.
On-line SFE/SFC: SFE conditions: 100% CO2, 450atm, 100oC, dynamic 30 min, trappingat -40oC SFC conditions: desorption at 180oC, pressure programming: 100 atm for 3 min,100-330 atm in 7 min, 330-450 atm in 1.5 min, oven at 100oC, Deltabond cyano100×1.0 mm i.d., 5 µm dp. Sample: 2.0 mgOff-line SFE/HPLC: SFE conditions: 100% CO2, 450 atm, 100oC, dynamic 30 min, ODStrapping at 0oC, rinse with 5 mL ethylacetate/CH3CN at 25oC, sample: 500 mg; HPLCconditions: C18 150×3.9 mm, 5 µm dp at 50oC, gradient from 75/25 (v/v) CH3CN/H2O to100% CH3CN in 5 min, hold 100% CH3CN for 14 min, return to 75/25 (v/v) CH3CN/H2Oat 19.01 min, flow at 1.5 mL/min, UV detector at 200 nmOff-line ESE/HPLC: ESE conditions: 100% CO2, 200 atm, 100oC, static 30 min, rinsewith 10 mL ethylacetate/CH3CN, flush with 10 mL CO2, sample: 500mg; Same HPLCconditions as in off-line SFE/HPLC
Off-line ESE/HPLC Off-line SFE/HPLC On-line SFE/SFC
BHT 8(5) 8(2) ND
BHEB 104(10) 104(8) 93(18)
Isonox 129 68(2) 67(1) 80(21)
Irganox 1076 50(3) 49(2) 83(18)
Irganox 1010 94(16) 90(4) 92(12)
( ) indicates %RSD, n=3
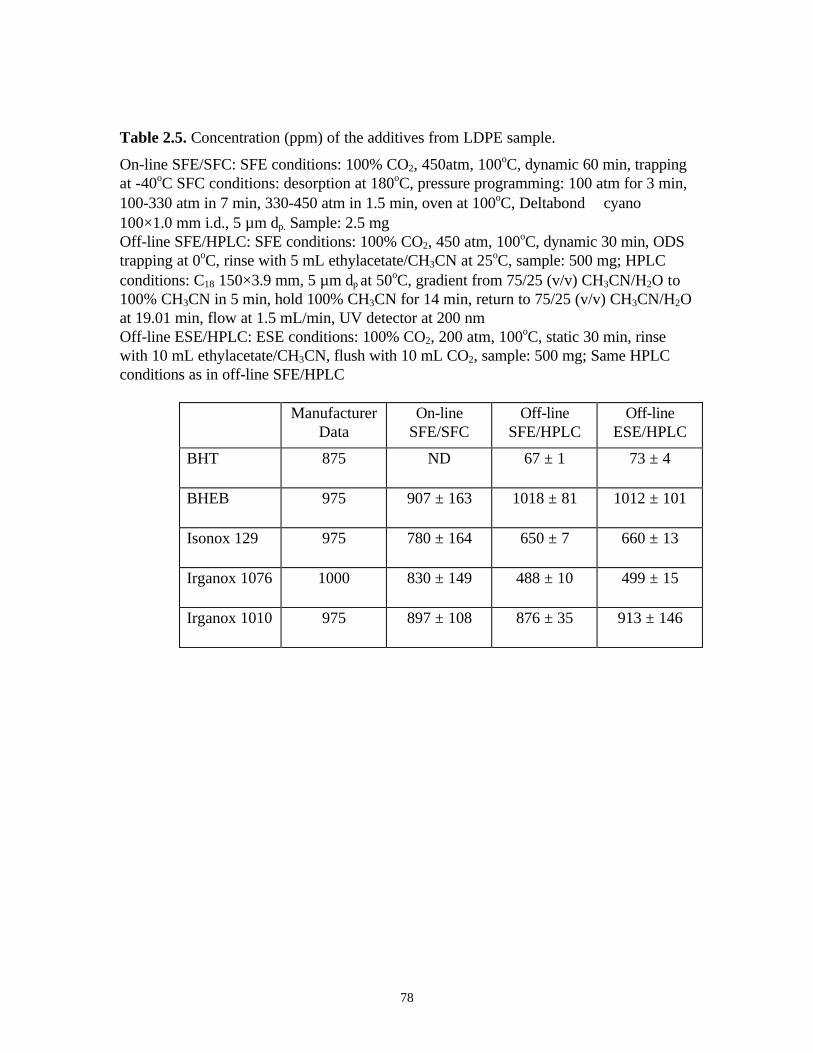
78
Table 2.5. Concentration (ppm) of the additives from LDPE sample.
On-line SFE/SFC: SFE conditions: 100% CO2, 450atm, 100oC, dynamic 60 min, trappingat -40oC SFC conditions: desorption at 180oC, pressure programming: 100 atm for 3 min,100-330 atm in 7 min, 330-450 atm in 1.5 min, oven at 100oC, Deltabond cyano100×1.0 mm i.d., 5 µm dp. Sample: 2.5 mgOff-line SFE/HPLC: SFE conditions: 100% CO2, 450 atm, 100oC, dynamic 30 min, ODStrapping at 0oC, rinse with 5 mL ethylacetate/CH3CN at 25oC, sample: 500 mg; HPLCconditions: C18 150×3.9 mm, 5 µm dp at 50oC, gradient from 75/25 (v/v) CH3CN/H2O to100% CH3CN in 5 min, hold 100% CH3CN for 14 min, return to 75/25 (v/v) CH3CN/H2Oat 19.01 min, flow at 1.5 mL/min, UV detector at 200 nmOff-line ESE/HPLC: ESE conditions: 100% CO2, 200 atm, 100oC, static 30 min, rinsewith 10 mL ethylacetate/CH3CN, flush with 10 mL CO2, sample: 500 mg; Same HPLCconditions as in off-line SFE/HPLC
ManufacturerData
On-lineSFE/SFC
Off-lineSFE/HPLC
Off-lineESE/HPLC
BHT 875 ND 67 ± 1 73 ± 4
BHEB 975 907 ± 163 1018 ± 81 1012 ± 101
Isonox 129 975 780 ± 164 650 ± 7 660 ± 13
Irganox 1076 1000 830 ± 149 488 ± 10 499 ± 15
Irganox 1010 975 897 ± 108 876 ± 35 913 ± 146

79
Conclusions
On-line SFE/SFC with cryogenic trapping was used to extract and separate five
additives from a LDPE sample. The trap filled with glass wool was found to greatly
improve collection efficiency. Spiked sand was employed to optimize the various
parameters of the on-line SFE/SFC system. We found that lower trapping temperature (-
40oC), higher extraction pressure (450 atm) and extraction temperature (100oC), lower
fluid flow rate (0.65 mL/min) with longer extraction time (30 min) resulted in better
extraction and collection efficiency. Higher desorption temperature (180oC) was essential
to efficiently remove the extracted analytes from the trap to the separation column. The
“Memory effect” of the on-line system and impurities in CO2 tanks were studied. The use
of the filter filled with activated carbon and adsorption alumina overcome the impurity
problems. Suitable concentration is necessary to minimize the “memory effect”.
Calibration curves of spiked sand of on-line SFE/SFC were obtained with good linearities
for quantitation. Off-line SFE/HPLC and off-line ESE/HPLC were also performed to
compare to the on-line SFE/SFC. The results obtained from on-line SFE/SFC were
comparable to those from off-line SFE/HPLC and off-line ESE/HPLC, except for Irganox
1076. However, the precision obtained with on-line SFE/SFC was lower than that from
off-line SFE/HPLC and off-line ESE/HPLC due to the small sample size employed in the
on-line system. Using on-line SFE/SFC did minimize the sample handling and reduce the
organic solvent used, i.e., no organic solvent was used in on-line SFE/SFC as compared to
35 mL of ethylacetate and CH3CN used in off-line SFE/HPLC for each run. Despite the
precisions lower than expected, on-line SFE/SFC method for quantitation of polymer
additives are reliable and robust for application in routine analysis of quality control.

80
Vita
The author, Lucy Ying Zhou, was born on September 2, 1967 to Qianyuan and
Qiuxia in Wuxi, China. She attended Jianxin high school of Qidong, China, graduating in
1984. She was awarded her Bachelor of Science degree in Chemistry from Fudan
University of China in July of 1988. After graduation she worked in governmental and
industrial departments in China. On March 31, 1991, she married Haiqing Yuan and on
March 31, 1994 they had their first daughter, Amy Ruomei. She entered Virginia Tech in
1996 to pursue a Master of Science degree under the advisement of Dr. Larry Taylor.


![Quantitative HREM observation of the S11(113)/[1¯10] grain … · 2010. 3. 30. · local-density approximation to density-functional theory and employed a pseudopotential representation](https://img.pdfslide.net/doc/110x75/60ee53cd5f64ef424b2d49fc/quantitative-hrem-observation-of-the-s11113110-grain-2010-3-30-local-density.jpg)