Embed Size (px)
Citation preview

RESEARCH ARTICLE
Quantitative analysis of disfluency in children
with autism spectrum disorder or language
impairment
Heather MacFarlane1, Kyle Gorman1,2, Rosemary Ingham1, Alison Presmanes Hill1,2,
Katina Papadakis1, Geza Kiss1, Jan van Santen1,2*
1 Center for Spoken Language Understanding, Institute on Development & Disability, Oregon Health &
Science University, Portland, Oregon, United States of America, 2 Department of Pediatrics, Oregon Health &
Science University, Portland, Oregon, United States of America
Abstract
Deficits in social communication, particularly pragmatic language, are characteristic of indi-
viduals with autism spectrum disorder (ASD). Speech disfluencies may serve pragmatic
functions such as cueing speaking problems. Previous studies have found that speakers
with ASD differ from typically developing (TD) speakers in the types and patterns of disfluen-
cies they produce, but fail to provide sufficiently detailed characterizations of the methods
used to categorize and quantify disfluency, making cross-study comparison difficult. In this
study we propose a simple schema for classifying major disfluency types, and use this
schema in an exploratory analysis of differences in disfluency rates and patterns among
children with ASD compared to TD and language impaired (SLI) groups. 115 children ages
4–8 participated in the study (ASD = 51; SLI = 20; TD = 44), completing a battery of experi-
mental tasks and assessments. Measures of morphological and syntactic complexity, as
well as word and disfluency counts, were derived from transcripts of the Autism Diagnostic
Observation Schedule (ADOS). High inter-annotator agreement was obtained with the use
of the proposed schema. Analyses showed ASD children produced a higher ratio of content
to filler disfluencies than TD children. Relative frequencies of repetitions, revisions, and
false starts did not differ significantly between groups. TD children also produced more cued
disfluencies than ASD children.
Introduction
Autism spectrum disorder (ASD) is characterized by deficits in communication, impairments
in social interaction, and restricted or repetitive patterns of behavior, interests, and activities
[1]. While linguistic abilities in children with ASD are highly variable [2, 3], delays and deficits
are relatively common [4, 5]. Recent studies suggest a majority of verbally fluent children with
ASD have impairments in structural language, which includes phonology, vocabulary, and
grammar [6, 7]. On the other hand, pragmatic language—the socially-oriented elements of lan-
guage use—is thought to be universally impaired in ASD [8–13]. Although many studies have
PLOS ONE | https://doi.org/10.1371/journal.pone.0173936 March 15, 2017 1 / 20
a1111111111
a1111111111
a1111111111
a1111111111
a1111111111
OPENACCESS
Citation: MacFarlane H, Gorman K, Ingham R,
Presmanes Hill A, Papadakis K, Kiss G, et al.
(2017) Quantitative analysis of disfluency in
children with autism spectrum disorder or
language impairment. PLoS ONE 12(3): e0173936.
https://doi.org/10.1371/journal.pone.0173936
Editor: Etsuro Ito, Waseda University, JAPAN
Received: December 18, 2016
Accepted: February 28, 2017
Published: March 15, 2017
Copyright: © 2017 MacFarlane et al. This is an
open access article distributed under the terms of
the Creative Commons Attribution License, which
permits unrestricted use, distribution, and
reproduction in any medium, provided the original
author and source are credited.
Data Availability Statement: De-identified
participant information sufficient to recreate
analysis is available at https://gist.github.com/
kylebgorman/
77ce12c9167554ade560af9d34565c11.
Funding: This material is based on work supported
by the National Institute on Deafness and Other
Communication Disorders of the National Institutes
of Health (nidcd.nih.gov) under awards
R01DC007129 and R01DC012033, and by Autism
Speaks (autismspeaks.org) under Innovative
Technology for Autism Grant 2407. All funding was

attempted to measure specific features of pragmatic deficits in individuals with ASD and typi-
cally developing peers [14–18], pragmatic language has proved difficult to define and quantify
[19, 20].
One area of particular pragmatic difficulty for individuals with ASD is conversational reci-
procity. Children and adolescents with ASD experience difficulties with initiating conversation
or responding to the initiations of others [18, 21, 22], taking conversational turns [23], staying
on topic [24, 25], and producing coherent narratives [24]. These abilities are crucial for day-
to-day speech communication, and thus there is great potential value for interventions that
might increase the capacity of an individual with ASD to understand and be understood [26].
Disfluencies reflect difficulties in planning and delivering speech [27], and certain types of
disfluency—particularly fillers like uh or um—make these difficulties explicit to listeners [28].
Disfluencies may also provide listeners with cues to linguistic structure, signal speaker uncer-
tainty [29], or mark the introduction of new information to the discourse [30, 31]. Disfluen-
cies, then, are also part of conversational reciprocity.
There is a clinical impression that individuals with autism “may lack in fluency” [9], and
several exploratory studies attempted to quantify this impression. Studies investigating dis-
fluency in individuals with ASD [32–34] have generally grouped disfluencies by function,
under the hypothesis that different types of disfluency manifest from different types of process-
ing breakdowns [35]. Previous studies have distinguished several major types of disfluency
including pauses, fillers (uh, um), false starts, disfluent repetitions, revisions [36, 37], and stut-
ters, a disruption in the expected rate or fluency of speech [17]. These studies have found that
high-functioning adults with autism produce fewer revisions and more repetitions than typi-
cally developing controls [32]; children and adolescents with autism use more repetitions [38];
and children with autism produce longer silent pauses [39]. Another study found that children
with ASD produced fewer “ungrammatical pauses” (pauses which occur within linguistic con-
stituents like noun phrases; e.g., “the [pause] car”) while narrating a wordless picture book
[40]. Finally, several studies have found that children with autism are less likely to produce
ums than typically developing peers, but produce similar rates of uhs [39, 41, 42]. Thus, across
different types of disfluencies and participant populations, there appear to be robust group dif-
ferences. This is consistent with hypothesis that disfluencies reflect distinct types of processing
breakdowns insofar as these breakdowns can be attributed to structural and pragmatic lan-
guage difficulties associated with autism.
A significant challenge in interpreting these results—and specifically in relating them to
known features of language in autism—is the lack of formal definitions of disfluency types like
“false start” or “filler”. These interpretive challenges have lead some to argue for the utility of a
single schema for coding disfluencies [43]. One well-known attempt to provide a comprehen-
sive schema of disfluency proposes seven distinct types of disfluency plus one hybrid type [37]
which can be classified using annotations of disfluencies and associated “repairs”. Though this
schema provides formal definitions and many illustrative examples, it has not been widely
adopted. In our opinion, the primary reason for this is that it is simply too complex, making it
difficult to achieve high interannotator agreement under normal conditions. Thus, it is not
apparent just what to count if one wishes to quantify patterns of disfluency use, an issue we
seek to remedy.
Current study
In what follows, we propose a precisely-defined schema for labeling disfluencies by type, and
then apply this schema in a large-scale exploratory study of disfluency use in children with ASD,
comparing them to peers with typical development (TD) or specific language impairment (SLI).
Quantitative analysis of disfluency in children with ASD or SLI
PLOS ONE | https://doi.org/10.1371/journal.pone.0173936 March 15, 2017 2 / 20
awarded to Jan van Santen at Oregon Health and
Science University. The funders had no role in
study design, data collection and analysis, decision
to publish, or preparation of the manuscript.
Competing interests: The authors have declared
that no competing interests exist.

Specific language impairment is a neurodevelopmental disorder characterized by language
delays or deficits in the absence of accompanying developmental or sensory impairments [44].
SLI is associated primarily with deficits in structural language abilities whereas ASD involves
atypicalities in both structural and pragmatic language [45]. While some recent work has prob-
lematized the very term “specific language impairment” [46, 47], it is an appropriate label for a
clinical group with intact non-verbal IQ and no other comorbidities, and this clinical group is
essential to determining whether there are specific ASD-related profiles of disfluency use. For
example, prior work has found that children with SLI produce more disfluencies than typically
developing children matched on age, but similar rates to TD children matched on language
[35, 48]. This suggests that difficulties with structural language—common in, but not specific
to, children with ASD [49–51]—may affect disfluency rates. Without the SLI comparison
group it would be impossible to isolate the influence of the pragmatic language difficulties
which characterize ASD.
Materials and methods
Participants
115 children from the Portland, OR metropolitan area between 4–8 years of age participated
in the current study: 51 children with autism spectrum disorder (ASD; 45 male), 44 children
with typical development (TD; 32 male), and 20 children with specific language impairment
(SLI; 12 male).
Recruitment and screening. As described in prior work [41], participants were recruited
using a variety of community and health care resources. All participants scored 70 or higher
for full-scale IQ using the Wechsler Preschool and Primary Scale of Intelligence (WPPSI-III;
[52]) for children under 7 years of age, or the Wechsler Intelligence Scale for Children (WIS-
C-IV; [53]) for children ages 7 or older. Children were excluded from the study if any of the
following were present: 1) any other known metabolic, neurological, or genetic disorder, 2)
gross sensory or motor impairment, 3) brain lesion, 4) orofacial abnormalities (e.g., cleft pal-
ate), or 5) intellectual disability. All participants were native, first-language speakers of English.
During an initial screening, a certified speech-language pathologist confirmed the absence of
speech intelligibility impairments and determined that the participants produced a mean
length of utterance in morphemes (MLUM) of at least three.
Diagnostic groups. The gold standard for ASD diagnosis is best estimate clinical judg-
ment (BEC) by experienced clinician diagnosis [54, 55]. In this study, a panel of two clinical
psychologists, a speech language pathologist, and an occupational therapist, all of whom had
clinical expertise with ASD, based their judgments on the DSM-IV-TR criteria for ASD [56].
The ASD group consisted only of children who received a consensus BEC diagnosis of ASD.
The consensus diagnosis was further confirmed by above-threshold scores on two other tests:
the Autism Diagnostic Observation Schedule-Generic (ADOS-G; [57]) according to the
revised algorithm [58], and the Social Communication Questionnaire (SCQ; [59]) using a cut-
off score of 12 as recommended for research purposes [60].
Language impairment was assessed using the Clinical Evaluation of Language Fundamen-
tals (CELF), a test which produces a composite of expressive and receptive language abilities.
The CELF Preschool-2 [61] was administered for children younger than 6 years of age; the
CELF-4 [62] was used for children age 6 or older. Language impairment was determined when
a participant received a CELF core language score (CLS) more than one standard deviation
below the normative mean. Of the 51 children with ASD, this criterion identified 26 as lan-
guage-impaired. Children in the SLI group also were required to have a documented history of
language delays or deficits, and a BEC consensus judgment of language impairment (but not
Quantitative analysis of disfluency in children with ASD or SLI
PLOS ONE | https://doi.org/10.1371/journal.pone.0173936 March 15, 2017 3 / 20

ASD). The clinical panel made this judgment using medical and family history, assessments
performed as part of this study or at an earlier time by others, and school records. Children
with a BEC diagnosis of SLI were excluded from the study if they reached threshold on both
the ADOS-G and the SCQ.
Children who did not meet the above criteria for either ASD or SLI were assigned to the
TD group. However, participants were excluded from the TD group (and the study) if they
had any family members diagnosed with either ASD or SLI, a history of psychiatric distur-
bance (e.g. ADHD), or if they were above the aforementioned thresholds on either the
ADOS-G or the SCQ.
Procedures
Participants completed a battery of experimental tasks and cognitive, language, and neuropsy-
chological assessments over six sessions of 2–3 hours each. Participating families were fully
informed about study procedures and provided written consent. All experimental procedures
were approved by the Oregon Health & Science University Institutional Review Board.
Standardized measures. Verbal IQ (VIQ), performance IQ (PIQ), and full-scale IQ
(FSIQ) were estimated using the Wechsler scales tests, as described above.
The ADOS [57], a semi-structured autism diagnostic observation, was administered by an
experienced clinician to all participants. Eleven children received ADOS Module 2, and 104
children received Module 3. The ADOS was scored according to the revised algorithms [58].
The social affect calibrated severity score (ADOS SA; range: 1–10) was calculated as clinician-
reported measure of social communication difficulty. Transcripts of the ADOS were used to
derive several other measures, as described below.
Parents completed the Behavior Rating Inventory of Executive Function (BRIEF) [63] for
children 6 years of age or older, and the BRIEF-Preschool Version (BRIEF-P) [64] for children
younger than 6 years. These were then used to compute the global executive composite (GEC),
a measure of overall executive functioning.
The CELF core language score (CLS), and two CELF subscales, the expressive language
index (ELI) and the receptive language index (RLI), were used to assess structural language
abilities in children with ASD and SLI. Typically-developing children were screened for lan-
guage impairment but did not complete the CELF.
Parents completed the Children’s Communication Checklist (CCC-2) [65], a 70-item ques-
tionnaire assessing the child’s communication abilities in natural settings. The general com-
munication composite (GCC) is the sum of subscale scores from the eight CCC-2 domains
related to communication (speech, syntax, semantics, coherence, initiation, scripted language,
context, and nonverbal communication). The social-interaction deviance index (SIDI) then
uses these subscales to measure relative strengths in structural versus pragmatic language. A
negative SIDI indicates stronger relative structural language abilities while a positive score
indicates stronger pragmatic language abilities.
Finally, parents completed the Social Communication Questionnaire [59], a 40-item
assessment of symptomatology associated with ASD. The SCQ communication total score
(SCQ-CTS; range: 0–12) [66] is the sum of scores for items in the communication domain and
was also used as a parent-reported measure of communication abilities. The R package micewas used for the imputation of the SCQ data. Due to a small number of non-responses (<1%)
to SCQ items, chained equation multiple imputation [67] was used to fill in non-responses
before computing total scores.
An iterative procedure (implemented by the ldamatchR package) selected a subset of the
sample consisting of the four groups (ALI: ASD with language impairment; ALN: ASD without
Quantitative analysis of disfluency in children with ASD or SLI
PLOS ONE | https://doi.org/10.1371/journal.pone.0173936 March 15, 2017 4 / 20

language impairment; SLI; TD) according to the following constraints: 1) all four groups were
matched on chronological age 2) SLI and ALI groups were matched on VIQ and PIQ, 3) ALN
and TD groups were matched on VIQ and PIQ, and 4) ALI and ALN groups were matched on
ADOS severity score. Groups were considered to match when the P-value for tests on the
groups was�.2 for both a two-tailed Welch’s (unequal variance) t-test and an Anderson-Dar-
ling test [68].
Transcription. ADOS sessions were recorded and the child and examiner’s speech was
transcribed verbatim using Praat software. Annotators were blind to participants’ diagnostic
status and intellectual abilities. Transcriptions were generated in accordance with the Sys-
tematic Analysis of Language Transcripts (SALT) guidelines [69]. As per these guidelines,
annotators were instructed to mark mazes (i.e., disfluent intervals of speech), including
sequences of fillers and false starts, repetitions, and revisions. Annotators also segmented
ADOS transcriptions into four activities: Play (including Make-Believe Play and Joint Inter-
active Play), Description of a Picture, Telling a Story from a Book (creating a story from a
wordless picture book), and Conversation. For children who received the ADOS Module 2,
the Conversation activity is any conversation that occurred outside all other structured
activity; for children who received the ADOS Module 3, Conversation includes ADOS sec-
tions labeled Emotions, Social Difficulties and Annoyance, Friends and Marriage, and Lone-
liness, as well as any conversation that occurred outside all other structured activity. Other
sections of the ADOS were not transcribed. Within each activity, annotators segmented
conversational turns into individual utterances (or “C-units”), each consisting of (at most) a
main clause and any subordinate clauses modifying it.
Measures derived from ADOS transcripts. ADOS transcripts were used to compute
overall mean length of utterance in morphemes (MLUM) [70] using SALT software [69].
MLUM is a simple, face-valid measure of morphological and syntactic complexity recom-
mended for measuring spoken language development in children with autism [71]. ADOS
transcripts were also used to count number of utterances, fluent words (words which are not
part of a maze), and disfluent intervals for each participant.
Schema for disfluency coding. We propose a disfluency schema which simplifies the
eight disfluency types proposed in prior work [37] by grouping them into a smaller set of four
major types. In what follows we use the term disfluent interval to refer to one or more mazes,
optionally followed by a related “repair”. We use the term content maze to refer to disfluencies
which contain content words (in contrast to fillers such as uh or um). During the transcription
process, annotators indicated mazes with parentheses and any associated repairs with curly
braces. For example, in the utterance “I like going to the (pool) {park}”, the maze is (pool) and
the repair is {park}. A disfluent interval may consist of multiple types of disfluencies; for exam-
ple, in the utterance “I like going to the (pool) (um) {park}”, the disfluent interval contains a
content maze, a filler um, and a repair.
Our schema categorizes disfluencies according to a small number of broad functional
types. We distinguish four types of “repair”. In a repetition, the maze and repair are identical.
When the maze and repair are not identical, the disfluent interval is classified as a revision.
Revisions are thus disfluencies where the speech is “edited” in some fashion. Within revision,
it is possible to discern two subtypes—not analyzed separately in this study—which we call
deletion and insertion. In these disfluency types the repair can be formed strictly by deletion
of word(s) present in the maze, or insertion of word(s) not present in the maze, respectively.
False starts are content mazes which lack a corresponding repair. Fillers consist of a fixed set
of “filled pauses” such as um and discourse markers such as you know. Mazes that are less
than a single prosodic word (i.e., a “stutter”) are ignored. These types are exemplified in
Table 1.
Quantitative analysis of disfluency in children with ASD or SLI
PLOS ONE | https://doi.org/10.1371/journal.pone.0173936 March 15, 2017 5 / 20

Finally, we consider a maze to have been cued when a filler occurs between the maze and
repair portions of a repetition or revision, or when a filler occurs immediately before or after
any type of content maze, as in the revisions “(cat) (um) {dog}” or “(um) (cat) {dog}”.All complete utterances containing at least one maze (denoted by parentheses in the origi-
nal transcription) were then annotated with curly braces inserted to indicate the span of any
repair. The annotator who marked these repair intervals was an experienced transcriber who
had not participated in the initial SALT annotation efforts. The annotator was permitted to
modify disfluency boundaries when they felt the maze was incorrectly delineated by the origi-
nal transcriber, though this was rarely necessary.
A computer program (S1 and S2 Files) was then used to group mazes and repairs into dis-
fluent intervals and to categorize each disfluent interval according to the schema given in
Table 1. This program was subject to extensive unit testing to verify its correctness, and is
included as Supporting Information. Raw counts of each disfluency type were determined
automatically by this computer program and then computed for each child and activity.
This two-part process begins with manual annotations and concludes with automated cate-
gorization, though some recent work has suggested that the annotation step can be automated
with the help of natural language processing techniques [72, 73]. However, we note that both
annotation and categorization could just as well have been performed manually.
Statistical analysis
Inferential analyses were conducted to detect group differences in the use of fillers and content
mazes. In preliminary analyses, it was determined that the counts of individual disfluent
events, pooled across participants, failed to satisfy the statistical independence assumptions of
logistic regression. Therefore, inferential analyses were conducted using mixed effects logistic
regression [74] with a per-subject random intercept. The R package lme4was used for mixed
effects regressions and multcomp for the post hoc tests. The primary independent variable
was participant group (ASD, SLI, or TD). All models also included one subject-linked covari-
ate, verbal IQ. Each token was coded for ADOS activity (Play, Description of a Picture, Telling
a Story from a Book, or Conversation). To facilitate interpretation, continuous variables were
z-transformed, and sum coding was used to encode categorical variables. The likelihood ratio
test was used to test for significance of individual predictors, and the Tukey HSD test was used
to test for significant differences within factor groups [75]. Exploratory analyses were con-
ducted by measuring correlations with Kendall’s τb, a non-parametric correlation statistic.
To confirm that our results are in no way influenced by combining data from children who
completed both modules, we repeated all statistical analyses excluding data from children who
Table 1. Disfluency type schema.
Repetition—REP (y){y}z (My) {My} dog is nice.
mid-word interruption My (do-) {dog} is nice.
Revision—REV (xy){xz} (My dog) {My cat} is nice.
She (goes) {went}.
(xz){yz} (He’s very) {She’s very} friendly.
[Deletion—DEL] (xyz){xz} (My old dog) {My dog} is nice.
(xy){x} My dog (likes to) {likes} food.
[Insertion—INS] (xz){xyz} (My dog) {My yellow dog} is nice.
(y){xy} My dog likes (the) {all the} food.
False start—FS (xyz) abc (But what if) My friend likes dogs.
Filler—F discourse markers and filled pauses like, um, uh, mm, hmm, I mean, ah
https://doi.org/10.1371/journal.pone.0173936.t001
Quantitative analysis of disfluency in children with ASD or SLI
PLOS ONE | https://doi.org/10.1371/journal.pone.0173936 March 15, 2017 6 / 20

completed the Module 2 and obtained the same main effects as with the combined data. As a
result, we report the full analyses with both modules.
Results
The matching procedure retained 97 of the 115 children (ASD: 47, SLI: 18, TD: 32). Summary
statistics for the resulting age-matched sample are reported in Table 2.
Table 3 shows counts of each disfluency type for each group.
The first goal of this study was to develop and evaluate an automated system of disfluency
detection. To evaluate the manual coding done on the original utterances, we examined inter-
annotator agreement. This was assessed by drawing a stratified random sample (consisting of
four disfluent utterances from each child) which was then coded by a second annotator using
the same guidelines. If there was more than one maze in an utterance, only the first was used
to test agreement. Two forms of agreement were measured: agreement on identification of
repair spans, and agreement on disfluency types assigned to each maze. Both annotators
marked the same repair span in 90% of the cases. Whether or not both annotators marked the
same repair span, the computer program assigned the same disfluency type for the disfluent
interval in 91% of the cases. Cohen’s kappa (κ) for computer-annotator agreement in dis-
fluency types was.904, corresponding to “almost perfect” agreement according to the Landis
and Koch [76] qualitative guidelines.
Table 2. Group summary statistics.
ASD (n = 47) SLI (n = 18) TD (n = 32)
mean (s.d.) mean (s.d.) mean (s.d.) PHSD < .05
CA 6.7 (1.1) 7.1 (1.0) 6.8 (1.0) (none)
FSIQ 98.0 (15.8) 88.7 (8.0) 117.7 (11.3) SLI < ASD < TD
VIQ 94.8 (17.8) 86.1 (6.1) 116.9 (12.9) SLI = ASD < TD
PIQ 108.6 (17.8) 101.7 (12.3) 117.6 (13.2) SLI = ASD < TD
GEC 68.7 (8.8) 65.8 (13.0) 44.6 (8.1) TD < SLI = ASD
CLS 88.9 (21.8) 73.9 (8.2) n.a. (n.a.) SLI < ASD
MLUM 4.2 (1.0) 4.1 (1.0) 5.1 (1.0) SLI = ASD < TD
GCC 50.9 (11.0) 48.2 (12.4) 95.7 (12.9) SLI = ASD < TD
SCQ 19.7 (4.9) 11.2 (6.5) 2.7 (2.2) TD < SLI < ASD
ADOS 7.6 (1.9) 2.9 (2.7) 1.2 (0.5) TD < SLI < ASD
Mean and standard deviation for each group, and post hoc group contrasts which are significant at α = .05. CA = chronological age in years; FSIQ = full-
scale IQ; VIQ = verbal IQ; PIQ = performance IQ; GEC = BRIEF global executive composite; CLS = CELF core language score (not available for TD);
MLUM = mean length of utterance in morphemes; GCC = CCC-2 general communication composite; SCQ = SCQ total score; ADOS = ADOS-G calibrated
severity score.
https://doi.org/10.1371/journal.pone.0173936.t002
Table 3. Number of disfluencies by type and group.
ASD (n = 47) SLI (n = 18) TD (n = 32)
False start 1,180 410 754
Filler 1,269 588 1,867
Revision 695 202 503
Repetition 1,315 352 659
Total 4,459 1,552 3,783
https://doi.org/10.1371/journal.pone.0173936.t003
Quantitative analysis of disfluency in children with ASD or SLI
PLOS ONE | https://doi.org/10.1371/journal.pone.0173936 March 15, 2017 7 / 20
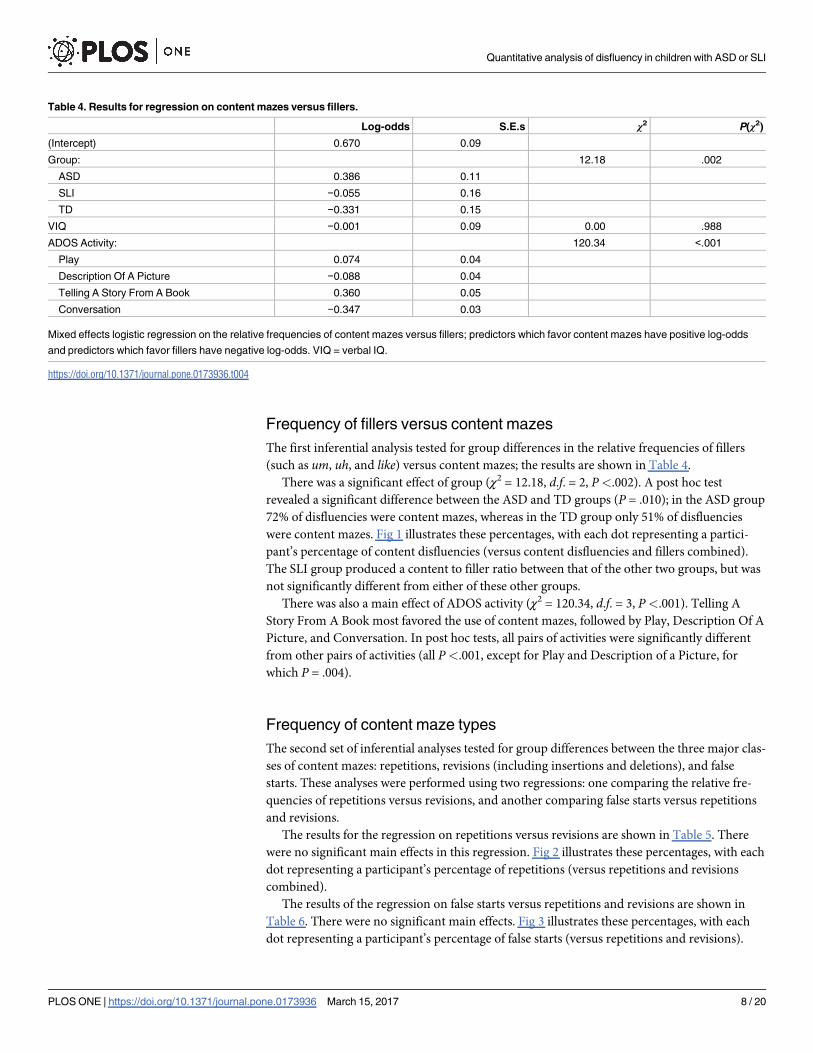
Frequency of fillers versus content mazes
The first inferential analysis tested for group differences in the relative frequencies of fillers
(such as um, uh, and like) versus content mazes; the results are shown in Table 4.
There was a significant effect of group (χ2 = 12.18, d.f. = 2, P<.002). A post hoc test
revealed a significant difference between the ASD and TD groups (P = .010); in the ASD group
72% of disfluencies were content mazes, whereas in the TD group only 51% of disfluencies
were content mazes. Fig 1 illustrates these percentages, with each dot representing a partici-
pant’s percentage of content disfluencies (versus content disfluencies and fillers combined).
The SLI group produced a content to filler ratio between that of the other two groups, but was
not significantly different from either of these other groups.
There was also a main effect of ADOS activity (χ2 = 120.34, d.f. = 3, P<.001). Telling A
Story From A Book most favored the use of content mazes, followed by Play, Description Of A
Picture, and Conversation. In post hoc tests, all pairs of activities were significantly different
from other pairs of activities (all P<.001, except for Play and Description of a Picture, for
which P = .004).
Frequency of content maze types
The second set of inferential analyses tested for group differences between the three major clas-
ses of content mazes: repetitions, revisions (including insertions and deletions), and false
starts. These analyses were performed using two regressions: one comparing the relative fre-
quencies of repetitions versus revisions, and another comparing false starts versus repetitions
and revisions.
The results for the regression on repetitions versus revisions are shown in Table 5. There
were no significant main effects in this regression. Fig 2 illustrates these percentages, with each
dot representing a participant’s percentage of repetitions (versus repetitions and revisions
combined).
The results of the regression on false starts versus repetitions and revisions are shown in
Table 6. There were no significant main effects. Fig 3 illustrates these percentages, with each
dot representing a participant’s percentage of false starts (versus repetitions and revisions).
Table 4. Results for regression on content mazes versus fillers.
Log-odds S.E.s χ2 P(χ2)
(Intercept) 0.670 0.09
Group: 12.18 .002
ASD 0.386 0.11
SLI −0.055 0.16
TD −0.331 0.15
VIQ −0.001 0.09 0.00 .988
ADOS Activity: 120.34 <.001
Play 0.074 0.04
Description Of A Picture −0.088 0.04
Telling A Story From A Book 0.360 0.05
Conversation −0.347 0.03
Mixed effects logistic regression on the relative frequencies of content mazes versus fillers; predictors which favor content mazes have positive log-odds
and predictors which favor fillers have negative log-odds. VIQ = verbal IQ.
https://doi.org/10.1371/journal.pone.0173936.t004
Quantitative analysis of disfluency in children with ASD or SLI
PLOS ONE | https://doi.org/10.1371/journal.pone.0173936 March 15, 2017 8 / 20

Use of fillers as cues
The final inferential analysis tested for group differences in the cueing of content mazes (as
defined above); the results are shown in Table 7.
There was a main effect of group (χ2 = 7.22, d.f. = 2, P = .027). Post hoc tests revealed a mar-
ginal difference between the ASD and TD groups (P = .085); 29% of content mazes were cued
Fig 1. Percent of mazes which are content mazes (versus fillers).
https://doi.org/10.1371/journal.pone.0173936.g001
Table 5. Results for regression on repetitions versus revisions.
Log-odds S.E.s χ2 P(χ2)
(Intercept) 0.380 0.07
Group: 1.442 .486
ASD 0.090 0.08
SLI 0.007 0.12
TD −0.097 0.11
VIQ −0.075 0.06 1.49 .222
ADOS Activity: 2.45 .493
Play 0.023 0.06
Description Of A Picture 0.025 0.07
Telling A Story From A Book −0.108 0.08
Conversation 0.060 0.06
Mixed effects logistic regression on the relative frequencies of repetitions versus revisions; predictors which
favor repetitions have positive log-odds and predictors which favor revisions have negative log-odds.
VIQ = verbal IQ.
https://doi.org/10.1371/journal.pone.0173936.t005
Quantitative analysis of disfluency in children with ASD or SLI
PLOS ONE | https://doi.org/10.1371/journal.pone.0173936 March 15, 2017 9 / 20

in the ASD group whereas 41% were cued in the TD group. The SLI group produced cued con-
tent mazes at a rate between that of the other two groups, but was not significantly different
from either of these other groups. Fig 4 illustrates these percentages, with each dot represent-
ing a participant’s percentage of cued content mazes (versus uncued content mazes).
Fig 2. Percent of content mazes which are repetitions (versus revisions).
https://doi.org/10.1371/journal.pone.0173936.g002
Table 6. Results for regression on false starts versus repetitions and revisions.
Log-odds S.E.s χ2 P(χ2)
(Intercept) −0.188 0.05
Group: 2.27 .322
ASD 0.000 0.06
SLI 0.117 0.09
TD −0.118 0.08
VIQ 0.115 0.04 6.63 .010
ADOS Activity: 7.91 .049
Play −0.078 0.05
Description Of A Picture 0.112 0.05
Telling A Story From A Book −0.067 0.06
Conversation 0.033 0.04
Mixed effects logistic regression on the relative frequencies of the use of false starts versus repetitions and
revisions; predictors which favor false starts have positive log-odds and predictors which favor repetitions or
revisions have negative log-odds. VIQ = verbal IQ.
https://doi.org/10.1371/journal.pone.0173936.t006
Quantitative analysis of disfluency in children with ASD or SLI
PLOS ONE | https://doi.org/10.1371/journal.pone.0173936 March 15, 2017 10 / 20

There was also a main effect of activity (χ2 = 45.65; d.f. = 3; P<.001). In post hoc tests, Con-
versation favored cued content mazes more than Play and Telling A Story From A Book (both
P<.001); Picture Description also favored cued mazes significantly more than did Telling a
Story From a Book (P = .008).
Exploratory analysis
Exploratory analyses were conducted to investigate whether the two dependent variables corre-
lated with group might also be modulated by within-group heterogeneity. Within-group inde-
pendent variables included measures of age, intellectual ability, executive function, structural
and pragmatic language, and social communication. Within each group, and for each depen-
dent and independent variable, the Kendall τb coefficient was computed and the resulting P-
values adjusted so as to control for within-group false discovery rate [77]. Many of these tests
are complementary—i.e., several pairs of independent variables are highly correlated and mea-
sure closely-related constructs—and the resulting statistical tests are very likely underpowered
(particularly in the SLI group), so the resulting P-values should be interpreted with caution.
The first exploratory analysis targeted content maze versus filler use. As shown in Table 8,
no within-group effect reached significance.
The second regression targeted cued versus non-cued content mazes; the results are shown
in Table 9. Three tests were significant after correcting for false discovery rate. Within the
ASD group, verbal IQ and the CELF core language score, expressive language index, and
receptive language index were positively correlated with cueing of content mazes. Within the
TD group, chronological age was positively correlated with cueing of content mazes.
Fig 3. Percent of content mazes which are false starts (versus repetitions and revisions).
https://doi.org/10.1371/journal.pone.0173936.g003
Quantitative analysis of disfluency in children with ASD or SLI
PLOS ONE | https://doi.org/10.1371/journal.pone.0173936 March 15, 2017 11 / 20

Discussion
In this paper we first proposed a simple schema for categorizing speech disfluencies by type.
Compared to the methods of prior studies of disfluency in autistic populations, this schema is
more thoroughly specified and exemplified, but also far less complicated than the most
Table 7. Results for regression on cued versus non-cued content mazes.
Log-odds S.E.s χ2 P(χ2)
(Intercept) −0.852
Group: 7.22 .027
ASD −0.194 0.07
SLI 0.032 0.10
TD 0.162 0.10
VIQ 0.062 0.06 1.24 .265
ADOS Activity: 45.65 <.001
Play −0.071 0.04
Description Of A Picture 0.061 0.03
Telling A Story From A Book −0.164 0.04
Conversation 0.174 0.03
Mixed effects logistic regression on relative frequencies of the use of cued versus non-cued content mazes; predictors which favor cued content mazes
have positive log-odds and predictors which favor non-cued content mazes have negative log-odds. VIQ = Verbal IQ.
https://doi.org/10.1371/journal.pone.0173936.t007
Fig 4. Percent of content mazes which are cued by a filler (versus content mazes which are not cued).
https://doi.org/10.1371/journal.pone.0173936.g004
Quantitative analysis of disfluency in children with ASD or SLI
PLOS ONE | https://doi.org/10.1371/journal.pone.0173936 March 15, 2017 12 / 20

expressive schemata [37]. This system can be applied automatically or manually, and allows us
to achieve excellent inter-annotator agreement.
We note that while this schema for disfluency coding was developed specifically for this
study, it was completed before any inferential analyses were performed, yet we find substantial
group differences largely consistent with prior work. This suggests that it has potential utility
in the study of disfluency more generally. For instance, it might be used in research on auto-
mating maze detection [72, 73, 78] for computer-aided language sample analysis.
We used this schema for coding disfluency type in a large corpus consisting of speech from
children with autism, specific language impairment, and typical development. We found that,
on average, the ASD group strongly favored content mazes over fillers, whereas the TD group
produced roughly the same number of content mazes and fillers. This result is largely consis-
tent with a prior study of adults with ASD [32] reporting that adults with ASD produced fewer
fillers and more disfluent repetitions than TD peers. However, in contrast to prior studies [32,
38] we found no group differences in the usage frequency of the three types of content mazes.
We also found a group difference in the use of filler “cues” to content mazes. To understand
a disfluent utterance like “I like going to the (pool) {park}”, listeners must mentally excise the
maze (pool) and replace it with the repair {park}. One study argues that “cues” to disfluent
speech—defined as fillers, explicit editing terms, or long pauses—may aid listeners in this
process [79], and found that speakers are better able to identify speech as disfluent when
the disfluent interval is cued. In this study, we found that filler cues to content mazes were
Table 8. Results for exploratory analysis of content versus non-content mazes.
ASD SLI TD
CA .02 .10 −.31
FSIQ −.05 .17 .15
VIQ −.08 −.15 .11
PIQ .00 .17 .18
GEC .02 .17 .03
CELF
CLS −.13 −.06 n.a.
ELI −.14 −.01 n.a.
RLI −.13 .13 n.a.
MLUM .11 .23 −.04
CCC-2
GCC −.04 −.10 −.04
SIDI −.02 −.12 −.24
SCQ COM .10 .40 −.13
ADOS SA CSS −.19 .02 .01
Associations between per-child content mazes (versus filler) use and age, intellectual ability, executive
function, language, and social ability, as measured by Kendall’s τb. Children in the TD group did not
complete the CELF. CA = chronological age in years; FSIQ = full-scale IQ; VIQ = verbal IQ;
PIQ = performance IQ; GEC = BRIEF global executive composite; CLS = CELF core language score;
ELI = CELF expressive language index; RLI = CELF receptive language index; MLUM = mean length of
utterance in morphemes; GCC = CCC-2 general communication composite; SIDI = CCC-2 social-interaction
deviance index; SCQ COM = SCQ communication total score [66]; ADOS SA CSS = ADOS-G social affect
calibrated severity score; there were no statistically significant differences at P = .05 after correction for false
discovery rate [77].
https://doi.org/10.1371/journal.pone.0173936.t008
Quantitative analysis of disfluency in children with ASD or SLI
PLOS ONE | https://doi.org/10.1371/journal.pone.0173936 March 15, 2017 13 / 20

significantly less common in the ASD group than the TD group. As the absence of these cues
may make it more difficult to be understood, we hypothesize that this may contribute to the
conversational reciprocity difficulties associated with ASD.
However, it is also possible that this effect is caused by group differences in other social-cog-
nitive abilities. For example, executive functioning difficulties are associated with higher rates
of disfluency in typical adolescents and adults [80], suggesting that disfluencies reflect difficul-
ties in planning and delivering speech [27]. Under the hypothesis that filler cues are intended
to help facilitate understanding, the additional planning required to produce a filler cue may
be more difficult for children with ASD, as executive functioning difficulties are more com-
mon in individuals with ASD [81]. Another possibility is that general developmental maturity
is a factor, given the significant positive correlation between content maze cueing and chrono-
logical age.
We used a group of children with specific language impairment as a comparison group to
help isolate the effects of structural language deficits, characteristic of children with SLI though
also common in children with ASD, from pragmatic language deficits, characteristic of chil-
dren with ASD. While we found significant group effects for two variables (the relative fre-
quency of fillers vs. content mazes, and the use of filler cues with content mazes), the SLI
group fell between the ASD and TD groups for both variables, and post-hoc contrasts were
non-significant. Thus despite our care, our findings concerning the relative role of structural
vs. pragmatic language abilities are somewhat inconclusive.
We hypothesized that different ADOS activities might influence disfluency use, and in this
study ADOS activity emerged as one of the most robust predictors of disfluency use, further
Table 9. Results for exploratory analysis of cued (versus non-cued) content mazes.
ASD SLI TD
CA .06 .11 .47*
FSIQ .22 −.12 −.10
VIQ .28* .28 −.08
PIQ .07 −.17 −.05
GEC .09 −.13 .01
CELF
CLS .33* .01 n.a.
ELI .34* −.07 n.a.
RLI .28* .07 n.a.
MLUM .10 −.04 .21
CCC-2
GCC .02 .11 −.01
SIDI −.16 .05 .26
SCQ COM −.06 −.27 .11
ADOS SA CSS .04 −.08 −.20
Associations between per-child cued (versus non-cued) content maze use and age, intellectual ability,
executive function, language, and social ability, as measured by Kendall’s τb. Children in the TD group did
not complete the CELF. CA = chronological age in years; FSIQ = full-scale IQ; VIQ = verbal IQ;
PIQ = performance IQ; GEC = BRIEF global executive composite; CLS = CELF core language score;
ELI = CELF expressive language index; RLI = CELF receptive language index; MLUM = mean length of
utterance in morphemes; GCC = CCC-2 general communication composite; SIDI = CCC-2 social-interaction
deviance index; SCQ COM = SCQ; ADOS SA CSS = ADOS-G social affect calibrated severity score; * =
statistically significant at P = .05 after correction for false discovery rate [77].
https://doi.org/10.1371/journal.pone.0173936.t009
Quantitative analysis of disfluency in children with ASD or SLI
PLOS ONE | https://doi.org/10.1371/journal.pone.0173936 March 15, 2017 14 / 20

highlighting the importance of controlling for topic in quantitative studies of pragmatic lan-
guage. Across diagnostic groups, the ADOS activity “Telling A Story From A Book” accounted
for the highest rate of content mazes while the ADOS activity “Conversation” accounted for
the highest rate of cued content mazes.
An anonymous reviewer asks whether the disfluencies studied here might be related to
apraxia. This issue is addressed directly in a recent study [82] which measured a number of
features of speech, prosody, and voice quality using spontaneous speech samples from chil-
dren with ASD, childhood apraxia of speech (CAS), speech delay, or typical development;
inclusion criteria for the ASD and TD groups, as well as elicitation procedures, were quite
similar to the current study. The authors found only one feature, “Increased Repetitions and
Revisions”, for which the ASD and CAS groups were not significantly dissimilar. While the
current study also finds elevated rates of content mazes—of which repetitions and revisions
are the most common types—in children with ASD, we are reluctant to interpret our find-
ings as support for the hypothesis that apraxia is a causal factor in atypical speech in children
with ASD.
This study had several limitations. First, participants were drawn from a relatively wide age
range (4–8). Though chronological age was included as a covariate in regression analyses,
developmental differences may have obscured important group differences. Secondly, the
majority of the participants were male. Consequently, we lacked statistical power to investigate
gender differences. Furthermore, we did not investigate the role of socioeconomic status,
though it may play a role in expressive language abilities [83, 84] including use of disfluency
[85, 86]. Another limitation is that the diagnostic groups were defined using strict cutoffs for
specific language impairment and ASD; different cutoffs might produce different results. All
participants were high-functioning, limiting the generalizability of these results to the larger
population of individuals with ASD. Finally, disfluency was coded using a set of formal but rel-
atively coarse categorical types; a more granular classification of disfluencies applied to an
even larger sample might produce different results.
The current study was limited to disfluency as it is expressed in English. However, the gen-
eral patterns documented here are not necessarily limited to children acquiring English;
indeed, content mazes and fillers appear to be a linguistic universal [87]. Thus, it is possible
that similar patterns will be found in children acquiring other languages. We leave this as a
topic for future research.
Our analyses uncovered substantial differences in disfluency use between children with and
without ASD. Given that social-communicative deficits are a defining feature of ASD, these
differences provide convergent evidence for the listener-oriented function of disfluencies in
the speech of typical individuals [27, 88, 89]. Furthermore, if group differences in use of cued
mazes are replicated, then this, along with other subtle aspects of pragmatic language, may be a
useful target for intervention in individuals with ASD who are verbal and high-functioning.
Conclusions
This study investigated disfluent speech in autism, using groups with specific language
impairment and typical development as controls so as to provide a concrete quantitative char-
acterization of a clinical impression. We proposed a simple schema for coding disfluency type,
applicable to studies of disfluency more generally, and using this schema, we found that chil-
dren with ASD have different patterns of disfluency than peers with SLI or typical develop-
ment, including a higher rate of content maze use and a lower rate of filler use. The patterns of
disfluency investigated here are easily quantified features of pragmatic language that may dif-
ferentiate ASD and SLI, a challenging differential diagnosis [90–92]. We recommend that
Quantitative analysis of disfluency in children with ASD or SLI
PLOS ONE | https://doi.org/10.1371/journal.pone.0173936 March 15, 2017 15 / 20

future studies quantify disfluency patterns in longitudinal studies of the same populations,
similar to a recent longitudinal study of disfluency in typically developing children [93].
Supporting information
S1 File. Python library for computing a minimum-edit distance alignment between two
strings.
(PY)
S2 File. Python library for coding mazes according to the disfluency schema.
(PY)
Acknowledgments
We thank Mabel Rice for helpful discussion on criteria for classifying specific language
impairment, Lauren Kenworthy for assistance with measures of executive function, and Mike
Lasarev for advice on statistical measures. Thanks also to Julianne Myers for helpful comments
and assistance in data curation.
Author Contributions
Conceptualization: HM KG JvS.
Data curation: HM KG RI APH KP GK.
Formal analysis: HM KG.
Funding acquisition: JvS.
Investigation: HM RI.
Methodology: HM KG.
Project administration: HM.
Resources: KG RI APH KP GK.
Software: KG RI GK.
Supervision: HM KG JvS.
Validation: KG RI GK.
Visualization: HM KG APH KP.
Writing – original draft: HM KG.
Writing – review & editing: HM KG KP APH.
References1. American Psychiatric Association. Diagnostic and statistical manual of mental disorders: DSM-V.
Washington, D.C.: American Psychiatric Association; 2013.
2. Tager-Flusberg H, Joseph RM. Identifying neurocognitive phenotypes in autism. Philos Trans R Soc
Lond B Biol Sci. 2003; 358(1430): 303–314. https://doi.org/10.1098/rstb.2002.1198 PMID: 12639328
3. Whitehouse AJO, Barry JG, Bishop DVM. The broader language phenotype of autism: A comparison
with specific language impairment. J Child Psychol Psychiatry. 2008; 48(8): 822–830. https://doi.org/10.
1111/j.1469-7610.2007.01765.x
Quantitative analysis of disfluency in children with ASD or SLI
PLOS ONE | https://doi.org/10.1371/journal.pone.0173936 March 15, 2017 16 / 20

4. Leyfer OT, Tager-Flusberg H, Dowd M, Tomblin JB, Folstein SE. Overlap between autism and specific
language impairment: Comparison of Autism Diagnostic Interview and Autism Diagnostic Observation
Schedule scores. Autism Res. 2008; 1(5): 284–296. https://doi.org/10.1002/aur.43 PMID: 19360680
5. Loucas T, Charman T, Pickles A, Simonoff E, Chandler S, Meldrum D, et al. Autistic symptomatology
and language ability in autism spectrum disorder and specific language impairment. J Child Psychol
Psychiatry. 2008; 49(11): 1184–1192. https://doi.org/10.1111/j.1469-7610.2008.01951.x PMID:
19017030
6. Geurts HM, Embrechts M. Language profiles in ASD, SLI, and ADHD. J Autism Dev Disord. 2008; 38
(10): 1931–1943. https://doi.org/10.1007/s10803-008-0587-1 PMID: 18521730
7. Boucher J. Research review: Structural language in autistic spectrum disorder—characteristics and
causes. J Child Psychol Psychiatry. 2012; 53(3): 219–233. https://doi.org/10.1111/j.1469-7610.2011.
02508.x PMID: 22188468
8. Kim SH, Paul R, Tager-Flusberg H, Lord C. In: Volkmar F, Rogers S, Paul R, Pelphrey KA, editors.
Handbook of autism and pervasive developmental disorders. 4th ed. Hoboken: John Wiley and Sons;
(2014). pp. 230–262.
9. Klin A, McPartland J, Volkmar F. Asperger syndrome. In: Volkmar F, Paul R, Klin A, Cohen D, editors.
Handbook of autism and pervasive developmental disorders. Hoboken, NJ: Wiley. pp. 88–125.
10. Landa R. Social language use in Asperger syndrome and high-functioning autism. In: Klin A, Volkmar F,
Sparrow S, editors. Asperger Syndrome. New York: Guilford Press; (2000). pp. 125–155.
11. Lord C, Paul R. Language and communication in autism. In: Volkmar F, Cohen D, editors. Handbook of
autism and pervasive developmental disorders. 2nd ed. New York: John Wiley and Sons; (1997). pp.
195–225.
12. Tager-Flusberg H, Paul R, Lord C. Language and communication in autism. In: Volkmar F, Paul R, Klin
A, Cohen D, editors. Handbook of autism and pervasive developmental disorders, diagnosis, develop-
ment, neurobiology, and behavior. 3rd ed. Hoboken: John Wiley and Sons; (2005). pp. 335–364.
13. Volden J, Coolican J, Garon N, White J, Bryson S. Pragmatic language in autism spectrum disorder:
Relationships to measures of ability and disability. J Autism Dev Disord. 2009; 39(2): 388–393. https://
doi.org/10.1007/s10803-008-0618-y PMID: 18626760
14. Carter Young E, Diehl JJ. The use of two language tests to identify pragmatic language problems in chil-
dren with autism spectrum disorders. Lang Speech Hear Serv Sch. 2005; 36(1): 62–72. https://doi.org/
10.1044/0161-1461(2005/006)
15. Loukusa S, Leinonen E, Kuusikko S, Jussila K, Mattila ML, Ryder N, et al. Use of context in pragmatic
language comprehension by children with Asperger syndrome or high-functioning autism. J Autism Dev
Disord. 2007; 37(6): 1049–1059. https://doi.org/10.1007/s10803-006-0247-2 PMID: 17072751
16. Philofsky A, Fidler DJ, Hepburn S. Pragmatic language profiles of school-age children with autism spec-
trum disorders and Williams syndrome. Am J Speech Lang Pathol. 2007; 16(4): 368–380. https://doi.
org/10.1044/1058-0360(2007/040) PMID: 17971496
17. Sharp HM, Hillenbrand K. Speech and language development and disorders in children. Pediatr Clin
North Am. 2008; 55(5): 1159–1173. https://doi.org/10.1016/j.pcl.2008.07.007 PMID: 18929058
18. Tager-Flusberg H. Brief report: Current theory and research on language and communication in autism.
J Autism Dev Disord. 1996; 26(2): 169–172. https://doi.org/10.1007/BF02172006 PMID: 8744479
19. Russell RL, Grizzle KL. Assessing child and adolescent pragmatic language competencies: Toward evi-
dence-based assessments. Clin Child Fam Psychol Rev. 2008; 11(1–2): 59–73. https://doi.org/10.
1007/s10567-008-0032-1 PMID: 18386177
20. Volden J, Phillips L. Measuring pragmatic language in speakers with autism spectrum disorders: Com-
paring the Children’s Communication Checklist-2 and the Test of Pragmatic Language. Am J Speech
Lang Pathol. 2010; 19(3): 204–212. https://doi.org/10.1044/1058-0360(2010/09-0011) PMID:
20220047
21. Adams C, Green J, Gilchrist A, Cox A. Conversational behaviour of children with Asperger syndrome
and conduct disorder. J Child Psychol Psychiatry. 2002; 43(5): 679–690. https://doi.org/10.1111/1469-
7610.00056 PMID: 12120863
22. Capps L, Kehres J, Sigman M. Conversational abilities among children with autism and children with
developmental delays. Autism. 1998; 2(4), 325–344. https://doi.org/10.1177/1362361398024002
23. Botting N, Conti-Ramsden G. Autism, primary pragmatic difficulties, and specific language impairment:
Can we distinguish them using psycholinguistic markers? Dev Med Child Neurol. 2003; 45(8): 515–524.
https://doi.org/10.1111/j.1469-8749.2003.tb00951.x PMID: 12882530
24. Losh M, Capps L. Narrative ability in high-functioning children with autism or Asperger’s syndrome. J
Autism Dev Disord. 2003; 33(3): 239–251. https://doi.org/10.1023/A:1024446215446 PMID: 12908827
Quantitative analysis of disfluency in children with ASD or SLI
PLOS ONE | https://doi.org/10.1371/journal.pone.0173936 March 15, 2017 17 / 20

25. Paul R, Orlovski SM, Marcinko HC, Volkmar F. Conversational behaviors in youth with high-functioning
ASD and Asperger syndrome. J Autism Dev Disord. 2009; 39(1): 115–125. https://doi.org/10.1007/
s10803-008-0607-1 PMID: 18607708
26. Klin A, Saulnier CA, Sparrow SS, Cicchetti DV, Volkmar FR, Lord C. Social and communication abilities
and disabilities in higher functioning individuals with autism spectrum disorders: The Vineland and the
ADOS. J Autism Dev Disord. 2007; 37(4): 748–759. https://doi.org/10.1007/s10803-006-0229-4 PMID:
17146708
27. Clark HH. Managing problems in speaking. Speech Commun. 1994; 15(3): 243–250. https://doi.org/10.
1016/0167-6393(94)90075-2
28. Clark HH. Speaking in time. Speech Commun. 2002; 36(1): 5–13. https://doi.org/10.1016/S0167-6393
(01)00022-X
29. Smith VL, Clark HH. On the course of answering questions. J Mem Lang. 1993; 32(1): 25–38. https://
doi.org/10.1006/jmla.1993.1002
30. Arnold JE, Fagnano M, Tanenhaus MK. Disfluencies signal theee, um, new information. J Psycholin-
guist Res. 2003; 32(1): 25–36. https://doi.org/10.1023/A:1021980931292 PMID: 12647561
31. Kidd C, White KS, Aslin RN. Toddlers use speech disfluencies to predict speakers’ referential inten-
tions. Dev Sci. 2011; 14(4): 925–934. https://doi.org/10.1111/j.1467-7687.2011.01049.x PMID:
21676111
32. Lake JK, Humphreys KR, Cardy S. Listener vs. speaker-oriented aspects of speech: Studying the dis-
fluencies of individuals with autism spectrum disorders. Psychon Bull Rev. 2011; 18(1): 135–140.
https://doi.org/10.3758/s13423-010-0037-x PMID: 21327345
33. Scaler Scott K, Tetnowski JA, Flaitz JR, Yaruss JS. Preliminary study of disfluency in school-aged chil-
dren with autism. Int J Lang Commun Disord. 2014; 49(1): 75–89. https://doi.org/10.1111/1460-6984.
12048 PMID: 24372887
34. Shriberg LD. Speech and prosody characteristics of adolescents and adults with high-functioning
autism and Asperger syndrome. J Speech Lang Hear Res. 2001; 44(5): 1097–1115. https://doi.org/10.
1044/1092-4388(2001/087) PMID: 11708530
35. Guo LY, Tomblin JB, Samelson V. Speech disruptions in the narratives of English-speaking children
with specific language impairment. J Speech Lang Hear Res. 2008; 51(3): 722. https://doi.org/10.1044/
1092-4388(2008/051) PMID: 18506046
36. Bortfeld H, Leon SD, Bloom JE, Schober MF, Brennan SE. Disfluency rates in conversation: Effects of
age, relationship, topic, role, and gender. Lang Speech. 2001; 44(2): 123–147. https://doi.org/10.1177/
00238309010440020101 PMID: 11575901
37. Shriberg EE. Preliminaries to a theory of speech disfluencies. Ph.D. Thesis, University of California,
Berkeley. 1994.
38. Suh J, Eigsti IM, Naigles L, Barton M, Kelley E, Fein D. Narrative performance of optimal outcome chil-
dren and adolescents with a history of an autism spectrum disorder (ASD). J Autism Dev Disord. 2014;
44(7): 1681–1694. https://doi.org/10.1007/s10803-014-2042-9 PMID: 24500659
39. Heeman PA, Lunsford R, Selfridge E, Black L, van Santen J. Autism and interactional aspects of dia-
logue. Proceedings of the 11th Annual Meeting of the Special Interest Group on Discourse and Dia-
logue. 2010: 249–252.
40. Thurber C, Tager-Flusberg H. Pauses in the narratives produced by autistic, mentally retarded, and nor-
mal children as an index of cognitive demand. J Autism Dev Disord. 1993; 23(2): 309–322. https://doi.
org/10.1007/BF01046222 PMID: 8331049
41. Gorman K, Olson L, Hill AP, Lunsford R, Heeman PA, van Santen J. Uh and um in children with autism
spectrum disorders or language impairment. Autism Res. 2016; 9(8): 854–865. https://doi.org/10.1002/
aur.1578 PMID: 26800246
42. Irvine CA, Eigsti IM, Fein DA. Uh, um, and autism: Filler disfluencies as pragmatic markers in adoles-
cents with optimal outcomes from autism spectrum disorder. J Autism Dev Disord. 2015; 46(3): 1061–
1070. https://doi.org/10.1007/s10803-015-2651-y
43. MacLurg A. Mapping mazes: Developing a taxonomy to investigate mazes in children’s stories. M.Sc.
Thesis, University of Alberta. 2014.
44. Tomblin B. Co-morbidity of autism and SLI: Kinds, kin and complexity. Int J Lang Commun Disord.
2011; 46(2): 127–137. https://doi.org/10.1111/j.1460-6984.2011.00017.x PMID: 21401812
45. Shulman C, Guberman G. Acquisition of verb meaning through syntactic cues: A comparison of children
with autism, children with specific language impairment (SLI) and children with typical language devel-
opment (TLD). J Child Lang. 2007; 34(2): 411–423. https://doi.org/10.1017/S0305000906007963
PMID: 17542163
Quantitative analysis of disfluency in children with ASD or SLI
PLOS ONE | https://doi.org/10.1371/journal.pone.0173936 March 15, 2017 18 / 20

46. Reilly S, Bishop DVM, Tomblin B. Terminological debate over language impairment in children: Forward
movement and sticking points. Int J Lang Comm Disord. 2014; 49(4): 452–462. https://doi.org/10.1111/
1460-6984.12111
47. Bishop DVM, Snowling MJ, Thompson PA, Greenhalgh T, CATALISE consortium. CATALISE: A Multi-
national and Multidisciplinary Delphi Consensus Study. Identifying Language Impairments in Children.
PLoS ONE. 2016; 11(7): e0158753. https://doi.org/10.1371/journal.pone.0158753 PMID: 27392128
48. Thordardottir ET, Weismer SE. Content mazes and filled pauses in narrative language samples of chil-
dren with specific language impairment. Brain Cogn. 2001; 48(2–3): 587–592.
49. Bishop DVM. Pragmatic language impairment: A correlate of SLI, a distinct subgroup, or part of the
autism continuum? In: Bishop DVM, Leonard LB, editors. Speech and language impairments in chil-
dren: Causes, characteristics, intervention and outcome. Philadelphia: Psychology Press. pp. 99–113.
50. Ellis Weismer S. Developmental language disorders: Challenges and implications of cross-group com-
parisons. Folia Phoniatr Logop. 2013; 65(2): 68–77. https://doi.org/10.1159/000353896 PMID:
23942044
51. Kjelgaard MM, Tager-Flusberg H. An investigation of language impairment in autism: Implications for
genetic subgroups. Lang Cogn Process. 2001; 16(2–3):287–308. https://doi.org/10.1080/
01690960042000058 PMID: 16703115
52. Wechsler D. Wechsler preschool and primary scale of intelligence. 3rd ed. San Antonio: Psychological
Corporation; 2002.
53. Wechsler D. The Wechsler intelligence scale for children. 4th ed. San Antonio: Psychological Corpora-
tion; 2003.
54. Klin A, Lang J, Cicchetti DV, Volkmar FR. Brief report: Interrater reliability of clinical diagnosis and
DSM-IV criteria for autistic disorder: Results of the DSM-IV autism field trial. J Autism Dev Disord. 2000;
30(2): 163–167. https://doi.org/10.1023/A:1005415823867 PMID: 10832781
55. Spitzer RL, Siegel B. The DSM-III-R field trial of pervasive developmental disorders. J Am Acad Child
Adolesc Psychiatry. 1990; 29(6): 855–862. https://doi.org/10.1097/00004583-199011000-00003 PMID:
2273011
56. American Psychiatric Association. Diagnostic and statistical manual of mental disorders: DSM-IV-TR.
Washington, D.C.: American Psychiatric Association; 2000.
57. Lord C, Risi S, Lambrecht L, Cook EH Jr, Leventhal BL, DiLavore PC, et al. The Autism Diagnostic
Observation Schedule, Generic: A standard measure of social and communication deficits associated
with the spectrum of autism. J Autism Dev Disord. 2000; 30(3): 205–223. https://doi.org/10.1023/
A:1005592401947 PMID: 11055457
58. Gotham K, Risi S, Pickles A, Lord C. The Autism Diagnostic Observation Schedule: Revised algorithms
for improved diagnostic validity. J Autism Dev Disord. 2007; 37(4): 613–627. https://doi.org/10.1007/
s10803-006-0280-1 PMID: 17180459
59. Rutter M, Bailey A, Lord C. Social communication questionnaire (SCQ). Los Angeles: Western Psy-
chological Services; 2003.
60. Lee LC, David AB, Rusyniak J, Landa R, Newschaffer CJ. Performance of the Social Communication
Questionnaire in children receiving preschool special education services. Res Autism Spectr Disord.
2007; 1(2): 126–138. https://doi.org/10.1016/j.rasd.2006.08.004
61. Semel EM, Wiig EH, Secord W. Clinical evaluation of language fundamentals, preschool. 2nd ed. San
Antonio: Pearson, Psychological Corporation; 2004.
62. Semel EM, Wiig EH, Secord W. Clinical evaluation of language fundamentals. 4th ed. San Antonio:
Pearson, Psychological Corporation; 2003.
63. Gioia GA, Isquith PK, Guy SC, Kenworthy L. Behavior rating inventory of executive function. Psycholog-
ical Assessment Resources; 2000.
64. Gioia GA, Espy KA, Isquith PK. Behavior rating inventory of executive function, preschool version. Psy-
chological Assessment Resources; 2003.
65. Bishop DVM. The children’s communication checklist: CCC-2. ASHA; 2003.
66. Berument SK, Rutter M, Lord C, Pickles A, Bailey A. Autism screening questionnaire: Diagnostic valid-
ity. Br J Psychiatry. 1999; 175(5): 444–451. https://doi.org/10.1192/bjp.175.5.444 PMID: 10789276
67. Royston P, White IR. Multiple imputation by chained equations (MICE): Implementation in Stata. J Stat
Softw. 2011; 45(4): 1–20. https://doi.org/10.18637/jss.v045.i04
68. Facon B, Magis D, Belmont JM. Beyond matching on the mean in developmental disabilities research.
Res Dev Disabil. 2011; 32(6): 2134–2147. https://doi.org/10.1016/j.ridd.2011.07.029 PMID: 21856117
69. Miller J, Chapman R. Systematic analysis of language transcripts. Language Analysis Laboratory.
1985.
Quantitative analysis of disfluency in children with ASD or SLI
PLOS ONE | https://doi.org/10.1371/journal.pone.0173936 March 15, 2017 19 / 20

70. Brown R. A first language: The early stages. Harvard University Press; 1973.
71. Tager-Flusberg H, Rogers S, Cooper J, Landa R, Lord C, Paul R, et al. Defining spoken language
benchmarks and selecting measures of expressive language development for young children with
autism spectrum disorders. J Speech Lang Hear Res. 2009; 52(3): 643–652. https://doi.org/10.1044/
1092-4388(2009/08-0136) PMID: 19380608
72. Morley E, Roark B, van Santen J. The utility of manual and automatic linguistic error codes for identify-
ing neurodevelopmental disorders. Proceedings of the 8th Workshop on Innovative Use of NLP for
Building Educational Applications. 2013; 1–10.
73. Morley E, Hallin AE, Roark B. Challenges in automating maze detection. Proceedings of the 1st Work-
shop on Computational Linguistics and Clinical Psychology. 2014; 69–77.
74. Pinheiro JC, Bates DM. Mixed-effects models in S and S-PLUS. New York: Springer; 2000.
75. Bretz F, Hothorn T, Westfall P. Multiple comparisons using R. Boca Raton: CRC Press; 2010.
76. Landis JR, Koch GG. The measurement of observer agreement for categorical data. Biometrics 1977;
33(1): 159–174. https://doi.org/10.2307/2529310 PMID: 843571
77. Benjamini Y, Hochberg Y. Controlling the false discovery rate: A practical and powerful approach to sig-
nificance testing. J R Stat Soc Series B. 1995; 57(1): 289–300.
78. Prud’hommeaux E, Rouhizadeh M. Automatic detection of pragmatic deficits in children with autism.
Workshop Child Comput Interact. 2012; 1–6.
79. Lickley R, Bard E. When can listeners detect disfluency in spontaneous speech? Lang Speech. 1998;
41(2): 203–226. PMID: 10194877
80. Engelhardt PE, Ferreira F, Nigg JT. Is the fluency of language outputs related to individual differences
in intelligence and executive function? Acta Psychol. 2013; 144(2): 424–432. https://doi.org/10.1016/j.
actpsy.2013.08.002
81. Kenworthy L, Yerys BE, Anthony LG, Wallace GL. Understanding executive control in autism spectrum
disorders in the lab and in the real world. Neuropsychol Rev. 2008; 18(4): 320–338. https://doi.org/10.
1007/s11065-008-9077-7 PMID: 18956239
82. Shriberg LD, Paul R, Black LM, van Santen JP. The Hypothesis of Apraxia of Speech in Children with
Autism Spectrum Disorder. J Autism Dev Disord. 2011; 41(4): 405–426. https://doi.org/10.1007/
s10803-010-1117-5 PMID: 20972615
83. Hoff E. The specificity of environmental influence: Socioeconomic status affects early vocabulary devel-
opment via maternal speech. Child Dev. 2003; 74(5): 1368–1378. https://doi.org/10.1111/1467-8624.
00612 PMID: 14552403
84. Pungello EP, Iruka IU, Dotterer AM, Mills-Koonce R, Reznick JS. The effects of socioeconomic status,
race, and parenting on language development in early childhood. Dev Psychol. 2009; 45(2): 544–557.
https://doi.org/10.1037/a0013917 PMID: 19271838
85. McKinnon DH, McLeod S, Reilly S. The prevalence of stuttering, voice, and speech-sound disorders in
primary school students in Australia. Lang Speech Hear Serv Sch. 2007; 38(1): 5–15. https://doi.org/10.
1044/0161-1461(2007/002) PMID: 17218532
86. Richels CG, Johnson KN, Walden TA, Conture EG. The relation of socioeconomic status and parent
education on the vocabulary and language skills of children who do and do not stutter. J Commun Dis-
ord. 2013; 46(4): 361–374.
87. Allwood J, Nivre J, Ahlsen E. Speech management: On the non-written life of speech. Nord J Ling 1990;
13(1): 1–48. https://doi.org/10.1017/S0332586500002092
88. Brennan SE, Schober MF. How listeners compensate for disfluencies in spontaneous speech. J Mem
Lang. 2001; 44(2): 274–296. https://doi.org/10.1006/jmla.2000.2753
89. Fox Tree JE. Listeners’ uses of um and uh in speech comprehension. Mem Cognit. 2001; 29(2): 320–
326. https://doi.org/10.3758/BF03194926 PMID: 11352215
90. Bishop DVM, Norbury CF. Exploring the borderlands of autistic disorder and specific language
impairment: A study using standardised diagnostic instruments. J Child Psychol Psychiatry. 2002; 43
(3): 917–929. https://doi.org/10.1111/1469-7610.00114 PMID: 12405479
91. Bishop DVM, Whitehouse AJO, Watt HJ, Line EA. Autism and diagnostic substitution: Evidence from a
study of adults with a history of developmental language disorder. Dev Med Child Neurol. 2008; 50(5):
341–345. https://doi.org/10.1111/j.1469-8749.2008.02057.x PMID: 18384386
92. Cox A, Klein K, Charman T, Baird G, Baron-Cohen S, Swettenham J, et al. Autism spectrum disorders
at 20 and 42 months of age: Stability of clinical and ADI-R diagnosis. J Child Psychol Psychiatry. 1999;
40(5): 719–732. https://doi.org/10.1111/1469-7610.00488 PMID: 10433406
93. Rispoli M, Hadley P, Holt J. Stalls and revisions: A developmental perspective on sentence production. J
Speech Lang Hear Res. 2008; 51(4): 953. https://doi.org/10.1044/1092-4388(2008/070) PMID: 18658064
Quantitative analysis of disfluency in children with ASD or SLI
PLOS ONE | https://doi.org/10.1371/journal.pone.0173936 March 15, 2017 20 / 20