Embed Size (px)
Citation preview
Plant Physiol. (1988) 86, 1257-12630032-0889/88/86/1257/07/$01 .00/0
Quantitative and Rapid Estimation of H+ Fluxes in MembraneVesicles'SOFTWARE FOR ANALYSIS OF FLUORESCENCE QUENCHING AND RELAXATION
Received for publication September 18, 1987 and in revised form January 11, 1988
IAN R. JENNINGS, PHILIP A. REA2, ROGER A. LEIGH, AND DALE SANDERS*Department of Biology, University of York, Heslington, York YOJ 5DD, United Kingdom (I.R.J.,P.A.R., D.S.); and Rothamsted Experimental Station, Harpenden, Hertfordshire ALS 2JQ, UnitedKingdom (R.A.L.)
ABSTRACT
Proton transport is often visualized in membrane vesicles by use offluorescent monoamines which accumulate in acidic intravesicular com-partments and undergo concentration-dependent fluorescence quenching.Software for an IBM microcomputer is described which permits loggingand editing of changes in fluorescence monitored by a Perkin-Elmer LS-5 luminescence spectrometer. An accurate estimate of the instantaneousrate of fluorescence quenching or recovery is then facilitated by leastsquares fitting of fluorescence data to a nonlinear function. The softwareis tested with tonoplast vesicles from Beta vulgaris. Quenching of acridineorange fluorescence by ATP-driven (primary) transport and relaxationof quenching by Na+/H+ antiport can both be fitted with single expo-nential functions. Initial rates of ATP- and Na+-dependent fluorescencechanges are derived and can be used for K, determinations. The methodconstitutes a simple and efficient alternative to manual analysis of analogfluorescence traces and results in a reliable quantitative measurement ofthe relative rate of proton transport in membrane vesicle preparations.
Proton transport plays a central role in energy transduction inplants (11). Primary H+ transport at the energy-coupling mem-branes of chloroplasts and mitochondria is driven by light andredox potential energy, respectively, and results in the formationof a transmembrane electrochemical H+ gradient (AdZH+).3 Adissipative flow of protons down this gradient is then coupled tosynthesis of ATP. At the plasma membrane and tonoplast, hy-drolysis of phosphoanhydride bonds is used to energize H + trans-port, with reverse flow of H+ down the resulting (A-AH+. w-ering transport of other solutes through discrete secondary systems.
Classical electrophysiological techniques have given insight intothe kinetics of H + transport across the plasma membrane ofintact plant cells (1) and patch clamp executed in a 'whole cellmode' enables the study of ATP-dependent H + currents in intactvacuoles (4, 12). More commonly, however, H+ transport isstudied in isolated membrane vesicles, whose small size prohibitsthe electrophysiological approach. Further, the fact that 3H rap-
' Supported by the Agricultural and Food Research Council (GrantAG87/29) and The University of York.
2Present address: Rothamsted Experimental Station, Harpenden,Hertfordshire AL5 2JQ, U.K.
3Abbreviations: 4LH +, transmembrane electrochemical proton gra-dient; ApH, transmembrane pH gradient; at', transmembrane electricalpotential difference; BTP, Bis-tris-propane.
idly exchanges with 'H20 makes radiometric analyses impossible.Optical methods have therefore had to be developed for theroutine estimation of the chemical (ApH) and electrical (,AT)components of A,LH+ in membrane vesicles (25).
Fluorescent monoamines (e.g. acridine orange, quinacrine, and9-aminoacridine) have been widely applied in plant membranevesicle studies to monitor both primary (2, 3, 7, 9, 10, 16, 19,20, 22-24, 26, 27) and secondary (5, 6, 8) H+ translocation.These compounds accumulate intravesicularly in response to aninside-acid pH gradient and this results in a concentration-dependent decrease in the fluorescence signal through dye stack-ing (25). Inwardly directed H+ pumping may therefore be de-tected as a decrease in the fluorescence of the amine with time,while, conversely, the activity of some secondary systems can befollowed as an increase in fluorescence after imposition of aninside-acid pH gradient. All of the probes concerned are lipo-philic in the free base form so that transmembrane equilibrationin response to ApH is rapid (T < 2 s). Consequently, changes influorescence intensity closely parallel alterations in the magni-tude of the pH gradient (for empirical justification see Lee et al.[15]; for mathematical justification see Bennett and Spanswick[21).With the exception of nonsteady state investigations of pho-
tosynthetic systems in the ms time range (14), the kinetics ofvesicular transmembrane H + translocation have been calculatedfrom analog recordings. Thus, rates have been estimated fromhand-drawn tangents to curves-a process which is both labo-rious and errorsome. The problem is particularly acute for sec-ondary transport where the pH gradient is often generated ar-tificially: because of the intrinsic permeability of the membraneto H+ and the high surface area:volume ratio of vesicles, sec-ondary transport is often initiated against a shifting baseline andthe signal obtained is short-lived owing to depletion of the limitedreserves of intravesicular protons.Here we report a method for the logging and subsequent anal-
ysis of fluorescence data from ApH-reporting probes in mem-brane vesicles. Using tonoplast vesicles from Beta vulgaris L. asa model, we show that time-dependent fluorescence change re-sulting from activation of primary and secondary H+ transportsystems can be simply and accurately estimated by least squaresfitting of single exponential functions to digitized, stored data.A preliminary report of this work has appeared previously (13).
MATERIALS AND METHODS
Hardware. The software which has been developed enablescollection of fluorescence data from a Perkin-Elmer LS-5 (or LS-3) luminescence spectrometer by an IBM-XT microcomputer
1257 www.plantphysiol.orgon September 15, 2018 - Published by Downloaded from
Copyright © 1988 American Society of Plant Biologists. All rights reserved.

Plant Physiol. Vol. 86, 1988
FIG. 1. Flow diagram of LS5. The menu calls the procedures to recordor store fluorescence data. The data recording procedure has five stages:(a) Wait for characters from spectrometer (time-out status from syn-chronous adapter, no data yet received); (b) store characters in linebuffer until end of line; (c) count the number of lines until the time axisis incremented and use this to scale the time axis; (d) send fluorescencevalues already in memory to screen and update the display with incomingdata; (e) when the spectrometer sends an 'initiate graph plot mode'character (chr 18), scan through the remaining data and retrieve theemission and excitation wavelengths. Handshaking with the spectrometeris achieved via the computer's Data Terminal Ready signal. This is takenhigh to receive a character, and then brought low again.
with a monochrome display. The LS-5 is purchased with an LS-X communications interface which is accessed via an RS 232Cport. Input to the microcomputer requires an asynchronous com-munications. adapter and analog display on the monitor is achievedwith a Hercules monochrome graphics card. (Hercules look-alikecards may not be compatible, or will require modification if theyfail to invert the printer's ACK signal.)
Nonlinear least squares fitting requires a minimum of 256 Kof memory-and makes use of the 8087 math coprocessor.
Software.4 The software runs with IBM-DOS (Version 2.1, orabove). Three programs have been developed: LS5, which logsand generates an on-line display of data from the luminescencespectrometer; LS5EDIT, which allows the user to review storeddata and will create a data file compatible for nonlinear leastsquares fitting; MARQDAT, which uses a commercially avail-able routine to execute least squares fitting.
4 Those interested in obtaining copies of the software should contactI. R. J. or D. S. at The University of York.
FIG. 2. Flow diagram of LS5EDIT, illustrating review and edit modes.The fluorescence data and note-pad text are read from the integer filecreated by LS5, the text being deciphered from the integer values. Thefluorescence trace displayed on the screen may be sent to the printerusing an interrupt-driven routine. This interrupt facility enables furtheranalysis of fluorescence data while the printer is printing.
The program structure of LS5 is shown in Figure 1. LS5 iswritten in Pascal. Recording is initiated and fluorescence inten-sity scaled at the keyboard of the luminescence spectrometer.Scan speed must be set to 'TIME', but recorder speed is optional:a recorder speed of 0.5 cm/min results in a full screen scaling onthe monitor of 20 min, 1 cm/min generates full screen scaling of10 min, and >2 cm/min corresponds to full screen scaling of 5min. (This upper limit on time resolution is set by the rate atwhich horizontal scrolling can be accomplished on the Herculescard.)Data are sent from the internal buffer of the spectometer via
the RS 232C port to the microcomputer at 1200 baud, whichcorresponds to a sample rate of 10 bi-coordinate data points/s.LS5 deciphers the ASCII plotting codes (normally destined forthe Perkin-Elmer GP-100 plotter) to extract the X-Y coordinatesof each data point. Relative fluorescence intensity is calculatedfrom the plotting codes by a formula which allows for a fixedordinate displacement on the GP-100. The time base is alsorecognized from the plotting codes and assumes the above sam-pling frequency. In the event that a condensed time base is re-quired for maximum on-line visualization of the trace, values are
1258 JENNINGS ET AL.
www.plantphysiol.orgon September 15, 2018 - Published by Downloaded from Copyright © 1988 American Society of Plant Biologists. All rights reserved.
QUANTITATIVE ANALYSIS OF MEMBRANE VESICLE H+ TRANSPORT
A
L..
IF W.m1w I mw_rx ji
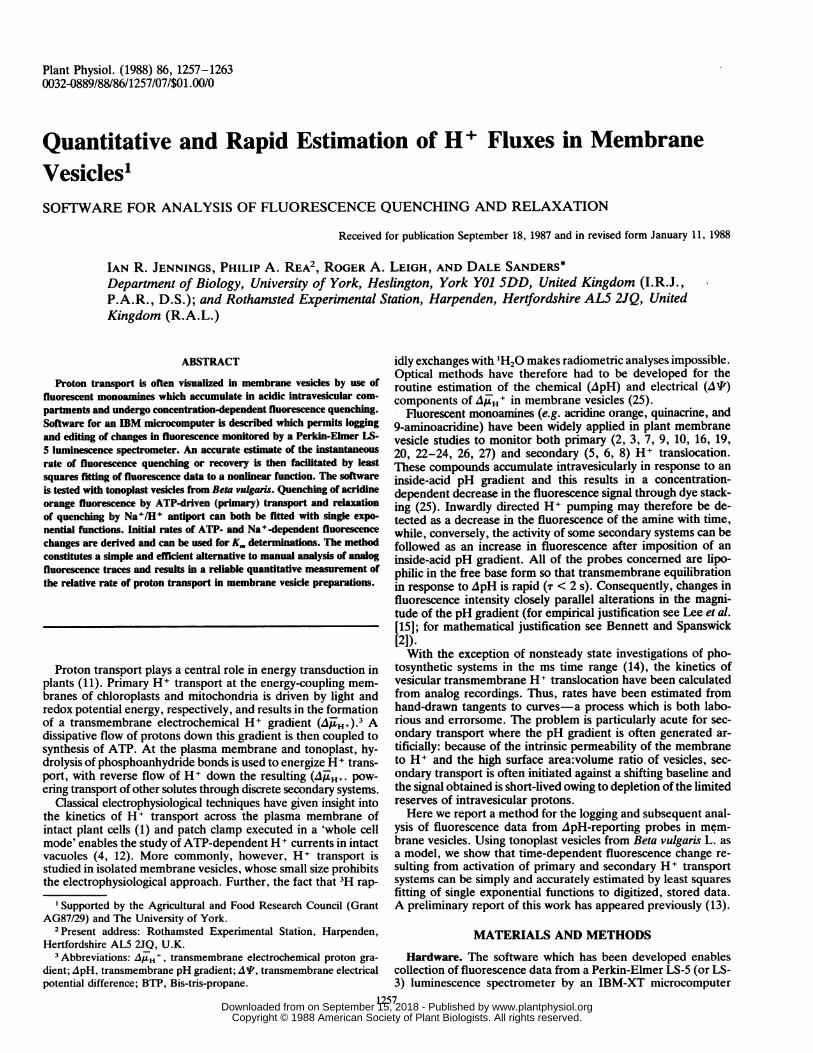
FIG. 3. Flow diagram of MARQDAT. Single-lined boxes and the solid lines connecting them indicate user-interactive pathways; double-linedboxes represent files created by the program, and the dotted lines show pathways followed by the data.
sampled for display. However, all incoming data points are storeddirectly in memory. The maximum recording time is set by con-straints on the array size permitted by Pascal, which correspondsto 40 min continuous recording (i.e. 52 kbyte or 2600 s). Sincerecordings from membrane vesicles rarely exceed 20 min, thislimitation is not of practical significance.Termination of the recording is normally signaled from the
keyboard of the spectrometer. The appropriate command fromthe microcomputer keyboard transfers data from memory to disk,on which they are stored as an integer, rather than as an ASCII,file. Excitation and emission wavelengths are extracted auto-matically from additional plotting codes sent by the spectrometeronce termination is signalled, and these are recorded in the datafile. In the event that recording is to be terminated on exceedingthe maximum array size, a warning is issued. However trans-mission breaks (status errors) arising, for example, from faultyhardware connections, are recognized by LS5, thereby enablingcontinued recording without loss of preexisting data (Fig. 1).Other facilities of LS5 include a note-pad which appears when
the program enters the recording mode. A file-name for recordeddata is specified at this stage. The data file-name consists of asix-letter user-specified core mnemonic plus two digits, whichbegin at 01 and are automatically incremented to prevent over-writing. Details of experimental protocol can also be recordedon the note-pad. After termination of the recording mode ofLS5, the user has the option tor update the note-pad before thedata file is written to disk.LS5EDIT is also written in Pascal, and its structure is shown
in Figure 2. Its purpose is to allow the user to review and editdata logged by LS5 prior to nonlinear least squares fitting. Oncea data file is called from disk, the trace is displayed on appropriateaxes. Single-key commands facilitate horizontal scrolling of thetrace, as well as contraction or expansion of the relative fluo-rescence scale (full scale limits 100 and 25%, respectively) andtime base (full scale limits of 1 and 30 min). This facility enablesdetailed visual inspection of the trace at the points of interest.A hardcopy of the suitably scaled image is obtained on a dotmatrix printer after a screen dump command.
The other major function of LS5EDIT is to write a text(ASCII) file of the data which is compatible for input toMARQDAT. Scaling can also be adjusted in this review mode.A cursor is moved across the screen with single-key commands,and once appropriately positioned, can be used to define thelimits of the trace for curve-fitting. The number of data pointsin the period is displayed. Since the maximum limit on the num-ber of data points for least squares fitting is 200, excess datamust be deleted at this stage. Again, this is accomplished witha single key command, which successively selects every second,third, fourth, etc. point for inclusion in the text file. The time atthe start of the edited trace can be reset to zero, if desired. Afterspecification of a new file name, the text file of the edited datais created. The ASCII file consists of a list of the data pointcoordinates, prefixed by values for the number of data pointsand the number of digits per line.MARQDAT uses the nonlinear least squares fitting algorithm
of Marquardt (18) to fit one of a number of functions to the datafile created by LS5EDIT. The aim of this procedure is to generatea defined, but purely empirical, expression which accurately de-scribes the data and hence allows determination of instantaneousrates of fluorescence change. User-interactive routines are writ-ten in Pascal, while the function-fitting routines are in Fortran.Figure 3 is a flow diagram of MARQDAT. The ASCII file fromLS5EDIT can be further edited (point by point) from the mainmenu. In practice, we have found that the most accurate functionfor fitting ApH-related fluorescence changes is an exponential ofthe form
=P[p exp[p4(t - p5)]](1)
in which F is fluorescence intensity (%), t is time, and p1 throughp5 are constants derived by the curve fitting. Other functionsavailable include a polynomial.
Since pl is merely a scaling factor, its value can be constrainedto 1, with any necessary scaling adjustments appearing propor-tionally in p2 and p3. Cases for which an experimental treatment
1259
www.plantphysiol.orgon September 15, 2018 - Published by Downloaded from Copyright © 1988 American Society of Plant Biologists. All rights reserved.
JENNINGS ETAL.
0- 8
00So
00b.
70-0
cc 60~
50jO.'4
Plant Physiol. Vol. 86, 1988
. I I0.6 0.8 1.0
Time (mhin)
I I I
1.2 1.4
30
S
.@1.@ 2.@ 3.@ ~~~~~~~4.6.Tbl (11n)
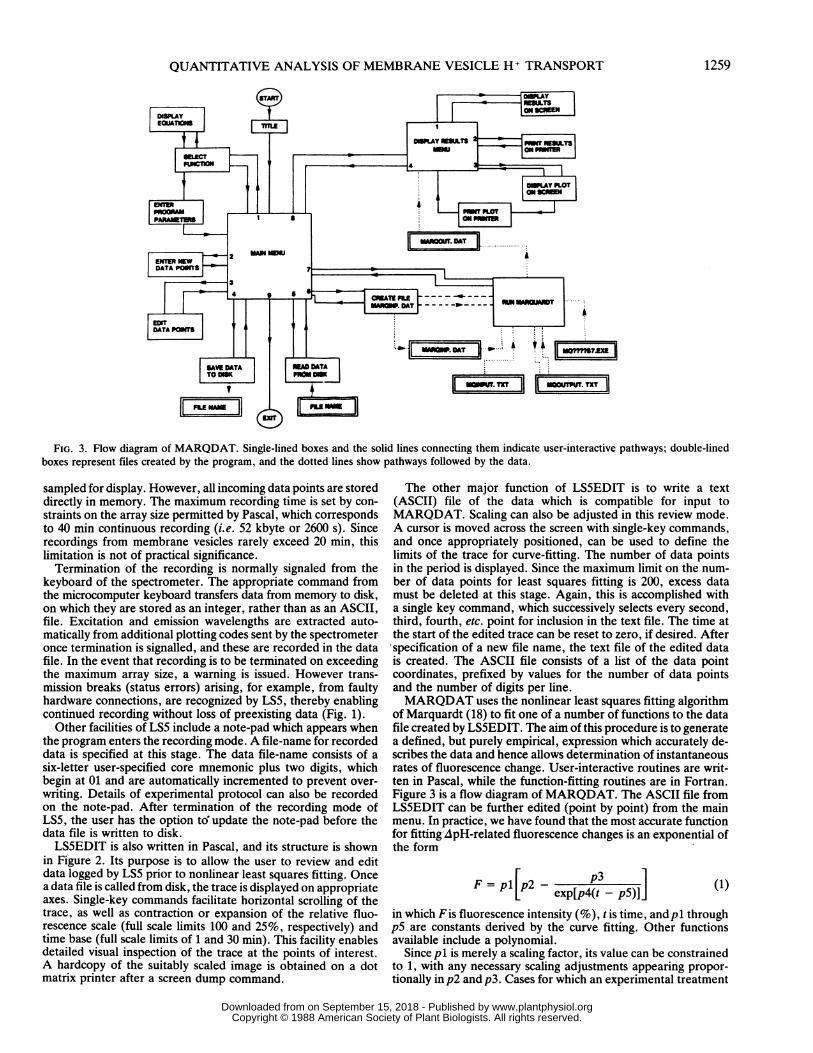
FIG. 4. Screen displays of fluorescence intensity data by LS5. A, Pro-ton pump-dependent quenching of acridine orange fluorescence initiatedby addition of I MM MgSO4 to a suspension of tonoplast vesicles at 0.48min; B, tonoplast vesicles (20 ,ug membrane protein) subjected to a 'pHjump' from 6.0 to 8.0 at 0.37 min in the presence of acridine orange. At2.05 min, Na+/H+ antiport was initiated by the addition of 20 mm Na2SO4,resulting in rapid recovery of fluorescence; 5 mm NH4CI was added at3.97 min. All other conditions as in "Other Methods."
generates a shift i'n baseline fluorescence are accommodated bya, finite value ofpS. Alternatively, constrainingp5 to the negativeof the ti'me at which the treatment begins effectively allows curvefitting without the necessity of redefining the start of the fittingperiod as time-zero (see LSSEDIT, above). However, no base-line fluorescenice shifts were apparent for the particular condi-tions tested in this paper, and the times at which experimentaltreatments were initiated have all been reset to zero: this enablespS to be constrained to 0. The resulting simplified form of Eq.1 is thenv ~ ~~~~F= p2 - p3-exp(-p4t) (2)
in which p2 is the final, steady fluorescence, p3 is the overallchange in fluorescence intensity generated by the experimentaltreatment, andp4 is the rate constant of the change (units: min-i')The polarity ofp3 is negative for fluorescence quenching (protonpumping) and positive for relaxation of quenching. 'Seeding'estimates for P2, P3, and p4 are entered from the main menu,
0~~~
0
30
4
^So;~~~~~~~X I
1.8 2.0 2.2 2.4 2.6 2.6
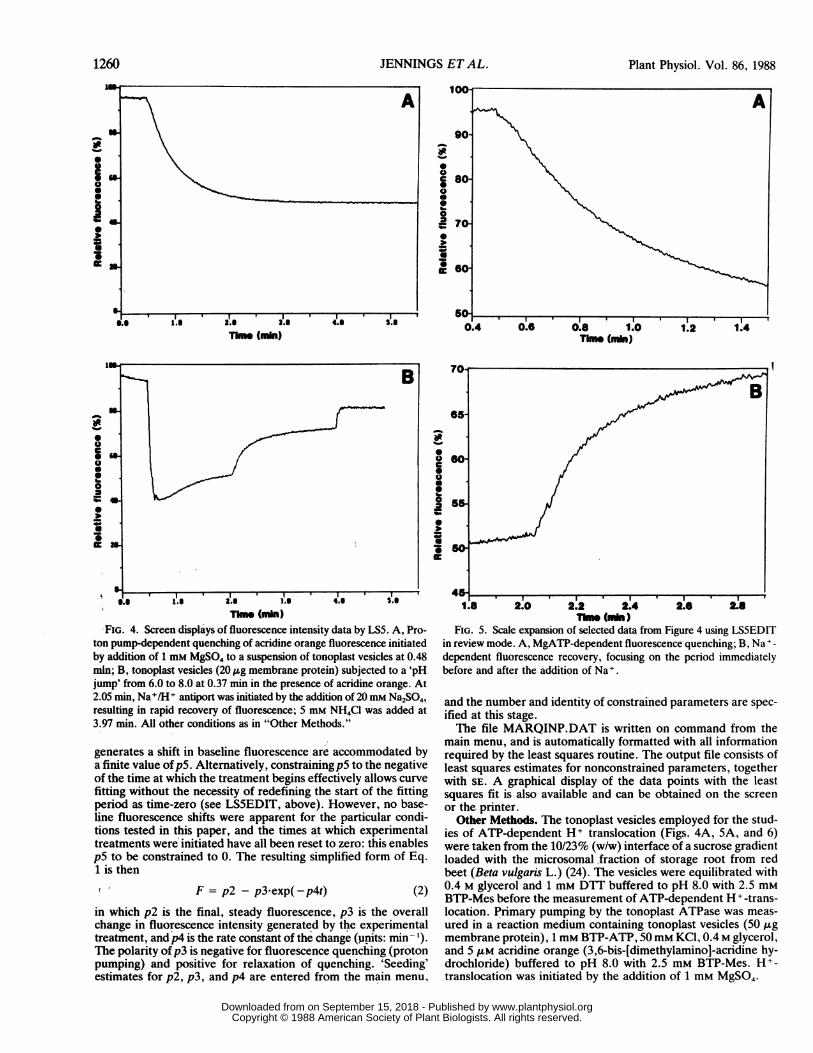
ThI (MM)FIG. 5. Scale expansion of selected data from Figure 4 using LS5EDIT
in review mode. A, MgATP-dependent fluorescence quenching; B, Na+-
dependent fluorescence recovery, focusing on the period immediatelybefore and after the addition of Na+.
and the number and identity of constrained parameters are spec-ified at this stage.The file MARQINP.DAT is written on command from the
main menu, and is automatically formatted with all informationrequired by the least squares routine. The output file consists ofleast squares estimates for nonconstrained parameters, togetherwith SE. A graphical display of the data points with the leastsquares fit is also available and can be obtained on the screen
or the printer.Other Methods. The tonoplast vesicles employed for the stud-
ies of ATP-dependent H+ transloca,tion (Figs. 4A, 5A, and 6)were taken from the 10/23% (w/w) interface of a sucrose gradientloaded with the microsomal fraction of storage root from redbeet (Beta vulgaris L.) (24). The vesicles were equilibrated with0.4 M glycerol and 1 mm DTT buffered to pH 8.0 with 2.5 mMBTP-Mes before the measurement of ATP-dependent H + -trans-location. Primary pumping by the tonoplast ATPase was meas-ured in a reaction medium containing tonoplast vesicles (50,gmembrane protein), 1 mm BTP-ATP, 50 mM KCI, 0.4 M glycerol,and 5 ,UM acridine orange (3,6-bis-[dimethylamino]-acridine hy-drochloride) buffered to pH 8.0 with 2.5 mM BTP-Mes. H+-translocation was initiated by the addition of 1 mM MgSO4.
1260
0
0
~1U
A
TM. (R)
I n |
www.plantphysiol.orgon September 15, 2018 - Published by Downloaded from Copyright © 1988 American Society of Plant Biologists. All rights reserved.
QUANTITATIVE ANALYSIS OF MEMBRANE VESICLE H+ TRANSPORT
@.WON Relative time (min) 9.6E
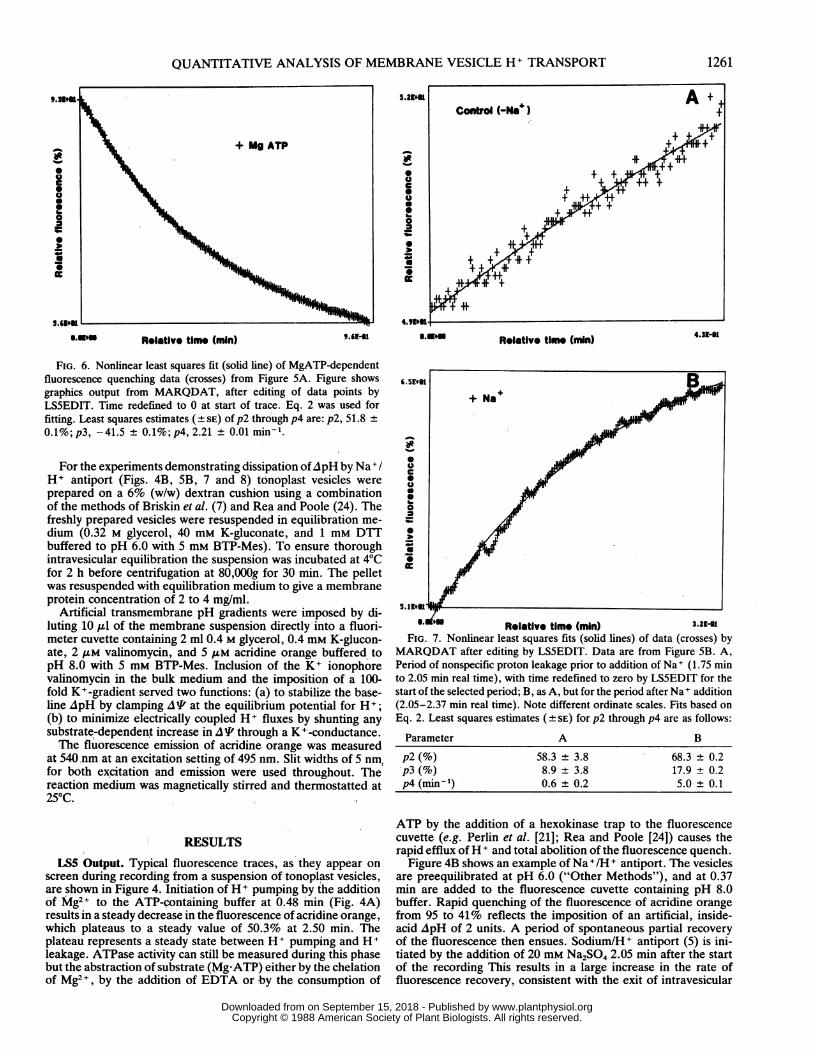
FIG. 6. Nonlinear least squares fit (solid line) of MgATP-dependentfluorescence quenching data (crosses) from Figure SA. Figure showsgraphics output from MARQDAT, after editing of data points byLS5EDIT. Time redefined to 0 at start of trace. Eq. 2 was used forfitting. Least squares estimates (+ SE) of p2 through p4 are: p2, 51.8 ±0.1 %; p3, -41.5 ± 0.1%; p4, 2.21 ± 0.01 minm .
For the experiments demonstrating dissipation ofApH by Na+/H+ antiport (Figs. 4B, 5B, 7 and 8) tonoplast vesicles wereprepared on a 6% (w/w) dextran cushion usi-ng a combinationof the methods of Briskin et al. (7) and Rea and Poole (24). Thefreshly prepared vesicles were resuspended in equilibration me-dium (0.32 M glycerol, 40 mm K-gluconate, and 1 mm DTTbuffered to pH 6.0 with 5 mM BTP-Mes). To ensure thoroughintravesicular equilibration the suspension was incubated at 4°Cfor 2 h before centrifugation at 80,000g for 30 min. The pelletwas resuspended with equilibration medium to give a membraneprotein concentration of 2 to 4 mg/ml.
Artificial transmembrane pH gradients were imposed by di-luting 10 Al of the membrane suspension directly into a fluori-meter cuvette containing 2 ml 0.4 M glycerol, 0.4 mm K-glucon-ate, 2 ,uM valinomycin, and 5 ,AM acridine orange buffered topH 8.0 with 5 mm BTP-Mes. Inclusion of the K+ ionophorevalinomycin in the bulk medium and the imposition of a 100-fold K+-gradient served two functions: (a) to stabilize the base-line ApH by clamping A at the equilibrium potential for H+;(b) to minimize electrically coupled H+ fluxes by shunting anysubstrate-dependent increase in A I through a K +-conductance.The fluorescence emission of acridine orange was measured
at 540 nm at an excitation setting of 495 nm. Slit widths of 5 nm.for both excitation and emission were used throughout. Thereaction medium was magnetically stirred and thermostatted at250C.
RESULTS
LSS Output. Typical fluorescence traces, as they appear onscreen during recording from a suspension of tonoplast vesicles,are shown in Figure 4. Initiation of H+ pumping by the additionof Mg2+ to the ATP-containing buffer at 0.48 min (Fig. 4A)results in a steady decrease in the fluorescence of acridine orange,which plateaus to a steady value of 50.3% at 2.50 min. Theplateau represents a steady state between H+ pumping and H+leakage. ATPase activity can still be measured during this phasebut the abstraction of substrate (Mg-ATP) either by the chelationof Mg2+, by the addition of EDTA or by the consumption of
USD53 Rolativ, time (nn) 4.3-K-
6*UDU Relative time (min) 3.2141FIG. 7. Nonlinear least squares fits (solid lines) of data (crosses) by
MARQDAT after editing by LS5EDIT. Data are from Figure SB. A,Period of nonspecific proton leakage prior to addition of Na+ (1.75 minto 2.05 min real time), with time redefined to zero by LS5EDIT for thestart of the selected period; B, as A, but for the period after Na I addition(2.05-2.37 min real time). Note different ordinate scales. Fits based onEq. 2. Least squares estimates ( t SE) for p2 through p4 are as follows:
Parameter A B
p2 (%) 58.3 ± 3.8 68.3 ± 0.2p3 (%) 8.9 ± 3.8 17.9 ± 0.2p4 (min-') 0.6 ± 0.2 5.0 ± 0.1
ATP by the addition of a hexokinase trap to the fluorescencecuvette (e.g. Perlin et al. [21]; Rea and Poole [24]) causes therapid efflux ofH + and total abolition of the fluorescence quench.
Figure 4B shows an example of Na+/H+ antiport. The vesiclesare preequilibrated at pH 6.0 ("Other Methods"), and at 0.37min are added to the fluorescence cuvette containing pH 8.0buffer. Rapid quenching of the fluorescence of acridine orangefrom 95 to 41% reflects the imposition of an artificial, inside-acid ApH of 2 units. A period of spontaneous partial recoveryof the fluorescence then ensues. Sodium/H+ antiport (5) is ini-tiated by the addition of 20 mm Na2SO4 2.05 min after the startof the recording This results in a large increase in the rate offluorescence recovery, consistent with the exit of intravesicular
1261
www.plantphysiol.orgon September 15, 2018 - Published by Downloaded from Copyright © 1988 American Society of Plant Biologists. All rights reserved.
Plant Physiol. Vol. 86, 1988
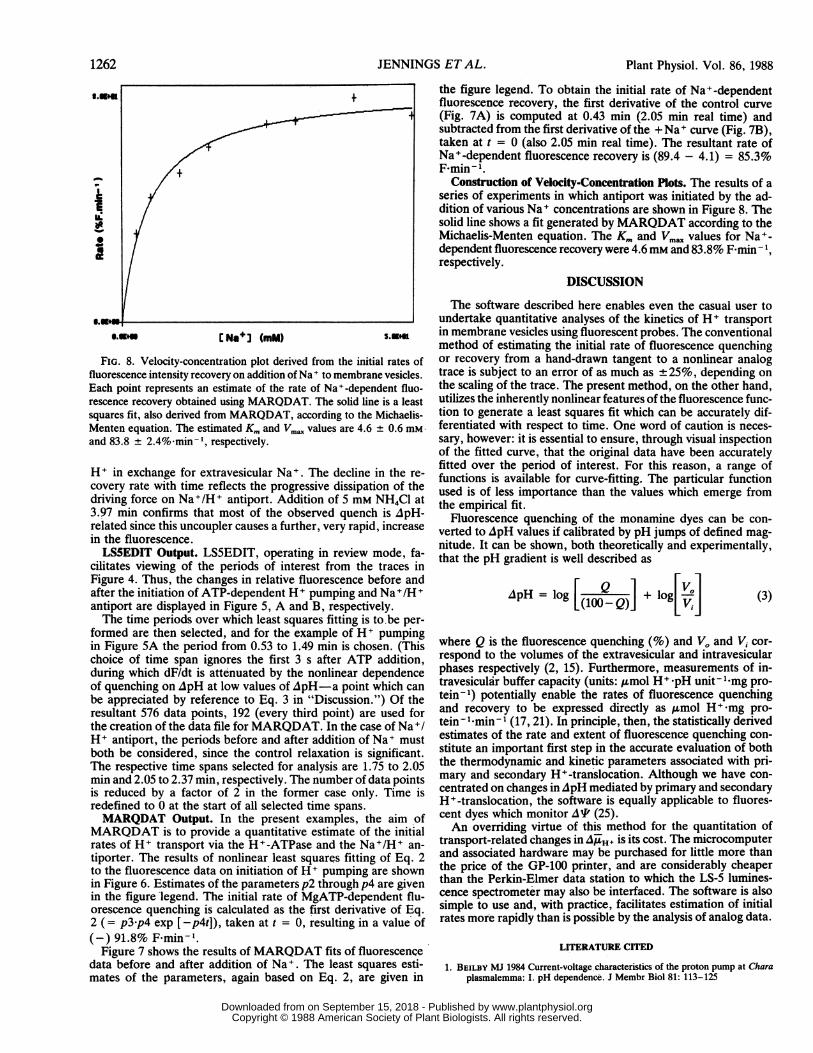
S.w [ Nae 3 (mM)
FIG. 8. Velocity-concentration plot derived from the initial rates offluorescence intensity recovery on addition of Na to membrane vesicles.Each point represents an estimate of the rate of Na+-dependent fluo-
rescence recovery obtained using MARQDAT. The solid line is a leastsquares fit, also derived from MARQDAT, according to the Michaelis-Menten equation. The estimated Km and Vm. values are 4.6 ± 0.6 mmand 83.8 ± 2.4% min 1, respectively.
H+ in exchange for extravesicular Na+. The decline in the re-covery rate with time reflects the progressive dissipation of thedriving force on Na+/H+ antiport. Addition of 5 mM NH4Cl at3.97 min confirms that most of the observed quench is ApH-related since this uncoupler causes a further, very rapid, increasein the fluorescence.LS5EDIT Output. LS5EDIT, operating in review mode, fa-
cilitates viewing of the periods of interest from the traces inFigure 4. Thus, the changes in relative fluorescence before andafter the initiation of ATP-dependent H + pumping and Na+/H +antiport are displayed in Figure 5, A and B, respectively.The time periods over which least squares fitting is to be per-
formed are then selected, and for the example of H+ pumpingin Figure 5A the period from 0.53 to 1.49 min is chosen. (Thischoice of time span ignores the first 3 s after ATP addition,during which dF/dt is attenuated by the nonlinear dependenceof quenching on ApH at low values of ApH-a point which canbe appreciated by reference to Eq. 3 in "Discussion.") Of theresultant 576 data points, 192 (every third point) are used forthe creation of the data file for MARQDAT. In the case of Na +/H+ antiport, the periods before and after addition of Na+ mustboth be considered, since the control relaxation is significant.The respective time spans selected for analysis are 1.75 to 2.05min and 2.05 to 2.37 min, respectively. The number of data pointsis reduced by a factor of 2 in the former case only. Time isredefined to 0 at the start of all selected time spans.MARQDAT Output. In the present examples, the aim of
MARQDAT is to provide a quantitative estimate of the initialrates of H+ transport via the H+-ATPase and the Na+/H+ an-
tiporter. The results of nonlinear least squares fitting of Eq. 2to the fluorescence data on initiation of H + pumping are shownin Figure 6. Estimates of the parameters p2 through p4 are givenin the figure'legend. The initial rate of MgATP-dependent flu-orescence quenching is calculated as the first derivative of Eq.2 (= p3-p4 exp [-p4t]), taken at t = 0, resulting in a value of(-) 91.8% F-min1.
Figure 7 shows the results of MARQDAT fits of fluorescencedata before and after addition of Na+. The least squares esti-mates of the parameters, again based on Eq. 2, are given in
the figure legend. To obtain the initial rate of Na+-dependentfluorescence recovery, the first derivative of the control curve(Fig. 7A) is computed at 0.43 min (2.05 min real time) andsubtracted from the first derivative of the +Na+ curve (Fig. 7B),taken at t = 0 (also 2.05 min real time). The resultant rate ofNa+-dependent fluorescence recovery is (89.4 - 4.1) = 85.3%F-min-1.
Construction of Velocity-Concentration Plots. The results of aseries of experiments in which antiport was initiated by the ad-dition of various Na+ concentrations are shown in Figure 8. Thesolid line shows a fit generated by MARQDAT according to theMichaelis-Menten equation. The Km and Vmax values for Na+-dependent fluorescence recovery were 4.6mM and 83.8% F min- l,respectively.
DISCUSSION
The software described here enables even the casual user toundertake quantitative analyses of the kinetics of H+ transportin membrane vesicles using fluorescent probes. The conventionalmethod of estimating the initial rate of fluorescence quenchingor recovery from a hand-drawn tangent to a nonlinear analogtrace is subject to an error of as much as ±25%, depending onthe scaling of the trace. The present method, on the other hand,utilizes the inherently nonlinear features of the fluorescence func-tion to generate a least squares fit which can be accurately dif-ferentiated with respect to time. One word of caution is neces-sary, however: it is essential to ensure, through visual inspectionof the fitted curve, that the original data have been accuratelyfitted over the period of interest. For this reason, a range offunctions is available for curve-fitting. The particular functionused is of less importance than the values which emerge fromthe empirical fit.
Fluorescence quenching of the monamine dyes can be con-verted to ApH values if calibrated by pH jumps of defined mag-nitude. It can be shown, both theoretically and experimentally,that the pH gradient is well described as
ApH = log [1 Q) + log[V] (3)[(100 Q)] [Vi]
where Q is the fluorescence quenching (%) and VO' and Vi cor-respond to the volumes of the extravesicular and intravesicularphases respectively (2, 15). Furthermore, measurements of in-travesicular buffer capacity (units: ,umol H+-pH unit-I mg pro-tein-l) potentially enable the rates of fluorescence quenchingand recovery to be expressed directly as ,umol H+-mg pro-tein- Imin-1 (17, 21). In principle, then, the statistically derivedestimates of the rate and extent of fluorescence quenching con-stitute an important first step in the accurate evaluation of boththe thermodynamic and kinetic parameters associated with pri-mary and secondary H+-translocation. Although we have con-centrated on changes in pH mediated by primary and secondaryH+-translocation, the software is equally applicable to fluores-cent dyes which monitor AI (25).An overriding virtue of this method for the quantitation of
transport-related changes ind ,H+ is its cost. The microcomputerand associated hardware may be purchased for little more thanthe price of the GP-100 printer, and are considerably cheaperthan the Perkin-Elmer data station to which the LS-5 lumines-cence spectrometer may also be interfaced. The software is alsosimple to use and, with practice, facilitates estimation of initialrates more rapidly than is possible by the analysis of analog data.
LITERATURE CITED
1. BEILBY MJ 1984 Current-voltage characteristics of the proton pump at Charaplasmalemma: I. pH dependence. J Membr Biol 81: 113-125
1262 JENNINGS ET AL.
www.plantphysiol.orgon September 15, 2018 - Published by Downloaded from Copyright © 1988 American Society of Plant Biologists. All rights reserved.
QUANTITATIVE ANALYSIS OF MEMBRANE VESICLE H+ TRANSPORT
2. BENNETT AB, RM SPANSWICK 1983 Optical measurements of ApH and A'I
in corn root membrane vesicles: kinetic analysis of Cl- effects on a proton-translocating ATPase. J Membr Biol 71: 95-107
3. BENNETT AB, RM SPANSWICK 1983 Solubilization and reconstitution of ananion-sensitive H+-ATPase from corn roots. J Membr Biol 75: 21-31
4. BENTRUP F-W, M GOGARTEN-BOEKELS, B HOFFMANN, JP GOGARTEN, CBAUMANN 1986 ATP-dependent acidification and tonoplast hyperpolariza-tion in isolated vacuoles from green suspension cells of Chenopodium rubrumL. Proc Natl Acad Sci USA 83: 2431-2433
5. BLUMWALD E, RJ POOLE 1985 Na+/H+ antiport in isolated tonoplast vesiclesfrom storage tissues of Beta vulgaris. Plant Physiol 78: 163-167
6. BLUMWALD E, RJ POOLE 1986 Kinetics of Ca2+/H+ antiport in isolated tono-plast vesicles from storage tissue of Beta vulgaris L. Plant Physiol 80: 727-731
7. BRISKIN DP, WR THORNLEY, RE WYSE 1985 Membrane transport in isolatedvesicles from sugarbeet taproot: isolation and characterization of energy-dependent, H+-transporting vesicles. Plant Physiol 78: 865-870
8. BRISKIN DP, WR THORNLEY, RE WYSE 1985 Membrane transport in isolatedvesicles from sugarbeet taproot. II. Evidence for a sucrose/Hf+-antiport.Plant Physiol 78: 871-875
9. CHANSON, A, J FICHMANN, D SPEAR, L TAIZ 1985 Pyrophosphate-drivenproton transport by microsomal membranes of corn coleoptiles. Plant Physiol79: 159-164
10. GABATHULER R, RE CLELEND 1985 Auxin regulation of a proton translocatingATPase in pea root plasma membranes. Plant Physiol 79: 1080-1085
11. HAROLD FM 1986 The Vital Force: A Study of Bioenergetics. Freeman, NewYork
12. HEDRICH R, UI FLOGGE, JM FERNANDEZ 1986 Patch-clamp studies of ion-transport in isolated plant vacuoles. FEBS Lett 204: 228-232
13. JENNINGS, IR, D SANDERS 1986 A microcomputer-based system for recordingand analysis of fluorescence signals reporting 4IH+ in membrane vesicles.Plant Physiol 80: S-136
14. JUNGE W, YQ HONG, LP QIAN, V VIALE 1984 Cooperative transient trappingof photosystem II protons by the integral membrane portion (CFO) of chlo-roplast ATP-synthase after mild extraction of the four-subunit catalytic part(CF,). Proc Natl Acad Sci USA 81: 3078-3082
15. LEE HC, JG FORTE, D EPEL 1982 The use of fluorescent amines for the
measurement of pH: application in liposomes, gastric microsomes, and seaurchin gametes. In R Nuccitelli, DW Deamer, eds, Intracellular pH: ItsMeasurement, Regulation and Utilization in Cellular Functions, Alan R Liss,New York pp 135-160
16. LEW RR, RM SPANSWICK 1985 Characterization of anion effects on the nitrate-sensitive ATP-dependent proton pumping activity of soybean (Glycine maxL.) seedling root microsomes. Plant Physiol 77: 352-357
17. MALONEY PC 1979 Membrane HI conductance of Streptococcus lactis. J Bac-teriol 140: 197-205
18. MARQUARDT DW 1963 An algorithm for least squares estimation of non-linearparameters. J Soc Indust Appl Math 11: 431-441
19. METTLER IJ, S MANDALA, L TAIz 1982 Characterization of in vitro protonpumping by microsomal vesicles isolated from corn coleoptiles. Plant Physiol70: 1738-1742
20. O'NEILL SD, RM SPANSWICK 1984 Solubilization and reconstitution of a van-adate-sensitive H+-ATPase from the plasma membrane of Beta vulgaris. JMembr Biol 79: 231-243
21. PERLIN DS, MJD SAN FRANCISCO, CW SLAYMAN, BP ROSEN 1986 H+/ATPstoichiometry of proton pumps from Neurospora crassa and Escherichia coli.Arch Biochem Biophys 248: 53-61
22. POPE AJ, RA LEIGH 1987 Some characteristics of anion transport at the ton-oplast of oat roots, determined from the effects of anions on pyrophosphate-dependent transport. Planta 172: 91-100
23. REA PA, CJ GRIFFITH, MF MANOLSON, D SANDERS 1987 Irreversible inhi-bition of H+-ATPase of higher plant tonoplast by chaotropic anions: evi-dence for peripheral location of nucleotide-binding subunits. Biochim Bio-phys Acta 904: 1-12
24. REA PA, RJ POOLE 1985 Proton-translocating inorganic pyrophosphatase inred beet (Beta vulgaris L.) tonoplast vesicles. Plant Physiol 77: 46-52
25. RoTTENBERG H 1979 The measurement of membrane potential and pH in
cells, organelles and vesicles. Methods Enzymol 55: 547-56926. SZE H 1983 Proton-pumping adenosine triphosphatase in membrane vesicles
of tobacco callus: sensitivity to vanadate and K+. Biochim Biophys Acta732: 586-594
27. WANG Y, RA LEIGH, KH KAESTNER, H SZE 1986 Electrogenic H+-pumpingpyrophosphatase in tonoplast vesicles of oat roots. Plant Physiol 81: 497-502
1263
www.plantphysiol.orgon September 15, 2018 - Published by Downloaded from Copyright © 1988 American Society of Plant Biologists. All rights reserved.
![Tris[tris(ethane-1,2-diamine)cobalt(II)] bis[octacyanidomolybdate(V)] dihydratemypage.just.edu.cn/_upload/article/files/30/fc/684d... · 2017. 6. 8. · Tris[tris(ethane-1,2-diamine)cobalt(II)]](https://img.pdfslide.net/doc/110x75/60d9aab9684bc31d7d4fd5e5/tristrisethane-12-diaminecobaltii-bisoctacyanidomolybdatev-2017-6-8.jpg)


![Bis[tris(1,10-phenanthroline)nickel(II)] tris ... · Bis[tris(1,10-phenanthroline)nickel(II)] tris[dicyanidoargentate(I)] nitrate 4.2-hydrate Muhammad Monim-ul-Mehboob,a Muhammad](https://img.pdfslide.net/doc/110x75/5f74462041fcef38863090d7/bistris110-phenanthrolinenickelii-tris-bistris110-phenanthrolinenickelii.jpg)