Embed Size (px)
Citation preview
Quantitative Aspects of Appearance of Re-cycled Urea in the Digestive Tract of Goats
By YOSHIAKI OBARA* and KOICHI SHIMBAYASHI**
* Department of Physiology, National Institute of Animal Industry (Tsukuba, Ibaraki, 305 Japan)
** Feed Safety Research Division, National Institute of Animal Health (Tsukuba, Ibaraki, 305 Japan)
In domestic ruminants, the rumen has been assumed to be the principal site of appearance of re-cycled urea in the digestive tract. This assumption has been supported by the results of experiments which demonstrated that a large quantity of urea is transferred to the rumen-1,6 >. Moreover two pathways, salivary secretion and direct diffusion through the rumen wall, have been considered to be involved in appearance of blood urea in the rumen 1i>. Juhaszs> and Houpt and Houpt4l
suggested that direct diffusion through the rumen wall was the principal pathway. Nolan and Leng111> found that the amount of recycled urea that appeared in the rumen was approximately 20% of the total amount of re-cycled urea that appeared in the digestive tract. They suggested that the lower part of the digestive tract was an important site of decomposition of blood urea. Furthermore, they suggested that the main pathway for the appearance of urea in the rumen was not direct diffusion through the rumen wall, but salivary secretion. The latter finding was not in agreement with those of other workers.
The present investigation was designed to elucidate first the significance of the rumen in the utilization of re-cycled urea in goats fed on a normal-, low-, and high-protein diet and secondly the quantitative relationship between salivary secretion and diffusion through the rumen wall at the time of appearance of urea in the rumen. This work was published elsewhere by dividing it into two parts, one related to a low-protein ration 11 l and the other related to a high-protein ration 1~> . In
the present paper, consideration is given on changes of urea metabolism accompanied with the amount of nitrogen intake in the domestic ruminant.
Materials and methods
1) Experimental animals and diets Six female goats were used, each of which
had an oesophageal and rumen fistula. They were fed on four rations (ration nos. 1, 2, 3, and 4) once daily at 16 :00 and given water ad lib. According to the feeding schedule shown in Table 1, each ration was given for 4 weeks. The chemical composition of ration nos. l, 2, 3, and 4 is also shown in Table 1. The four rations contained hay, soybean meal, and different proportions of two homeprepared feeds (A and B), details of which are shown in Table 2.
2) Design of experiment Each experiment using two goats was
carried out in the period of 17-24 hr after feeding. The animal was placed in a metabolism cage and the oesophageal fistula was removed for saliva collection. The amount of saliva secreted was measured at the hourly interval using a graduated cylinder. A 5 ml portion of each hourly saliva sample was used for analysis and the remainder was returned to the rumen at a given interval. At the same time a single close of 300-500 mg 15N-urea (90 Atom %) was injected into the jugular vein. Changes in the concentration of 1sNurea in jugular blood and 15NH:, in the rumen
285
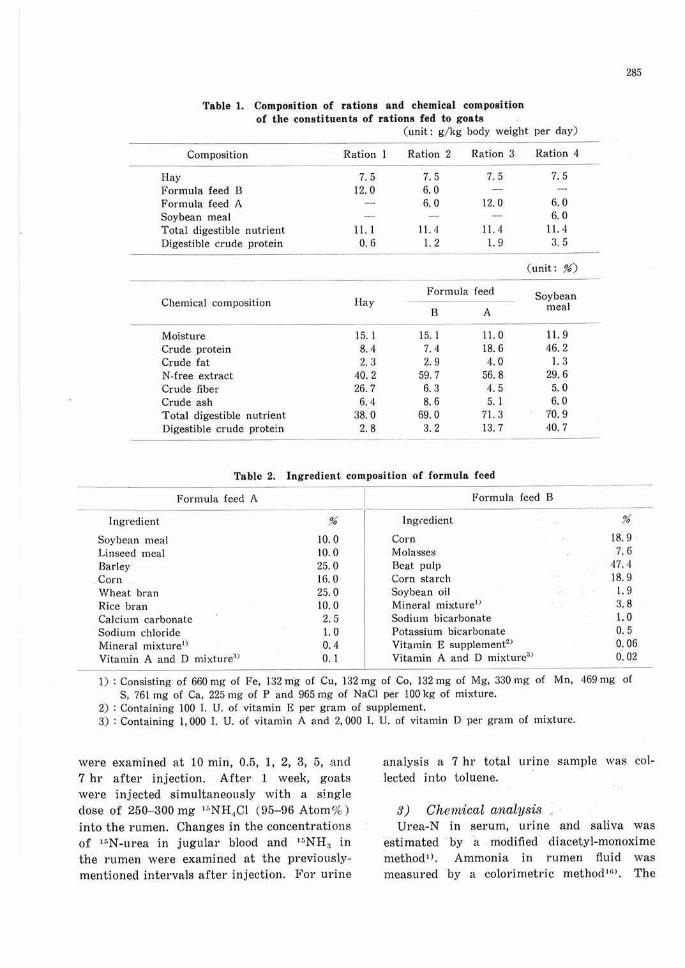
Table 1. Composition of rations and chemical composition of the constituents of rations fed to goats
Composition
Hay Formula feed B Formula feed A Soybean meal Total digestible nutrient Digestible crude protein
Chemical composition
Moisture Crude protein Crude fat N-free extract Crude fiber Crude ash Total digestible nutrient Digestible crude protein
Ration
7.5 12. 0
11. I 0.6
Hay
15. I 8. 4 2.3
40.2 26. 7 6. <)
38.0 2.8
( unit: g / kg body weight per day)
Ration 2
7.5 6. 0 6.0
11.4 l. 2
Ration 3
7.5
12.0
11. 4 1. 9
Formula feed
B A
15. I 7.4 2. 9
59. 7 6.3 8.6
69.0 3. 2
11. 0 18.6 4. 0
56.8 4.5 5. 1
71. 3 13. 7
Ration ,1
7. 5
6.0 6.0
11. 4 3.5
( unit: %)
Soybean meal
11. 9 46.2 1. 3
29.6 5.0 6.0
70.9 40. 7
Table 2. Ingredient composition of formula feed
Ingredient
Soybean meal Linseed meal Barley Corn Wheat bran Rice bran
Formula feed A
Calcium carbonate Sodium chloride Mineral mixture•> Vitamin A and D nli'xture3'
%
10.0 10.0 25.0 rn.o 25.0 10.0 2.5 1. 0 0. 4 0. I
Formula reed B
lng<e<lient
Corn Mola.sses Beat pulp Corn starch Soybean oil Mineral mixtureD Sodium bicarbonate Potassium bicarbonate Vitamin E supplement2> Vitamin A and D mixture31
18.9 7.6
47. 4 18. 9
I. 9 3.8 l. 0 0. 5 0.06 6. 02
1) : Consisting of 660 mg of Fe, 132 nig of Cu, 132 mg of Co, 132 mg of Mg, 330 mg of Mn, 469 mg of S, 761 mg of Ca, 225 mg of P and 965 mg of NaCl per 100 kg of mixture.
2) : Containing 100 I. U. of vitamin E per gram of supplement. 3) : Containing 1, 000 I. U. of vitamin A and 2, 000 I. U. of vitamin D per gram of mixture.
were examined at 10 min, 0.5, 1, 2, 3, 5, and 7 hr after injection. After 1 week, goats were injected simultaneously with a single dose of 250-300 mg 15NH.,CI (95- 96 Atom%) into the rumen. Changes in the concentrations of 10N-urea in jugular blood and '~NH3 in the rumen were examined at the previouslymentioned intervals after injection. For urine
analysis a 7 hr total urine sample was collected into toluene.
3) Chenvical analysis Urea-N in sel,'um, urine and saliva was
estimated by a modified diacetyl-monoxime method •l . Ammonia in rumen fluid was measured by a colorimetric method •~l . The
286
determination of 16N in the urea of serum, urine and saliva and NH3 of rumen content was carried out by the method reported by Obar a and Shimbayashi 11 >.
A 16N-analyzer (model NIA-1; Nippon Bunko Co., Ltd. Tokyo) was used for estimation of 16N.
4) Mathematical procedures The results of the 15N tracer experiment
were obtained by mathematic treatment of experimental values using the method reported by Nolan and Leng10>. The pool size and the irreversible loss rate with respect to the pool into which an isotope was injected were calculated from equations for the curves by standard procedure10 l . The rate of flow of nitrogen associated with rumen fluid NH3 and the serum urea pool was obtained by solving a general two-pool open-compartment model reported by Obara and Shimbayashi 11>.
Results
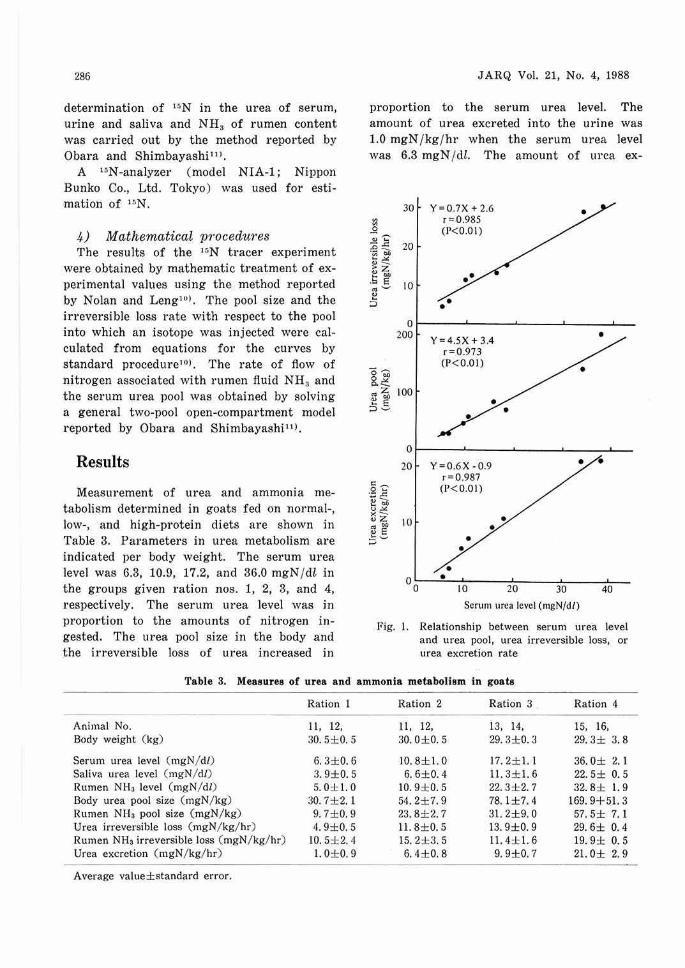
Measurement of urea and ammonia metabolism determined in goats fed on normal-, low-, and high-protein diets are shown in Table 3. Parameters in urea metabolism are indicated per body weight. The serum urea level was 6.3, 10.9, 17.2, and 36.0 mgN/dl in the groups given ration nos. 1, 2, 3, and 4, respectively. The serum urea level was in proportion to the amounts of nitrogen ingested. The urea pool size in the body and the irreversible loss of urea increased in
JARQ Vol. 21, No. 4, 1988
proportion to the serum urea level. The amount of urea excreted into the urine was 1.0 mgN /kg/hr when the serum urea level was 6.3 mgN / dl. The amount of urea ex-
30 Y=0.7X+2.6 "' "'
r=0.985 .2 (P<0.01) "' ... -,:: 20 .o __
·;; 00 ... -" ., __ ~t
.!:o E 10 .. ~ 1::
:::>
0 200 Y =4.5X + 3.4
r =0.973
o~ (P<0.01)
8.1 :~ 100 ... E ::i-
0
20 Y=0.6X -0.9 • • C ,..._ 0 ...
·~~ <> -"
r=0.987 (P<0.01)
x --.,z 10 • : E' • :;- •
• •
00 • 10 20 30 40
Scrum urea level (mgN/df)
Fig. l. Relationship between serum urea level a nd urea pool, urea irreversible loss, or urea excretion rate
Table 3. Measures of urea and ammonia metabolism in goats
Ration l Ration 2 Ration 3 Ration 4
Animal No. 11, 12, ll, 12, 13, 14, 15, 16, Body weight ( kg) 30. 5± 0. 5 30. 0± 0. 5 29. 3± 0. 3 29. 3 ± 3. 8
Serum urea level ( mgN/ dl) 6. 3± 0. 6 10. 8± 1. 0 17. 2± 1.l 36. 0± 2. 1 Saliva urea level ( mgN/ dl) 3. 9± 0. 5 6. 6± 0.4 11.3± 1.6 22. 5± 0. 5 Rumen NH3 level ( mgN/ dl) 5. 0±1. 0 10. 9±0. 5 22. 3±2. 7 32. 8± 1. 9 Body urea pool size ( mgN/ kg) 30. 7± 2. 1 54. 2±7. 9 78. 1±7. 4 169. 9+51. 3 Rumen NH3 pool size ( mgN/ kg) 9. 7± 0. 9 23. 8± 2. 7 31. 2± 9. 0 57. 5± 7.1 Urea irreversible loss (mgN/ kg/ hr) 4. 9± 0. 5 11.8± 0.5 13. 9± 0. 9 29. 6± 0. 4 Rumen NH3 irreversible loss ( mgN/ kg/ hr) 10. 5±2. 4 15. 2±3. 5 11. 4±1.6 19. 9± 0. 5 Urea excretion (mgN/ kg/ hr) 1.0±0. 9 6. 4±0. 8 9. 9±0. 7 21. 0± 2. 9
Average value±standard error.
Ration I Blood urea pool Urea excretion rate
urea lcvc!' 6.3 mgN/d/ 31.0
118.0 --------70.7 (59.9%) 47.3 (40.1%)
/~ Saliva Diffusion
sccrrion I 7. I ( 11.2%) 63.6 (88.8%)
Rumen ammonia pool ammonia level 5.0 mgN/d /
Ration 3
Lower tract ammonia pool
Blood urea pool Urea excretion rate urea level 17 .2 mgN/d/ 29 1.4
115.0 ---------25.2 (21.9%) 89.8 (78.1%)
/~ Saliva Diffusion
I 10.0 (39.7%)
secret ion I
!S.2 60.3%)
Rumen ammonia pool ammonia level 22.3 mgN/d/
Lower tract
ammonia pool
287
Ration 2 llloocl urea pool Urea excretion rate
urea level I 0.8 mgN/d/ 194.0
159.S --------78.6 (49.3%) 80.9 (50.7%)
/~ Saliva Di'ffusion
secryion I 14.8 (23.1 %) 63.8 (76.9%)
Rumen ammonia pool
ammonia level 10.9 mgN/d/
Lower tract ammo11ia pool
Ration 4 Blood urea pool Urea excretion rate
urea level 36.0 mgN/d/ 615.4
251.6
----- -----36.0 (14.3%) 2 1S.6 (85.7%)
/~ Saliva Diffusion
sccrrion I 29.9 (83.1%) 6 I (16.9%)
' Rumen ammonia pool ammonia level 32.8 mgN/d/ ammonia pool
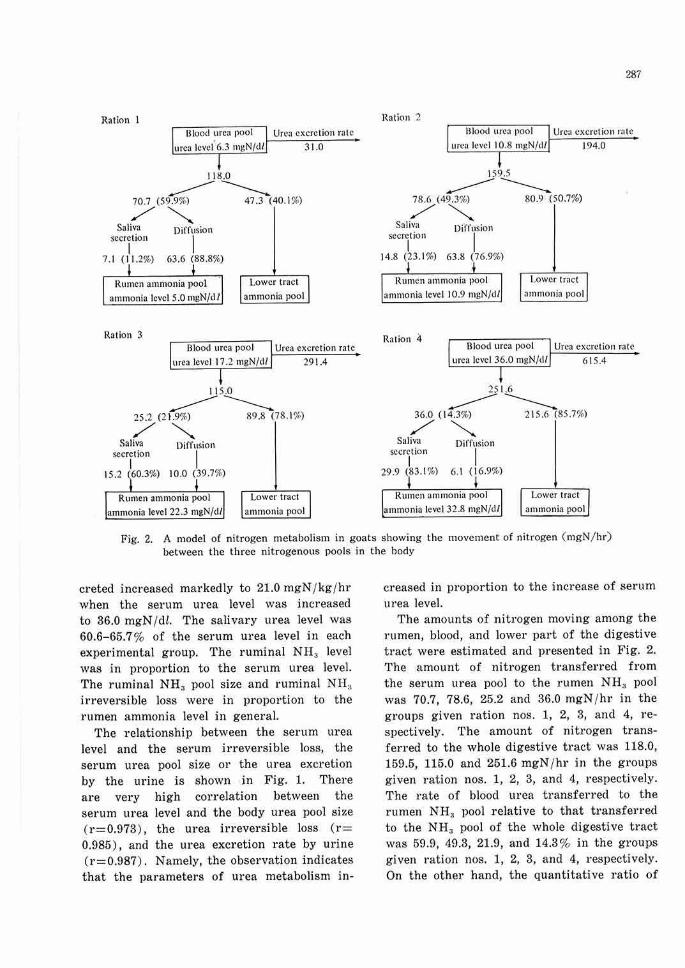
Fig. 2. A model of nitrogen metabolism in goats showing the movement of nitrogen (mgN/hr) between the three nitrogenous pools in the body
creted increased markedly to 21.0 mgN /kg /hr when the serum urea level was increased to 36.0 mgN/dl. The salivary urea level was 60.6-65.7% of the serum urea level in each experimental group. The ruminal NH 3 level was in proportion to the serum urea level. The ruminal NH3 pool size and ruminal NH3
irreversible loss were in proportion to the rumen ammonia level in general.
The relationship between the serum urea level and the serum irreversible loss, the serum urea pool size or the urea excretion by the urine is shown in Fig. 1. There are very high correlation between the serum urea level and the body urea pool size ( r = 0.973), the urea irreversible loss (r= 0.985), and the urea excretion rate by urine (r=0.987). Namely, the observation indicates that the parameters of urea metabolism in-
creased in proportion to the increase of serum urea level.
The amounts of nitrogen moving among the rumen, blood, and lower part of the digestive tract were estimated and presented in Fig. 2. The amount of nitrogen transferred from the serum urea pool to the rumen NH3 pool was 70.7, 78.6, 25.2 and 36.0 mgN /hr in the groups given ration nos. l, 2, 3, and 4, respectively. The amount of nitrogen transferred to the whole digestive tract was 118.0, 159.5, 115.0 and 251.6 mgN /hr in the groups given ration nos. 1, 2, 3, and 4, respectively. The rate of blood urea transfened to the rumen NH3 pool relative to that transferred to the NH3 pool of the whole digestive tract was 59.9, 49 .3, 21.9, and 14.3% in the groups given ration nos. 1, 2, 3, and 4, respectively. On the other hand, the quantitative ratio of
288
Ration I
Ration 2
Ration 3
Ralion 4
0 200
0 Urine ,.;xm.:tion rail'
m Amounl of urea transfcrrl~d to lower tract
• /\mount of urea t ninsf'crrccl to rumen
400 600 800 Rate of transfer of urea N (mgN/hr)
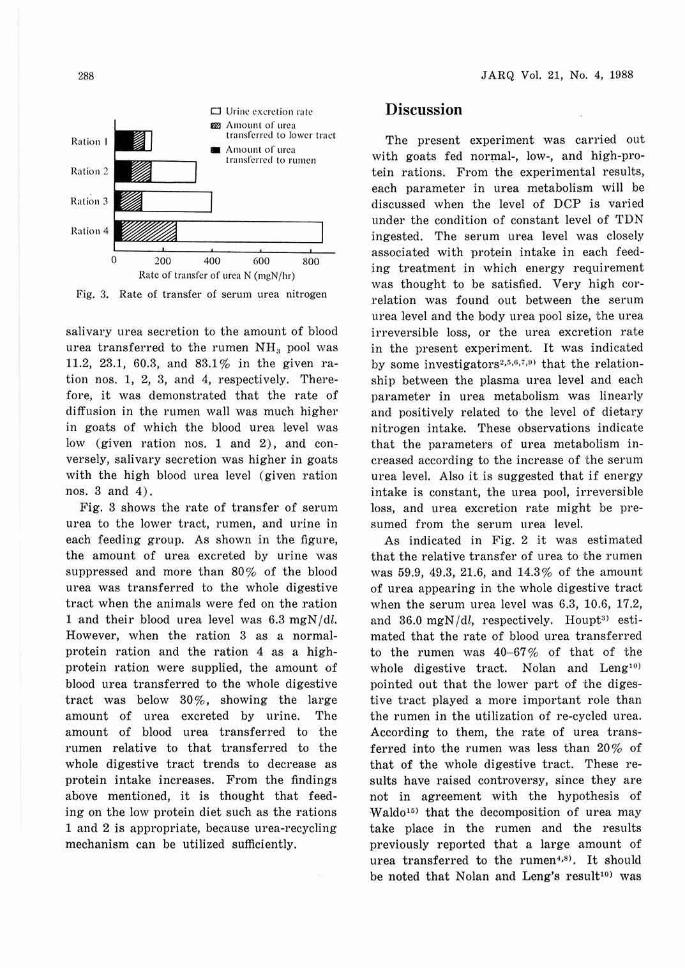
Fig. 3. Rate of transfer of serum urea nitrogen
salivary urea secretion to the amount of blood urea transferred to the rumen NH3 pool was 11.2, 23.1, 60.3, and 83.1 % in the given ration nos. 1, 2, 3, and 4, respectively. Therefore, it was demonstrated that the rate of diffusion in the rumen wall was much higher in goats of which the blood urea level was low (given ration nos. 1 and 2), and conversely, salivary secretion was higher in goats with the high blood urea level (given ration nos. 3 and 4) .
Fig. 3 shows the rate of transfer of serum urea to the lower tract, rumen, and urine in each feeding group. As shown in the figure, the amount of urea excreted by urine was suppressed and more than 80% of the blood urea was transferred to the whole digestive tract when the animals were fed on the ration 1 and their blood urea level was 6.3 mgN/ dl. However, when the ration 3 as a normalprotein ration and the ration 4 as a highprotein ration were supplied, the amount of blood urea transferred to the whole digestive tract was below 30%, showing the large amount of urea excreted by urine. The amount of blood urea transferred to the rumen relative to that transferred to the whole digestive tract trends to decrease as protein intake increases. From the findings above mentioned, it is thought that feeding on the low protein diet such as the rations 1 and 2 is appropriate, because urea-recycling mechanism can be utilized sufficiently.
JARQ Vol. 21, No. 4, 1988
Discussion
The present experiment was carried out with goats fed nor~al-, low-, and high-protein rations. From the experimental results, each parameter in urea metabolism will be discussed when the level of DCP is varied under the condition of constant level of TDN ingested. The serum urea level was closely associated with protein intake in each feeding treatment in which energy requirement was thought to be satisfied. Very high correlation was found out between the serum urea level and the body urea pool size, the urea irreversible loss, or the urea excretion rate in the present experiment. It was indicated by some investigators2,5,o,,,o) that the relationship between the plasma urea level and each parameter in urea metabolism was linearly and positively related to the level of dietary nitrogen intake. These observations indicate that the parameters of urea metabolism increased according to the increase of the serum urea level. Also it is suggested that if energy intake is constant, the urea pool, irreversible loss, and urea excretion rate might be presumed from the serum urea level.
As indicated in Fig. 2 it was estimated that the relative transfer of urea to the rumen was 59.9, 49.3, 21.6, and 14.3% of the amount of urea appearing in the whole digestive tract when the serum urea level was 6.3, 10.6, 17.2, and 36.0 mgN/ dl, respectively. Houpt3> estimated that the rate of blood urea transferred to the rumen was 40-67 % of that of t he whole digestive tract. Nolan and Leng10>
pointed out that the lower part of the digestive tract played a more important role than the rumen in the utilization of re-cycled urea. According to them, the rate of urea transferred into the rumen was less than 20 % of that of the whole digestive tract. These results have raised controversy, since they are not in agreement with the hypothesis of Waldo15 > that the decomposition of urea may take place in the rumen and the results previously reported that a large amount of urea transferred to the l'Umen-1,s> . It should be noted that Nolan and Leng's result10> was
obtained from the animal .in which the plasma urea level was as high as 22.5 mgN/ dl. In the present experiment, the rate was 21.9% when the serum urea level was 17.2 mgN/dl. This result agreed quite well with that of their experiment.
The results in the present experiment pointed out that in ruminants given a lowprotein ration re-cycled urea was presumed to be utilized in the rumen. However, in ruminant which had ingested a sufficient or excessive amount of nitrogen, the rumen was assumed to be replaced as the site of appearance of re-cycled urea by the lower part of digestive tract. Urea re-cycling in domestic ruminants seems to vary greatly with the amount of nitrogen ingested and the serum urea level.
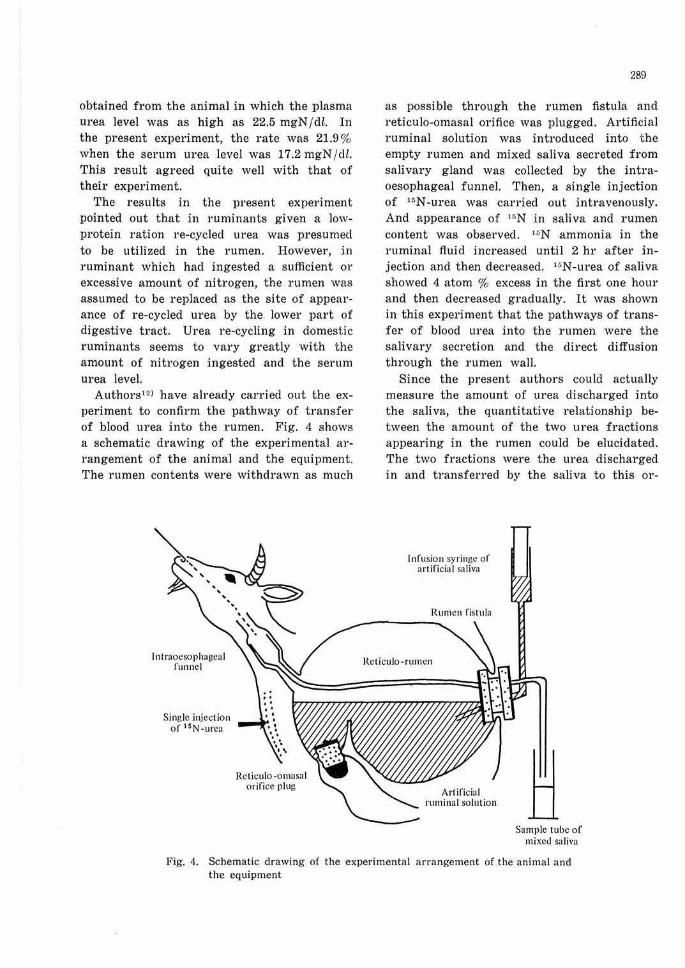
Authors12 > have already carried out the experiment to confirm the pathway of transfer of blood urea into the rumen. Fig. 4 shows a schematic drawing of the experimental arrangement of the animal and the equipment. The rumen contents were withdrawn as much
1 n t raoesophagea I funnel
Single inject ion of 15N-urea
Reticulo-omasal orifice plug
28~)
as possible through the rumen fistula and reticulo-omasal orifice was plugged. Artificial ruminal solution was introduced into the empty rumen and mixed saliva secreted from salivary gland was collected by the intraoesophageal funnel. Then, a single injection of l 0N-urea was carried out intravenously. And appearance of 15N in saliva and 1·umen content was observed. u,N ammonia in the ruminal fluid increased until 2 hr after injection and then decreased. 15N-urea of saliva showed 4 atom % excess in the first one hour and then decreased gradually. It was shown in this experiment that the pathways of transfer of blood urea into the rumen were the salivary secretion and the direct diffusion through the rumen wall.
Since the present authors could actually measure the amount of urea discharged into the saliva, the quantitative relationship between the amount of the two urea fractions appearing in the rumen could be elucidated. The two fractions were the urea discharged in and transferred by the saliva to this or-
Infusion syringe or artificial sa liva
Artificial ruminal solution
Sample tube of mixe<I saliva
Fig. 4. Schematic drawing of the experimental arrangement of the animal and the equipment
290
gan and urea diffused in the rumen wall. As a result, the quantitative ratio of salivary urea secretion to the rate of transfer of blood urea to ruminal NH3 was 11.2, 23.1, 60.3 and 83.1 %, when the serum urea level was 6.3, 10.6, 17.2 and 36.0 mgN /dl, respectively. It was assumed that the diffusion in the rumen wall might be a principal pathway involved in the appearance of urea in the rumen of goats fed a low-protein ration. However, it was estimated that more than 80% of the amount of urea appearing in the rumen in goats fed a high protein ration might have been derived from urea discharged in saliva. These results reveal an outstanding fact; that is, the serum urea level varies with the amount of nitrogen ingested, and the reverse occurs in the ratio of salivary secretion vs. urea diffusion in the rumen. Further experiments may be necessary before the mechanism of reversion of this ratio is clarified.
The parameter of urea metabolism in domestic ruminants may be influenced not only by the content of nitrogen but also by the quality of carbohydrate and other nutrients of food contained in the rumen at the time. An improvement in feeding techniques seems to be required to make the rumen display its function sufficiently and to economize the nitrogen content of a ration.
References
1) Coulombe, J. J. & Favreau, L.: A 11ew simple semimicromethod for colorimetric determination of urea. Clin. Chem., 9, 102-108 (1963).
2) Ford, A. L. & Milligan, L. P. : Tracer studies of urea recycling in sheep. Can. J. Anim. Sci., 50, 129-135 (1970).
3) Houpt, T. R.: Utilization of blood urea in ruminants. Am. J. Physiol., 197, 115-120 (1959).
4) Houpt, T. R. & Houpt, K. A.: Transfer of
JARQ Vol. 21, No. 4, 1988
urea nitrogen across the rumen wall. Am. J. Physiol., 214, 1296-1303 (1968).
5) Ide, Y. : Observa.tions on plasma urea turnover and renal urea excretion in goats. Jpn. J. Vet. Sci., 33, 179-185 (1971) .
6) Ide, Y.: Quantitative aspect of the endogenous urea cycle in goats. Jpn. J. Vet. Sci., 37, 327-333 (1975).
7) Ide, Y., Shimbayashi, K. & Yonemura, 'f.: Effect of dietary conditions upon serum and milk urea nitrogen in cows. I. Serum and milk urea nitrogen as affected by protein intake. Jpn. J. Vet. Sci., 28, 321-327 (1966).
8) Juhasz, B.: Endogenous nitrogen cycle ruminants. Acta .. Vet. Acad. Sci. Hung., 15, 25-34 (1965).
9) Mugerwa, J. S. & Conrad, H. R.: Relationship of dietary nonprotein nitrogen to urea kinetics in dairy cows. J. Nutr., 101, 1331-1342 (1971).
10) Nolan, J. V. & Leng, R. A. : Dynamic aspects of ammonia and urea metabolism in sheep. 81-. J. N1tt1'., 27, 177- 194 (1972).
11) Ohara, Y. & Shimbayashi, K.: The appearance of re-cycled urea in the digestive tract of goats during the final third of .a once daily feeding of a low protein ration. 81·. J. Nutr., 44, 295- 305 (1980).
12) Ohara, Y. & Shimbayashi, K.: The pathway of transfer blood urea into the 1·umen and its quantitative relationship in goats with empty rumen. Jpn. J. Zootech. Sci., 51, 347-351 (1980) [In Japanese with English summary).
13) Ohara, Y. & Shimbayashi, K.: The appearance of recycled urea in the digestive t1·act of goats fed a high-protein ration. J?m. J. Zootech. Sci., 58, 611- 617 (1987).
14) Seligson, D. & Seligson, H.: Micro-diffusion method for the determination of nitrogen liberated as ammonia. J. Lab. Clin. Med., 38, 324-330 (1951).
15) Waldo, D. R.: Simposium; Nitrogen utilization by the ruminant. Nitrogen metabolism in the ruminant. J. Dairy Sci., 51, 265-275 (1968) .
16) Weatherburm, M. W.: Phenol-hypochlorite reaction fo1· determination of ammonia. Analyt. Che'l'li., 39, 971-974 (1967) .
(Received for publication, October 16, 1987)