Embed Size (px)
Citation preview

Quantitative Assessment of Structural Components for Construction
Management Using Laser Scanning Data
Linh TRUONG-HONG and Roderik LINDENBERGH, Netherlands
Key words: Point Cloud, Structural Component Extraction, Segmentation, Deformation,
Surface Defects, Inspection
SUMMARY
Defects in a construction site is inevitable and these defects must be inspected and reported
timely to minimize extract cost due to repair the defects. However, in practice, quality of
structural elements is often inspected by a site supervisor with traditional tools (e.g. measuring
tapes, total stations or levelling) at only specific locations on the structures. That results the
current inspection pipeline is subjective and inefficient. As such, a new approach must develop
to support project managers reporting surface defects timely and using a digital tool in project
management efficiently. A great achievement of laser scanning platforms allows to acquire
three-dimensional (3D) topographic data of structures' surfaces in a construction site quickly
and accurately. A current terrestrial laser scanner (TLS) can capture more than a million points
per second with a sub-millimetre accuracy. This technology has been gradually implemented
in evaluating progress, quality and quantity, and visualisation for construction management.
However, a processing point cloud requires intensive labour work because of the complexity of
the construction site and massive data points. This paper is to develop the algorithm to
automatically access structural components for quality control of the construction project, in
which the proposed method is focused to evaluate the flatness of the floors and ceiling. The
method starts to decompose the point cloud of the building storey into 2D cells by using a
quadtree. Subsequently, a combination of kernel density estimation (KDE) and cell-based
segmentation (CbS) to extract the data point affiliated surfaces of the floor and ceiling. Next,
edges of the slabs are detected and then are used to generate the reference surface to compute
deformations by using both point- and cell-surface methods. The proposed method is tested on
23.9-million-point cloud of a storey of the reinforced concrete building acquired from the TLS.
An experimental test shows the proposed method successfully extracts all surfaces of the floors
and ceiling and a report also shows the slab deformation varying in a range from -36.04mm to
42.03mm for point-surface method and about 75% of the deformation is within a range of mean
standard deviation.
Quantitative Assessment of Structural Components for Construction Management Using Laser Scanning Data (10576)
Linh Truong-Hong and Roderik Lindenbergh (Netherlands)
FIG Working Week 2020
Smart surveyors for land and water management
Amsterdam, the Netherlands, 10–14 May 2020
Quantitative Assessment of Structural Components for Construction
Management Using Laser Scanning Data
Linh TRUONG-HONG and Roderik LINDENBERGH, Netherlands
1. INTRODUCTION
In construction projects, defects of structural components are inevitable, which can cost about
10.29% of the complete costs in civil infrastructure projects (Love Peter, 2002). To minimize
time and extra cost due to repair these defects, the defective components must be identified at
an early phase of the project. However, in current practice, inspecting defects is mostly manual
interpretation of the geometric data at specific locations on the structure, which are acquired
from measuring tapes, levelling or total stations. That leads to inspection results are subjective
and insufficient to address detailed status of the structural components. Therefore, project
managers cannot identify the defective components timely, accurately and objectively, and are
difficult to integrate inspection results into digital tools to improve efficiency of the project
management.
A terrestrial laser scanning can capture a highly detailed three-dimensional (3D) scene
accurately and quickly, used at many construction sites in recent years. A point cloud is then
processed for construction progress monitoring, as-built BIM, and quality control. For example,
Turkan et al. (Turkan, 2014) proposed a method to monitoring construction progress based on
secondary and temporary components in a construction site. from a 3D point cloud, but an
accuracy can be improved by fusing additional information like color and 3D edge information.
Additionally, recent effort in automatically extracting the structural components from the point
cloud can be highlight by the work of Maalek et al. (Maalek et al., 2019) who introduce a planar
segmentation based on linear features of the data points, a hierarchical clustering technique and
context information of the structures to extract the floors, columns and rebars of reinforced
concrete structures of regular rectangular buildings. In assessing dimensions of precast concrete
elements, Kim et al. (Kim et al., 2016) used a principal component analysis to extract data
points of surfaces, and edges and corners are subsequently extracted to determine the
dimensions as well as to map to an as-design model for deviation assessment. Moreover, Wang
et al. (Wang et al., 2017) proposed one-class support vector machine approach linearity,
planarity and red-green-blue colors of the point cloud to extract individual rebars in concrete
structures for quality assurance and control. Additionally, in practice, process pipelines based
on commercial software (e.g. Revit, Autodesk Navisworks, Archicad) are still primarily manual
through an interactive manner, in which users use as-built functions to process a point cloud,
for example, segmentation and shape fitting. There work requires experienced users who can
handle massive and complex data sets. Thus, efficient, automatic extraction of the structural
components of the construction project is still high challenge.
To inspect the structures, Bosché and Guenet (Bosché and Guenet, 2014) mapped 3D point
cloud to as-design BIM model and extracted a point cloud matching to a structural components
in the BIM. Subsequently, Straightedge and F-Numbers were used to measure the deviation
between the point cloud and BIM to identify a discrepancy between the as-design BIM and a
Quantitative Assessment of Structural Components for Construction Management Using Laser Scanning Data (10576)
Linh Truong-Hong and Roderik Lindenbergh (Netherlands)
FIG Working Week 2020
Smart surveyors for land and water management
Amsterdam, the Netherlands, 10–14 May 2020
real construction for each floor. The authors also reported that this approach is given higher
quality and much efficiency than that from the traditional methods. Moreover, Tang et al. (Tang
et al., 2011) proposed three algorithms to inspect a floor defects through the surface flatness,
which included range filtering, deviation filtering and sliding window, which a main difference
between these methods is noise filtering algorithm. Principles of these methods is that after
removing noise data of the surface, deviations between the points and the reference surface
were computed to identify the surface flatness. Moreover, Truong-Hong and Lindenbergh
(Truong-Hong and Lindenbergh, 2019) proposed point-surface, point-cell and cell-cell methods
to measure deformation of the structure from a laser scanning data, which were then applied to
estimate a vertical clearance of the bridge.
This paper proposes a new method to automatically extract point clouds describing floor and
ceiling of the building. this work is done by using kernel density estimation (KDE) and a cell-
based segmentation (CbS) to extract patches within 2D cells in the xy plane and to segment the
patches belonging the surfaces of the floor and ceiling, respectively. Subsequently, point-
surface (PS) and cell-surface (CS) methods are used to measure deformations of the floor and
ceiling for identifying surface defects.
2. PROPOSED METHOD
In a construction project, when the storey is constructed completely, dimension quality control
and surface defect detection of structural elements must be reported timely and accurately for
decision making. A new storey can only start to construct when the report of quality control of
constructed storey is approved. Moreover, an inspection often carries out for each storey
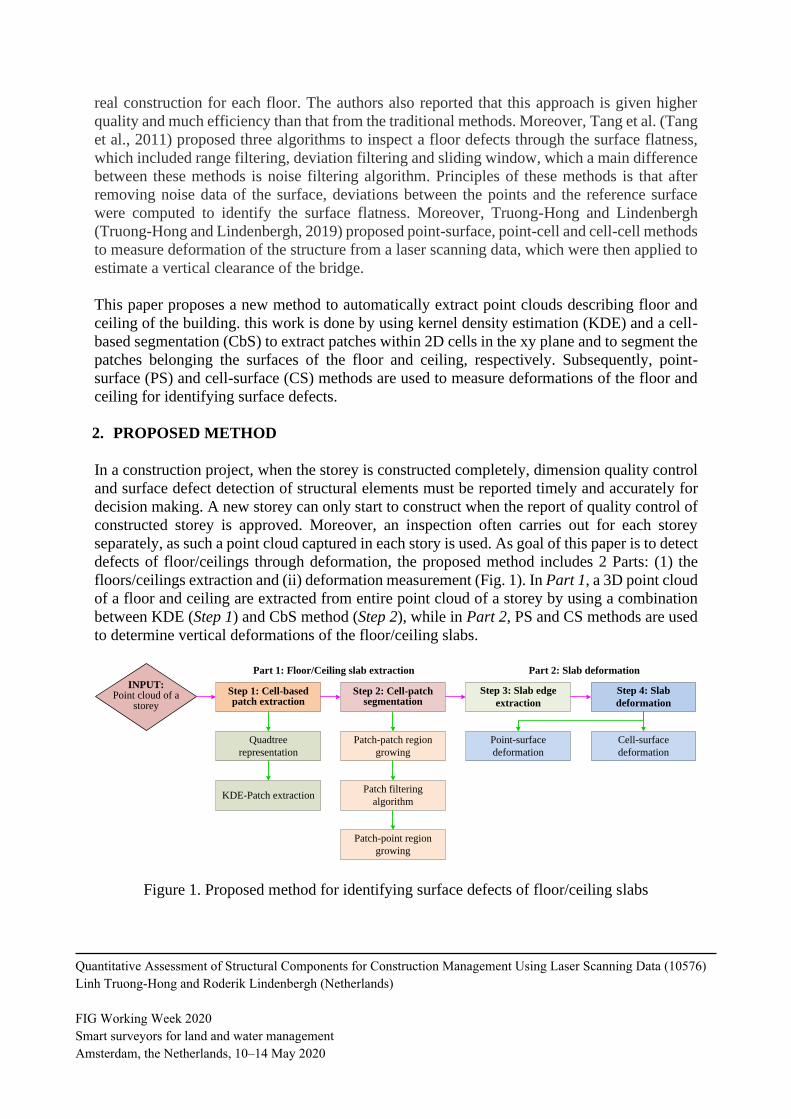
separately, as such a point cloud captured in each story is used. As goal of this paper is to detect
defects of floor/ceilings through deformation, the proposed method includes 2 Parts: (1) the
floors/ceilings extraction and (ii) deformation measurement (Fig. 1). In Part 1, a 3D point cloud
of a floor and ceiling are extracted from entire point cloud of a storey by using a combination
between KDE (Step 1) and CbS method (Step 2), while in Part 2, PS and CS methods are used
to determine vertical deformations of the floor/ceiling slabs.
Figure 1. Proposed method for identifying surface defects of floor/ceiling slabs
INPUT: Point cloud of a
storey
Quadtree
representation
KDE-Patch extraction
Patch-patch region
growing
Patch filtering
algorithm
Patch-point region
growing
Step 1: Cell-based patch extraction
Step 2: Cell-patch segmentation
Step 3: Slab edge
extraction
Step 4: Slab
deformation
Cell-surface
deformation
Point-surface
deformation
Part 1: Floor/Ceiling slab extraction Part 2: Slab deformation
Quantitative Assessment of Structural Components for Construction Management Using Laser Scanning Data (10576)
Linh Truong-Hong and Roderik Lindenbergh (Netherlands)
FIG Working Week 2020
Smart surveyors for land and water management
Amsterdam, the Netherlands, 10–14 May 2020

Moreover, in reinforced concrete buildings, at the construction stage, floors/ceilings, or also
called floor and ceiling slabs, appear as flat horizontal surfaces. The slab is a part of the
floor/ceiling slabs supported by beams, columns and walls (Fig. 2).
Figure 2. Structural elements in common reinforced concrete buildings
1.1 Part 1 - Floor/ceiling slab extraction
Step 1: Cell-based patch extraction
A point cloud (Pstorey = (pi R3) of a storey building is decomposed into 2D cells (C = {c1, . . .
ci, cN}, i = [1, N]) by using a quadtree to recursively subdivide an initial minimum 2D bounding
box of the points Pst along the x- and y- directions in a Cartesian coordinate system. Although
many criteria are used to define a terminated subdivision conditions, the cell size is used in this
study, which means the size of the cells on leaf nodes of the quadtree must be smaller than the
cell size threshold. A selection of the cell size must be guarantee there is at least one cell can
be represented the slab. Additionally, the cell is classified as “full” if it occupies a number of
the points exceeding a predefined threshold called min_ptc; otherwise it is known as “empty”.
Thus, each cell ci describes as a tuple (two opposite corners: [xmin, ymin; xmax, ymax];
classification: empty/full; points: Pci = (pci = {xi, yi, zi) | Pci Pstorey}).
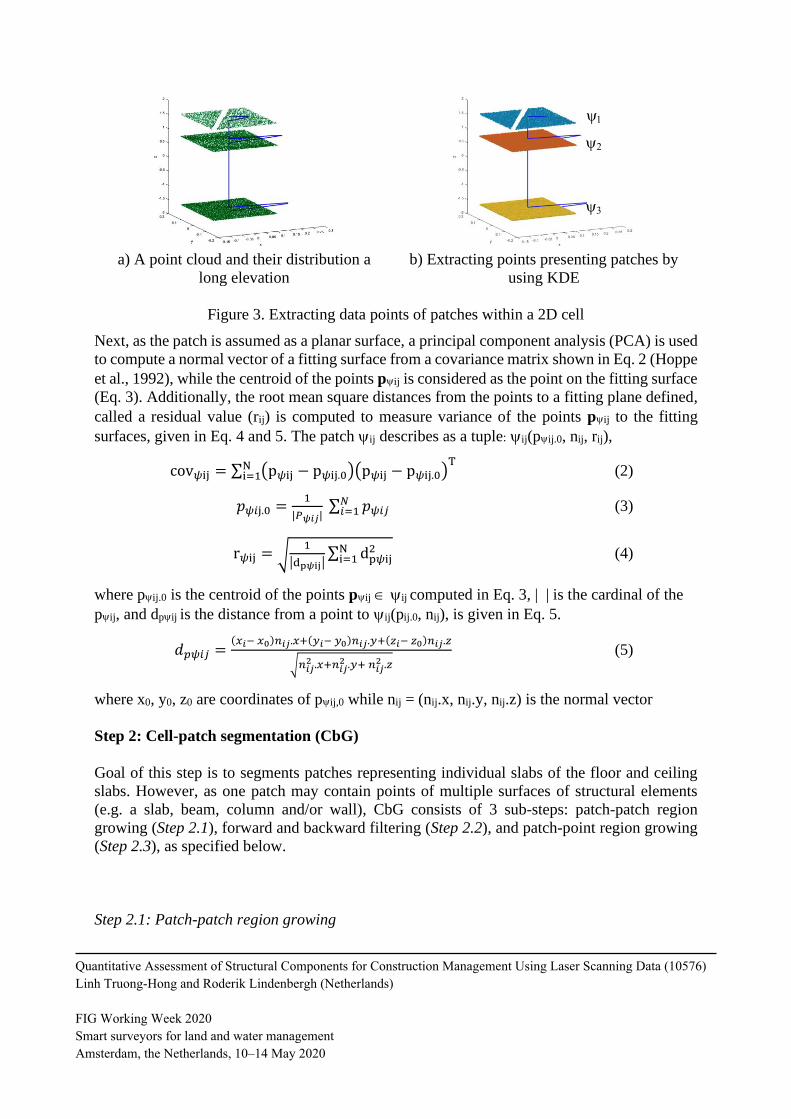
The 2D cell ci may contain a point cloud of surfaces’ patches ( = {i1, ij ,…, in}) of many
structural components (e.g. floor, ceiling, beam or column) (Fig. 3a). Thus, the data points
affiliated to a patch ij are extracted by KDE generated from the z-coordinate of the points
(Laefer and Truong-Hong, 2017). As the patches of the slab’s surface is often a horizontal plane
and their locations are in separate positions in the vertical locations, the points belonging to the
patch are located within two consecutive valleys of KDE (Fig. 3b), which can be expressed in
Eq. 1
ij = (pij | zvaley, k pij.z zvaley,k+1) (1)
where zvaley,k and zvaley,k+1 are coordinates of two consecutive valleys of the PDS.
Slab, i
BeamSlab, j
Wall Columns Floor slab
Ceiling slab
Quantitative Assessment of Structural Components for Construction Management Using Laser Scanning Data (10576)
Linh Truong-Hong and Roderik Lindenbergh (Netherlands)
FIG Working Week 2020
Smart surveyors for land and water management
Amsterdam, the Netherlands, 10–14 May 2020
1
2
3
a) A point cloud and their distribution a
long elevation
b) Extracting points presenting patches by
using KDE
Figure 3. Extracting data points of patches within a 2D cell
Next, as the patch is assumed as a planar surface, a principal component analysis (PCA) is used
to compute a normal vector of a fitting surface from a covariance matrix shown in Eq. 2 (Hoppe
et al., 1992), while the centroid of the points pij is considered as the point on the fitting surface
(Eq. 3). Additionally, the root mean square distances from the points to a fitting plane defined,
called a residual value (rij) is computed to measure variance of the points pij to the fitting
surfaces, given in Eq. 4 and 5. The patch ij describes as a tuple: ij(pij.0, nij, rij),
cov𝜓ij = ∑ (p𝜓ij − p𝜓ij.0)(p𝜓ij − p𝜓ij.0)TN
i=1 (2)
𝑝𝜓𝑖j.0 =1
|𝑃𝜓𝑖𝑗| ∑ 𝑝𝜓𝑖𝑗
𝑁𝑖=1 (3)
r𝜓ij = √1
|dp𝜓ij|∑ dp𝜓ij
2Ni=1 (4)
where pij.0 is the centroid of the points pij ij computed in Eq. 3, | | is the cardinal of the
pij, and dpij is the distance from a point to ij(pij.0, nij), is given in Eq. 5.
𝑑𝑝𝜓𝑖𝑗 =(𝑥𝑖− 𝑥0)𝑛𝑖𝑗.𝑥+(𝑦𝑖− 𝑦0)𝑛𝑖𝑗.𝑦+(𝑧𝑖− 𝑧0)𝑛𝑖𝑗.𝑧
√𝑛𝑖𝑗2 .𝑥+𝑛𝑖𝑗
2 .𝑦+ 𝑛𝑖𝑗2 .𝑧
(5)
where x0, y0, z0 are coordinates of pij,0 while nij = (nij.x, nij.y, nij.z) is the normal vector
Step 2: Cell-patch segmentation (CbG)
Goal of this step is to segments patches representing individual slabs of the floor and ceiling
slabs. However, as one patch may contain points of multiple surfaces of structural elements
(e.g. a slab, beam, column and/or wall), CbG consists of 3 sub-steps: patch-patch region
growing (Step 2.1), forward and backward filtering (Step 2.2), and patch-point region growing
(Step 2.3), as specified below.
Step 2.1: Patch-patch region growing
Quantitative Assessment of Structural Components for Construction Management Using Laser Scanning Data (10576)
Linh Truong-Hong and Roderik Lindenbergh (Netherlands)
FIG Working Week 2020
Smart surveyors for land and water management
Amsterdam, the Netherlands, 10–14 May 2020

As a patch represents a local surface of a floor/ceiling surface, the patch-patch region growing
is to segment the patches belonging to the same surface. The algorithm starts with an initial
seeding patch (ij ci) having the smallest residual value (min_rij) and then the neighbouring
patches (kj ck) are retrieved, in which the cell ck is adjoined to the cell ci. The patch kj can
be added to a region (Rk) of the patch ij if Eq. 6 is satisfied. Once the patch kj adding to the
region Rk, if the residual (rkj) of the patch is smaller than a predefined residual threshold (r0),
the patch is added to the seeding patch set. The algorithm is iteratively checked the patches and
generates a set of the regions R = {R1, . . ., Rk, RN | Rk = (ij)} containing the patches. The
growing process is completed when the predefined patches are checked. For details of the patch-
patch region growing can refer to (Rabbani et al., 2006; Truong-Hong et al., 2018).
{𝑛𝑖𝑗 , 𝑛𝑘𝑗 ≤ 𝛼0
𝑑(𝑝𝜓𝑘𝑗,0, 𝜓𝑖𝑗) ≤ 𝑑0 (6)
where 𝑛𝑖𝑗 , 𝑛𝑘𝑗 is a deviation of the normal vectors, 𝑑(𝑝𝜓𝑘𝑗,0, 𝜓𝑖𝑗) is the distances from the
centres of kj to the patch ij, and 0 and d0 are respectively a predefined angle and distance
threshold.
Once the patch contain the point cloud of the slab, column, beams and/or wall, there are two
cases can occur: (1) the patches is segmented but it contains the data points of other structural
components, and (2) the patch does not segment because the patch’s features differ from ones
of the slab’s patches. That can be solved in Step 2.2 and Step 2.3, respectively.
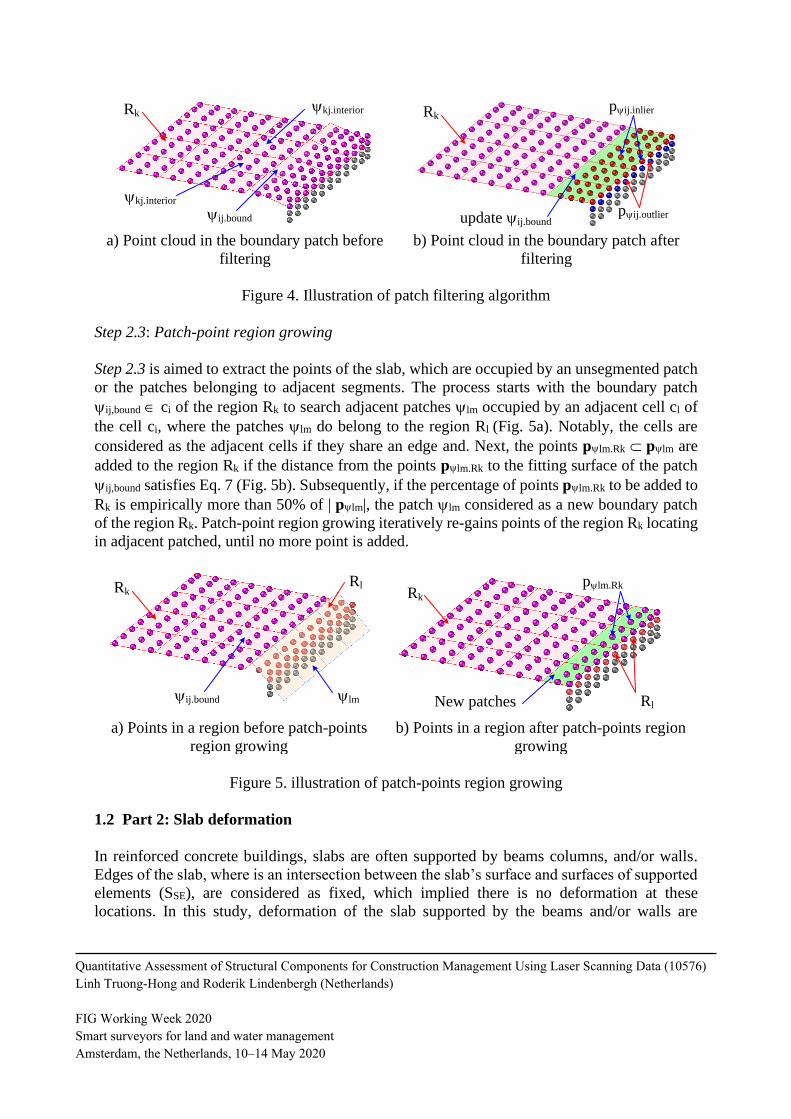
Step 2.2: Patch filtering algorithm
Since the patches contains the points of other structural components often locate on a boundary
of a region, the algorithm classified the patches ij Rk into boundary and interior patches
(ij.bound and ij.interior). The patch is the boundary patch if the cell occupying this patch connects
to less than 8 other cells occupying other patches of the region Rk, otherwise it is the interior
patch (Fig. 4a). Additionally, from the boundary patch ij.bound Rk, the interior patches
kj.interior, which the neighbour patches of ij.bound, are extracted, and then a local surface Rkj of
the region Rk is estimated from the points belonging to kj.interior using Eq. 2 and 3.
Subsequently, the points pij ij,bound are considered as inlier points pij,inlier if the distance
from the points to the local surface Rkj is no larger than the distance threshold d0, as given in
Eq. 7 (Fig. 4b). The outlier points are then eliminated out of the patch.
𝑝𝜓𝑖𝑗 → 𝑝𝜓𝑖𝑗.𝑖𝑛𝑙𝑖𝑒𝑟 𝑖𝑓 𝑑(𝑝𝜓𝑖𝑗, 𝜓𝑅) ≤ 𝑑0 (7)
where 𝑑(𝑝𝜓𝑖𝑗 , 𝜓𝑅) is the distance from the points pij to the surface R and d0 is the distance
threshold
Quantitative Assessment of Structural Components for Construction Management Using Laser Scanning Data (10576)
Linh Truong-Hong and Roderik Lindenbergh (Netherlands)
FIG Working Week 2020
Smart surveyors for land and water management
Amsterdam, the Netherlands, 10–14 May 2020
a) Point cloud in the boundary patch before
filtering
b) Point cloud in the boundary patch after
filtering
Figure 4. Illustration of patch filtering algorithm
Step 2.3: Patch-point region growing
Step 2.3 is aimed to extract the points of the slab, which are occupied by an unsegmented patch
or the patches belonging to adjacent segments. The process starts with the boundary patch
ij,bound ci of the region Rk to search adjacent patches lm occupied by an adjacent cell cl of
the cell ci, where the patches lm do belong to the region Rl (Fig. 5a). Notably, the cells are
considered as the adjacent cells if they share an edge and. Next, the points plm.Rk plm are
added to the region Rk if the distance from the points plm.Rk to the fitting surface of the patch
ij,bound satisfies Eq. 7 (Fig. 5b). Subsequently, if the percentage of points plm.Rk to be added to
Rk is empirically more than 50% of | plm|, the patch lm considered as a new boundary patch
of the region Rk. Patch-point region growing iteratively re-gains points of the region Rk locating
in adjacent patched, until no more point is added.
a) Points in a region before patch-points
region growing
b) Points in a region after patch-points region
growing
Figure 5. illustration of patch-points region growing
1.2 Part 2: Slab deformation
In reinforced concrete buildings, slabs are often supported by beams columns, and/or walls.
Edges of the slab, where is an intersection between the slab’s surface and surfaces of supported
elements (SSE), are considered as fixed, which implied there is no deformation at these
locations. In this study, deformation of the slab supported by the beams and/or walls are
Rk
ij.bound
kj.interior
kj.interior Rkpij.inlier
pij.outlierupdate ij.bound
ij.bound lm
RlRk Rk
RlNew patches
plm.Rk
Quantitative Assessment of Structural Components for Construction Management Using Laser Scanning Data (10576)
Linh Truong-Hong and Roderik Lindenbergh (Netherlands)
FIG Working Week 2020
Smart surveyors for land and water management
Amsterdam, the Netherlands, 10–14 May 2020
computed, but it can be simply extended for other types of the slabs because they are based on
the same hypothesis.
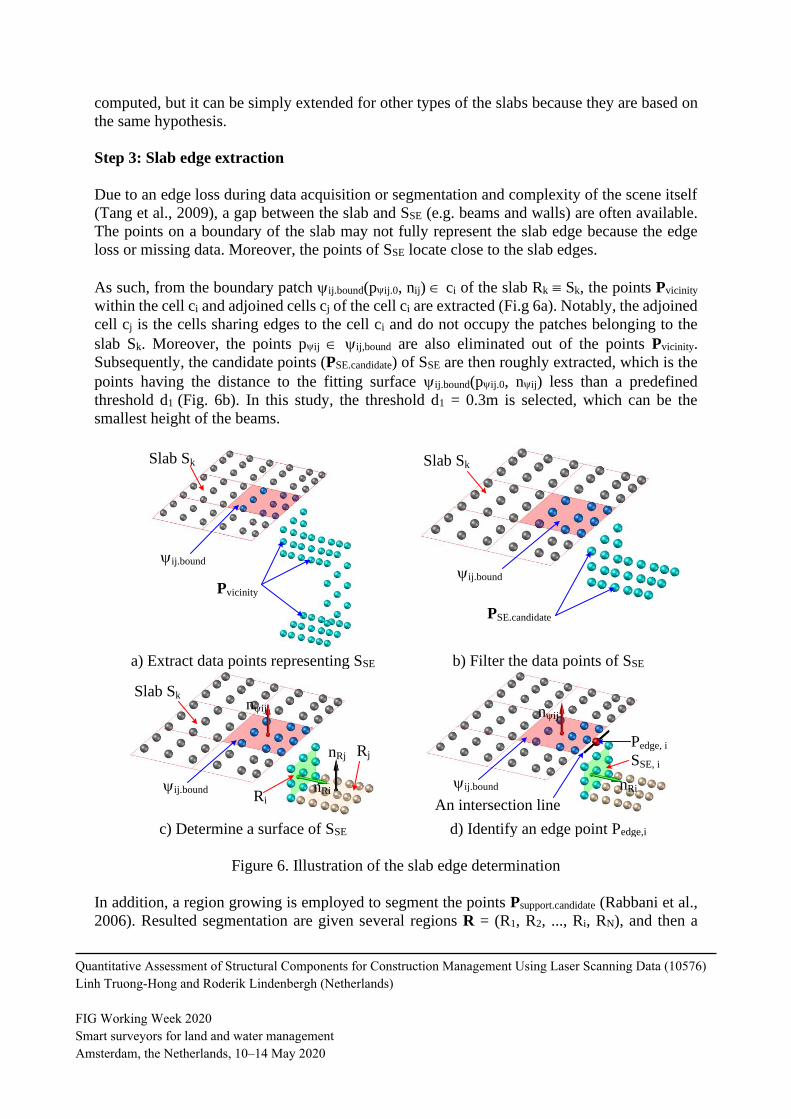
Step 3: Slab edge extraction
Due to an edge loss during data acquisition or segmentation and complexity of the scene itself
(Tang et al., 2009), a gap between the slab and SSE (e.g. beams and walls) are often available.
The points on a boundary of the slab may not fully represent the slab edge because the edge
loss or missing data. Moreover, the points of SSE locate close to the slab edges.
As such, from the boundary patch ij.bound(pij.0, nij) ci of the slab Rk Sk, the points Pvicinity
within the cell ci and adjoined cells cj of the cell ci are extracted (Fi.g 6a). Notably, the adjoined
cell cj is the cells sharing edges to the cell ci and do not occupy the patches belonging to the
slab Sk. Moreover, the points pij ij,bound are also eliminated out of the points Pvicinity.
Subsequently, the candidate points (PSE.candidate) of SSE are then roughly extracted, which is the
points having the distance to the fitting surface ij.bound(pij.0, nij) less than a predefined
threshold d1 (Fig. 6b). In this study, the threshold d1 = 0.3m is selected, which can be the
smallest height of the beams.
a) Extract data points representing SSE b) Filter the data points of SSE
c) Determine a surface of SSE d) Identify an edge point Pedge,i
Figure 6. Illustration of the slab edge determination
In addition, a region growing is employed to segment the points Psupport.candidate (Rabbani et al.,
2006). Resulted segmentation are given several regions R = (R1, R2, ..., Ri, RN), and then a
ij.bound
Slab Sk
Pvicinity
ij.bound
Slab Sk
PSE.candidate
Slab Sknij
nRj
nRiij.boundRi
Rj
An intersection line
Pedge, i
ij.bound
nij
nRi
SSE, i
Quantitative Assessment of Structural Components for Construction Management Using Laser Scanning Data (10576)
Linh Truong-Hong and Roderik Lindenbergh (Netherlands)
FIG Working Week 2020
Smart surveyors for land and water management
Amsterdam, the Netherlands, 10–14 May 2020

fitting surface of each region can be estimated based on Eq. 2 and 3 (Fig. 8c). Moreover, based
on observation of the building structure, SSE is close and perpendicular to the slab. Thus, the
correct SSE is the region satisfies conditions in Eq. 8. Finally, an intersection line between the
boundary patch ij.bound and the SSE,i is determined and the point Pedge,i at the middle of the line
segment of the intersection line is used as the point represent the slab edge segment (Fig. 8d).
𝑅𝑖 → 𝑆𝑆𝐸,𝑖 𝑖𝑓 {cos(𝑛𝜓𝑖𝑗 , 𝑛𝑅𝑖) ≤ cos (
𝜋
2− 𝛼0)
𝑑(𝑝𝜓𝑖𝑗.0, 𝑝𝑅𝑖.0′ ) → 𝑚𝑖𝑛
(8)
where 𝑛𝜓𝑖𝑗 𝑎𝑛𝑑 𝑛𝑅𝑖 are normal vectors of the fitting surfaces of the boundary patch ij.bound and
the region Ri, 𝑝𝑅𝑖.0′ is a projection of the centroid of the points belonging to the region Ri, and
0 is the predefined angle threshold.
Step 4: Slab deformation
As mentioned above, the slab edges are fixed. The fitting surface through the edge points Pedge,i
is estimated and considered as the reference surface (Sref), which is done by using Eq. 2 and 3.
Next, the point-surface method is used to determine the slab deformation, in which the
deformation is the distance from the points to the reference surface.
However, during data acquisition and registration, and floor/ceiling slab extraction, errors are
inevitable. To reduce a negative impact of such errors to determine the slab deformation, the
cell-surface method is employed to compute the slab deformation. In this method, the point
cloud of the slab is decomposed into 2D cells in the xy plane, which is done similar to Step 1.1.
For each cell, the centroid (pci,0) of the points within the cell is determined based on Eq. 3,
which is represent to the cell. Subsequently, the distance from the point pci,0 to the reference
surface Sref is known as the slab deformation. More details of both point-surface and cell-surface
methods can refer to Truong-Hong and Lindebergh (Truong-Hong and Lindenbergh, 2019).
3. EXPERIEMENTAL TEST, RESULTS AND DISCUSSION
To demonstrate the proposed method, a ground storey of a office building on Pham Ngu lao st
in Ho Chi Minh city, Vietnam is selected. The storey is about 18.5m wide x 29.5m long x 3.45m
high. Structural elements consist of floors connected to a basedment, ceilings, columns, beams
(primary and secondary) and walls. The building storey was scanned by a Trimble TX8 with a
maximum scanning range at 120m and an angular accuracy of 8rad in both vertical and
horizontal (Trimble, 2020b). During data acquisition, a point spacing of 11.3mm at a range of
30m was used. A total of 11 scanning stations was established to maximize data coverage of
an interior storey (Fig. 7). The point clouds of scanning stations were registered by the Trimble
RealWork software v11.2 (Trimble, 2020a) and the registration error was about 1.57mm based
on cloud-cloud registration. Finally, 23.9 million points of the building storey was exported
with x-, y- and z- coordinates for each point as input data for the proposed method. Notably,
parts of a MEP system were installed, which obstructs to capture surfaces of the structural
element.
Quantitative Assessment of Structural Components for Construction Management Using Laser Scanning Data (10576)
Linh Truong-Hong and Roderik Lindenbergh (Netherlands)
FIG Working Week 2020
Smart surveyors for land and water management
Amsterdam, the Netherlands, 10–14 May 2020
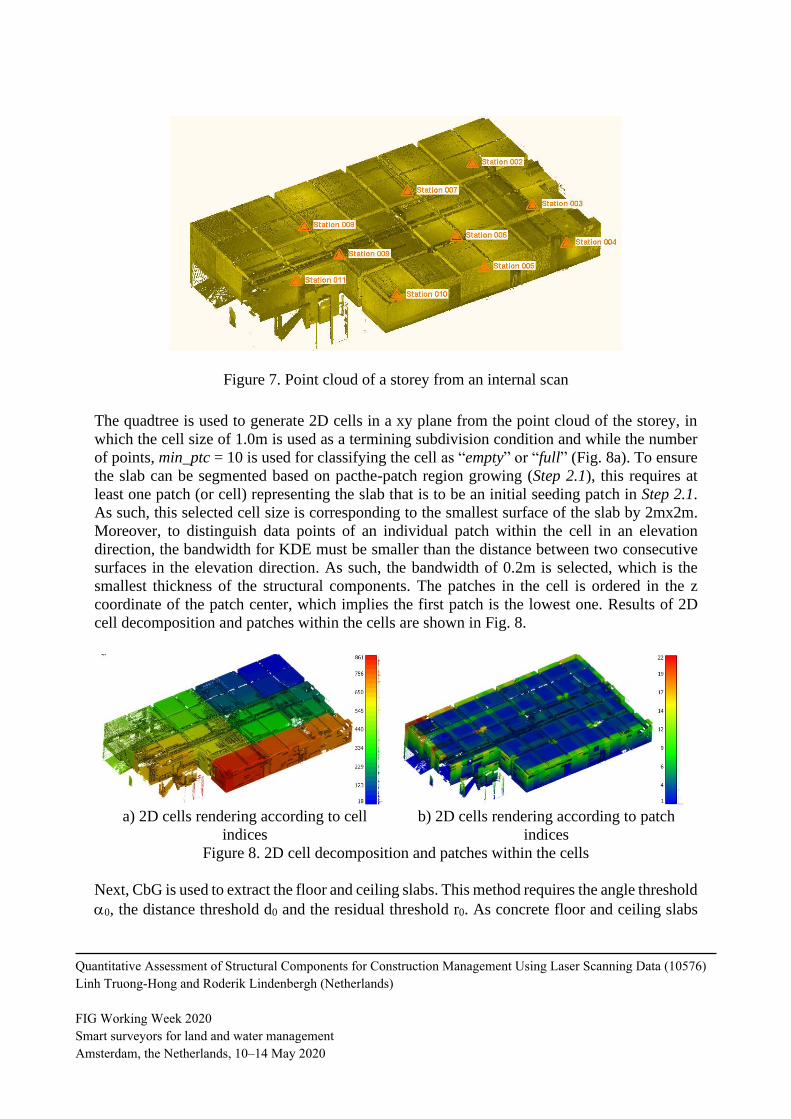
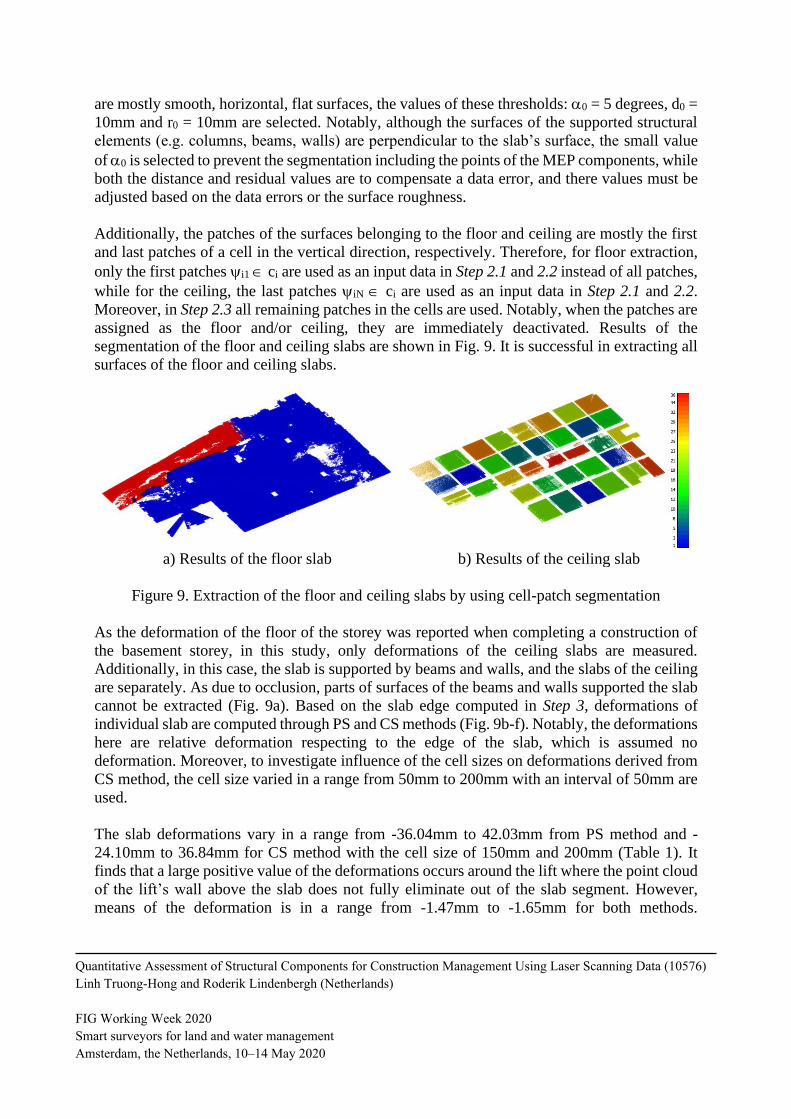
Figure 7. Point cloud of a storey from an internal scan The quadtree is used to generate 2D cells in a xy plane from the point cloud of the storey, in
which the cell size of 1.0m is used as a termining subdivision condition and while the number
of points, min_ptc = 10 is used for classifying the cell as “empty” or “full” (Fig. 8a). To ensure
the slab can be segmented based on pacthe-patch region growing (Step 2.1), this requires at
least one patch (or cell) representing the slab that is to be an initial seeding patch in Step 2.1.
As such, this selected cell size is corresponding to the smallest surface of the slab by 2mx2m.
Moreover, to distinguish data points of an individual patch within the cell in an elevation
direction, the bandwidth for KDE must be smaller than the distance between two consecutive
surfaces in the elevation direction. As such, the bandwidth of 0.2m is selected, which is the
smallest thickness of the structural components. The patches in the cell is ordered in the z
coordinate of the patch center, which implies the first patch is the lowest one. Results of 2D
cell decomposition and patches within the cells are shown in Fig. 8.
a) 2D cells rendering according to cell
indices
b) 2D cells rendering according to patch
indices
Figure 8. 2D cell decomposition and patches within the cells
Next, CbG is used to extract the floor and ceiling slabs. This method requires the angle threshold
0, the distance threshold d0 and the residual threshold r0. As concrete floor and ceiling slabs
Quantitative Assessment of Structural Components for Construction Management Using Laser Scanning Data (10576)
Linh Truong-Hong and Roderik Lindenbergh (Netherlands)
FIG Working Week 2020
Smart surveyors for land and water management
Amsterdam, the Netherlands, 10–14 May 2020
are mostly smooth, horizontal, flat surfaces, the values of these thresholds: 0 = 5 degrees, d0 =
10mm and r0 = 10mm are selected. Notably, although the surfaces of the supported structural
elements (e.g. columns, beams, walls) are perpendicular to the slab’s surface, the small value
of 0 is selected to prevent the segmentation including the points of the MEP components, while
both the distance and residual values are to compensate a data error, and there values must be
adjusted based on the data errors or the surface roughness.
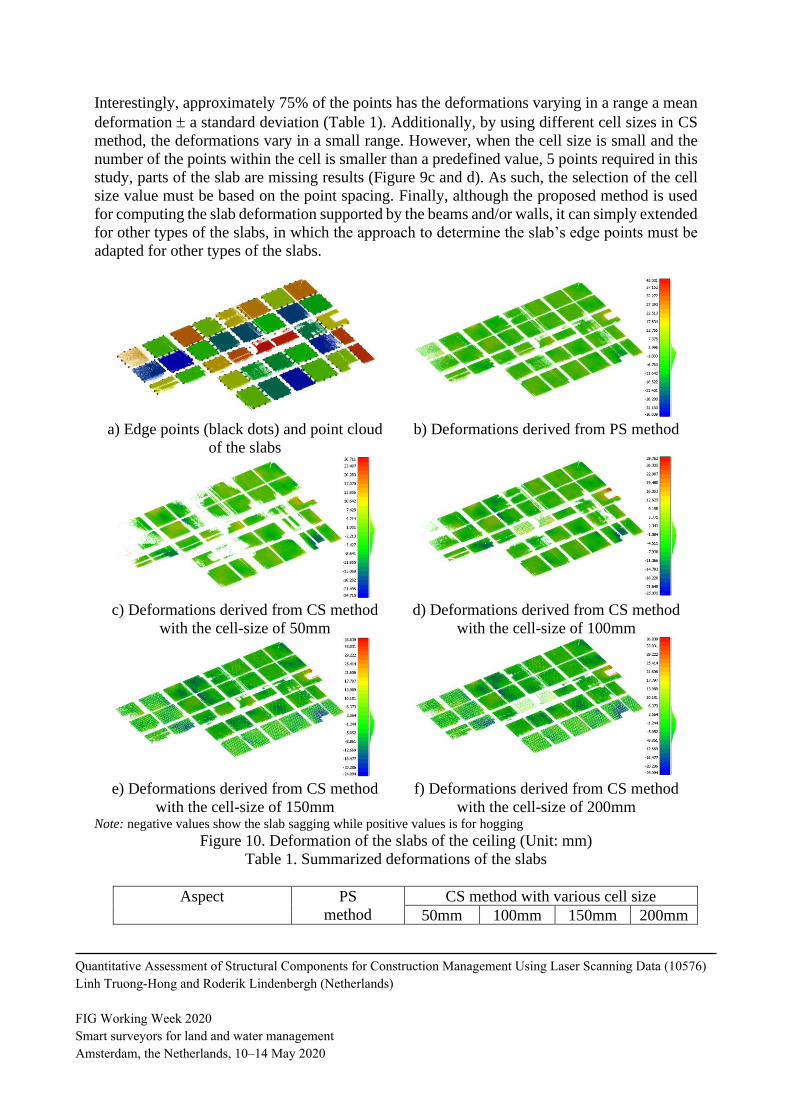
Additionally, the patches of the surfaces belonging to the floor and ceiling are mostly the first
and last patches of a cell in the vertical direction, respectively. Therefore, for floor extraction,
only the first patches i1 ci are used as an input data in Step 2.1 and 2.2 instead of all patches,
while for the ceiling, the last patches iN ci are used as an input data in Step 2.1 and 2.2.
Moreover, in Step 2.3 all remaining patches in the cells are used. Notably, when the patches are
assigned as the floor and/or ceiling, they are immediately deactivated. Results of the
segmentation of the floor and ceiling slabs are shown in Fig. 9. It is successful in extracting all
surfaces of the floor and ceiling slabs.
a) Results of the floor slab b) Results of the ceiling slab
Figure 9. Extraction of the floor and ceiling slabs by using cell-patch segmentation
As the deformation of the floor of the storey was reported when completing a construction of
the basement storey, in this study, only deformations of the ceiling slabs are measured.
Additionally, in this case, the slab is supported by beams and walls, and the slabs of the ceiling
are separately. As due to occlusion, parts of surfaces of the beams and walls supported the slab
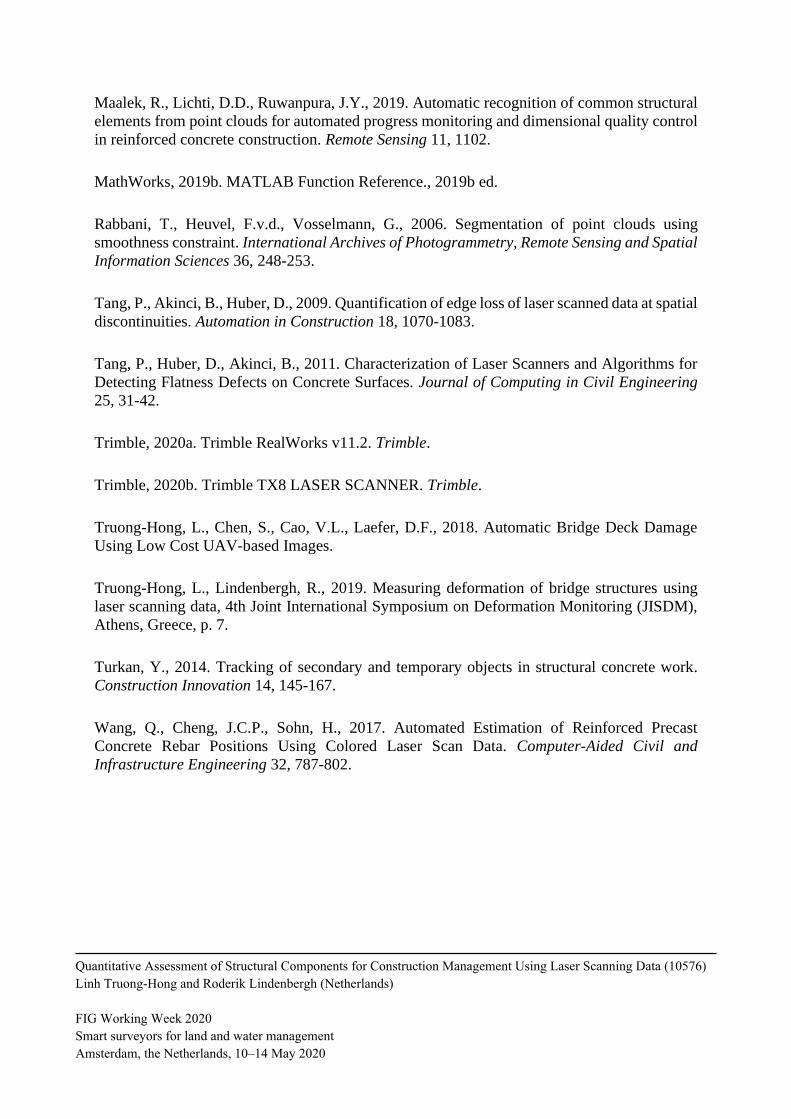
cannot be extracted (Fig. 9a). Based on the slab edge computed in Step 3, deformations of
individual slab are computed through PS and CS methods (Fig. 9b-f). Notably, the deformations
here are relative deformation respecting to the edge of the slab, which is assumed no
deformation. Moreover, to investigate influence of the cell sizes on deformations derived from
CS method, the cell size varied in a range from 50mm to 200mm with an interval of 50mm are
used.
The slab deformations vary in a range from -36.04mm to 42.03mm from PS method and -
24.10mm to 36.84mm for CS method with the cell size of 150mm and 200mm (Table 1). It
finds that a large positive value of the deformations occurs around the lift where the point cloud
of the lift’s wall above the slab does not fully eliminate out of the slab segment. However,
means of the deformation is in a range from -1.47mm to -1.65mm for both methods.
Quantitative Assessment of Structural Components for Construction Management Using Laser Scanning Data (10576)
Linh Truong-Hong and Roderik Lindenbergh (Netherlands)
FIG Working Week 2020
Smart surveyors for land and water management
Amsterdam, the Netherlands, 10–14 May 2020
Interestingly, approximately 75% of the points has the deformations varying in a range a mean
deformation a standard deviation (Table 1). Additionally, by using different cell sizes in CS
method, the deformations vary in a small range. However, when the cell size is small and the
number of the points within the cell is smaller than a predefined value, 5 points required in this
study, parts of the slab are missing results (Figure 9c and d). As such, the selection of the cell
size value must be based on the point spacing. Finally, although the proposed method is used
for computing the slab deformation supported by the beams and/or walls, it can simply extended
for other types of the slabs, in which the approach to determine the slab’s edge points must be
adapted for other types of the slabs.
a) Edge points (black dots) and point cloud
of the slabs
b) Deformations derived from PS method
c) Deformations derived from CS method
with the cell-size of 50mm
d) Deformations derived from CS method
with the cell-size of 100mm
e) Deformations derived from CS method
with the cell-size of 150mm
f) Deformations derived from CS method
with the cell-size of 200mm Note: negative values show the slab sagging while positive values is for hogging
Figure 10. Deformation of the slabs of the ceiling (Unit: mm)
Table 1. Summarized deformations of the slabs
Aspect PS
method
CS method with various cell size
50mm 100mm 150mm 200mm
Quantitative Assessment of Structural Components for Construction Management Using Laser Scanning Data (10576)
Linh Truong-Hong and Roderik Lindenbergh (Netherlands)
FIG Working Week 2020
Smart surveyors for land and water management
Amsterdam, the Netherlands, 10–14 May 2020

Minimum (mm) -36.04 -24.71 -25.08 -24.10 -24.10
Mean (mm) -1.54 -1.50 -1.65 -1.47 -1.64
Standard deviation (mm) 4.03 4.33 4.39 4.51 4.44
Maximum (mm) 42.03 26.71 29.76 36.84 36.84
Percentage of points in a
range [Mean Std]
73.8% 73.2% 74.2% 74.1% 74.6%
Finally, the proposed method is implemented in MATLAB 2019b (MathWorks, 2019b), and
23.9 million data points of a building storey is processed Dell Precision Workstation with a
main system configuration as follows: Intel(R) Xeon(R) W-2123 CPU @ 3.6GHz with 32GB
RAM. The processing time is 78.9 seconds including executing time for quadtree
decomposition about 24.7 seconds, extracting patches within the cells about 19.2 seconds, for
extracting points of the floor and ceiling about 19.7 seconds and 16.1 seconds, respectively.
That implies the proposed method is efficiency to handle a large data set from a construction
project.
4. CONCLUSIONS
The paper presents an efficient, automatic method to extract floor and ceiling slabs of a
reinforced concrete building for inspecting defects through deformation. The proposed method
decomposes the point cloud of the building into 2D cells in xy plane and a synergy between
KDE and CbS is used to extract point clouds belonging to surfaces of the floor and ceiling.
Subsequently, surfaces of beams and walls supported the slabs are extracted to determine the
slab edges, where are considered as no deformation. An experimental test on 23.9 million points
of the building shows the proposed method extracts the surfaces of floor and ceiling
successfully and efficiently, in which executing time for the floor and ceiling extraction is about
78.9seconds. Additionally, both PS and CS methods are can report detailed deformations of the
slab, which can be used for other similar structures. Interestingly, the selection of the cell size
in CS method must ensure the cell occupied sufficient number of the points, otherwise, the
deformation-based CS method may not available in parts of the slab where the point spacing is
larger than the cell size. Although the proposed method is developed for inspecting
deformations of the slabs supported by the beams and walls, which is a popular slab in the
building structures, the method can be easily extended for other types of the slab. Moreover, in
future work, the proposed method will extent to extract other structural elements (e.g. columns,
beams and walls) for dimensional quality, surface defects, as well as as-built model
reconstruction.
ACKNOWLEDGEMENT
This work was funded by the generous support of the European Commission through H2020
MSCA-IF, “BridgeScan: Laser Scanning for Automatic Bridge Assessment”, Grant 799149.
The first author is graceful for this support. The authors also thank Dat Hop Company Limited
and Ceotic., JSC for their providing the laser scanning data.
Quantitative Assessment of Structural Components for Construction Management Using Laser Scanning Data (10576)
Linh Truong-Hong and Roderik Lindenbergh (Netherlands)
FIG Working Week 2020
Smart surveyors for land and water management
Amsterdam, the Netherlands, 10–14 May 2020

BIOGRAPHICAL NOTES
Dr. Linh Truong-Hong is a Marie Curie Fellowship at Optical and Close Laser Scanning Group,
Department of Geoscience and Remote Sensing, TUDelft. His research interests are to develop
an integrated framework to deploy laser scanning and photogrammetry for civil infrastructure
inspection and monitoring, construction management and urban modelling. He has published
more than 50 scientific papers, which include 3 book chapters, 22 journal peer review papers
and 30 conference papers, and filed 2 patents. His publications have more than 797 citations
resulting in an H-index of 15 according to Google Scholar. Moreover, his research activities
were recognized through 7 prizes and award, which includes 2019 Mandy Prize ICT/GIS/BIM
by Institute Civil Engineering, the best paper at CERI 2018, 2015 IQPC Best track ward
awarded by ISPRS, First place 2015 IEEE GRSS Data Fusion Contest, Highly Recommended
Award, the 13th International Conference on Computational Science and Applications (ICCSA)
2013.
CONTACTS
Dr. Linh Truong-Hong
Department of geoscience and Remote Sensing, Delft University of Technology
Address: Room 2.28, Building 23, Steviweg 1/PO box 5048, 2628 CN Delft Delft
THE NETHERLANDS
Tel. + 31 15 27 88147
Email: [email protected]
Web site: https://www.tudelft.nl/en/ceg/about-faculty/departments/geoscience-remote-
sensing/staff/researchers/dr-l-linh-truong-hong/
REFERENCES
Bosché, F., Guenet, E., 2014. Automating surface flatness control using terrestrial laser
scanning and building information models. Automation in Construction 44, 212-226.
Hoppe, H., DeRose, T., Duchamp, T., McDonald, J., Stuetzle, W., 1992. Surface reconstruction
from unorganized points, ACM SIGGRAPH 1992, Chicago, USA, pp. 71-78.
Kim, M.-K., McGovern, S., Belsky, M., Middleton, C., Brilakis, I., 2016. A suitability analysis
of precast components for standardized bridge construction in the United Kingdom. Procedia
engineering 164, 188-195.
Laefer, D.F., Truong-Hong, L., 2017. Toward automatic generation of 3D steel structures for
building information modelling. Automation in Construction 74, 66-77.
Love Peter, E.D., 2002. Influence of Project Type and Procurement Method on Rework Costs
in Building Construction Projects. J. Constr. Eng. M. 128, 18-29.
Quantitative Assessment of Structural Components for Construction Management Using Laser Scanning Data (10576)
Linh Truong-Hong and Roderik Lindenbergh (Netherlands)
FIG Working Week 2020
Smart surveyors for land and water management
Amsterdam, the Netherlands, 10–14 May 2020
Maalek, R., Lichti, D.D., Ruwanpura, J.Y., 2019. Automatic recognition of common structural
elements from point clouds for automated progress monitoring and dimensional quality control
in reinforced concrete construction. Remote Sensing 11, 1102.
MathWorks, 2019b. MATLAB Function Reference., 2019b ed.
Rabbani, T., Heuvel, F.v.d., Vosselmann, G., 2006. Segmentation of point clouds using
smoothness constraint. International Archives of Photogrammetry, Remote Sensing and Spatial
Information Sciences 36, 248-253.
Tang, P., Akinci, B., Huber, D., 2009. Quantification of edge loss of laser scanned data at spatial
discontinuities. Automation in Construction 18, 1070-1083.
Tang, P., Huber, D., Akinci, B., 2011. Characterization of Laser Scanners and Algorithms for
Detecting Flatness Defects on Concrete Surfaces. Journal of Computing in Civil Engineering
25, 31-42.
Trimble, 2020a. Trimble RealWorks v11.2. Trimble.
Trimble, 2020b. Trimble TX8 LASER SCANNER. Trimble.
Truong-Hong, L., Chen, S., Cao, V.L., Laefer, D.F., 2018. Automatic Bridge Deck Damage
Using Low Cost UAV-based Images.
Truong-Hong, L., Lindenbergh, R., 2019. Measuring deformation of bridge structures using
laser scanning data, 4th Joint International Symposium on Deformation Monitoring (JISDM),
Athens, Greece, p. 7.
Turkan, Y., 2014. Tracking of secondary and temporary objects in structural concrete work.
Construction Innovation 14, 145-167.
Wang, Q., Cheng, J.C.P., Sohn, H., 2017. Automated Estimation of Reinforced Precast
Concrete Rebar Positions Using Colored Laser Scan Data. Computer-Aided Civil and
Infrastructure Engineering 32, 787-802.
Quantitative Assessment of Structural Components for Construction Management Using Laser Scanning Data (10576)
Linh Truong-Hong and Roderik Lindenbergh (Netherlands)
FIG Working Week 2020
Smart surveyors for land and water management
Amsterdam, the Netherlands, 10–14 May 2020