Embed Size (px)
Citation preview

1
Quantitative cross-linking/mass spectrometry reveals subtle protein conformational
changes
Zhuo A. Chen1, Lutz Fischer1, Salman Tahir1, Jimi-Carlo Bukowski-Wills1, Paul N. Barlow2, Juri
Rappsilber1,3*
1 Wellcome Trust Centre for Cell Biology, Institute of Cell Biology, School of Biological Sciences,
University of Edinburgh, Edinburgh EH9 3BF, UK
2 Schools of Chemistry and Biological Sciences, University of Edinburgh, Edinburgh EH9 3JJ,
UK
3 Department of Bioanalytics, Institute of Biotechnology, Technische Universität Berlin, 13355
Berlin, Germany
Correspondence should be addressed to Juri Rappsilber.
Email: [email protected]
Phone: +44-(0)131-651-7056, FAX: +44-(0)131-650-5379
Running title: QCLMS reveals protein conformational changes
peer-reviewed) is the author/funder. All rights reserved. No reuse allowed without permission. The copyright holder for this preprint (which was not. http://dx.doi.org/10.1101/055418doi: bioRxiv preprint first posted online May. 25, 2016;
2
Abbreviations
BS3 - Bis[sulfosuccinimidyl] suberate
CLMS - Cross-linking/mass spectrometry
FDR - False discovery rate
HCD - Higher energy collision induced dissociation
LC-MS/MS - Liquid chromatography tandem mass spectrometry
LTQ - Linear trap quadrupole
MS2 - Tandem mass spectrometry
QCLMS - Quantitative cross-linking/mass spectrometry
SCX - Strong cation exchange
peer-reviewed) is the author/funder. All rights reserved. No reuse allowed without permission. The copyright holder for this preprint (which was not. http://dx.doi.org/10.1101/055418doi: bioRxiv preprint first posted online May. 25, 2016;
3
Abstract
We have developed quantitative cross-linking/mass spectrometry (QCLMS) to interrogate
conformational rearrangements of proteins in solution. Our workflow was tested using a
structurally well-described reference system, the human complement protein C3 and its
activated cleavage product C3b. We found that small local conformational changes affect the
yields of cross-linking residues that are near in space while larger conformational changes affect
the detectability of cross-links. Distinguishing between minor and major changes required robust
analysis based on replica analysis and a label-swapping procedure. By providing workflow,
code of practice and a framework for semi-automated data processing, we lay the foundation for
QCLMS as a tool to monitor the domain choreography that drives binary switching in many
protein-protein interaction networks.
peer-reviewed) is the author/funder. All rights reserved. No reuse allowed without permission. The copyright holder for this preprint (which was not. http://dx.doi.org/10.1101/055418doi: bioRxiv preprint first posted online May. 25, 2016;
4
Introduction
Domain rearrangements of individual proteins act as molecular switches, govern the assembly
of complexes and regulate the activity of networks. A typical example of a predominantly
conformational change-driven finely tuned protein-protein interaction network is the mammalian
complement system of ~40 plasma and cell-surface proteins. This is responsible for clearance
of immune complexes from body fluids along with other hazards to health including bacteria and
viruses. The study of such networks is hampered by the lack of tools to follow dynamic aspects
of protein structures.
Cross-linking combined with mass spectrometry and database searching is a tool that
can reveal the topology and other structural details of proteins and their complexes (1-3). It is
currently unclear if dynamic information could also be obtained from such straight applications
of cross-linking/mass spectrometry (CLMS) analysis. However, dynamic information could come
from a comparison of the cross-links obtained from different protein states. We are developing a
strategy to perform such a comparison in a rigorous manner by quantitative CLMS (QCLMS) (4)
using isotope-labeled cross-linkers (5-8). In our strategy, distinct isotopomers of a cross-linker
are used, to cross-link different stable conformers of the same, or very similar, protein
molecules. The mass spectrometric signals of cross-linked peptides derived from different
conformations can then be distinguished by their masses and thus quantified and related to
conformational differences (Fig. 1A).
Despite being straightforward in principle, quantifying cross-linked peptides is technically
challenging. Currently available quantitative proteomics software is linked to protein
identification workflows meaning that cross-link analysis is not routinely possible. Previously
performed proof-of-principle work relied on an elementary computational tool, XiQ (4). A
subsequent application (9) relied on manual data analysis, a subsequent protocol conspicuously
peer-reviewed) is the author/funder. All rights reserved. No reuse allowed without permission. The copyright holder for this preprint (which was not. http://dx.doi.org/10.1101/055418doi: bioRxiv preprint first posted online May. 25, 2016;
5
left out the computational aspects (10) . These works neglected to include replicated analysis
and label-swaps; which are important standard procedures of quantitative proteomics. Recently,
a workflow using replicated analysis and software mMass has been demonstrated using a
calmodulin (17kDa) in presence and absence of Ca2+ (11). It remains to be seen if the
approach scales to larger protein system. Additional experimental challenges derive from cross-
linking itself. Cross-linking is known for low reproducibility. In any case, the signal intensity of an
individual cross-linked peptide does not just depend on cross-linking efficiency. For example,
additional variable chemical modifications of the peptides, such as methionine oxidation and
reaction with the hydrolyzed cross-linker, may also depend on protein conformation.
Furthermore, the network of cross-links that form within the molecule may influence the
efficiency of protease digestion (11). Finally, peak interference or stochastic processes during
data acquisition may prevent accurate quantitation. This is a general problem for quantification
but it may especially affect cross-linking; cross-links are generally sub-stoichiometric and thus of
low signal intensity in mass spectra.
To explore solutions to the challenges of QCLMS, we developed a workflow that
involves replicated analysis, label-swap and some level of automation of the quantitation
process, here utilizing the quantitative proteomics software tool Pinpoint (Thermo Scientific).
This workflow has been successfully applied to study the conformational changes that involved
in the maturation of the proteasome lid complex (12). We applied this workflow here to
investigate key proteins in the complement system, a central player in human innate immune
defenses. As the pivotal activation step of the complement system, C3 convertases excise the
small anaphylatoxin domain (ANA) from the complement component C3 (184 kDa) leaving its
activated form, C3b (175 kDa) (Fig. 1). Both C3 and C3b are stable, and comparisons of the
crystal structures of both (C3 (13) and C3b (14)) (Fig. 1) revealed details of the structural
peer-reviewed) is the author/funder. All rights reserved. No reuse allowed without permission. The copyright holder for this preprint (which was not. http://dx.doi.org/10.1101/055418doi: bioRxiv preprint first posted online May. 25, 2016;
6
rearrangements during this conversion. Using this comparison of C3 and C3b as a model
system, we demonstrated and test in technical details the reliability of our workflow and
usefulness of QCLMS. It is proved possible to infer, from our QCLMS data, the conformational
changes that accompany cleavage of C3 to form C3b and then compare these to the difference
between the two crystal structures. This both allowed cross-validation of the existing structures
and revealed details of the relationship between cross-linking yields and conformational
changes. Based on our experiences, we suggest a code of practice for the use of QCLMS in the
study of protein dynamics.
peer-reviewed) is the author/funder. All rights reserved. No reuse allowed without permission. The copyright holder for this preprint (which was not. http://dx.doi.org/10.1101/055418doi: bioRxiv preprint first posted online May. 25, 2016;

7
Experimental Procedures
Protein preparation for cross-linking
Plasma-derived human C3 and C3b were purchased from Complement Technology, Inc. USA
(and stored at -80 °C). Native C3 was depleted of low amounts of contaminating iC3 using
cation-exchange chromatography (15). Chromatography was performed using a Mini S PC 3.2/3
column (GE Healthcare) at a flow-rate of 500 μl/min at 4 °C. Immediately after purification, C3
and C3b samples were exchanged, using 30-kDa molecular weight cutoff (MWCO) filters
(Millipore), into cross-linking buffer (20 mM HEPES-KOH, pH 7.8, 20 mM NaCl and 5 mM
MgCl2) with a final concentration of 2 µM. C3 and C3b samples used for “experiment I” and
“experiment II” was prepared separately.
Protein cross-linking
Experiment I
50 µg C3 and C3b were each, separately, cross-linked with either bis[sulfosuccinimidyl]
suberate (BS3) (Thermo Scientific) or its deuterated analogue bis[sulfosuccinimidyl] 2,2,7,7-
suberate-d4 (BS3-d4) (Fig. 1C), at 1:3 protein to cross-linker mass ratios, giving rise to four
different protein-cross-linker combinations: C3+BS3, C3+BS3-d4, C3b+BS3 and C3b+BS3-d4.
After incubation (two hours) on ice, reactions were quenched with 5 µl 2.5 M ammonium
bicarbonate for 45 minutes on ice. For the monitoring of cross-linked products, an aliquot
containing 5 pmol of cross-linked protein from each of the above four reaction mixtures were
subjected to SDS-PAGE using a NuPAGE 4-12% Bis-Tris gel and MOPS running buffer
(Thermo Fisher Scientific) according to the manufacturer’s instructions. The protein bands were
peer-reviewed) is the author/funder. All rights reserved. No reuse allowed without permission. The copyright holder for this preprint (which was not. http://dx.doi.org/10.1101/055418doi: bioRxiv preprint first posted online May. 25, 2016;
8
visualized using the Colloidal Blue Staining Kit (Thermo Fisher Scientific) according to the
manufacturer’s instructions.
Cross-linking reactions of C3 and C3b samples were repeated for “experiment II” as described
for “experiment I”.
Sample preparation for mass spectrometric analysis
Experiment I
Native C3 and C3b molecules each contain two, disulfide-linked, polypeptide chains. The
monomeric (two-polypeptide chain) products of cross-linked C3 and C3b were resolved as
distinct bands using SDS-PAGE. The products were in-gel reduced and alkylated, then digested
using trypsin following a standard protocol (16). For quantitation, equimolar quantities of the
tryptic products from the four cross-linked protein samples were mixed pair-wise, yielding two
combinations: C3+BS3 and C3b+BS3-d4 (named here as forward-labeled); C3+BS3-d4 and
C3b+BS3 (named here as reverse-labeled).
From each of these two samples, a 20-g (40 L) aliquot was taken and fractionated
using SCX-Stage-Tips (17) with a small variation of the protocol previously described for linear
peptides (18). In short, peptide mixtures were first loaded on a SCX-Stage-Tip in loading buffer
(0.5% v/v acetic acid, 20% v/v acetonitrile, 50 mM ammonium acetate). The bound peptides
were eluted in two steps, with buffers containing 100 mM ammonium acetate and 500 mM
ammonium acetate, producing two fractions. These peptide fractions were desalted using C18-
StageTips (19) prior to mass spectrometric analysis.
peer-reviewed) is the author/funder. All rights reserved. No reuse allowed without permission. The copyright holder for this preprint (which was not. http://dx.doi.org/10.1101/055418doi: bioRxiv preprint first posted online May. 25, 2016;
9
Experiment II
Preparation of two quantitation samples C3+BS3/C3b+BS3-d4 (forward-labeled) and C3+BS3-
d4/ C3b+BS3 (reverse-labeled) were repeated as described for “experiment I”. A 4-g (10 L)
aliquot of each sample was desalted using C18-Stage-Tips for mass spectrometric analysis
without pre-fractionation.
Mass spectrometric analysis
Experiment I
SCX-Stage-Tip fractions were analyzed using a hybrid linear ion trap-Orbitrap mass
spectrometer (LTQ-Orbitrap Velos, Thermo Fisher Scientific) applying a “high-high” acquisition
strategy. Peptides were separated on an analytical column that was packed with C18 material
(ReproSil-Pur C18-AQ 3 μm; Dr. Maisch GmbH, Ammerbuch-Entringen, Germany) in a spray
emitter (75-μm inner diameter, 8-μm opening, 250-mm length; New Objectives, Woburn, MA,
USA) (20). Mobile phase A consisted of water and 0.5% v/v acetic acid. Mobile phase B
consisted of acetonitrile and 0.5% v/v acetic acid. Peptides were loaded at a flow-rate of 0.7
μl/min and eluted at 0.3 μl/min using a linear gradient going from 3% mobile phase B to 35%
mobile phase B over 130 minutes, followed by a linear increase from 35% to 80% mobile phase
B in five minutes. The eluted peptides were directly introduced into the mass spectrometer. MS
data were acquired in the data-dependent mode. For each acquisition cycle, the mass spectrum
was recorded in the Orbitrap with a resolution of 100,000. The eight most intense ions with a
precursor charge state 3+ or greater were fragmented in the linear ion trap by collision-induced
disassociation (CID). The fragmentation spectra were then recorded in the Orbitrap at a
resolution of 7,500. Dynamic exclusion was enabled with single repeat count and 60-second
exclusion duration.
peer-reviewed) is the author/funder. All rights reserved. No reuse allowed without permission. The copyright holder for this preprint (which was not. http://dx.doi.org/10.1101/055418doi: bioRxiv preprint first posted online May. 25, 2016;
10
Experiment II
Non-fractionated peptide samples were analyzed using a hybrid quadrupole-Orbitrap mass
spectrometer (Q Exactive, Thermo Fisher Scientific). Peptides were separated on a reversed-
phase analytical column of the same type as described above. Mobile phase A consisted of
water and 0.1% v/v formic acid. Mobile phase B consisted of 80% v/v acetonitrile and 0.1% v/v
formic acid. Peptides were loaded at a flow rate of 0.5 l/min and eluted at 0.2 l/min. The
separation gradient consisted of a linear increase from 2% mobile phase B to 40% mobile
phase B in 169 minutes and a subsequent linear increase to 95% B over 11 minutes. Eluted
peptides were directly sprayed into the Q Exactive mass spectrometer. MS data were acquired
in the data-dependent mode. For each acquisition cycle, the MS spectrum was recorded in the
Orbitrap at 70,000 resolution. The ten most intense ions in the MS spectrum, with a precursor
change state 3+ or greater, were fragmented by Higher Energy Collision Induced Dissociation
(HCD). The fragmentation spectra were thus recorded in the Orbitrap at 35,000 resolution.
Dynamic exclusion was enabled, with single-repeat count and a 60 second exclusion duration.
Identification of cross-linked peptides
The raw mass spectrometric data files were processed into peak lists using MaxQuant version
1.2.2.5 (21) with default parameters, except that “Top MS/MS Peaks per 100 Da” was set to 20.
The peak lists were searched against C3 and decoy C3 sequences using Xi software (ERI,
Edinburgh) for identification of cross-linked peptides. Search parameters were as follows: MS
accuracy, 6 ppm; MS2 accuracy, 20 ppm; enzyme, trypsin; specificity, fully tryptic; allowed
number of missed cleavages, four; cross-linker, BS3/BS3-d4; fixed modifications,
carbamidomethylation on cysteine; variable modifications, oxidation on methionine,
modifications by BS3/BS3-d4 that are hydrolyzed or amidated on the other end. The reaction
peer-reviewed) is the author/funder. All rights reserved. No reuse allowed without permission. The copyright holder for this preprint (which was not. http://dx.doi.org/10.1101/055418doi: bioRxiv preprint first posted online May. 25, 2016;
11
specificity for BS3 was assumed to be for lysine, serine, threonine, tyrosine and protein N-
termini. Identified candidates for cross-linked peptides were validated manually in Xi, after
applying an estimated FDR of 3% for cross-linked peptides (Fischer and Rappsilber, submitted).
We used 3%FDR as this was the best FDR that returned reasonable number of decoys to
provide a meaningful FDR. List of identified cross-linked residue pairs were summarized based
these cross-linked peptides. We also included additional cross-linked peptides that support
identified cross-linked residue pairs for quantitation. These cross-linked peptides were identified
in separate mass spectrometry runs with less than 3% FDR and manually verified spectra. The
identification of these cross-linked peptides were transferred into the quantitation runs using
“match between runs” based on high m/z accuracy and reproducible chromatographic retention
time for MS1 signals. In addition, transferred identification were further verified in the
quantitation runs with their MS signal pattern (either shown as doublet signals or singlet signals
with 4D mass shift between paired label-swapped replicas). Identification information of all
quantified cross-linked peptides and the annotated best-matched MS2 spectra for quantified
cross-linked peptides are provided in Supplemental Table S1 and Supplemental File S1.
Quantitation of cross-link data using Pinpoint software
Identified cross-linked peptides were quantified based on their MS signals. The quantitative
proteomics software tool Pinpoint (Thermo Fisher Scientific) was used to retrieve intensities of
both light and heavy signals for each cross-linked peptides in an automated manner. An input
library for cross-linked peptides was constructed according to “General Spectral Library Format
for Pinpoint Comma Separated Values” (Thermo Fisher Scientific) (Supplemental File S1). In
the input library, the sequence of every cross-linked peptide was converted into a linear version
peer-reviewed) is the author/funder. All rights reserved. No reuse allowed without permission. The copyright holder for this preprint (which was not. http://dx.doi.org/10.1101/055418doi: bioRxiv preprint first posted online May. 25, 2016;
12
with identical mass (Fig. 2A), following an idea from Maiolica et al. (13). Six modifications that
were not listed in Pinpoint modification list were defined in “customized modifications”:
[BS3-OH]; mass, 156.07860; Site modified, KSTY
[BS3-NH2]; mass, 155.09460; Site modified, KSTY
[BS3d4-OH]; mass, 160.10374; Site modified, KSTY
[BS3d4-NH2]; mass, 159.11972; Site modified, KSTY
[Xlink]; mass, 27.98368; Site modified, K
[Xlinkd4]; mass, 32.00878; Site modified, K
The three most abundant of the first four signals in the isotope envelope were used for
quantitation. The error tolerance for precursor m/z was set to 6 ppm. Signals are only accepted
within a window of retention time (defied in spectral library) ±10 minutes. Manual inspection was
carried out to ensure the correct isolation of elution peaks. For each cross-linked peptide,
elution peak areas of the light and the heavy signals were measured and reported as log2
(C3b/C3). “Match between runs” (22) was carried out for all cross-linked peptides in Pinpoint
interface manually, based on high mass accuracy and reproducible LC retention time, hence
quantitation was conducted for each identified cross-linked peptides in both forward-labeled and
reverse-labeled samples even when they were only identified in one of them. In “experiment I”, if
a cross-linked peptide was quantified in two SCX fractions, the average of fold-change
(log2(C3b/C3)) in both fractions was reported. Within each of four biological (cross-link) replicas
(experiment I forward-labeled, experiment I reverse-labeled, experiment II forward-labeled and
experiment II revers-labeled) , signal fold-changes of all quantified cross-linked peptides were
normalized against their median, in order to correct systematic error introduced by minor shift on
mixing ratio during sample preparation. C3b/C3 signal ratios of all quantified peptides in two
experiments (four cross-link replicas) were listed in Supplemental Table S1.
peer-reviewed) is the author/funder. All rights reserved. No reuse allowed without permission. The copyright holder for this preprint (which was not. http://dx.doi.org/10.1101/055418doi: bioRxiv preprint first posted online May. 25, 2016;
13
The quantitation data was subsequently summarized at the level of unique residue pairs
(cross-links). A cross-link was defined as a unique cross-link in either C3 or C3b only if all its
supporting cross-linked peptides were observed as the corresponding singlet signals. Otherwise,
cross-links were regarded as having being observed in both conformations. For a cross-link
shared by C3 and C3b, the signal fold-change was defined as the median of all its supporting
cross-linked peptides. Only those cross-links that were consistently quantified in both paired
replica analyses (with label-swap) were accepted for subsequent structural analysis. Singlet
cross-links were further confirmed by a mass shift of 4 Da, resulting from the label-swap. For
cross-links observed as a doublet, the average of signal fold-changes from label-swapping
replicated analyses was reported (Fig 3C). When a cross-link was quantified in both “experiment
I” and “experiment II”, its fold-change in the two analyses was averaged and reported. All
quantified cross-links are listed in Supplemental Table S2. Cross-links that were significantly
enriched in C3 or C3b were determined using “Significance A” test from the standard
proteomics data analysis tool Perseus (version 1.4.1.2) (21) based on log2(C3b/C3) values. The
following parameters were used in Perseus for the test: “Side”: both; “Use for truncation”: P
value; “Threshold value”: 0.05.
Comparison with crystal structures
To compare cross-linking data with X-ray crystallographic data, cross-links were displayed using
PyMol (version 1.2b5) (23) in the crystal structures of C3 (PDB|2A73) and C3b (PDB|2I07).
Cross-links were represented as strokes between the C-α atoms of linked residues. In the case
of a residue missing from the crystal structures, the nearest residue in the sequence was used
for display purposes. The distance of a cross-linked residue pair in the crystal structures was
measured between the C-α atoms. Measured distances of linked residue pairs in crystal
peer-reviewed) is the author/funder. All rights reserved. No reuse allowed without permission. The copyright holder for this preprint (which was not. http://dx.doi.org/10.1101/055418doi: bioRxiv preprint first posted online May. 25, 2016;
14
structures were compared to a theoretical cross-linking limit, which was calculated as side-chain
length of cross-linked residues plus the spacer length of the cross-linker. An additional 2 Å was
added for each residue as allowance for residue displacement in crystal structures. The
following side-chain lengths were used for the calculation: 6.0 Å for lysine, 2.4 Å for threonine,
2.4 Å for serine and 6.5 Å for tyrosine. For example, for a lysine-lysine cross-link, the theoretical
cross-linking limit is 27.4 Å. Solvent accessibility of cross-linked residues in the crystal
structures were obtained using ‘Protein interfaces, surfaces and assemblies' service PISA at the
European Bioinformatics Institute. (http://www.ebi.ac.uk/pdbe/prot_int/pistart.html) (24).
Accession codes
The mass spectrometry proteomics data have been deposited to the ProteomeXchange
Consortium (25) (http://proteomecentral.proteomexchange.org) via the PRIDE partner repository
with the dataset identifier PXD001675.
peer-reviewed) is the author/funder. All rights reserved. No reuse allowed without permission. The copyright holder for this preprint (which was not. http://dx.doi.org/10.1101/055418doi: bioRxiv preprint first posted online May. 25, 2016;
15
Results
Quantitative cross-linking/mass spectrometry (QCLMS) of C3 and C3b in solution
To assess the abilities of QCLMS to reflect conformational changes, we studied the structurally
well-characterized differences between C3 (PDB|2A73) and its activated cleavage product C3b
(PDB|2I07). We cross-linked both purified proteins in solution using bis[sulfosuccinimidyl]
suberate (BS3) and its deuterated analogue BS3-d4 (5-7) (Fig 1C) in four distinct protein-cross-
linker combinations, generating C3+BS3, C3+BS3-d4, C3b+BS3 and C3b+BS3-d4. BS3 is a
homo-bifunctional cross-linker containing an amine-reactive N-hydroxysulfosuccinimide (NHS)
ester at each end. It reacts primarily with the -amino groups of lysine residues and the amino-
terminus of a protein, however it can also react with hydroxyl groups of serine, tyrosine and
threonine residues (26). Native C3 and C3b are each composed of two polypeptides chains
(andfor C3,and’ for C3b) connected by a disulfide bond. In all four cross-linking
reactions, the two polypeptide chains of C3/C3b were efficiently cross-linked by BS3 or BS3-d4,
and the resultant two-chain products of cross-linking could be isolated by SDS-PAGE (Fig. 1D)
and subjected to in-gel trypsin digestion (16). A 1:1 mixture of C3+BS3 and C3b+BS3-d4 digests
along with a “label-swapped” replica (C3+BS3-d4 and C3b+BS3 digests) were analyzed by liquid
chromatography-tandem mass spectrometry (LC-MS/MS) (27). Cross-linked peptides were
identified by database searching and then quantified based on their MS signals (Fig. 1E).
Wherever C3 and C3b have regions of identical structure, cross-linked peptides should
be seen in mass spectra as 1:1 doublet signals (separated by 4 Da). In contrast, where C3 and
C3b structures differ, unique cross-links may occur and these will lead to singlets in mass
spectra (Fig. 1A). Signal interferences, extended isotope envelopes or experimental variations
peer-reviewed) is the author/funder. All rights reserved. No reuse allowed without permission. The copyright holder for this preprint (which was not. http://dx.doi.org/10.1101/055418doi: bioRxiv preprint first posted online May. 25, 2016;
16
may affect quantification. Experimental variations are addressed by replica analysis. Swapping
the use of labels in the replica addresses problems arising from extended isotope envelopes
and signal interference. Importantly, the label-swap enabled quantitation of cross-linked
peptides with singlet signals by generating signature signal patterns (Fig 1A); it also prevented
singlet signals of BS3 cross-linked (light) peptides from being mistakenly quantified as doublets
when the heavy and the light signals of cross-linked peptides overlap (Fig. 3A). Swapping the
use of labels also assists in the identification of cross-links. Singlet signals move by 4 Da, while
doublet signals remain as doublets. This behavior of signals corresponding to cross-linked
peptides is also clearly distinct from those of peptides contain no cross-linked amino acid
residues (Fig. 3A).
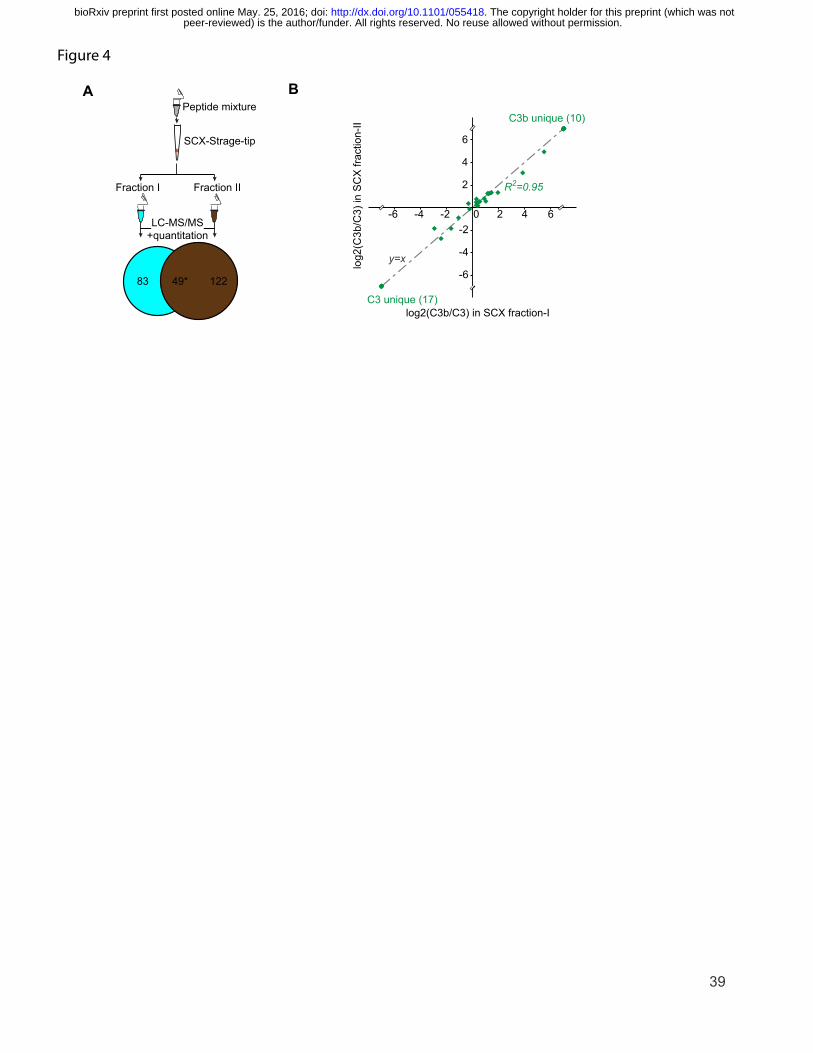
In experiment I, we conducted strong cation exchange (SCX)-based fractionation to
increase the number of identifiable cross-linked peptides (Fig. 4A). Interestingly, only 20% of all
unique cross-linked peptide pairs (25/127) eluted in more than a single fraction. 24 of these 25
cross-linked peptides eluted in two fractions in both forward-labeled and reverse-labeled
samples (one only quantified in the reverse-labeled) showing good reproducibility of SCX
fractionation. For 49 quantified events of these 25 cross-linked peptides that were identified and
quantified in two sequential SCX fractions, we observed that the C3b/C3 signal ratios were
highly reproducible (100% for C3/C3b unique cross-linked peptides and R2=0.95 for cross-linked
peptides quantified with ratios, Fig. 4B). We conclude that SCX appears to be compatible with
QCLMS and a worthwhile step in the procedure while cross-linked peptides can be quantified
with high technical reproducibility.
In an ideal case, the ratio of the component signals of a doublet would simply be a
function of the relative likelihood of linking a particular residue pair in each of the two different
protein conformations. As shown above, good agreement on the signal ratio of identical cross-
peer-reviewed) is the author/funder. All rights reserved. No reuse allowed without permission. The copyright holder for this preprint (which was not. http://dx.doi.org/10.1101/055418doi: bioRxiv preprint first posted online May. 25, 2016;
17
linked peptides quantified in sequential SCX fractions was observed in both forward-labeled and
reverse-labeled experiments in experiment I, suggesting high technical reproducibility of our
analysis. However, we observed that different cross-linked peptide pairs that contained the
same pair of cross-linked residues, did not share the same component signal ratios (Fig. 3B).
For example, within a single experiment, for the six different cross-linked peptides that covered
the residue pair Lys1 and Lys646, the (C3b/C3) signal ratio varied between 0.3 and 1.9
(Supplemental Table S1). This by far exceeds the variation seen in technical replicates. They
resulted from methionine oxidation and also missed cleavages and thus may link to sample
preparation or to the impact of conformation on proteolysis cleavage efficiencies. To translate
data on multiple peptide pairs containing the same cross-linked residues into a single data point
for that residue pair, we took the median ratio [i.e. log2(C3b/C3)] of all supporting cross-linked
peptide pairs for each residue pair. This is equivalent to the procedure used for the inference of
protein ratios from peptide ratios in standard quantitative proteomics.
Semi-automated quantitation for cross-linked peptides using Pinpoint
A practical challenge for quantifying cross-link data is how to capture efficiently the signal
intensities of cross-linked peptides from a large quantity of mass spectrometric raw data.
Available quantitative proteomics software does not accommodate cross-linked peptides (4). A
previous protocol for QCLMS resorted to manual quantification (10). Manual quantitation relies
more on user expertise and subjective criteria; in respect to automated analysis, it is less
comparable between labs. When dataset size increases, manual quantitation becomes
increasingly time consuming and impractical. Furthermore, any repetitive task done by a human
is error-prone. To alleviate this we developed a semi-automated workflow using the quantitative
proteomics software package, Pinpoint. The resultant workflow utilizes the well-established
functionality of Pinpoint to retrieve intensities of both light and heavy version of every cross-
peer-reviewed) is the author/funder. All rights reserved. No reuse allowed without permission. The copyright holder for this preprint (which was not. http://dx.doi.org/10.1101/055418doi: bioRxiv preprint first posted online May. 25, 2016;
18
linked peptide in an automatic manner. Furthermore, the user interface of Pinpoint provides,
when necessary, a platform for visualizing and validating the quantitation results of any chosen
cross-linked peptides. Hence, improvements to the accuracy of quantitation by introducing
knowledge-based expertise can be achieved easily and rapidly.
Pinpoint is normally restricted to work with single peptides. Therefore it was necessary to
convert our cross-linked peptide pairs into a “linearized” single-peptide format, following a
previous approach developed for database searches (16) (Fig. 2A). This allowed generation of a
tailored input library of cross-linked peptides (Fig. 2B) based on “General Spectral Library
Format for Pinpoint” (Supplemental File S1). In general, Pinpoint requires a very basic set of
information to quantify a cross-linked peptide: amino acid sequence, precursor charge state,
retention time, and chemical modifications. A consequence of this minimal requirement of
information is that quantification can be performed in Pinpoint independently of the method used
for identifying the cross-linked peptides in the first place.
Pinpoint calculates the theoretical m/z of each converted (“linearized”) cross-linked
peptide and identifies its signal (within 6 ppm error tolerance in our case) in the raw MS data.
Although isotope-related shifts in retention time often occur, in most cases, the retention time of
the BS3 and BS3-d4 cross-linked versions of a cross-linked peptide in LC-MS/MS overlap to
some extent. In order to accurately define singlet and doublet signals of cross-linked peptides,
we programmed Pinpoint to retrieve intensity information of both light and heavy signals for
each cross-linked peptide by including both a BS3 cross-linked and a BS3-d4 cross-linked
version of them in the input library.
As discussed above, accurate quantitation of a cross-linked peptide relies on consistent
read-out from both replicates of the label-swap analysis. This is especially important for cross-
linked peptides that are unique in one of the two conformations. However, cross-linked peptides
peer-reviewed) is the author/funder. All rights reserved. No reuse allowed without permission. The copyright holder for this preprint (which was not. http://dx.doi.org/10.1101/055418doi: bioRxiv preprint first posted online May. 25, 2016;
19
were not always fragmented and identified in each replica. Such “under sampling” of signals is
common in shotgun proteomics and likely exasperated due to the generally low abundance of
cross-linked peptides. The Pinpoint interface also provides a platform to conduct “Match
between runs” (22). The high mass accuracy achieved in the analysis of the high-resolution
Orbitrap data and reproducible LC retention time facilitated this transfer of peptide identities.
Thus, all identified cross-linked peptides were quantified in both replica experiments even
though they were not necessarily identified in both replicas.
The aggregated intensity of each cross-linked peptide was calculated from the summed
area of the three most intense peaks among the first four peaks in the isotope envelope. In
cases where a cross-linked peptide was identified with more than one charge state, intensities
derived from the different charge states were automatically combined by Pinpoint. Pinpoint did
not select correctly the start or end of an elution peak in every instance. Manual curation was
therefore still necessary, albeit largely supported by the Pinpoint interface. In addition, cross-
linked peptides were discarded for quantitation if they did not have proper signals for the first
three peaks of their isotope envelopes.
Consequently, for each cross-linked peptide, Pinpoint provided intensities for both light
(BS3) and heavy (BS3-d4) signals. The results were exported into a .csv file. The subsequent
processes for generating the final quantitation results were carried out using a Microsoft Excel
spreadsheet. This included calculating the C3b/C3 signal ratio for each quantified event of
cross-linked peptides, normalizing C3b/C3 signal ratio within each cross-link replica,
summarizing C3b/C3 signal ratios for each cross-linked residue pair from the C3b/C3 signal
ratios of its supporting cross-linked peptides; and then combining the outcomes of quantitation
for the label-swapped replicas and for two experiments (experiment I and experiment II).
peer-reviewed) is the author/funder. All rights reserved. No reuse allowed without permission. The copyright holder for this preprint (which was not. http://dx.doi.org/10.1101/055418doi: bioRxiv preprint first posted online May. 25, 2016;
20
Cross-linking confirms in solution, C3 to C3b conformational transition
In total, we quantified 104 unique cross-linked residue pairs (cross-links) that could be divided
into three groups based on their MS1 signal types: 31 C3-unique cross-links, 24 C3b-unique
cross-links and 49 cross-links observed in both proteins. When the “Significance A” test from the
standard proteomics data analysis tool Perseus (version 1.4.1.2) (21) was applied to the 49
cross-links observed in both C3 and C3b, based on their log2(C3b/C3) values, three subgroups
appeared: 37 showed no significant change (named here mutual), four linked residue pairs were
significantly enriched (p<0.05) in C3b and eight linked residue pairs were significantly enriched
in C3 (p<0.05). The conformational differences/similarities between C3 and C3b were revealed
by the locations of these 104 quantified cross-links (Fig. 5A). 31 C3-unique cross-links and 24
C3b-unique cross-links highlighted where the structures of C3 and C3b differs; 37 cross-links
that showed no significant change would suggest structural features that are unaffected by
cleavage of C3 to C3b; eight C3-enriched and four C3-enriched cross-links potentially reflected
minor conformational changes. These quantified groups and subgroups were not randomly
distributed, neither in the primary sequences nor in the 3D structures of C3 (PDB|2A73) (13)
and C3b (PDB|2I07) (14) (Figs. 5B, C, D, E). The structural differences and similarities between
C3 and C3b as deduced based on our QCLMS data are in agreement with the crystal structures
of the two proteins.
Conversion from C3 to C3b is triggered by proteolytic cleavage of the 7-kDa
anaphylatoxin (ANA) domain from the N-terminus of the alpha chain. It is therefore not
surprising that 20 out of the 31 residue pairs that were found to be cross-linked only in C3
involved ANA. Six of these 20 residue pairs included ANA residues as one partner and residues
of MG3, MG8 and TED as the other. Thus these C3-exclusive ANA-specific cross-links clearly
define a spatial location for ANA in the C3 molecule that is wholly consistent with the crystal
peer-reviewed) is the author/funder. All rights reserved. No reuse allowed without permission. The copyright holder for this preprint (which was not. http://dx.doi.org/10.1101/055418doi: bioRxiv preprint first posted online May. 25, 2016;
21
structure (Fig. 5C). The remaining 84 cross-links (11 unique to C3, 24 unique to C3b, and 49
mutual ones) (Figs. 5B, C, D E), report on the extent and nature of rearrangements of the 12
non-ANA domains, namely C345C, TED, CUB, LNK and eight MG domains.
The data confirmed that the spatial arrangement of the domains of the β-chain is
conserved following cleavage of the alpha chain: only two cross-links unique to either C3 or C3b
involved residues in this chain, compared to 33 C3-unique or C3b-unique cross-links for -chain
domains. The cross-links in the β-chain that are conserved between C3 and C3b occur within
(13 cross-links) or between (10 cross-links) its seven intact domains (six MG domains and the
LNK domain). In contrast, the remaining domains of the -chain appears to rearrange
extensively following ANA excision: A total of 28 of the 33 C3-unique or C3b-unique cross-links
in the -chain are between domains and only five are within domains; this compares to the
identification of nine out of the 12 preserved (not unique to C3 or C3b) -chain cross-links within
domains. In essence, all but one of the domains remain largely unaltered in structure following
activation of C3, despite their arrangement changing. An exception is a set of four C3b-unique
cross-links identified within MG8. This suggests that conformational changes occur within MG8,
to a greater extent than in the other MG domains, following C3 cleavage
Inspection of pairs of amino acid residues that were cross-linked exclusively either in C3
or in C3b illuminates three major rearrangements in the α-chain that accompany the conversion
of C3 to C3b. These observations, made in solution, strongly agree with the conformational
changes inferred from comparing the crystal structures of C3 (PDB 2A73) and C3b (PDB 2I07)
(Fig. 5C, D; Supplemental Table S2). First, residues within the α’- N-terminal (NT) segment (the
region of the C3b α-chain that becomes the new terminus after ANA cleavage) are involved in
four C3-unique cross-links and six C3b-unique cross-links. These cross-links captured, in C3,
the proximity of the α-NT segment to ANA and MG8, In C3b the cross-links confirmed re-
peer-reviewed) is the author/funder. All rights reserved. No reuse allowed without permission. The copyright holder for this preprint (which was not. http://dx.doi.org/10.1101/055418doi: bioRxiv preprint first posted online May. 25, 2016;
22
location of α’-NT from the MG8/MG3 side to the opposite, C345C/MG7, side of the structure
(14). Second, migration of the CUB and TED domains is reflected by two subsets of cross-links.
Five cross-links from TED to MG8, MG7, ANA and MG2 support the location of TED at
“shoulder-height” as observed in the traditional view of the crystal structure of C3 (Fig. 5C) (13).
In C3b, these cross-links were no longer detectable and had been effectively replaced by five
TED-MG1 cross-links and a CUB-MG1 cross-link, locating the TED at the “bottom” of the β-
chain key ring (14) structure (Fig. 5D), which is again consistent with the crystal structure. Third,
distinct sets of cross-links for C3 versus C3b amongst the MG7, MG8, C345C and anchor
domains suggest the rearrangements of domains in this region. Such a domain rearrangement
is entirely consistent with a comparison of the crystal structures.
Interestingly, two pairs of residues, with one partner in TED and the other in MG1, were
cross-linked in C3b, in solution, yet were far apart in the crystal structure (38.3 and 40.4 Å
compared to a theoretical cross-linking limit of 27.4 Å for the cross-linker used here (Fig. 6A). A
change in the juxtaposition of the TED and MG1 domain could explain this but, on the other
hand, three further TED-MG1 cross-links support the arrangement seen in the C3b crystal
structure. This apparent conflict can be resolved assuming the TED domain to be mobile with
respect to MG1 in solution (Fig. 6B). This is consistent with several other indications that TED is
mobile in C3b (28-30).
QCLMS may reveal subtle protein conformational changes
Based on a comparison of QCLMS data and crystal structures, here we report some
observations that may be more generally relevant to the challenging task of translating
differences in yields of cross-linked products into inferred changes in protein conformation. Due
to the absence of some residues in the crystal structures of C3 and C3b, not all cross-links can
peer-reviewed) is the author/funder. All rights reserved. No reuse allowed without permission. The copyright holder for this preprint (which was not. http://dx.doi.org/10.1101/055418doi: bioRxiv preprint first posted online May. 25, 2016;

23
be evaluated against crystallographic evidence. Of the 104 cross-links observed, 71 bridged
residues that are present in the crystal structures of C3 and C3b.
We first investigated the structural details of 25 cross-linked residue pairs that are
unique to one of the two structures. As expected, six C3-unique and eight C3b-unique cross-
links agree only with the structure of the protein they were observed in but not the other when
considering the residue pair distance in the crystal structures, offering an explanation for their
absence based on distance solely. The remaining 11 C3/C3b-unique residue pairs, however,
would be possible in both C3 and C3b when just considering the Euclidean residue pair
distance in the crystal structures. To account for their absence from one or other structure, we
must invoke steric effects that would prevent formation of a bridge (Fig. 7B, Supplemental Fig
S1A-E), changes in accessibility of cross-linkable residues (Fig. 7C, Supplemental Fig S1F,G),
or change of side chain orientation leading to increased distance of the reactive groups
(Supplemental Fig S1I). For one case, a nearby sequence stretch absent from the crystal
structure may have interfered with cross-linking (Supplemental Fig S1I).
None of the cross-links that were quantified with ratios (n=46) involved dramatic
proximity changes and the Euclidean distances between cross-linked residues in both crystal
structures are within the limits of our cross-linker (Fig. 7A). However, we noticed that ten C3-
enriched and C3b enriched cross-links exhibited bigger variations (1.8±2.3Å) on residue
proximities between two crystal structures in comparison with those 36 mutual cross-links
(0.8±1.1Å). In addition, C3-enriched and C3b enriched cross-links co-locate with C3- and C3b-
unique cross-links by falling into the part of the molecule that experiences rearrangement during
the transition from C3 to C3b (Fig. 5E). For seven of these ten cross-links, the crystal structures
provided clues to explain the significant decrease on the yields of cross-linking in one structure
versus the other: increase on residue distance (Fig. 7D), residue side chain orientation
peer-reviewed) is the author/funder. All rights reserved. No reuse allowed without permission. The copyright holder for this preprint (which was not. http://dx.doi.org/10.1101/055418doi: bioRxiv preprint first posted online May. 25, 2016;
24
becoming less favorable for cross-linking (Supplemental Fig. S2A), change on residue
flexibilities (Supplemental Fig. S2B), as well as influence from appearance or increase of co-
located cross-links (Fig. 7D, Supplemental Fig S2C, D). The remaining three cross-links
experience differences that cannot be rationalized by the crystal representations of C3 and C3b.
However, cross-linking samples proteins in solution and the two proteins may differ in their in-
solution conformational ensembles. For this explanation also speaks that these three cross-links
were found in the domains that experience rearrangements between C3 and C3b
(Supplemental Fig. S2E).
peer-reviewed) is the author/funder. All rights reserved. No reuse allowed without permission. The copyright holder for this preprint (which was not. http://dx.doi.org/10.1101/055418doi: bioRxiv preprint first posted online May. 25, 2016;
25
Discussion
We have established a workflow for QCLMS that we believe is in accordance with good practice
in quantitative proteomics. This includes replication and label-swapping. In addition, we place
the cross-linked pairs of amino acid residues at the focus of the analysis by gathering and
summarizing all the relevant peptide quantitation data. We have lowered the barrier to entry for
researchers wishing to apply this technique by establishing a semi-automated approach; this
should also facilitate application of QCLMS to more complex systems involving, for example,
multiple proteins. To achieve this, we enabled the standard proteomic quantitation software
Pinpoint to work with data for cross-linked peptides by “linearizing” their sequences (Fig. 2A).
Importantly, this mode of quantitation is independent of the specific algorithm used for
identifying cross-linked peptides. As has recently become standard for all publications in
Molecular and Cellular Proteomics, we propose that good practice in QCLMS would include
open access to both the raw data and the lists of cross-links with associated quantitation. Our
data are available via ProteomeXchange (25) with identifier PXD001675 and in the
supplementary material.
Our study demonstrated that QCLMS is able to explore, in solution, the differences and
similarities between the arrangements of domains in C3 and C3b. Cross-links that were unique
or significantly enriched in one conformation over the other were observed in the parts of the
molecules that experience major rearrangements between C3 and C3b. On the contrary, cross-
links that show no major changes on yield in C3 and C3b were detected in the parts of structure
that are preserved from C3 to C3b. The excellent agreement of QCLMS-derived data with the
structural transitions suggested by the crystal structures of C3 and C3b provide strong support
for our approach. It also suggests some rules that determine how changes in protein
conformation influence the yields of cross-linked peptides. Clearly, residue proximity can in
peer-reviewed) is the author/funder. All rights reserved. No reuse allowed without permission. The copyright holder for this preprint (which was not. http://dx.doi.org/10.1101/055418doi: bioRxiv preprint first posted online May. 25, 2016;
26
many cases act as a simple binary switch for cross-link formation. But even in instances where
a bridgeable distance between two cross-linkable residues is largely preserved during a
conformational change (here as close as 0.1 Å), other factors than distance may impact cross-
link formation; these include changes in surface accessibilities or the positions of the two
partners relative to other structural features. While these factors could completely prohibit
formation of a cross-link between two residues that are within range, complete negation seems
to be rare. More commonly, these non-distance factors cause variation in yields of cross-linked
products. This is manifested in a linkage that is enriched in one conformer relative to the other.
In general, only complete loss of a cross-link may result from large conformational changes. In
contrast, depletion or enrichment of the cross-link correlates with more local conformational
changes that do not involve major distance change between cross-linked residues. It is
therefore essential to distinguish experimentally between the two scenarios. This is possible
through the robust quantitation, using replicated analysis with isotopic label-swapping, outlined
herein
In conclusion, QCLMS is emerging as a tool for studying dynamic protein architectures.
We have presented a carefully designed and thoroughly evaluated workflow for QCLMS
analysis using isotope-labeled cross-linkers. A limitation of the approach is that each conformer
to be analyzed must be stable on a time-scale during which it can be resolved from other
conformers and then cross-linked. On the other hand, the automation in quantitation achieved in
our protocols means that it is now feasible to extend a QCLMS study to the conformational
changes that occur in multiple-protein assemblies (12). Thus it should be possible, for example,
to follow the conformational preferences of a protein subunit in a series of assemblies as
proteins are sequentially incorporated. The quantitation module in our workflow can also be
adapted for SILAC-based quantitation or label-free quantitation (31) for cross-linked peptides.
peer-reviewed) is the author/funder. All rights reserved. No reuse allowed without permission. The copyright holder for this preprint (which was not. http://dx.doi.org/10.1101/055418doi: bioRxiv preprint first posted online May. 25, 2016;

27
We envision that QCLMS will greatly facilitate the investigation of conformational dynamics in
solution and help to animate the current largely crystallography-derived “snapshots” of biological
processes.
peer-reviewed) is the author/funder. All rights reserved. No reuse allowed without permission. The copyright holder for this preprint (which was not. http://dx.doi.org/10.1101/055418doi: bioRxiv preprint first posted online May. 25, 2016;
28
Acknowledgments
We thank Christoph Schmidt, Carla Clark and Paul McLaughlin for helpful discussions and
Morten Rasmussen for initial software developments. We thank Sven Giese for helping
providing annotated MS2 spectra. We acknowledge the PRIDE team for the deposition of our
data to the ProteomeXchange Consortium. This work was supported by the Wellcome Trust
(PNB: 081179, JR: 103139, Centre core grant: 092076, instrument grant: 108504) and BBSRC
(BB/I007946/1). JR is a Senior Research Fellow of the Wellcome Trust.
peer-reviewed) is the author/funder. All rights reserved. No reuse allowed without permission. The copyright holder for this preprint (which was not. http://dx.doi.org/10.1101/055418doi: bioRxiv preprint first posted online May. 25, 2016;

29
References
1. Leitner, A., Walzthoeni, T., Kahraman, A., Herzog, F., Rinner, O., Beck, M., and
Aebersold, R. (2010) Probing native protein structures by chemical cross-linking, mass
spectrometry, and bioinformatics. Mol Cell Proteomics 9, 1634-1649
2. Rappsilber, J. (2011) The beginning of a beautiful friendship: Cross-linking/mass
spectrometry and modelling of proteins and multi-protein complexes. J Struct Biol 173, 530-540
3. Sinz, A. (2006) Chemical cross-linking and mass spectrometry to map three-dimensional
protein structures and protein-protein interactions. Mass Spectrom Rev 25, 663-682
4. Fischer, L., Chen, Z. A., and Rappsilber, J. (2013) Quantitative cross-linking/mass
spectrometry using isotope-labelled cross-linkers. Journal of proteomics 88, 120-128
5. Kalkhof, S., Ihling, C., Mechtler, K., and Sinz, A. (2005) Chemical cross-linking and high-
performance Fourier transform ion cyclotron resonance mass spectrometry for protein
interaction analysis: application to a calmodulin/target peptide complex. Anal Chem 77, 495-503
6. Mueller, D. R., Schindler, P., Towbin, H., Wirth, U., Voshol, H., Hoving, S., and
Steinmetz, M. O. (2001) Isotope-tagged cross-linking reagents. A new tool in mass
spectrometric protein interaction analysis. Anal Chem 73, 1927-1934
7. Pearson, K. M., Pannell, L. K., and Fales, H. M. (2002) Intramolecular cross-linking
experiments on cytochrome c and ribonuclease A using an isotope multiplet method. Rapid
Commun Mass Spectrom 16, 149-159
8. Rinner, O., Seebacher, J., Walzthoeni, T., Mueller, L. N., Beck, M., Schmidt, A., Mueller,
M., and Aebersold, R. (2008) Identification of cross-linked peptides from large sequence
databases. Nat Methods 5, 315-318
9. Schmidt, C., Zhou, M., Marriott, H., Morgner, N., Politis, A., and Robinson, C. V. (2013)
Comparative cross-linking and mass spectrometry of an intact F-type ATPase suggest a role for
phosphorylation. Nature communications 4, 1985
peer-reviewed) is the author/funder. All rights reserved. No reuse allowed without permission. The copyright holder for this preprint (which was not. http://dx.doi.org/10.1101/055418doi: bioRxiv preprint first posted online May. 25, 2016;

30
10. Schmidt, C., and Robinson, C. V. (2014) A comparative cross-linking strategy to probe
conformational changes in protein complexes. Nat Protoc 9, 2224-2236
11. Kukacka, Z., Rosulek, M., Strohalm, M., Kavan, D., and Novak, P. (2015) Mapping
protein structural changes by quantitative cross-linking. Methods
12. Tomko, R. J., Jr., Taylor, D. W., Chen, Z. A., Wang, H. W., Rappsilber, J., and
Hochstrasser, M. (2015) A Single alpha Helix Drives Extensive Remodeling of the Proteasome
Lid and Completion of Regulatory Particle Assembly. Cell 163, 432-444
13. Janssen, B. J., Huizinga, E. G., Raaijmakers, H. C., Roos, A., Daha, M. R., Nilsson-
Ekdahl, K., Nilsson, B., and Gros, P. (2005) Structures of complement component C3 provide
insights into the function and evolution of immunity. Nature 437, 505-511
14. Janssen, B. J., Christodoulidou, A., McCarthy, A., Lambris, J. D., and Gros, P. (2006)
Structure of C3b reveals conformational changes that underlie complement activity. Nature 444,
213-216
15. Sanchez-Corral, P., Anton, L. C., Alcolea, J. M., Marques, G., Sanchez, A., and Vivanco,
F. (1989) Separation of active and inactive forms of the third component of human complement,
C3, by fast protein liquid chromatography (FPLC). J Immunol Methods 122, 105-113
16. Maiolica, A., Cittaro, D., Borsotti, D., Sennels, L., Ciferri, C., Tarricone, C., Musacchio, A.,
and Rappsilber, J. (2007) Structural analysis of multiprotein complexes by cross-linking, mass
spectrometry, and database searching. Mol Cell Proteomics 6, 2200-2211
17. Ishihama, Y., Rappsilber, J., and Mann, M. (2006) Modular stop and go extraction tips
with stacked disks for parallel and multidimensional Peptide fractionation in proteomics. J
Proteome Res 5, 988-994
18. Rappsilber, J., Mann, M., and Ishihama, Y. (2007) Protocol for micro-purification,
enrichment, pre-fractionation and storage of peptides for proteomics using StageTips. Nat
Protoc 2, 1896-1906
peer-reviewed) is the author/funder. All rights reserved. No reuse allowed without permission. The copyright holder for this preprint (which was not. http://dx.doi.org/10.1101/055418doi: bioRxiv preprint first posted online May. 25, 2016;
31
19. Rappsilber, J., Ishihama, Y., and Mann, M. (2003) Stop and go extraction tips for matrix-
assisted laser desorption/ionization, nanoelectrospray, and LC/MS sample pretreatment in
proteomics. Anal Chem 75, 663-670
20. Ishihama, Y., Rappsilber, J., Andersen, J. S., and Mann, M. (2002) Microcolumns with
self-assembled particle frits for proteomics. J Chromatogr A 979, 233-239
21. Cox, J., and Mann, M. (2008) MaxQuant enables high peptide identification rates,
individualized p.p.b.-range mass accuracies and proteome-wide protein quantification. Nat
Biotechnol 26, 1367-1372
22. Thakur, S. S., Geiger, T., Chatterjee, B., Bandilla, P., Frohlich, F., Cox, J., and Mann, M.
(2011) Deep and highly sensitive proteome coverage by LC-MS/MS without prefractionation.
Mol Cell Proteomics 10, M110 003699
23. DeLano, W. L. (2002) The PyMOL Molecular Graphics System. DeLano Scientific, San
Carlos, CA, USA
24. Krissinel, E., and Henrick, K. (2007) Inference of macromolecular assemblies from
crystalline state. J Mol Biol 372, 774-797
25. Vizcaino, J. A., Deutsch, E. W., Wang, R., Csordas, A., Reisinger, F., Rios, D., Dianes, J.
A., Sun, Z., Farrah, T., Bandeira, N., Binz, P. A., Xenarios, I., Eisenacher, M., Mayer, G., Gatto,
L., Campos, A., Chalkley, R. J., Kraus, H. J., Albar, J. P., Martinez-Bartolome, S., Apweiler, R.,
Omenn, G. S., Martens, L., Jones, A. R., and Hermjakob, H. (2014) ProteomeXchange provides
globally coordinated proteomics data submission and dissemination. Nat Biotechnol 32, 223-
226
26. Kalkhof, S., and Sinz, A. (2008) Chances and pitfalls of chemical cross-linking with
amine-reactive N-hydroxysuccinimide esters. Anal Bioanal Chem 392, 305-312
27. Chen, Z. A., Jawhari, A., Fischer, L., Buchen, C., Tahir, S., Kamenski, T., Rasmussen,
M., Lariviere, L., Bukowski-Wills, J. C., Nilges, M., Cramer, P., and Rappsilber, J. (2010)
peer-reviewed) is the author/funder. All rights reserved. No reuse allowed without permission. The copyright holder for this preprint (which was not. http://dx.doi.org/10.1101/055418doi: bioRxiv preprint first posted online May. 25, 2016;
32
Architecture of the RNA polymerase II-TFIIF complex revealed by cross-linking and mass
spectrometry. EMBO J 29, 717-726
28. Alcorlo, M., Tortajada, A., Rodriguez de Cordoba, S., and Llorca, O. (2013) Structural
basis for the stabilization of the complement alternative pathway C3 convertase by properdin.
Proc Natl Acad Sci U S A 110, 13504-13509
29. Nishida, N., Walz, T., and Springer, T. A. (2006) Structural transitions of complement
component C3 and its activation products. Proc Natl Acad Sci U S A 103, 19737-19742
30. Pechtl, I. C., Neely, R. K., Dryden, D. T., Jones, A. C., and Barlow, P. N. (2011) Use of
time-resolved FRET to validate crystal structure of complement regulatory complex between
C3b and factor H (N terminus). Protein Sci 20, 2102-2112
31. Herbert, A. P., Makou, E., Chen, Z. A., Kerr, H., Richards, A., Rappsilber, J., and Barlow,
P. N. (2015) Complement Evasion Mediated by Enhancement of Captured Factor H:
Implications for Protection of Self-Surfaces from Complement. J Immunol
peer-reviewed) is the author/funder. All rights reserved. No reuse allowed without permission. The copyright holder for this preprint (which was not. http://dx.doi.org/10.1101/055418doi: bioRxiv preprint first posted online May. 25, 2016;
33
Figure Legends
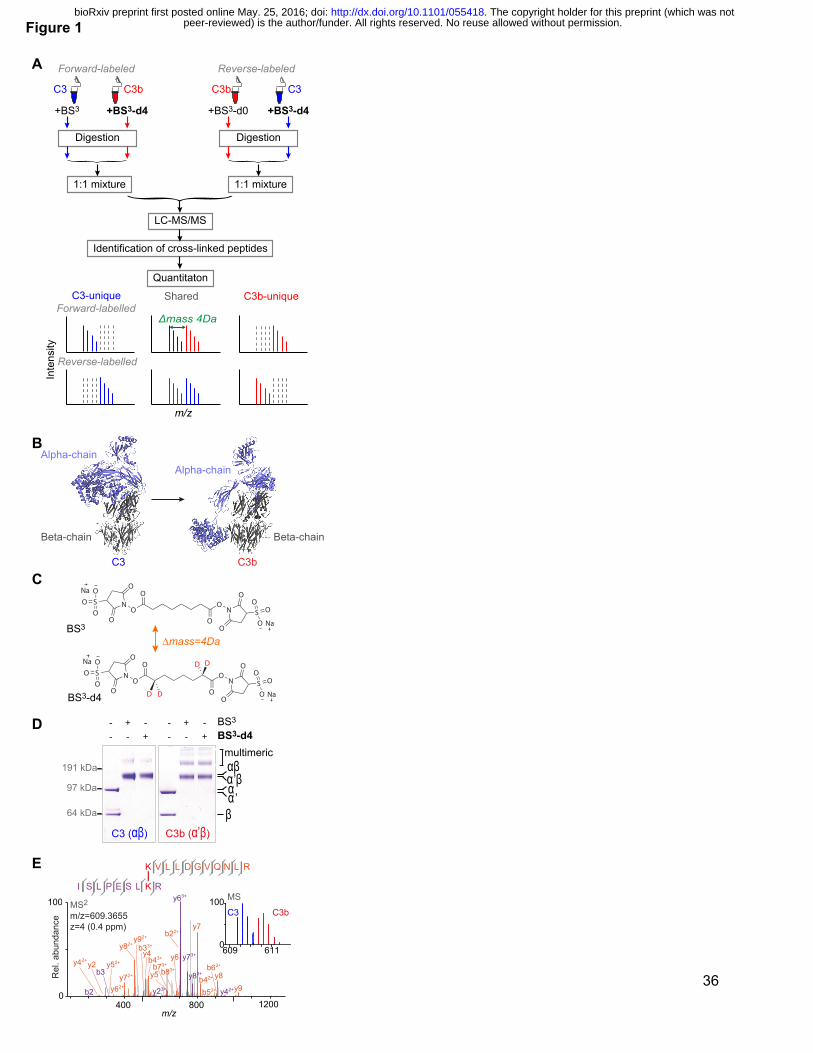
Figure 1: Quantitative CLMS analysis of C3, C3b and iC3 in solution.
(A) The strategy of QCLMS using isotopologues of a cross-linker to compare two protein
conformations. (B) The crystal structures of C3 (PDB|2A73) and C3b (PDB|2I07) with the α-
chain (in C3)/α’-chain (in C3b) (blue) and the β-chains (grey) highlighted. (C) Chemical structure
of cross-linkers BS3 and BS3-d4. (D) SDS-PAGE shows that BS3 (light cross-linker) and BS3-d4
(heavy cross-linker) cross-link C3 and C3b with roughly equivalent overall efficiencies, and that
broadly similar sets of cross-linked protein products were obtained. (E) High-resolution
fragmentation spectrum of BS3-cross-linked peptides ISLPESLK(cl)R-K(cl)VLLDGVQNLR that
reveals a cross-link between Lys 267 and Lys 283. The mass spectrum of the precursor ion is
shown (blue) in the inset; also present (red) is the signal of the precursor ion corresponding to
the equivalent BS3-d4 cross-linked peptides.
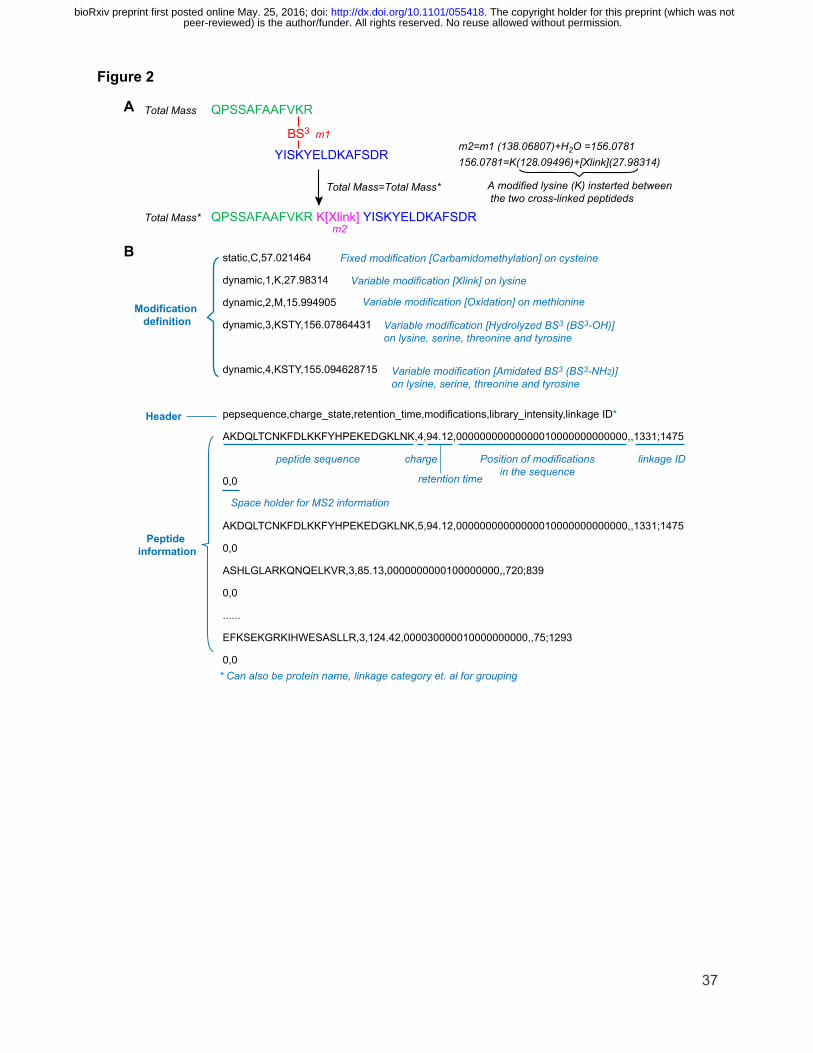
Figure 2: Construction of Pinpoint peptide library for cross-linked peptides.
(A) The principle of converting a cross-linked peptide pair into a “linearized” format that has an
identical mass. (B) An example Pinpoint-input peptide library for cross-linked peptides with its
key contents annotated.
Figure 3: Quantitation of cross-linked peptides.
(A) MS signals from paired quantitation analyses with label-swapping. These allow a clear
distinction to be made between cross-linked peptides with a singlet signal, cross-linked peptides
with a doublet signal, and a non-cross-linked peptide; these are all potentially similar and could
therefore be confused in a non-paired quantitative analysis (B) Spread of quantitation data at
the level of cross-linked peptides. For each of 104 quantified cross-links, the ratio of C3b to C3-
peer-reviewed) is the author/funder. All rights reserved. No reuse allowed without permission. The copyright holder for this preprint (which was not. http://dx.doi.org/10.1101/055418doi: bioRxiv preprint first posted online May. 25, 2016;

34
derived signal is shown in red, while the ratio of C3b to C3-derived cross-link signal for its
supporting, cross-linked peptides is plotted in blue (C) Ratios of C3b to C3-derived signals for
49 cross-links that were observed in both C3 and C3b. The summarized C3b/C3 ratios and
C3b/C3 ratios observed in biological (cross-link) replicas are shown for each cross-linked
residue pair. Cross-links that are significantly enriched are indicated (“Significant A” test p< 0.05
(21) ).
Figure 4: Strong cation exchange based enrichment for cross-linked peptides is
compatible with QCLMS analysis.
(A) Strong cation exchange (SCX)-based enrichment using SCX-Stage Tips applied in QCLMS
analysis of C3 and C3b. (B) Reproducibility of C3b/C3 signal ratios of 49 quantified events of 25
unique cross-linked peptides in two SCX fractions in which they were detected.
Figure 5 Quantitative CLMS analysis reveals the domain rearrangements, in solution,
which accompany the activation of C3.
(A) 104 unique cross-links that were quantified in C3 and C3b samples were allocated to three
groups: 31 are unique to C3 (20 involve the ANA domain); 24 are unique to C3b; 49 were
observed in both C3 and C3b (of these, four are statistically enriched in C3b, eight are enriched
in C3 and 37 (denoted “mutual”) are equally represented in both C3 and C3b. (B) The 37 mutual
cross-links (black) are displayed on the crystal structures of C3 (PDB|2A73) and C3b
(PDB|2I07). Of these, 19 are intra-domain, consistent with the conserved structures of these
domains in C3 versus C3b. The remaining (18) links pairs of domains whose relative positions
are similar in C3 and C3b. (C) As displayed in the C3 structure, C3-unique cross-links (blue) lie
mainly within the C3-specific ANA domain (light blue) and between domains in the -chain,
which are significantly rearranged upon formation of C3b. (D) The C3b-unique cross-links (red)
peer-reviewed) is the author/funder. All rights reserved. No reuse allowed without permission. The copyright holder for this preprint (which was not. http://dx.doi.org/10.1101/055418doi: bioRxiv preprint first posted online May. 25, 2016;
35
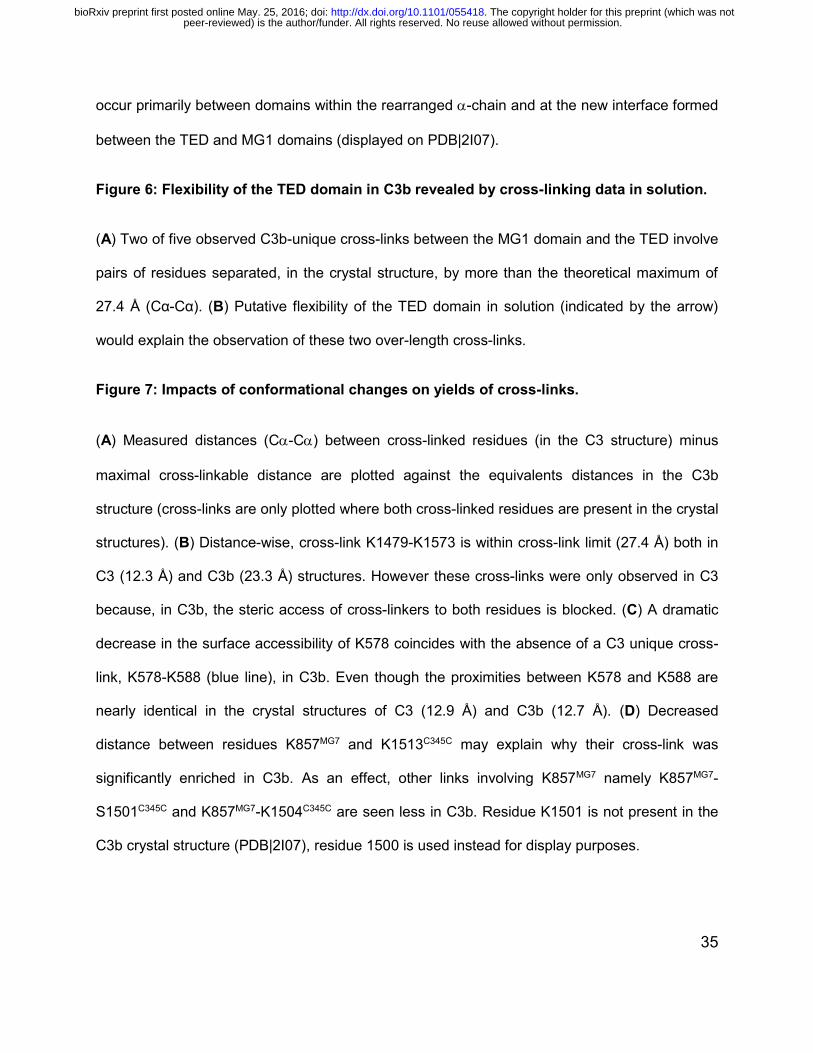
occur primarily between domains within the rearranged -chain and at the new interface formed
between the TED and MG1 domains (displayed on PDB|2I07).
Figure 6: Flexibility of the TED domain in C3b revealed by cross-linking data in solution.
(A) Two of five observed C3b-unique cross-links between the MG1 domain and the TED involve
pairs of residues separated, in the crystal structure, by more than the theoretical maximum of
27.4 Å (Cα-Cα). (B) Putative flexibility of the TED domain in solution (indicated by the arrow)
would explain the observation of these two over-length cross-links.
Figure 7: Impacts of conformational changes on yields of cross-links.
(A) Measured distances (C-C) between cross-linked residues (in the C3 structure) minus
maximal cross-linkable distance are plotted against the equivalents distances in the C3b
structure (cross-links are only plotted where both cross-linked residues are present in the crystal
structures). (B) Distance-wise, cross-link K1479-K1573 is within cross-link limit (27.4 Å) both in
C3 (12.3 Å) and C3b (23.3 Å) structures. However these cross-links were only observed in C3
because, in C3b, the steric access of cross-linkers to both residues is blocked. (C) A dramatic
decrease in the surface accessibility of K578 coincides with the absence of a C3 unique cross-
link, K578-K588 (blue line), in C3b. Even though the proximities between K578 and K588 are
nearly identical in the crystal structures of C3 (12.9 Å) and C3b (12.7 Å). (D) Decreased
distance between residues K857MG7 and K1513C345C may explain why their cross-link was
significantly enriched in C3b. As an effect, other links involving K857MG7 namely K857MG7-
S1501C345C and K857MG7-K1504C345C are seen less in C3b. Residue K1501 is not present in the
C3b crystal structure (PDB|2I07), residue 1500 is used instead for display purposes.
peer-reviewed) is the author/funder. All rights reserved. No reuse allowed without permission. The copyright holder for this preprint (which was not. http://dx.doi.org/10.1101/055418doi: bioRxiv preprint first posted online May. 25, 2016;
E
B
191 kDa
97 kDa
64 kDa
ααβ
αβα
C3 (αβ)
-+
--
+-
-+
C3b (α’β)
BS3--
+- BS3-d4
’ ’β
multimeric
D
Figure 1
36
A Forward-labeled
Inte
nsity
m/z
C3-unique C3b-uniqueSharedForward-labelled
Reverse-labelled
Reverse-labeled
Digestion
C3
+BS3-d4
C3b
+BS3-d0
}
1:1 mixture
Digestion
C3b
+BS3-d4
C3
+BS3
}
1:1 mixture
Quantitaton
LC-MS/MS
Identification of cross-linked peptides
}
Δmass 4Da
C3 C3b
Alpha-chain
Beta-chain
Alpha-chain
Beta-chain
I
K V L L D G V Q N L R
S L P E S L K R
b2
y42+y2 y52+
y62+
y72+
y82+ b33+y92+
y4b43+
y23+
y5b73+
y63+
y73+
y7
b42+
b52+
b62+
y8
y42+y9
100
0
b3
y6
b22+
b83+y83+
609 6110
100C3 C3b
Rel
. abu
ndan
ce
400 800 1200m/z
m/z=609.3655z=4 (0.4 ppm)
MS2MS
C
NO
ON
O
O
SO
OO
S OO
O
OO
O
O
Na
Na
D
DD
D
NO
ON
O
O
SO
OO
S OO
O
OO
O
O
Na
Na
BS3
BS3-d4
∆mass=4Da
peer-reviewed) is the author/funder. All rights reserved. No reuse allowed without permission. The copyright holder for this preprint (which was not. http://dx.doi.org/10.1101/055418doi: bioRxiv preprint first posted online May. 25, 2016;
static,C,57.021464
dynamic,1,K,27.98314
dynamic,2,M,15.994905
dynamic,3,KSTY,156.07864431
dynamic,4,KSTY,155.094628715
pepsequence,charge_state,retention_time,modifications,library_intensity,linkage ID*
AKDQLTCNKFDLKKFYHPEKEDGKLNK,4,94.12,00000000000000010000000000000,,1331;1475
0,0
AKDQLTCNKFDLKKFYHPEKEDGKLNK,5,94.12,00000000000000010000000000000,,1331;1475
0,0
ASHLGLARKQNQELKVR,3,85.13,0000000000100000000,,720;839
0,0
......
EFKSEKGRKIHWESASLLR,3,124.42,000030000010000000000,,75;1293
0,0
QPSSAFAAFVKR K[Xlink] YISKYELDKAFSDR
YISKYELDKAFSDR
QPSSAFAAFVKR
BS3
A
B
Modification definition
Header
Peptide information
peptide sequence charge
retention time
Position of modificationsin the sequence
linkage ID
Space holder for MS2 information
* Can also be protein name, linkage category et. al for grouping
m2=m1 (138.06807)+H2O =156.0781156.0781=K(128.09496)+[Xlink](27.98314)
m1
m2Total Mass*
Total Mass=Total Mass*
Fixed modification [Carbamidomethylation] on cysteine
Variable modification [Xlink] on lysine
Variable modification [Oxidation] on methionine
Variable modification [Hydrolyzed BS3 (BS3-OH)] on lysine, serine, threonine and tyrosine
Variable modification [Amidated BS3 (BS3-NH2)] on lysine, serine, threonine and tyrosine
Figure 2
37
A modified lysine (K) insterted between the two cross-linked peptideds
Total Mass
peer-reviewed) is the author/funder. All rights reserved. No reuse allowed without permission. The copyright holder for this preprint (which was not. http://dx.doi.org/10.1101/055418doi: bioRxiv preprint first posted online May. 25, 2016;

QKPDGVFQEDAPVIHQEMIGGLR
855 856 857 858 859m/z
0
1000
100
Rel
ativ
e A
bund
ance
855.4348z=3
855.4343z=3
QPSSAFAAFVKR
YISKYELDKAFSDR1409
1049
VELLHNPAFCSLATTKR
SDDKVTLEERLDK
857
1504
911 912 913 914m/z
0
1000
100
Rel
ativ
e A
bund
ance 911.2276
z=4912.2308z=4
912.2329z=4
911.2267z=4
A B
C
C3b/C3=0.25
C3 unique
C3b/C3=0.10mis-quantitation
C3b/C3=0.58
C3 unique cross-link
C3 enriched cross-link
Non-cross-linked signal
Doublet signal
Singlet signal
HL
HL
HL
795 796 797 798 799m/z
0
1000
100
Rel
ativ
e A
bund
ance
795.9159z=4 796.9220
z=4
796.9220z=4
Figure 3
Fold
-cha
nge
[log2
(C3b
/C3)
]
Cross-links
Individual supportingcross-linked peptidesCross-links
C3 unique
C3b unique
-6
-4
-2
0
2
4
6
p<0.05
p<0.05Fo
ld-c
hang
e [lo
g2(C
3b/C
3)]
Summarized fold changeFold change in experiment I forward-labeledFold change in experiment I reverse-labeled
Fold change in experiment II forward-labeledFold change in experiment II reverse-labeled
-5
-4
-3
-2
-1
0
1
2
3
4
5
38
peer-reviewed) is the author/funder. All rights reserved. No reuse allowed without permission. The copyright holder for this preprint (which was not. http://dx.doi.org/10.1101/055418doi: bioRxiv preprint first posted online May. 25, 2016;
LC-MS/MS+quantitation
SCX-Strage-tip
Fraction I Fraction II
83 12249*
Peptide mixture
log2
(C3b
/C3)
in S
CX
frac
tion-
II
log2(C3b/C3) in SCX fraction-I
y=x
R2=0.95
C3b unique (10)
C3 unique (17)
-6
-4
-2
2
4
6
-6 -4 -2 0 2 4 6
A B
Figure 4
39
peer-reviewed) is the author/funder. All rights reserved. No reuse allowed without permission. The copyright holder for this preprint (which was not. http://dx.doi.org/10.1101/055418doi: bioRxiv preprint first posted online May. 25, 2016;

CC3-unique
C3
BMutual
C3 C3b
between domain
within domain
D C3b-unique
C3b
Figure 5
A
0 30 60
C3 and C3b
C3-unique
C3b-unique
C3-enriched (8)
C3b-enriched (4)
Number of linked residue pairs
Mutual (37)
31
24
49
ANA (20)
between domain
within domain
within domain
between domain
(ANA cross-linksare not included in
the pie chart)
10
1
18
19
19
5
E
40
C3 C3b
C3-enriched C3b-enriched
peer-reviewed) is the author/funder. All rights reserved. No reuse allowed without permission. The copyright holder for this preprint (which was not. http://dx.doi.org/10.1101/055418doi: bioRxiv preprint first posted online May. 25, 2016;

AC
-α d
ista
nce
in C
3b 2
I07
(Å)
0
20
40
27.4Å
C3b unique cross-links to the TED domain (5)
TED
MG1
CUB
38Å
40Å
B
C3b
Figure 6
41
peer-reviewed) is the author/funder. All rights reserved. No reuse allowed without permission. The copyright holder for this preprint (which was not. http://dx.doi.org/10.1101/055418doi: bioRxiv preprint first posted online May. 25, 2016;

A
D
C
PDB|2A73 PDB|2I07
K1573
C3
K1479K1479
K1573
C3b
x23.3 Å12.4 Å
B
PDB|2A73
15.28 Å251.19 Å2Accessible surface area (K578)
C3b
C3-uniquecross-link
K578K578
K588
K578K578
MG3
PDB|2I07
MG3
C3
Figure 7
Common (36)C3 unique (9)C3 enriched (6)C3b unique (15)C3b enriched (4)
y=xon
ly e
xpec
ted
in C
3b
not e
xpec
ted
only expected in C3
C-α
dis
tanc
e in
C3
- Cro
ss-li
nk li
mit
(Å)
C-α distance in C3b - Cross-link limit (Å)
-25
55
-25 95
C3 C3b
PDB|2A73
K857
S1501
K1513 K1504
MG7
C345C
PDB|2I07
K857
K1500*K1513 K1504
MG7
C345C
C3-enriched C3b-enriched
42
18.2 Å
23.8 Å26.2 Å26.2 Å
17.6 Å
23.5 Å
18.6 Å18.6 Å
peer-reviewed) is the author/funder. All rights reserved. No reuse allowed without permission. The copyright holder for this preprint (which was not. http://dx.doi.org/10.1101/055418doi: bioRxiv preprint first posted online May. 25, 2016;