Embed Size (px)
Citation preview

Quantitative Dosimetric Analysis Of Patterns Of Local Relapse After IMRT For Primary Extremity Soft Tissue Sarcomas
Ryan M. Lanning, Sean L. Berry, Michael R. Folkert, and Kaled M. Alektiar
Dept. of Radiation Oncology and Medical PhysicsMemorial Sloan-Kettering Cancer Center

Disclosures
• We have no conflicts of interest to disclose.

Characterizing Local Recurrence
Marginal
Central
Distant
Scar
RT Field

Objectives
• Characterize local recurrence of extremity STS treated with adjuvant IMRT based on dose received to the recurrence volume.
• Determine any patient, tumor, or treatment characteristics that may predict local recurrence.

Soft Tissue Sarcoma Study Population
Time Period: 2/2002 – 12/2010# of patients: 165Male: 101 (61%)Female: 64 (39%)Median Age: 55 (19-88) years
Pre-op IMRT:34 (21%)Median: 50Gy (48-50)
Post-op IMRT:131 (79%)Median: 63Gy (27-66.6)

Tumor and Treatment Characteristics
% nTumor Size: >10 cm 44% 73Grade: High 87% 143Depth: Deep 91% 150Site: Lower extremity 74% 123Margin Status: Positive / Close 52% 85Adjuvant Chemo: Yes 27% 45

Original RT Fields and LR Patterns

Recurrence Based on Dose Distribution
Recurrence
CTVPTV
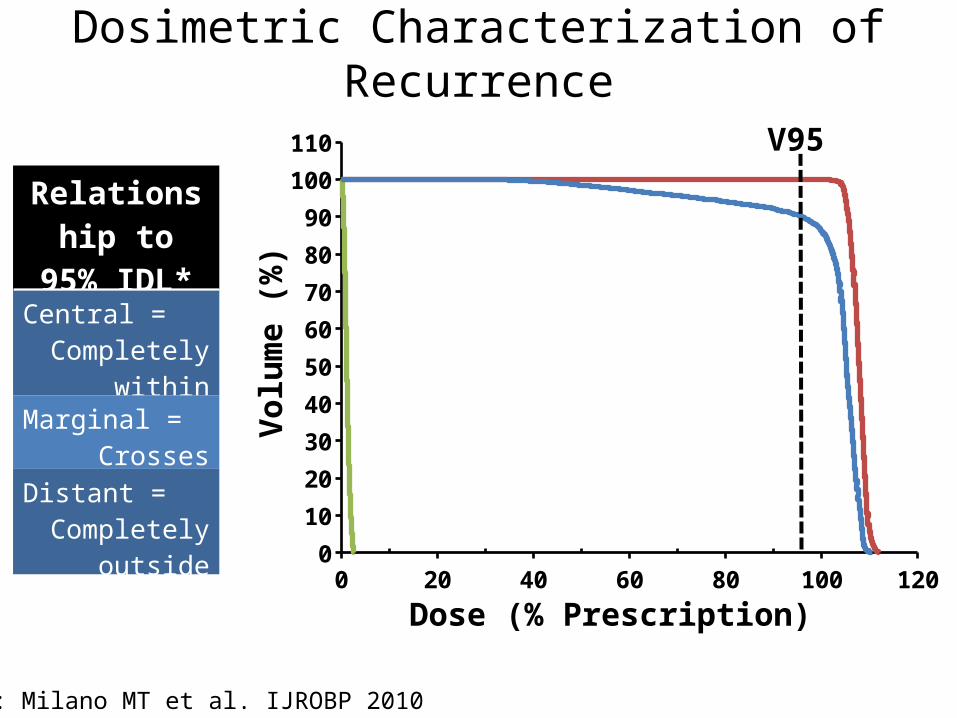
Dosimetric Characterization of Recurrence
0 20 40 60 80 100 1200
10
20
30
40
50
60
70
80
90
100
110
Marginal Central
Dose (% Prescription)
Volu
me
(%)
V95
Relationship to 95% IDL*
Central =Completely
within
Marginal =Crosses
Distant =Completely
outside
* : Milano MT et al. IJROBP 2010

Outcomes
n % 5-yr LR Median time to LR (mo)
Overall 13 -8.4%
(95% CI: 3.8 - 13)19
(range: 9 - 61)
Central 4 312.9%
(95% CI: 0 - 5.7)24
(range: 13 - 28)
Marginal 8 615.0%
(95% CI: 1.4 - 8.6)18
(range: 9 - 61)
Distant 1 8 0.7%(95% CI: 0 – 2.1)
19
Median Follow-up = 42 months
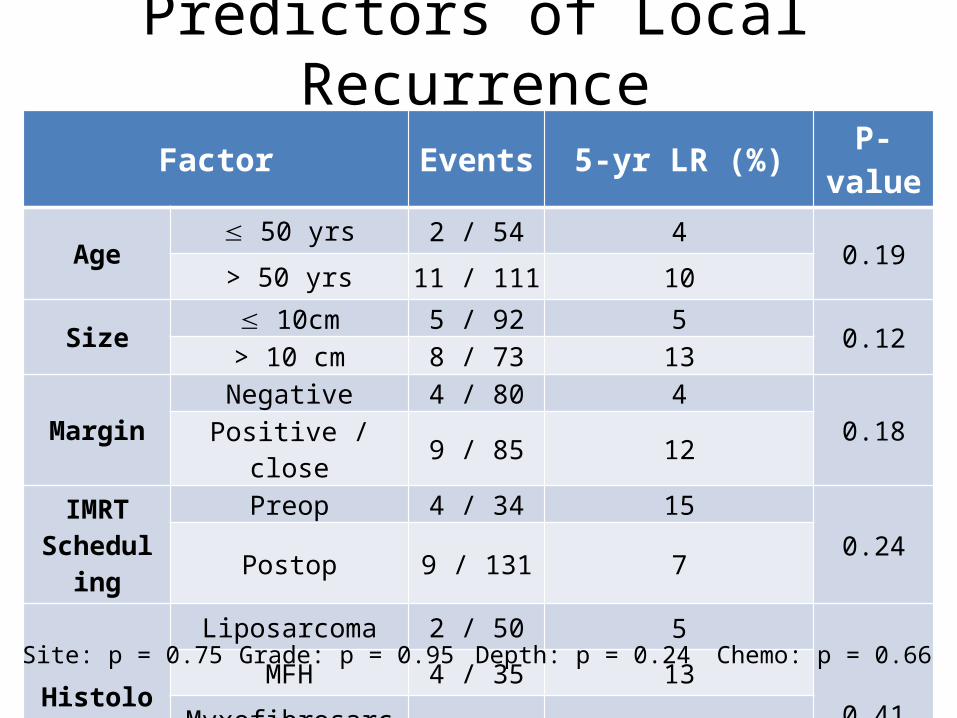
Predictors of Local RecurrenceFactor Events 5-yr LR (%) P-value
Age 50 yrs 2 / 54 4
0.19> 50 yrs 11 / 111 10
Size 10cm 5 / 92 5 0.12> 10 cm 8 / 73 13
Margin Negative 4 / 80 4 0.18Positive / close 9 / 85 12IMRT
SchedulingPreop 4 / 34 15
0.24Postop 9 / 131 7
Histology
Liposarcoma 2 / 50 5
0.41MFH 4 / 35 13
Myxofibrosarcoma 4 / 33 13Other 3 / 46 6
Depth: p = 0.24 Chemo: p = 0.66Site: p = 0.75 Grade: p = 0.95

Conclusions• Dosimetric analysis provides a quantitative
tool for characterizing local recurrence• Traditional predictors of local recurrence in
STS appear to exert less influence in the setting of IMRT
Tumor Biology
Treatment

Acknowledgements
• My collaborators: Dr. Sean Berry and Dr. Michael Folkert
• My mentor: Dr. Kaled Alektiar• CTOS selection committee, Committee chairs,
and our discussant

Room for Improvement?Histology Site dMax
(cm) Grade Margin IMRT Vrecur 95% IDL LR
1 Liposarcoma Thigh 25 Low Close / + Post-op 100% Central2 Liposarcoma Thigh 18 High Close / + Post-op 100% Central3 Myxofibrosarcoma Thigh 10.5 High Close / + Post-op 100% Central4 Myxofibrosarcoma Hand 1.6 High Close / + Pre-op 100% Central5 MFH Thigh 12 High Close / + Post-op 94.4% Marginal6 MFH Thigh 15 High Negative Post-op 93.6% Marginal7 MFH Thigh 15.3 High Negative Post-op 92.3% Marginal8 STS (NOS) Arm 6.5 Low Negative Post-op 90.5% Marginal9 STS (NOS) Thigh 5.1 High Close / + Post-op 74.1% Marginal10 Fibrosarcoma Triceps 8 High Close / + Pre-op 35.3% Marginal11 Myxofibrosarcoma Thigh 21 High Close / + Pre-op 18.5% Marginal12 Myxofibrosarcoma Thigh 17.9 High Negative Post-op 0.1% Marginal13 MFH Knee 6.6 High Close / + Pre-op 0% Distant

Recurrence CharacteristicsHistology LR Site LR
ConfirmationTime LR
to MRI (d)Vrecur
(cc) Salvage
1 Liposarcoma Central Clinical 0 23.2 S2 Liposarcoma Central Biopsy 10 48.2 S/B3 Myxofibrosarcoma Central Clinical 0 5.1 C/S/B4 Myxofibrosarcoma Central Biopsy -37 1.2 S5 MFH Marginal Biopsy 1 27.6 S6 MFH Marginal Clinical 0 32.0 C7 MFH Marginal Clinical 0 67.3 C8 STS (NOS) Marginal Biopsy 0 53.0 S9 STS (NOS) Marginal Biopsy -15 7.6 R/S10 Fibrosarcoma Marginal Biopsy 4 36.0 S11 Myxofibrosarcoma Marginal Clinical 0 47.7 S/C12 Myxofibrosarcoma Marginal Biopsy -1 737.8 R/S13 MFH Distant Biopsy -14 132.4 None
S = Surgery C = Chemotherapy R = EBRT B = Brachytherapy

CTV: GTV + 1-1.5 cm in radial axis
PTV: CTV plus 1 cm margin in all directions
Volume Expansion: Pre-op IMRTCT
V: G
TV +
4 c
m in
long
axi
s

CTV
: Tum
or b
ed +
4 c
m in
long
axi
s
PTV: CTV plus 1 cm margin in all directions
CTV: Tumor bed + 1-1.5 cm in radial axis
Volume Expansion: Postop IMRT

Local Recurrence: EBRT vs IMRT
• Competing risks, cumulative incidence, Gray’s test and Fine and Gray regression were used to estimate 5-y local recurrence:
– IMRT:7.6% (95% CI 3.4-11.8%)
– Conventional EBRT: 15% (95% CI 9.2-20.9%)
P = 0.049
Courtesy of MR Folkert

Discussion points – Basis of Improved Outcome?
• Improved conformality and homogeneity of dose may be the basis of improved local control.
1. Swanson EL et al, Int J Radiation Oncology Biol Phys. 2012 83(5):1549-57. 2. Stewart AJ et al, Radiother Oncol. 2009 Oct;93(1):125-30.3. Griffin AM et al, Int J Radiat Oncol Biol Phys. 2007 Mar 1;67(3):847-56.
Conformity/ConformalityHomogeneity/Heterogeneity
Study IMRTConventional
EBRT IMRTConventional
EBRTSwanson et al1 0.75 0.51 0.066 0.073Stewart et al2 1.33-1.59 1.76 1.036-1.045 1.052
Griffin et al3 1.27 1.76-2.34 n/a n/a
Courtesy of MR Folkert

Predictors of Local RecurrenceFactor Events 5-yr LR (%) 95% CI P-value
Age 50 yrs 2/54 4 1 - 7
0.19> 50 yrs 11/111 10 7 - 14
Site Upper 3/42 6 2 - 10 0.75Lower 10/123 9 6 - 12
Size 10cm 5/92 5 2 - 8 0.12> 10 cm 8/73 13 8 - 17
Grade Low 2/22 5 0 - 9 0.95High 11/143 9 6 - 12
Margin Negative 4/80 4 2 - 6 0.18Positive / close 9/85 12 8 - 16IMRT
SchedulingPreop 4/34 15 8 - 22 0.24Postop 9/131 7 4 - 9
Histology
Liposarcoma 2/50 5 1 - 8
0.41MFH 4/35 13 7 - 19
Myxofibrosarcoma 4/33 13 7 - 18Other 3/46 6 2 - 11
Depth: p = 0.24 Chemo: p = 0.66