Embed Size (px)
Citation preview

Quantitative Genetics

Quantitative Genetics
Polygenic traits
1. Controlled by several to many genes
2. Continuous variation—more variation not as easily characterized into classes; individuals fall into a range of phenotypes. (Think about height)
3. Genes have an additive effect on phenotype
4. Are studied in populations

The Basis of Additive Inheritance
1. Characteristics can be quantified (measured, counted, weighed, etc.)
2. Two or more genes, at different places in the genome, influence the phenotype in an additive way (polygenic).
3. Each locus may be occupied by an additive allele that does contribute to the phenotype, or a non-additive allele, which does not contribute.

The Basis of Additive Inheritance
4. The total effect of each allele on the phenotype, while small, is roughly equal to the effects of other additive alleles at other gene sites.
5. Together, the genes controlling a single character produce substantial variation in phenotype.
6. Analysis of polygenic traits requires the study of large numbers of progeny from a population of organisms.

An example: wheat berry color.
Cross true-breeding plants with white berries to true-breeding plants with dark red berries.
The resultingF1 all exhibit an intermediate color. When the F1s are crossed, the result is a range of color.

Wheat Berry ColorTrue-breeding plants with white
vs. red berries were crossed to create an F1of intermediate color, then the F1 plants were crossed to produce the range of colors.
The curve is called a normal distribution, with the largest number of individuals in the intermediate range, with fewer at each extreme.

Polygenic Inheritance
When individual plants from the F2 are selected and mated, the phenotype of the resulting offspring also produces a range of phenotypes and a similarly shaped curve:
There is a range of phenotypes, but most of the offspring are similar in color to the parents.
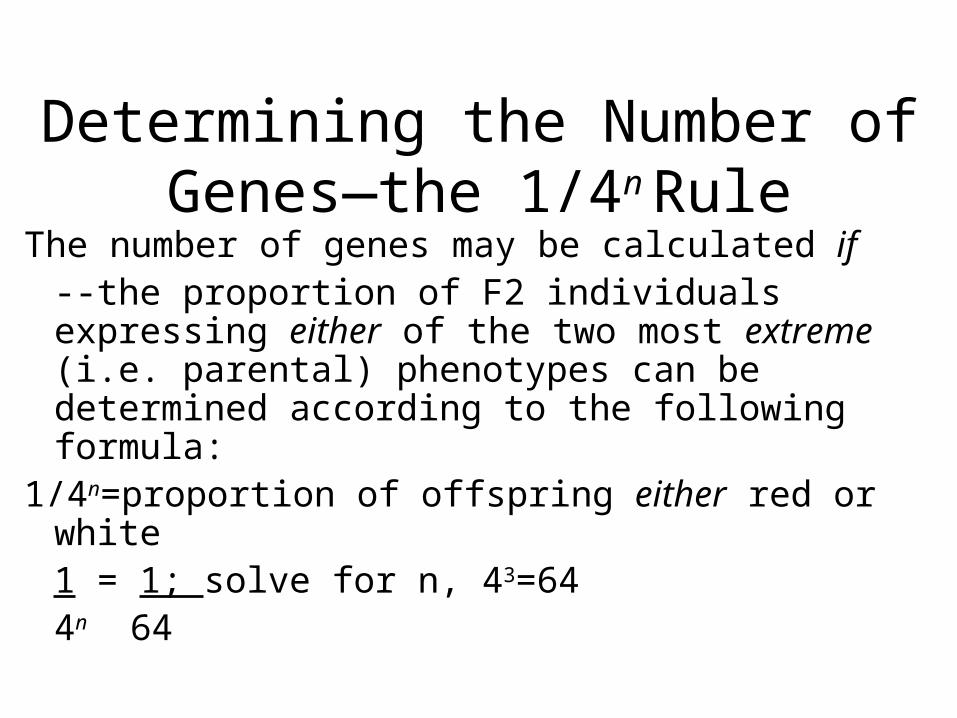
Determining the Number of Genes—the 1/4n Rule
The number of genes may be calculated if --the proportion of F2 individuals expressing either of the two most extreme (i.e. parental) phenotypes can be determined according to the following formula:
1/4n=proportion of offspring either red or white 1 = 1; solve for n, 43=644n 64
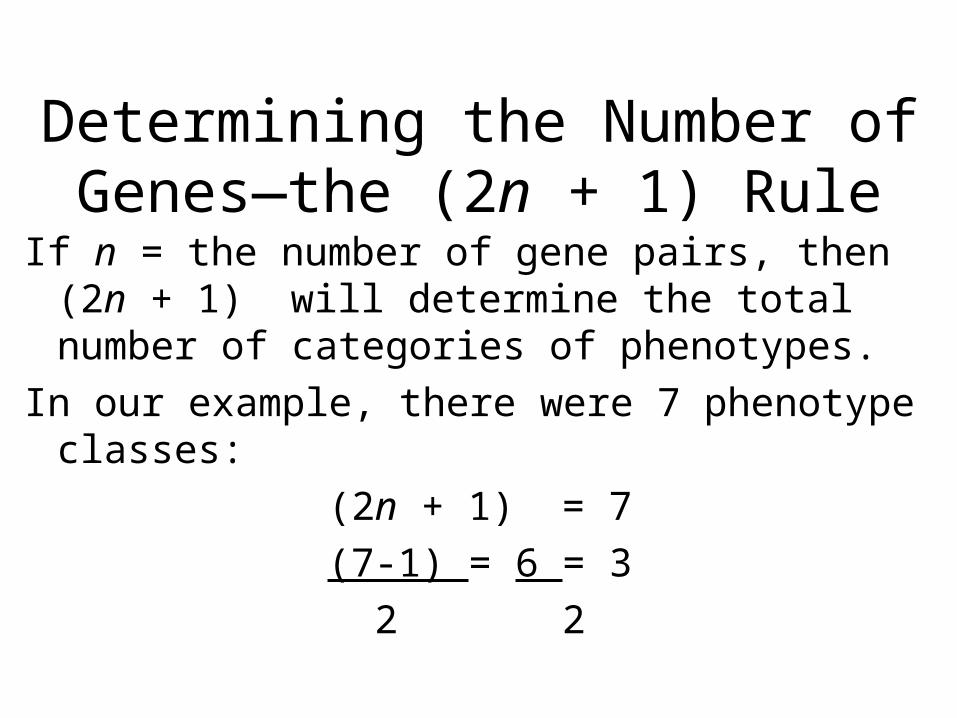
Determining the Number of Genes—the (2n + 1) Rule
If n = the number of gene pairs, then (2n + 1) will determine the total number of categories of phenotypes.
In our example, there were 7 phenotype classes:
(2n + 1) = 7
(7-1) = 6 = 3
2 2

Genotype Plus Environment
Note that genotype (fixed at fertilization) establishes the range in which a phenotype may fall, but environment influences how much genetic potential will be realized.
(So far, we have assumed no influence of environment on the cross examples used)

Significance of Polygenic Control
Most traits in animal breeding and agriculture are under polygenic control:
Height, weight, stature, muscle composition, milk and egg production, speed, etc.

BiometryBiometry Biometry is the quantitative study of biology and
utilizes statistical inference to analyze traits exhibiting continuous variation.
While the observations of an experiment are hoped to represent the population at large, there may be random influences affecting samples that adds to variation in the study population. Statistical analysis allows researchers to predict the sources of variation and the relative influence of each source.
Purposes of Statistical Analysis
1. Data can be analyzed mathematically and reduced to a summary description.
2. Data from a small but representative and random sample can be used to infer information about groups larger than the study population (statistical inference).
3. Two or more sets of experimental data can be compared to determine if they represent different populations of measurements.

Statistical TermsMean:Mean:The distribution of two sets
of phenotypic measurements cluster around a central value.
The mean is the arithmetic average of the set of measurements, the sum of all of the individuals divided by the number of individuals.

Mean
The mean is arithmetically calculated as
Mean = Mean = XXii//nnWhere Xi is the sum of all the individual values
and n is the number of individual values

Mean
Observed values for eight samples
{2,2,4,4,5,6,6,8}
Xi is 38
38/8 = 4.75
Therefore, the mean for this sample is 4.75

Median
If the data are arranged from smallest to largest value, the median value is the central number.
{2,2,4,4,5,6,6,7,8}
So the median value for this data set is 5.

Range
Range is the distance between the smallest value in a set and the largest value in a set.
{2,2,4,4,5,6,6,7,8}
The range for this set is 2 to 8.
Frequency Distribution
Median and range give information about the frequency distribution, or shape of the curve.
The values of two different data sets may have the same mean, but be distributed around that mean differently.

Variance
Variance is a value that describes the degree to which the values in a data set diverge from the mean.
The variance within the data set is used to make inferences or estimate the variation in the population as a whole.

Variance
Variance is a value that describes the degree to which the values in a data set diverge from the mean.
The variance within the data set is used to make inferences or estimate the variation in the population as a whole.

Calculate Variance (s2)
s2 = (Xi-mean)2 /n – 1

Standard Deviation
Because variance is a squared value (s2) its unit of measurement is also squared (inches, feet, kg, etc.)
To express variation in the original units, simply take
the square root of the variance, or standard standard deviationdeviation.
s = s2

Standard Error of the Mean
To estimate how much the means of other similar samples from the same population might vary, we
calculate the standard error of the meanstandard error of the mean.
The SE is a measure of variation of sample means in repetitions of an experiment, or more simply, a measure of accuracy of the sample mean.

Standard Error of the Mean (SE)
SE is the standard deviation, divided by the square root of the number of individuals.
SE = s/n
Because SE is divided by the square root of n, the value will always be smaller than the standard deviation.

Expression of Statistical Values
Typically, data are expressed as means +/- SE.
So, if you have two different experimental treatments which produce two different means, they would be expressed like this:
Group A= 16.676 +/- 3.3
Group B= 12.2 +/- 2.1

Expressions of Statistical Data
Statistical analysis is all about defining the sources of variation.
Ultimately, we want to be able to assign proportions of the variation to their different sources, to sort out that variation due to our treatment or design.

Heritability
Heritability is an estimate of how much variability in a population is due to genetic factors, separate from environmental factors.
In genetics, statistics are all about determining the relative impacts of heredity vs environment on phenotypic variation.
Heritability
Experiments test the source or origin of variation.
One way to assess genetic influence is to use inbred or genetically similar groups of animals or plants, and rear them under a range of environmental conditions.
Variation between different strains reared under similar conditions can be assigned to genetic differences.
Variation among members of the same strain reared under different conditions can be assigned to non-genetic influences, called “environmental” effects.

Heritability Index (H2)
H2 is an analysis of variance among individuals of a known genetic relationship.
H2 measures the degree to which phenotypic variance (VP) is due to genetic factors with the following limitations1. For a single population2. Under the limits of environmental variation during the study
Heritability Index
The heritability index does notdoes not determine the proportion of the total phenotype due to genetic factors.
The heritability index doesdoes estimate the proportion of observed variation in the phenotype due to genetic factors in comparison to environmental factors.

Heritability Index
Mathematically, phenotypic variance (VP) is the sum of environmental variance (VE) genetic variance (VG) and the interaction of genetics and environment (VGE). The last is usually negligible, so is left out of the calculation.
VP = VE + VG

Heritability Index
A heritability index close to 1.0 indicates that environmental conditions had little impact on phenotypic variation in the population observed.
A heritability index close to 0 indicates that environmental conditions were almost solely responsible for the phenotypic variation observed in the sample population.
(Most of the time, values close to either extreme are not observed because most of the time, both environment and genetics have effects.)

Heritability Index—Limitations
The heritability index is not absolute for any given character, but measured in different populations under different degrees of environmental variation.
Therefore, it’s most useful in inbred or genetically similar strains.
Also, it’s not particularly useful in determining the selection potential of quantitative traits, since it takes in all sources of genetic variation, not just specific additive genetic effects.