Embed Size (px)
Citation preview
Harbert, RS and Nixon, KC. 2018. Quantitative Late Quaternary Climate Reconstruction from Plant Macrofossil Communities in Western North America. Open Quaternary, 4: 8, pp. 1–13. DOI: https://doi.org/10.5334/oq.46
RESEARCH PAPER
Quantitative Late Quaternary Climate Reconstruction from Plant Macrofossil Communities in Western North AmericaRobert S. Harbert*,† and Kevin C. Nixon‡
The Late Quaternary packrat (Neotoma spp.) midden plant macrofossil record in western North America is an exceptional record of biotic change that provides strong evidence of past climate. In this study, we generate quantitative estimates of climate from plant community composition of more than 600 individual paleomiddens over the past 50,000 years. Here we present the first large-scale application of CRACLE ( Climate Reconstruction Analysis using Coexistence Likelihood Estimation), a quantitative climate inference method that uses plant community composition as a climate proxy under the individualistic concept of plant community assembly. The results are spatiotemporally specific estimates of temperature, precipitation, available moisture, and seasonal patterns that are consistent with well understood global climate patterns but provide previously unavailable detail and precision of the regional paleoclimate in western North America. Rapid warming is estimated at the Pleistocene-Holocene transition, at a conservative estimate of ca. 1°C per millennium. Previously projected future temperature increases suggest a rate of increase of more than 2°C over the next century, an astonishing 10× the rate experienced at any point during the past 50,000 years in Western North America. These analyses form a baseline demonstration of how the growing paleoecological record of packrat midden plant macrofossils can provide quantitative estimates of paleoclimate that aid in understanding the complexities of, and biotic responses to the regional climate system. This work is the first synthetic application of any paleoclimate estimation method to packrat midden plant macrofossils.
Keywords: Paleoclimate; Neotoma; Pleistocene; Holocene; packrat; climate niche modeling
IntroductionPast mass extinction and spatial shifts in biodiversity due to climate change can provide critical data to understand the potential future effects of climate change on global and regional ecosystems. Geologically rapid Quaternary glaciation cycles (Agassiz 1840) are potential analogs for potential biotic change during projected near-future cli-mate change (e.g., Willis and MacDonald 2011; Ordonez 2013). These past changes are believed to have been largely driven by predictable and periodic variation in the earth’s orbit relative to the sun (Milankovitch 1930; Berger 1978; Berger 1980) effecting changes in relative insolation (Imbrie et al. 1992). The global glacial record is well-pre-served and continuous over thousands of years in both the Arctic and Antarctic ice-sheets and preserves representa-tive atmospheric gasses that are indicators of past climate (Cuffey & Clow 1997; Alley 2000; Alley 2004). However, North American mid-latitude quantitative climate records
are either less continuous or over a short time scale (Viau, Ladd & Gajewski 2012) and primarily limited to ocean and lake sediment analyses including carbonate isotopes and marine diatom assemblages (e.g., Bereiter et al. 2014; Barron et al. 2003; MacDonald et al. 2008), groundwater stable isotope analyses (e.g., Marcott et al. 2013; Lachniet et al. 2014), and scattered biological proxies (e.g., Anderson et al. 2000; Briffa 2000; Cole & Arundel 2005; Wurster et al. 2008). Late Quaternary plant macrofossils from pack-rat paleomiddens in western North America as presented here, therefore, represent a significant, independent, and novel source of data for large-scale mid-latitude paleocli-mate inference for western North America.
North American Packrat Paleomiddens — North American packrat (Neotoma spp.) paleomiddens (fossilized nests) have been a rich source of data for Late Quaternary paleo-ecological estimates (Betancourt, Van Devender & Martin 1990). Packrats collect both vegetative and reproduc-tive plant material from the local environment to build nests and to establish caches of food. These collections, including leaf and stem fragments, fruits, seeds, and pol-len blown into the midden matrix (King & Van Devender 1977) typically form a representative sample (60–90% of
* American Museum of Natural History, NY, US† Stonehill College, 320 Washington St., Easton, MA, US‡ Cornell University, 412 Mann Library Building, Ithaca, NY, USCorresponding author: Robert S. Harbert ([email protected])
Harbert and Nixon: Quantitative Late Quaternary Climate Reconstruction from Plant Macrofossil Communities in Western North America
Art. 8, page 2 of 13
taxa) of the local plant diversity within 30–50 m of a mid-den (Dial & Czaplewski 1990; Finley 1990). Because of the excellent preservation of the materials in dry, protected cavities and under ledges, the fossils can typically be iden-tified morphologically as belonging to extant species from western North America. Paleomidden analysis has long been an important approach to documenting changes in vegetation, population migration and colonization, and morphological and physiological characterization of veg-etation of the Late Quaternary as far back as 50,000 years before present (e.g., Wells & Jorgensen 1965; Wells & Berger 1967; Van Devender 1987; Wells & Hunziker 1976; Spaulding & Van Devender 1977; Van Devender 1977; Betancourt & Van Devender 1981; Cole 1982; Cole 1985; Bentancourt et al. 1991; Jackson et al. 2002; Holmgren et al. 2006; Coats et al. 2008; Holmgren et al. 2014; Emslie et al. 2014). Rodent middens preserved in arid environ-ments are often chronologically partitioned, and indi-vidual sections can be dated with radioisotope methods to provide a sequential history of vegetation composition (Anderson & Van Devender 1991; Maldonado et al. 2005). The packrat paleomidden fossil record shows remarkably complete biogeographic histories that facilitate the study of past distributional shifts due to local extinction and dispersal processes (e.g., Emslie et al. 2015; Hunter et al. 2001), critical information for understanding how plants respond in natural environments to periods of rapid cli-mate change.
Paleoclimate estimation from Vegetation: Climate Reconstruction Analysis using Coexistence Likelihood Estimation (CRACLE) — The principle that plant species distributions are intimately correlated with climate across broad spatial and temporal scales is universally accepted (e.g., Jackson & Blois 2015). This principle is the basis for a class of climate estimation techniques that use climatic niche overlap between coexisting species to estimate site-specific climate parameters. For example: the Coexistence Approach (Mosbrugger & Utescher 1997) and Mutual Climatic Range (Sinka & Atkinson 1999; Sharpe 2002; Thompson et al. 2012) techniques. In this study, climate parameters are estimated using a maximum likelihood statistical framework for the estimation of climate from vegetation via CRACLE, Climate Reconstruction Analysis using Coexistence Likelihood Estimation (Harbert & Nixon 2015). CRACLE is a relatively new, but a robust method that leverages large online databases of primary biodi-versity data such as the Global Biodiversity Information Facility — GBIF (www.gbif.org) — and has been shown to provide more accurate estimates of climate than related methods (Harbert & Nixon 2015). Previously, Mutual Climatic Range methods have been applied to the study of Late Quaternary climate for only a few packrat paleom-idden samples (Sharpe 2002; Thompson et al. 2012), but a comprehensive regional study has not been completed. This study is the first to apply a taxonomic coexistence cli-mate estimation method to the entire body of data avail-able for Late Quaternary packrat paleomiddens in western North America. It is also the first large-scale application of the CRACLE implementation to paleoclimate modeling (Fletcher et al. 2017).
Methods CRACLE—Estimation of climate was computed based on taxon coexistence and modern distributions via the Climate Reconstruction Analysis Using Coexistence Likelihood Estimation (CRACLE) protocol (Harbert & Nixon 2015). For each taxon in a community, CRACLE calculates a prob-ability function representing the conditional probability of a climate parameter given the presence of that taxon. The joint likelihood function for all co-occurring species is calculated as the sum-log-likelihoods of these individual taxon functions. The maximum of the joint likelihood curve is taken to be the most probable climate value given the association of species and the individual associations with climate. Analyses in this study were done using the ‘vegdistmod’ R package for CRACLE and related methods (https://github.com/rsh249/vegdistmod) which includes code for CRACLE that is in the process of migrating to the new ‘cRacle’ R package (https://github.com/rsh249/cRa-cle). The methods used here differ from those originally published (Harbert & Nixon 2015) in two ways. First, a weighted Kernel Density Estimation is used to approxi-mate the conditional probability based on a background data sample. Second, standard bandwidths are calculated using Silverman’s Rule (Silverman 1986).
CRACLE estimates fossil taxon climate tolerance from modern primary biodiversity distribution data using a Smallest Inclusive Group (SIG) approach to identify proxy distributions for extinct or un-identifiable fossil taxa. Here, a SIG is the smallest taxonomic group or clade that a fos-sil can be reasonably placed in using morphological char-acteristics. The taxonomic classifications from the USGS North American Packrat Midden Database (https://geo-change.er.usgs.gov/midden/) are used as SIGs when the classification is at the genus or species level. One assump-tion of this approach is that fossils only identified to fam-ily level will lack narrow climate signals due to the use of overly broad geographic distributions and likely could be placed into smaller groups. It is expected that taxa in the packrat midden samples represent modern taxa as extinc-tions during this time are rare, but rearrangements of spe-cies into novel communities was common (Emslie et al. 2015; Gill et al. 2009). When generic classifications are used in the CRACLE framework (Harbert & Nixon 2015) the distribution for the entire genus is substituted as a surrogate for the unknown, but extant, species distribu-tion under the assumption of physiological canalization related to climate niche (Huntley et al. 1989; Ackerly 2003; Wake et al. 2009). Using modern species/genus distribution data for fossils that fit within these groups avoids issues of niche shifts and extinction associated with applying this approach to older fossil assemblages that may lack taxa identifiable as equivalent to modern species (Grimm & Potts 2016).
USGS-NOAA Packrat Midden Database—The work of countless researchers since the discovery of Pleistocene age Neotoma middens (Wells & Jorgensen 1964) to locate, catalog, and identify fossil plant remains in the middens of Neotoma spp. packrats is now largely
Harbert and Nixon: Quantitative Late Quaternary Climate Reconstruction from Plant Macrofossil Communities in Western North America
Art. 8, page 3 of 13
curated by the United States Geological Survey in the form of the USGS-NOAA North American Packrat Midden Database (available online: http://geochange.er.usgs.gov/midden/search.html). The USGS North American Packrat Midden Database (https://geochange.er.usgs.gov/mid-den/) includes more than 3,000 midden samples, with species identifications, georeferenced localities, and radi-ocarbon estimated ages of plant material. Because of the historical nature of the dataset, some records lack some information. Sites may have a single age, or more often multiple identified layers from different depositional times that are sampled separately. For our study, the data set was filtered to remove samples without geo-coordinates, with poor coordinate precision, and those with fewer than ten taxa identified to genus or species. The culled data set pre-sented here includes 646 samples (Supplementary mate-rial Appendix 2) distributed from the deserts of northern Mexico to the northern Great Basin, eastern California, southern Oregon and Idaho (Supplementary Figure S3). The rarity of the most ancient middens and radiocarbon dating uncertainties restrict usable samples for our study to the last 50,000 years with greater representation of the last 10,000 years (Supplementary Figure S2). On average, there were about 15–20 taxa identified per sample (Sup-plementary Figure S2), a level of diversity that has been shown to be sufficient for accurate and precise CRACLE models (Harbert & Nixon 2015).
Midden Age Chronology and Paleoclimate Timeline—Radiocarbon dates for the packrat middens were calibrated using the Northern Hemisphere IntCal13 calibration curve for terrestrial samples (Reimer et al. 2009), and the calibration tools available in the “Bchron” software library (Haslett & Parnell 2008) in R (R Core Team 2016). Age calibration model means and standard deviations were converted to 95% confidence intervals for each site to rep-resent temporal uncertainty in climatic reconstruction. Reconstructions average across all overlapping midden date ranges at each time bin.
Modern climate model and parameters—Climate data are extracted from the downscaled 2.5-arc-minute resolution (~0.041667 degrees) WorldClim ( Version 1.4) model grid (Hijmans et al. 2005). World-Clim is a high-resolution continuous grid of interpolated climate data for the world’s land areas derived from a global set of >40,000 weather stations.
An advantage of the CRACLE method for inferring pale-oclimate is that the general protocol is flexible and can be applied to a wide variety of climatic parameters. For this study quantitative reconstructions of mean annual temperature (MAT), maximum temperature, minimum temperature, mean precipitation, mean water balance (potential evapotranspiration + mean precipitation), and winter length (number of months with a mean tempera-ture < 5°C) are focused on as these give a broad view of climate change and seasonal variability (Supplementary material Appendix 1).
To better capture nuances of climate-related to drought, the potential evapotranspiration (PET) and water balance
(precipitation – PET) were calculated using monthly val-ues for temperature and precipitation from the WorldClim model data (Hijmans et al. 2005) and in R (using code from https://github.com/rsh249/raster_PET.git). The Thornthwaite Equation (Thornthwaite 1948; Black 2007) is a suitable model of potential evapotranspiration that relies on data available at the scale of WorldClim includ-ing 1) monthly average temperatures in degrees Celcius, 2) mean monthly day-length in hours (calculated from the latitude), and 3) the number of days in each month.
Primary Biodiversity DataPoint-locality distribution data were downloaded from the Global Biodiversity Information Facility API service (http://api.gbif.org/v1/). For each taxon (genus or spe-cies) queried, localities were removed if any of the follow-ing criteria were met: 1) Decimal longitude or latitude was reported as an integer or to only a single decimal place, implying poor precision. 2) The basis of record was listed as “FOSSIL_SPECIMEN”, 3) The locality description had any word matching in-whole or with up to two mismatches “botanic”, “garden”, or “cultivated” to remove observations from cultivated settings. All data were thinned by species to a 20 arcminute grid (the 2.5 arcminute WorldClim grid aggregated by a factor of eight) to reduce the effect of spa-tially biased collection patterns. Taxa with fewer than five records after filtering were excluded as incomplete data. The final occurrence dataset consisted of 368,702 unique records for the 341 genera and 533 species observed in the 646 studied midden samples.
Regional CRACLE Validation TestingTo test whether CRACLE is adequate for capturing climate information at a regional scale comparable to the total climate space for the Late Quaternary of western North America the model was applied to vegetation surveys from the United States, Canada, and Mexico mobilized by the Botanical Information and Ecology Network (BIEN, http://bien.nceas.ucsb.edu/bien/) via the R library ‘rbien’ (Maitner et al. 2018). For each survey, primary biodiversity data from GBIF was downloaded as described above and all the same filtering and analytical steps were applied as with the USGS Packrat Midden Database. In the final distribution data, there were 5,563 species and 915,414 records. One additional filter was applied for the modern sites which was to remove surveys with reported elevation greater than 200 meters above or below the estimated ele-vation used in the WorldClim model (Hijmans et al. 2005; http://srtm.csi.cgiar.org/). Elevation filtering will reduce calculated anomalies by removing surveys that are either poorly georeferenced or were collected on a very strong elevation gradient that is not captured well in the World-Clim climate interpolation. All code and data to reproduce this validation test are publicly available (https://github.com/rsh249/cracle_examples/tree/master/BIEN).
Results and DiscussionCRACLE Modern Validation Experiment — To validate CRA-CLE as a sensitive and robust method for estimating cli-mate across the Late Quaternary of western North America
Harbert and Nixon: Quantitative Late Quaternary Climate Reconstruction from Plant Macrofossil Communities in Western North America
Art. 8, page 4 of 13
a modern set of more than 3,493 vegetation plot surveys covering North America west of 100°W and between 25°N and 50°N (mobilized via the Botanical Information and Ecology Network — BIEN — http://bien.nceas.ucsb.edu/bien/) database were analyzed using the same CRACLE methodology as for the packrat midden fossil communi-ties.
These modern sites cover between –3°C to 23°C degrees of mean annual temperature and 100–1,100 mm of annual rainfall, a latitudinal gradient of ~20 degrees, and altitudes between 170 and 4000 meters. This dataset should well represent the scope of climate space for the Late Quaternary of this part of western North America.
Temperature variables (e.g., Mean Annual Temperature — MAT) were estimated with high correlation (ρ = 0.93) and low error rates (median absolute anomaly = 1.3°C — Figure S1; Supplementary Table S1) relative to the WorldClim estimates for those sites. Estimation of precipi-tation parameters (mean annual precipitation and annual water balance) exhibited greater variation in results, but with median anomalies of 79 mm for mean annual pre-cipitation and 96 mm for annual water balance (Table S1). Seasonal estimation, represented in this study by winter length (the number of months with mean temperatures below 5°C), performs well with a median anomaly of only 0.05 months, or about 1.5 days. The performance in this regional dataset is comparable to the global set of test sites originally published for CRACLE (Harbert & Nixon 2015) but from a dataset almost 25 times larger. These results show that CRACLE is a robust tool in for this regional flora and the climate space relevant to the packrat midden mac-rofossil record of the Late Quaternary.
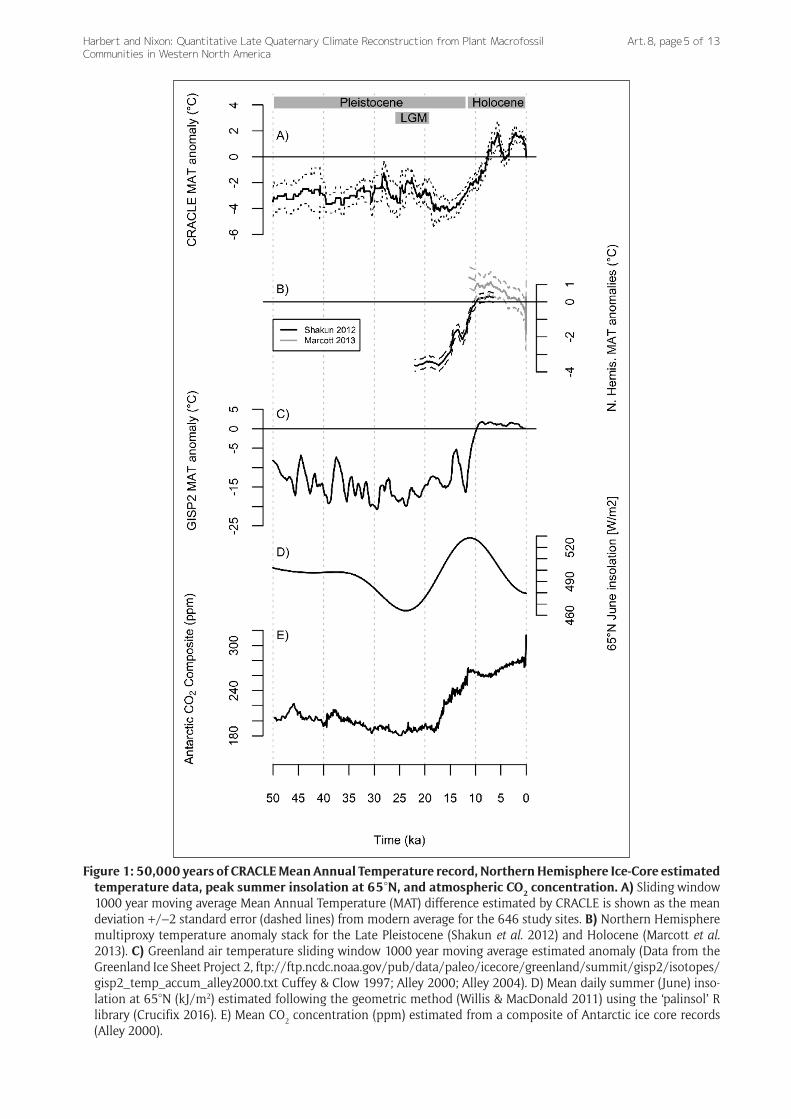
Paleoclimate Overview — The climate record inferred by CRACLE analysis of the 646 dated western North American packrat paleomidden samples is consistent with patterns of northern hemisphere temperature changes over the last ~50,000 years (Figure 1A, B) based on other meth-ods and proxy data (Cuffey & Clow 1997; Alley 2000; Alley 2004; Shakun et al. 2012; Marcott et al. 2013). Coldest temperatures with anomalies of –2 to –4°C were esti-mated between 22 ka and 15 ka, during and just after the last glacial maximum (LGM – 26–19 ka; Clark et al. 2009) in Western North America (Figure 1A).
The late Pleistocene temperature minima were followed by a general warming trend that continued until after the onset of the Holocene likely driven by the collapse of the continental ice-sheets and peak northern latitude summer insolation (Figure 1D). Peak positive anoma-lies of +1.5°C above modern values consistent with the Holocene Thermal Optimum (Renssen et al. 2012) at 7–8 ka (Figure 1A).
Atmospheric CO2 recorded in the Antarctic ice cores (Figure 1E) (Bereiter et al. 2015) increases ahead of mean annual temperature increases in the CRACLE inferred record (Figure 1A) supporting previous observations of global climate change at the end of the Pleistocene (Shakun et al. 2012). Although showing dramatic extremes (~6°C total increase in temperature), the magnitude of CRACLE-packrat estimated mean temperature shifts at these lati-tudes is much less than is observed in the reliable ice-core
proxies of Greenland (Figure 1A, C) (Cuffey & Clow 1997; Alley 2000; Alley 2004). A pattern that is consistent with a scientific consensus that global temperature change and ecosystem response is typically greater in polar regions during past warming events (Renssen et al. 2012; Kiessling et al. 2012).
The rate of Climate Change —The maximum rate of mean annual temperature change estimated in this study (~6°C/6 to 8 thousand years = 0.075–0.1°C/100 years; Figure 1) is a slower rate than current projections of near-future warming scenarios for western North America. The projected rate of warming across the western United States through the year 2100 is projected to be between 1 and 4°C in all IPCC Representative Concentration Pathways (Pachauri et al. 2014 – see page 61), including the strin-gent mitigation scenario —RCP 2.6— that is, at this point, very unlikely to be attained (Pachauri et al. 2014). In the Southwestern United States, recent historical records sug-gest increasing temperatures are now occurring at a rate of ~3–4°C/100 years, a rate consistent with or exceed-ing model projections for the next century (Cole 2016). Based on these conservative estimates contrasted against CRACLE paleomidden estimates, projected warming in the next century is likely to occur at a rate 10–20× greater than any millennial average in the past 50,000 years (Cole 2016). This disconnect highlights the need for studies that infer potential future biotic change (e.g., Mathys et al. 2017) and migration rates (Roberts & Hamman 2016) to consider the unparalleled effects of very rapid periods of climatic change rather than just the total magnitude of projected change (Cole 2010).
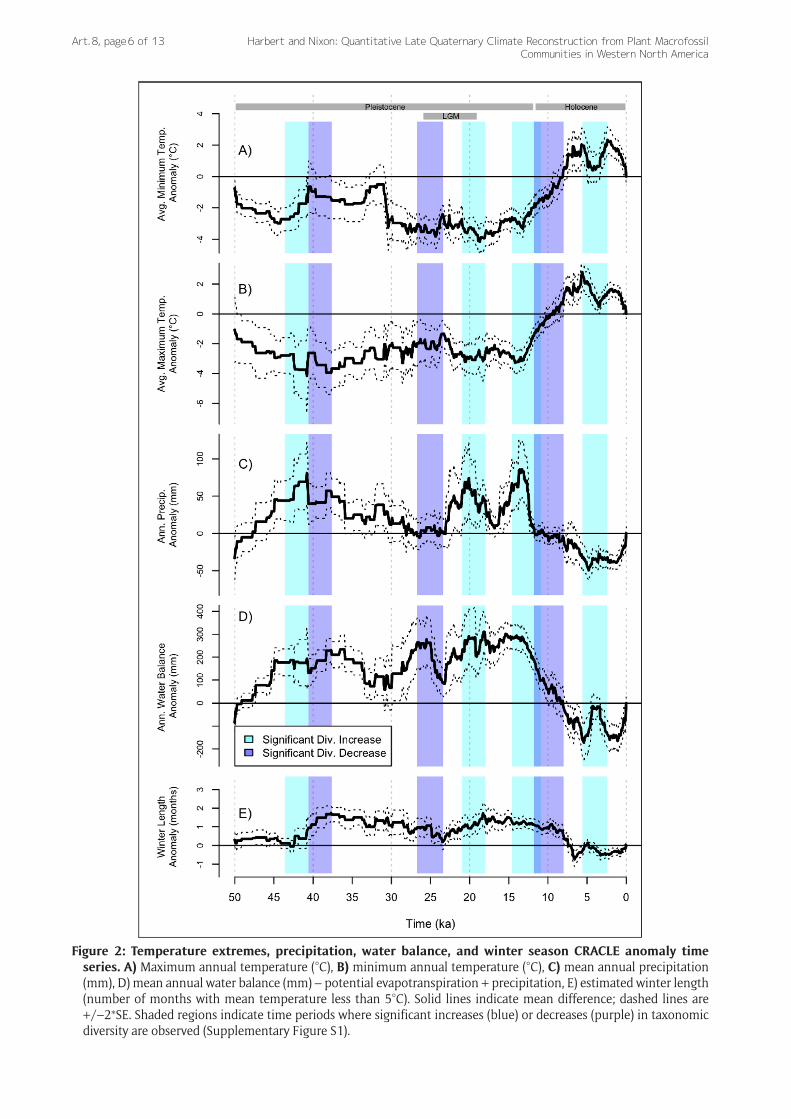
Pleistocene Pluvial Lakes — One of the most striking geologic features of the late Pleistocene is the occurrence of large lake systems in the Great Basin during the Last Glacial Maximum (Reheis 1999; Lyle et al. 2012; Munroe & Laabs 2013; Reheis et al. 2014). Estimates of mean annual precipitation (MAP) and water balance (MAP – potential evaporation) for the LGM are consistent with a wet-glacial hypothesis (Oster et al. 2015), with additional rainfall of 50–100 mm/year over modern values (Figure 2C). Driven by cooler temperatures and reduced evaporation, relative water balance (i.e., subtracting estimated evaporation) was greater than modern values by +200 mm/year to +400 mm/year from 22 ka to at least 15 ka (Figure 2D). During the Bolling-Allerod interstadial (a pronounced Northern Hemisphere warming episode from 14.7 ka to 12.7 ka), the wetter regime across the region started to collapse. At this time, CRACLE paleomidden analyses show rapidly dimin-ishing rainfall from 15 ka towards the modern regime by
~12 ka. This decrease in rainfall is followed closely, though with less abrupt changes, by water balance decreases as temperatures increased towards the HTO (Figure 2A, 2B). Interestingly, CRACLE-estimated winter length remained longer than the modern by about one month until around 9 ka (Figure 2E), despite rising annual (Figure 1A) and seasonal extreme temperatures (Figure 2A, 2B).
The rise of the Pleistocene pluvial lakes in the Great Basin has been attributed to an influx of moisture due to increased rainfall and/or limited evaporation by the full glacial cold and reduced summer insolation (MacDonald
Harbert and Nixon: Quantitative Late Quaternary Climate Reconstruction from Plant Macrofossil Communities in Western North America
Art. 8, page 5 of 13
Figure 1: 50,000 years of CRACLE Mean Annual Temperature record, Northern Hemisphere Ice-Core estimated temperature data, peak summer insolation at 65°N, and atmospheric CO2 concentration. A) Sliding window 1000 year moving average Mean Annual Temperature (MAT) difference estimated by CRACLE is shown as the mean deviation +/–2 standard error (dashed lines) from modern average for the 646 study sites. B) Northern Hemisphere multiproxy temperature anomaly stack for the Late Pleistocene (Shakun et al. 2012) and Holocene (Marcott et al. 2013). C) Greenland air temperature sliding window 1000 year moving average estimated anomaly (Data from the Greenland Ice Sheet Project 2, ftp://ftp.ncdc.noaa.gov/pub/data/paleo/icecore/greenland/summit/gisp2/ isotopes/gisp2_temp_accum_alley2000.txt Cuffey & Clow 1997; Alley 2000; Alley 2004). D) Mean daily summer (June) inso-lation at 65°N (kJ/m2) estimated following the geometric method (Willis & MacDonald 2011) using the ‘palinsol’ R library (Crucifix 2016). E) Mean CO2 concentration (ppm) estimated from a composite of Antarctic ice core records (Alley 2000).
Harbert and Nixon: Quantitative Late Quaternary Climate Reconstruction from Plant Macrofossil Communities in Western North America
Art. 8, page 6 of 13
Figure 2: Temperature extremes, precipitation, water balance, and winter season CRACLE anomaly time series. A) Maximum annual temperature (°C), B) minimum annual temperature (°C), C) mean annual precipitation (mm), D) mean annual water balance (mm) – potential evapotranspiration + precipitation, E) estimated winter length (number of months with mean temperature less than 5°C). Solid lines indicate mean difference; dashed lines are +/–2*SE. Shaded regions indicate time periods where significant increases (blue) or decreases (purple) in taxonomic diversity are observed (Supplementary Figure S1).
Harbert and Nixon: Quantitative Late Quaternary Climate Reconstruction from Plant Macrofossil Communities in Western North America
Art. 8, page 7 of 13
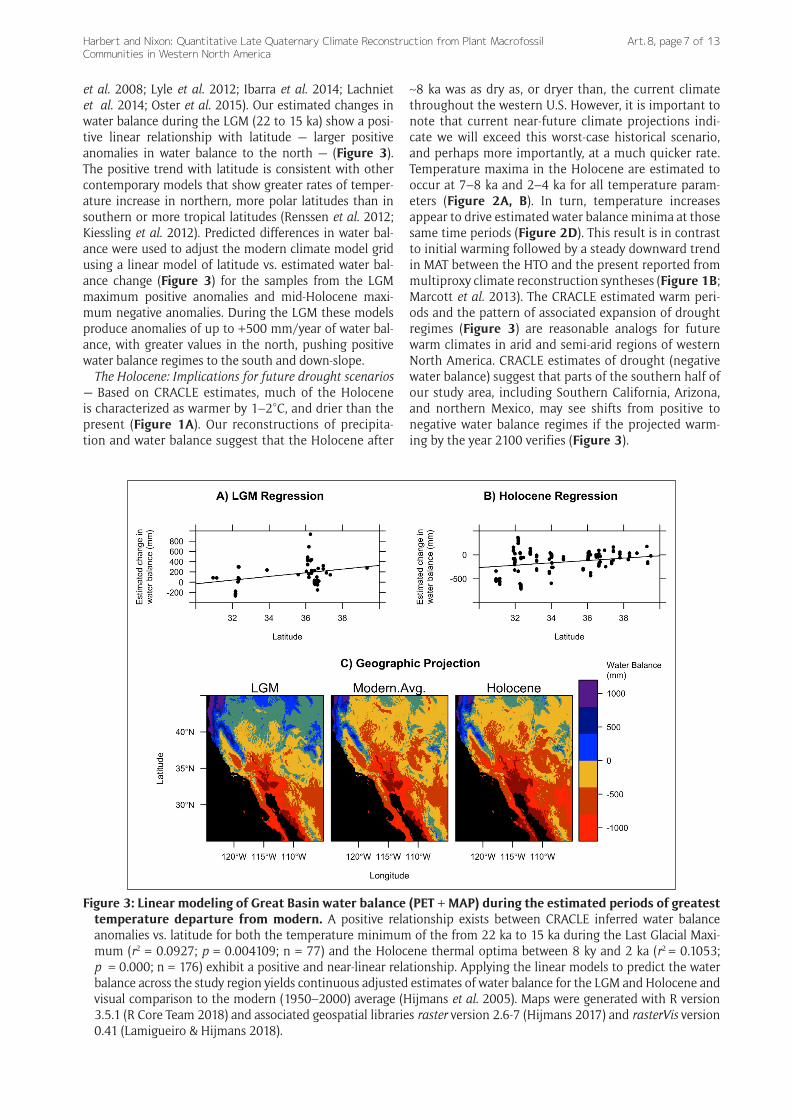
et al. 2008; Lyle et al. 2012; Ibarra et al. 2014; Lachniet et al. 2014; Oster et al. 2015). Our estimated changes in water balance during the LGM (22 to 15 ka) show a posi-tive linear relationship with latitude — larger positive anomalies in water balance to the north — (Figure 3). The positive trend with latitude is consistent with other contemporary models that show greater rates of temper-ature increase in northern, more polar latitudes than in southern or more tropical latitudes (Renssen et al. 2012; Kiessling et al. 2012). Predicted differences in water bal-ance were used to adjust the modern climate model grid using a linear model of latitude vs. estimated water bal-ance change (Figure 3) for the samples from the LGM maximum positive anomalies and mid-Holocene maxi-mum negative anomalies. During the LGM these models produce anomalies of up to +500 mm/year of water bal-ance, with greater values in the north, pushing positive water balance regimes to the south and down-slope.
The Holocene: Implications for future drought scenarios — Based on CRACLE estimates, much of the Holocene is characterized as warmer by 1–2°C, and drier than the present (Figure 1A). Our reconstructions of precipita-tion and water balance suggest that the Holocene after
~8 ka was as dry as, or dryer than, the current climate throughout the western U.S. However, it is important to note that current near-future climate projections indi-cate we will exceed this worst-case historical scenario, and perhaps more importantly, at a much quicker rate. Temperature maxima in the Holocene are estimated to occur at 7–8 ka and 2–4 ka for all temperature param-eters (Figure 2A, B). In turn, temperature increases appear to drive estimated water balance minima at those same time periods (Figure 2D). This result is in contrast to initial warming followed by a steady downward trend in MAT between the HTO and the present reported from multiproxy climate reconstruction syntheses (Figure 1B; Marcott et al. 2013). The CRACLE estimated warm peri-ods and the pattern of associated expansion of drought regimes (Figure 3) are reasonable analogs for future warm climates in arid and semi-arid regions of western North America. CRACLE estimates of drought (negative water balance) suggest that parts of the southern half of our study area, including Southern California, Arizona, and northern Mexico, may see shifts from positive to negative water balance regimes if the projected warm-ing by the year 2100 verifies (Figure 3).
Figure 3: Linear modeling of Great Basin water balance (PET + MAP) during the estimated periods of greatest temperature departure from modern. A positive relationship exists between CRACLE inferred water balance anomalies vs. latitude for both the temperature minimum of the from 22 ka to 15 ka during the Last Glacial Maxi-mum (r2 = 0.0927; p = 0.004109; n = 77) and the Holocene thermal optima between 8 ky and 2 ka (r2 = 0.1053; p = 0.000; n = 176) exhibit a positive and near-linear relationship. Applying the linear models to predict the water balance across the study region yields continuous adjusted estimates of water balance for the LGM and Holocene and visual comparison to the modern (1950–2000) average (Hijmans et al. 2005). Maps were generated with R version 3.5.1 (R Core Team 2018) and associated geospatial libraries raster version 2.6-7 (Hijmans 2017) and rasterVis version 0.41 (Lamigueiro & Hijmans 2018).
Harbert and Nixon: Quantitative Late Quaternary Climate Reconstruction from Plant Macrofossil Communities in Western North America
Art. 8, page 8 of 13
Estimation of Holocene water balance also reveals that these warm and dry climate periods had less impact to the north of the study area. In particular, the northern Sierra Nevada range and coastal regions of northern California, Oregon, and Washington show little change in the overall wet climate through the Holocene (Figure 3). This mois-ture regime relative stability may imply that these regions are historical, and potential future refugia. It is interesting that these regions (such as the Siskiyou Range) are consid-ered refugia for many plants that were more widespread in the past (Steele & Storfer 2006; Ackerly et al. 2010; Olson et al. 2012).
Holocene Temperature Variability — All estimates of tem-perature presented here (mean annual, minimum, and maximum) show marked variability during the Holocene (Figures 1A, 2A, B) including a local temperature mini-mum around 4–5 ka. The dominant global temperature trend of the Holocene has been temperature stability except for the last 2000 years where anomalous cool-ing has been inferred (Marcott et al. 2013; Marsicek et al. 2018). However, climate variability at local and regional scales can get lost in such broad syntheses. CRACLE analy-sis reconstructs an overall warm Holocene with a cooling trend over the last 2,000 years of the Holocene consistent with these global trends (Marcott et al. 2013).
The CRACLE temperature estimates show first a ~2°C cooling trend between 5–7 ka followed by an equal warm-ing trend between 3–5 ka (Figures 1A, 2A, B). Model data suggest a 2–4°C maximum temperature anomaly during the early Holocene (Renssen et al. 2012) in this region, an inference corroborated by the early warm period in the CRACLE estimates (Figure 1A). Sea surface temperature (SST) along the Northern California coast may have been cooler than present during the mid-Holocene (Barron et al. 2003). Diatom records from the northern Gulf of Mexico suggest an amplified North American Monsoon (NAM) resulting in a wet summer pattern during the mid-Holocene as well (Poore et al. 2005). Cooler SST (Barron et al. 2003) and increased summer rainfall (Poore et al. 2005) may help explain the temperature minimum at 5 ka in our results as a regional climatic response.
Millennial Climate Variation and Plant Biodiversity Dynamics — Our CRACLE estimates for the end of the Pleistocene show that mean annual temperature increased from the LGM minimum prior to decreases in precipitation near the Pleistocene-Holocene transition (Figure 1). Surprisingly, this period also displays a signifi-cant millennial-scale increase in average within-midden plant diversity —temporal α-diversity— (data and statis-tical test described in Supplementary Figure S2). Plant diversity in the arid regions of the Southwest is lowest in dense, high elevation forest, low elevation grasslands, and desert scrub, but highest in open, dry woodlands due to a mixing of both woodland and grassland/desert elements in this zone (Whittaker & Neiring 1975). At the end of the Pleistocene, a warming trend with moderate rainfall that persisted across large portions of this region could have driven an expansion of a semiarid climate with open woodland vegetation types. Thus, increases in open wood-land vegetation with relatively higher species diversity
is one potential mechanism for the observed increase in within-midden diversity in this period (Supplementary Figure S2).
ConclusionsThe Late Quaternary plant macrofossil record preserved in packrat paleomiddens provides exceptionally strong evidence to estimate a detailed and well-supported timeline of climatic change across western North Amer-ica. This study is the first application of the CRACLE approach to Quaternary paleoclimate estimation and the first large-scale quantitative reconstruction of climate in this region using plant macrofossils and demonstrates the potential application of CRACLE to other paleoeco-logical records and databases (e.g., the Neotoma Paleoe-cology Database — Williams et al. 2018). The 50,000-year climate profile estimated using CRACLE includes many well-understood features of global climate history found with other methods and in other regions, validating the overall approach and its application in this region. Perhaps more importantly, this reconstruction quanti-fies changes in numerous climate variables not typically accessible through other proxy methods (e.g., water bal-ance and winter length). The climate profile also sheds light on key events of the geologic and fossil record including the development of large pluvial lakes in the Great Basin during the terminal Pleistocene glacial cycle (>17 ka) during which we reconstruct increases in overall precipitation and reduced evaporation. The rapid tem-perature increase, a decrease in precipitation, reduced water balance and implied greater drought marking the Pleistocene-Holocene transition (12 ka–9 ka) is evidence of a period of rapid climate change that elsewhere has been implicated in coordinated extinctions of Pleisto-cene megafauna in North America (Guthrie 2006; Zazula et al. 2014). However, future projected anthropogenic cli-mate change might occur at a rate of ca. 1–4°C per cen-tury (Pachauri et al. 2014; Cole 2016), at least one order of magnitude greater than the millennial rate of about 0.1°C per century estimated here for the Pleistocene-Hol-ocene transition. The rate estimated in this study for the Pleistocene-Holocene transition is less than the ca. 0.5°C per century for polar regions for the same period inferred from the GISP2 cores (Cuffey & Clow 1997; Alley 2000; Alley 2004). This rate disparity highlights the utility of the continuous mid-latitude climate reconstructions made by CRACLE using the packrat midden macrofossil system (or other similar biological data sources) for aid-ing the quantification of the latitudinal climate change differential. Climate shifts in the past have resulted mostly in rearrangements of the standing biodiversity of the regional flora of western North America rather than extinction. The generally modest rates of climatic change may have allowed for processes of migration and disper-sal to track environmental shifts over long periods. Given the rapid changes projected for the next century, there appears to be no broad analog in the Late Quaternary of western North America for the for the projected >1°C per century temperature increase that the world faces in the next century.
Harbert and Nixon: Quantitative Late Quaternary Climate Reconstruction from Plant Macrofossil Communities in Western North America
Art. 8, page 9 of 13
Additional FilesThe additional files for this article can be found as follows:
• Figure S1. Modern validation CRACLE Anomalies. DOI: https://doi.org/10.5334/oq.46.s1
• Figure S2. Midden count and mean taxon diversity timeline. DOI: https://doi.org/10.5334/oq.46.s1
• Figure S3. Geographic distribution of 474 packrat midden fossil localities used for CRACLE paleocli-mate proxy. DOI: https://doi.org/10.5334/oq.46.s1
• Table S1. Modern CRACLE performance statistics. DOI: https://doi.org/10.5334/oq.46.s1
• Appendix 1. Results file for MAT, MinT, MaxT, MAP, wbalann, winter length by site. DOI: https://doi.org/10.5334/oq.46.s2
• Appendix 2. Sites used (Localities + links to USGS database). DOI: https://doi.org/10.5334/oq.46.s3
AcknowledgementsThe authors would like to thank many colleagues for generous feedback on this manuscript through many drafts, especially Dr. Maria Alejandra Gandolfo-Nixon, Dr. William Crepet, Camilla Martinez, Thereis Choo, and Daniella Allevato. Funding support for this study was provided, in part, by the generous support of the Gerstner Family Foundation and the American Museum of Natural History.
Funding InformationA portion of the support for the time RSH spent work-ing on this study was generously provided by the Gerstner Family Foundation through the American Museum of Natural History.
Competing InterestsThe authors have no competing interests to declare.
Author ContributionsRSH and KCN contributed equally to this manuscript and the conception and design of this study. CRACLE Software was written and implemented by RSH. RSH conducted analyses and synthesis.
ReferencesAckerly, DD. 2003. Community assembly, niche
conservatism, and adaptive evolution in changing environments. International Journal of Plant Sciences, 164(S3): S165–S184. DOI: https://doi.org/10.1086/368401
Ackerly, DD, Loarie, SR, Cornwell, WK, Weiss, SB, Hamilton, H, Branciforte, R and Kraft, NJB. 2010. The geography of climate change: Implica-tions for conservation biogeography. Diversity and Distributions, 16(3): 476–487. DOI: https://doi.org/10.1111/j.1472-4642.2010.00654.x
Agassiz, L and Bettannier, J. 1840. Etudes sur les glaciers. Jent et Gassmann. DOI: https://doi.org/10.5962/bhl.title.151173
Alley, RB. 2000. The Younger Dryas cold interval as viewed from central Greenland. Quaternary Science Reviews,
19(1–5): 213–226. DOI: https://doi.org/10.1016/S0277-3791(99)00062-1
Alley, RB. 2004. GISP2 Ice Core Temperature and Accumulation Data, IGBP PAGES/World Data Center for Paleoclimatology Data Contribution Series# 2004-013. NOAA/NGDC Paleoclimatology Program, Boulder CO, USA, 20.
Anderson, RS, Betancourt, JL, Mead, JI, Hevly, RH and Adam, DP. 2000. Middle and late-Wis-consin paleobotanic and paleoclimatic records from the southern Colorado Plateau, USA. Palaeogeography, Palaeoclimatology, Palaeoecology, 155(1–2): 31–57. DOI: https://doi.org/10.1016/S0031-0182(99)00093-0
Anderson, RS and Van Devender, TR. 1991. Comparison of pollen and macrofossils in packrat (Neotama) middens: A chronological sequence from the Water-man Mountains of southern Arizona, USA. Review of Palaeobotany and Palynology, 68(1–2): 1–28. DOI: https://doi.org/10.1016/0034-6667(91)90054-7
Barron, JA, Heusser, L, Herbert, T and Lyle, M. 2003. High-resolution climatic evolution of coastal northern California during the past 16,000 years. Paleoceanography, 18(1). DOI: https://doi.org/10.1029/2002PA000768
Bentancourt, JL, Schuster, WS, Mitton, JB and Anderson, RS. 1991. Fossil and genetic history of a pinyon pine (Pinus edulis) isolate. Ecology, 72(5): 1685–1697. DOI: https://doi.org/10.2307/1940968
Bereiter, B, Eggleston, S, Schmitt, J, Nehrbass-Ahles, C, Stocker, TF, Fischer, H, Kipfstuhl, S and Chappellaz, J. 2015. Revision of the EPICA Dome C CO2 record from 800 to 600 kyr before present. Geophysical Research Letters, 42(2): 542–549. DOI: https://doi.org/10.1002/2014GL061957
Berger, A. 1978. Long-term variations of daily inso-lation and Quaternary climatic changes. Journal of the Atmospheric Sciences, 35(12): 2362–2367. DOI: https://doi.org/10.1175/1520-0 4 6 9 ( 1 9 7 8 ) 0 3 5 < 2 3 6 2 : L T V O D I > 2 . 0.CO;2
Berger, A. 1980. The Milankovitch Astronomical Theory of Paleoclimates: A Modern Review. Vistas in Astronomy, 24: 103–122. DOI: https://doi.org/10.1016/0083-6656(80)90026-4
Betancourt, JL and Van Devender, TR. 1981. Holocene vegetation in Chaco Canyon, New Mexico. Science, 214(4521): 656–658. DOI: https://doi.org/10.1126/science.214.4521.656
Betancourt, JL, Van Devender, TR and Martin, PS. (eds.) 1990. Packrat middens: The last 40,000 years of biotic change. University of Arizona Press.
Black, PE. 2007. Revisiting the Thornthwaite and Mather Water Balance 1. Journal of the American Water Resources Association, 43(6): 1604–1605. DOI: https://doi.org/10.1111/j.1752-1688.2007.00132.x
Briffa, KR. 2000. Annual climate variability in the Holocene: Interpreting the message of ancient trees. Quaternary Science Reviews, 19(1–5): 87–105. DOI: https://doi.org/10.1016/S0277-3791(99)00056-6
Harbert and Nixon: Quantitative Late Quaternary Climate Reconstruction from Plant Macrofossil Communities in Western North America
Art. 8, page 10 of 13
Clark, PU, Dyke, AS, Shakun, JD, Carlson, AE, Clark, J, Wohlfarth, B, Mitrovica, JX, Hostetler, SW and McCabe, AM. 2009. The last glacial maximum. Science, 325(5941): 710–714. DOI: https://doi.org/10.1126/science.1172873
Coats, LL, Cole, KL and Mead, JI. 2008. 50,000 years of vegetation and climate history on the Colorado Plateau, Utah and Arizona, USA. Quater-nary Research, 70(2): 322–338. DOI: https://doi.org/10.1016/j.yqres.2008.04.006
Cole, K. 1982. Late Quaternary zonation of vegetation in the eastern Grand Canyon. Science, 217(4565): 1142–1145. DOI: https://doi.org/10.1126/science.217.4565.1142
Cole, K. 1985. Past rates of change, species richness, and a model of vegetational inertia in the Grand Canyon, Arizona. The American Naturalist, 125(2): 289–303. DOI: https://doi.org/10.1086/284341
Cole, KL. 2010. Vegetation response to early Holocene warming as an analog for current and future changes. Conservation Biology, 24(1): 29–37. DOI: https://doi.org/10.1111/j.1523-1739.2009.01406.x
Cole, KL. 2016. A Comparison of Historical and Future Rates of Climate Change in the Flagstaff Area of Northern Arizona. Proceedings of the 12th Biennial Conference of Research on the Colorado Plateau (ed. Ralston, B.E.). U.S. Geological Survey Scientific Inves-tigations, Report 2015-5180.
Cole, KL and Arundel, ST. 2005. Carbon isotopes from fossil packrat pellets and elevational movements of Utah agave plants reveal the Younger Dryas cold period in Grand Canyon, Arizona. Geology, 33(9): 713–716. DOI: https://doi.org/10.1130/G21769.1
Crucifix, M. 2016. palinsol: Insolation for Palaeoclimate Studies. R package version 0.93. http://CRAN.R-pro-ject.org/package=palinsol.
Cuffey, KM and Clow, GD. 1997. Temperature, accumu-lation, and ice sheet elevation in central Greenland through the last deglacial transition. Journal of Geophysical Research, 102(12): 26383–26396. DOI: https://doi.org/10.1029/96JC03981
Dial, KP, Czaplewski, NJ, Betancourt, JL, Van Devender, TR and Martin, PS. 1990. Do woodrat middens accurately represent the animals’ environments and diets? The Woodhouse Mesa study. In: Betancourt, JL, Van Devender, TR and Martin, PS (eds.), Packrat middens: the last 40,000 years of biotic change. The University of Arizona Press: Tucson.
Emslie, SD, Coats, L and Oleksy, E. 2015. Packrat middens and the Holocene palaeohistory of Colorado piñon (Pinus edulis) in western Colorado. Journal of Biogeography, 42(3): 565–574. DOI: https://doi.org/10.1111/jbi.12431
Finley, RB, Jr. 1990. Woodrat ecology and behavior and the interpretation of paleomiddens. In: Betancourt JL, Van Devender, TR and Martin, PS (eds.), Pack-rat middens: the last 40,000 years of biotic change, 28–42. The University of Arizona Press: Tucson.
Fletcher, T, Feng, R, Telka, AM, Matthews, JV, Jr and Ballantyne, A. 2017. Floral Dissimilarity and the
Influence of Climate in the Pliocene High Arctic: Biotic and Abiotic Influences on Five Sites on the Canadian Arctic Archipelago. Frontiers in Ecology and Evolution, 5: 19. DOI: https://doi.org/10.3389/fevo.2017.00019
Gill, JL, Williams, JW, Jackson, ST, Lininger, KB and Robinson, GS. 2009. Pleistocene megafaunal col-lapse, novel plant communities, and enhanced fire regimes in North America. Science, 326(5956): 1100–1103. DOI: https://doi.org/10.1126/science.1179504
Grimm, GW and Potts, AJ. 2016. Fallacies and fantasies: The theoretical underpinnings of the Coexistence Approach for palaeoclimate reconstruction. Climate of the Past Discussion, 12(3).
Guthrie, RD. 2006. New carbon dates link climatic change with human colonization and Pleistocene extinctions. Nature, 441(7090): 207. DOI: https://doi.org/10.1038/nature04604
Harbert, RS and Nixon, KC. 2015. Climate reconstruction analysis using coexistence likelihood estimation (CRACLE): A method for the estimation of climate using vegetation. American Journal of Botany, 102(8): 1277–1289. DOI: https://doi.org/10.3732/ajb.1400500
Haslett, J and Parnell, A. 2008. A simple monotone process with application to radiocarbon-dated depth chronologies. Journal of the Royal Statistical Society C, 57(4): 399–418. DOI: https://doi.org/10.1111/j.1467-9876.2008.00623.x
Hijmans, RJ. 2017. raster: Geographic Data Analysis and Modeling. R package version 2.6-7. https://CRAN.R-project.org/package=raster.
Hijmans, RJ, Cameron, SE, Parra, JL, Jones, PG and Jarvis, A. 2005. Very high resolution interpolated climate surfaces for global land areas. International Journal of Climatology, 25(15): 1965–1978. DOI: https://doi.org/10.1002/joc.1276
Holmgren, CA, Betancourt, JL, Peñalba, MC, Delgadillo, J, Zuravnsky, K, Hunter, KL, Rylander, KA and Weiss, JL. 2014. Evidence against a Pleistocene desert refugium in the Lower Colorado River Basin. Journal of Biogeography, 41(9): 1769–1780. DOI: https://doi.org/10.1111/jbi.12337
Holmgren, CA, Betancourt, JL and Rylander, KA. 2006. A 36,000-yr vegetation history from the Peloncillo Mountains, southeastern Arizona, USA. Palaeogeography, Palaeoclimatology, Palaeoecology, 240(3–4): 405–422. DOI: https://doi.org/10.1016/j.palaeo.2006.02.017
Hunter, KL, Betancourt, JL, Riddle, BR, Van Devender, TR, Cole, KL and Spaulding, WG. 2001. Ploidy race distributions since the Last Glacial Maximum in the North American desert shrub, Larrea tridentata. Global Ecology and Biogeography, 10(5): 521–533. DOI: https://doi.org/10.1046/j.1466-822X.2001.00254.x
Huntley, B, Bartlein, PJ and Prentice, IC. 1989. Climatic control of the distribution and abundance of beech (Fagus L.) in Europe and North America. Journal
Harbert and Nixon: Quantitative Late Quaternary Climate Reconstruction from Plant Macrofossil Communities in Western North America
Art. 8, page 11 of 13
of Biogeography, 551–560. DOI: https://doi.org/10.2307/2845210
Ibarra, DE, Egger, AE, Weaver, KL, Harris, CR and Maher, K. 2014. Rise and fall of late Pleistocene pluvial lakes in response to reduced evaporation and precipitation: Evidence from Lake Surprise, California. Bulletin of the Geological Society of America, 126(11–12): 1387–1415. DOI: https://doi.org/10.1130/B31014.1
Imbrie, J, Boyle, EA, Clemens, SC, Duffy, A, Howard, WR, Kukla, G, Kutzbach, J, Martinson, DG, McIntyre, A, Mix, AC and Molfino, B. 1992. On the structure and origin of major glaciation cycles 1. Linear responses to Milankovitch forcing. Paleoceanography, 7(6): 701–738. DOI: https://doi.org/10.1029/92PA02253
Jackson, ST and Blois, JL. 2015. Community ecology in a changing environment: Perspectives from the Quaternary. Proceedings of the National Academy of Sciences. DOI: https://doi.org/10.1073/pnas.1403664111
Jackson, ST, Lyford, ME and Betancourt, JL. 2002. A 4000-year record of woodland vegetation from Wind River Canyon, central Wyoming. Western North American Naturalist, 405–413.
Kiessling, W, Simpson, C, Beck, B, Mewis, H and Pandolfi, JM. 2012. Equatorial decline of reef corals during the last Pleistocene interglacial. Proceedings of the National Academy of Sciences, 109(52): 21378–21383. DOI: https://doi.org/10.1073/pnas.1214037110
King, JE and Van Devender, TR. 1977. Pollen analysis of fossil packrat middens from the Sonoran Desert. Quaternary Research, 8(2): 191–204. DOI: https://doi.org/10.1016/0033-5894(77)90045-X
Lachniet, MS, Denniston, RF, Asmerom, Y and Polyak, VJ. 2014. Orbital control of western North America atmospheric circulation and climate over two glacial cycles. Nature Communications, 5: 3805. DOI: https://doi.org/10.1038/ncomms4805
Lamigueiro, O and Hijmans, R. 2018. rasterVis. R package version 0.45. http://oscarperpinan.github.io/rastervis.
Lyle, M, Heusser, L, Ravelo, C, Yamamoto, M, Barron, J, Diffenbaugh, NS, Herbert, T and Andreasen, D. 2012. Out of the tropics: The Pacific, Great Basin Lakes, and Late Pleistocene water cycle in the western United States. Science, 337(6102): 1629–1633. DOI: https://doi.org/10.1126/science.1218390
MacDonald, GM, Moser, KA, Bloom, AM, Porinchu, DF, Potito, AP, Wolfe, BB, Edwards, TW, Petel, A, Orme, AR and Orme, AJ. 2008. Evidence of temperature depression and hydrological variations in the eastern Sierra Nevada during the Younger Dryas stade. Quaternary Research, 70(2): 131–140. DOI: https://doi.org/10.1016/j.yqres.2008.04.005
Maitner, BS, Boyle, B, Casler, N, Condit, R, Donoghue, J, Durán, SM, Guaderrama, D, Hinchliff, CE, Jørgensen, PM, Kraft, NJ and McGill, B. 2018. The bien r package: A tool to access the Botanical
Information and Ecology Network (BIEN) database. Methods in Ecology and Evolution, 9(2): 373–379. DOI: https://doi.org/10.1111/2041-210X.12861
Maldonado, A, Betancourt, JL, Latorre, C and Villagran, C. 2005. Pollen analyses from a 50 000-yr rodent midden series in the southern Atacama Desert (25° 30′ S). Journal of Quaternary Science, 20(5): 493–507. DOI: https://doi.org/10.1002/jqs.936
Marcott, SA, Shakun, JD, Clark, PU and Mix, AC. 2013. A reconstruction of regional and global tempera-ture for the past 11,300 years. Science, 339(6124): 1198–1201. DOI: https://doi.org/10.1126/science.1228026
Marsicek, J, Shuman, BN, Bartlein, PJ, Shafer, SL and Brewer, S. 2018. Reconciling divergent trends and millennial variations in Holocene tempera-tures. Nature, 554(7690): 92. DOI: https://doi.org/10.1038/nature25464
Mathys, AS, Coops, NC and Waring, RH. 2017. An ecoregion assessment of projected tree species vulnerabilities in western North America through the 21st century. Global Change Biology, 23(2): 920–932. DOI: https://doi.org/10.1111/gcb.13440
Milankovitch, M. 1930. Mathematische klimalehre und astronomische theorie der klimaschwankungen. Handbuch der Klimatologie 1.
Mosbrugger, V and Utescher, T. 1997. The coexistence approach—a method for quantitative reconstruc-tions of Tertiary terrestrial palaeoclimate data using plant fossils. Palaeogeography, Palaeoclimatology, Palaeoecology, 134(1–4): 61–86. DOI: https://doi.org/10.1016/S0031-0182(96)00154-X
Munroe, JS and Laabs, BJ. 2013. Temporal correspond-ence between pluvial lake highstands in the southwestern US and Heinrich Event 1. Journal of Quaternary Science, 28(1): 49–58. DOI: https://doi.org/10.1002/jqs.2586
Olson, D, DellaSala, DA, Noss, RF, Strittholt, JR, Kass, J, Koopman, ME and Allnutt, TF. 2012. Climate change refugia for biodiversity in the Klamath- Siskiyou ecoregion. Natural Areas Journal, 32(1): 65–74. DOI: https://doi.org/10.3375/043.032.0108
Ordonez, A. 2013. Realized climatic niche of North Amer-ican plant taxa lagged behind climate during the end of the Pleistocene. American Journal of Botany, 100(7): 1255–1265. DOI: https://doi.org/10.3732/ajb.1300043
Oster, JL, Ibarra, DE, Winnick, MJ and Maher, K. 2015. Steering of westerly storms over western North America at the Last Glacial Maximum. Nature Geoscience, 8(3): 201. DOI: https://doi.org/10.1038/ngeo2365
Pachauri, RK, Allen, MR, Barros, VR, Broome, J, Cramer, W, Christ, R, Church, JA, Clarke, L, Dahe, Q, Dasgupta, P and Dubash, NK. 2014. Climate change 2014: Synthesis report. Contribution of Working Groups I, II and III to the fifth assessment report of the Intergovernmental Panel on Climate Change. IPCC.
Harbert and Nixon: Quantitative Late Quaternary Climate Reconstruction from Plant Macrofossil Communities in Western North America
Art. 8, page 12 of 13
Poore, RZ, Pavich, MJ and Grissino-Mayer, HD. 2005. Record of the North American southwest monsoon from Gulf of Mexico sediment cores. Geology, 33(3): 209–212. DOI: https://doi.org/10.1130/G21040.1
R Core Team. 2018. R: A language and environment for statistical computing. R Foundation for Statistical Computing, Vienna, Austria. URL: http://www.R-project.org/.
Reheis, M. 1999. Highest pluvial-lake shorelines and Pleistocene climate of the western Great Basin. Quaternary Research, 52(2): 196–205. DOI: https://doi.org/10.1006/qres.1999.2064
Reheis, MC, Adams, KD, Oviatt, CG and Bacon, SN. 2014. Pluvial lakes in the Great Basin of the western United States—A view from the outcrop. Quaternary Science Reviews, 97: 33–57. DOI: https://doi.org/10.1016/j.quascirev.2014.04.012
Reimer, PJ, Baillie, MG, Bard, E, Bayliss, A, Beck, JW, Blackwell, PG, Ramsey, CB, Buck, CE, Burr, GS, Edwards, RL and Friedrich, M. 2009. IntCal09 and Marine09 radiocarbon age calibration curves, 0–50,000 years cal BP. Radiocarbon, 51(4): 1111–1150. DOI: https://doi.org/10.1017/S0033822200034202
Renssen, H, Seppä, H, Crosta, X, Goosse, H and Roche, DM. 2012. Global characterization of the Holocene thermal maximum. Quaternary Science Reviews, 48: 7–19. DOI: https://doi.org/10.1016/j.quascirev.2012.05.022
Roberts, DR and Hamann, A. 2016. Climate refugia and migration requirements in complex landscapes. Ecography, 39(12): 1238–1246. DOI: https://doi.org/10.1111/ecog.01998
Shakun, JD, Clark, PU, He, F, Marcott, SA, Mix, AC, Liu, Z, Otto-Bliesner, B, Schmittner, A and Bard, E. 2012. Global warming preceded by increasing car-bon dioxide concentrations during the last degla-ciation. Nature, 484(7392): 49. DOI: https://doi.org/10.1038/nature10915
Sharpe, SE. 2002. Constructing seasonal climograph overlap envelopes from Holocene packrat midden contents, Dinosaur National Monument, Colorado. Quaternary Research, 57(3): 306–313. DOI: https://doi.org/10.1006/qres.2002.2338
Silverman, BW. 1986. Density estimation for statistics and data analysis. Routledge. DOI: https://doi.org/10.1201/9781315140919
Sinka, KJ and Atkinson, TC. 1999. A mutual climatic range method for reconstructing palaeoclimate from plant remains. Journal of the Geological Society, 156(2): 381–396. DOI: https://doi.org/10.1144/gsjgs.156.2.0381
Spaulding, WG and Van Devender, TR. 1977. Late Pleistocene montane conifers in southeastern Utah. The Southwestern Naturalist, 22(2): 269–271. DOI: https://doi.org/10.2307/3669816
Steele, CA and Storfer, A. 2006. Coalescent-based hypothesis testing supports multiple Pleistocene refugia in the Pacific Northwest for the Pacific giant
salamander (Dicamptodon tenebrosus). Molecular Ecology, 15(9): 2477–2487. DOI: https://doi.org/10.1111/j.1365-294X.2006.02950.x
Thompson, RS, Anderson, KH, Pelltier, RT, Strickland, LE, Bartlein, PJ and Shafer, SL. 2012. Quanti-tative estimation of climatic parameters from vegetation data in North America by the mutual climatic range technique. Quaternary Science Reviews, 51: 18–39. DOI: https://doi.org/10.1016/j.quascirev.2012.07.003
Thornthwaite, CW. 1948. An approach toward a rational classification of climate. Geographi-cal Review, 38(1): 55–94. DOI: https://doi.org/10.2307/210739
Van Devender, TR. 1977. Holocene woodlands in the southwestern deserts. Science, 198(4313): 189–192. DOI: https://doi.org/10.1126/science.198.4313.189
Van Devender, TR. 1987. Holocene vegetation and climate in the Puerto Blanco Mountains, southwestern Arizona. Quaternary Research, 27(1): 51–72. DOI: https://doi.org/10.1016/0033-5894(87)90049-4
Viau, AE, Ladd, M and Gajewski, K. 2012. The climate of North America during the past 2,000 years recon-structed from pollen data. Global and Planetary Change, 84: 75–83. DOI: https://doi.org/10.1016/j.gloplacha.2011.09.010
Wake, DB, Hadly, EA and Ackerly, DD. 2009. Biogeography, changing climates, and niche evolution. Proceedings of the National Academy of Sciences: pnas-0911097106.
Wells, PV and Berger, R. 1967. Late Pleistocene history of coniferous woodland in the Mohave Desert. Science, 155(3770): 1640–1647. DOI: https://doi.org/10.1126/science.155.3770.1640
Wells, PV and Hunziker, JH. 1976. Origin of the creo-sote bush (Larrea) deserts of southwestern North America. Annals of the Missouri Botanical Garden, 843–861. DOI: https://doi.org/10.2307/2395251
Wells, PV and Jorgensen, CD. 1964. Pleistocene wood rat middens and climatic change in Mohave Desert: A record of juniper woodlands. Science, 143(3611): 1171–1173. DOI: https://doi.org/10.1126/science.143.3611.1171
Whittaker, RH and Niering, WA. 1975. Vegetation of the Santa Catalina Mountains, Arizona. V. Biomass, production, and diversity along the elevation gradient. Ecology, 56(4): 771–790. DOI: https://doi.org/10.2307/1936291
Williams, JW, Grimm, EC, Blois, JL, Charles, DF, Davis, EB, Goring, SJ, Graham, RW, Smith, AJ, Anderson, M, Arroyo-Cabrales, J and Ashworth, AC. 2018. The Neotoma Paleoecology Database, a multiproxy, international, community-curated data resource. Quaternary Research, 89(1): 156–177. DOI: https://doi.org/10.1017/qua.2017.105
Willis, KJ and MacDonald, GM. 2011. Long-term ecological records and their relevance to climate change predictions for a warmer world. Annual Review of Ecology, Evolution, and Systematics,
Harbert and Nixon: Quantitative Late Quaternary Climate Reconstruction from Plant Macrofossil Communities in Western North America
Art. 8, page 13 of 13
42: 267–287. DOI: https://doi.org/10.1146/annurev-ecolsys-102209-144704
Wurster, CM, Patterson, WP, McFarlane, DA, Wassenaar, LI, Hobson, KA, Athfield, NB and Bird, MI. 2008. Stable carbon and hydrogen iso-topes from bat guano in the Grand Canyon, USA, reveal Younger Dryas and 8.2 ka events. Geology, 36(9): 683–686. DOI: https://doi.org/10.1130/G24938A.1
Zazula, GD, MacPhee, RD, Metcalfe, JZ, Reyes, AV, Brock, F, Druckenmiller, PS, Groves, P, Harington, CR, Hodgins, GW, Kunz, ML and Longstaffe, FJ. 2014. American mastodon extirpa-tion in the Arctic and Subarctic predates human colonization and terminal Pleistocene climate change. Proceedings of the National Academy of Sciences, 111(52): 18460–18465. DOI: https://doi.org/10.1073/pnas.1416072111
How to cite this article: Harbert, RS and Nixon, KC. 2018. Quantitative Late Quaternary Climate Reconstruction from Plant Macrofossil Communities in Western North America. Open Quaternary, 4: 8, pp. 1–7. DOI: https://doi.org/10.5334/oq.46
Submitted: 19 June 2018 Accepted: 16 November 2018 Published: 19 December 2018
Copyright: © 2018 The Author(s). This is an open-access article distributed under the terms of the Creative Commons Attribution 4.0 International License (CC-BY 4.0), which permits unrestricted use, distribution, and reproduction in any medium, provided the original author and source are credited. See http://creativecommons.org/licenses/by/4.0/.
OPEN ACCESS Open Quaternary is a peer-reviewed open access journal published by Ubiquity Press.