Embed Size (px)
Citation preview
VOL. 32., NO. 3 September, I957
T HE QUARTERLY REVIEW of BIOLOGY
QUANTITATIVE LAWS IN METABOLISM AND GROWTH BY LUDWIG VON BERTALANFFY
Biological Research, Mt. Sinai Hospital, and University of Southern California, Los Angeles
INTRODUCTION T _ HE work reviewed in this paper is aimed at establishing connections be- tween two fundamental aspects of living organisms, their metabolism and growth. What we call growth of even a simple
organism is a tremendously complex phenomenon from the biochemical, physiological, cytological, and morphological viewpoints. There are, however, certain aspects that are amenable to quantitative analysis, and such an approach appears to lead to some insight into the connections between metabolism and growth, and to some answer to the seemingly trivial, but in fact hardly explored question, "Why does an organism grow at all, and why, after a certain time, does its growth come to a stop?"
QUANTITATIVE RELATIONS BETWEEN BODY SIZE AND METABOLIC RATE
In order to begin this investigation, it may be emphasized that, in many physiological activities, the absolute size of the body is a most important factor determining the rate of processes. Whether we take total metabolism, heart or respiratory rate, the chemical composition of the organism, excretion, or the enzyme content of the cells-we always will find that they characteristically vary with body size, this being true even though the the organisms compared in such respects show a tremendous diversity in their anatomy, physiologi- cal mechanisms, adaptations to certain environ- ments, and so forth (cf. Adolph, 1949). To give
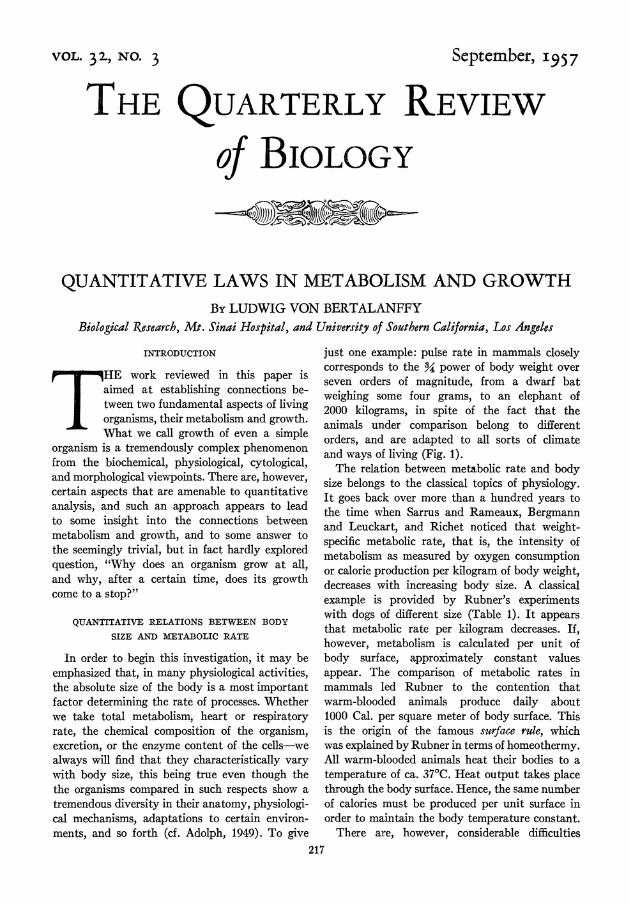
just one example: pulse rate in mammals closely corresponds to the Y power of body weight over seven orders of magnitude, from a dwarf bat weighing some four grams, to an elephant of 2000 kilograms, in spite of the fact that the animals under comparison belong to different orders, and are adapted to all sorts of climate and ways of living (Fig. 1).
The relation between metabolic rate and body size belongs to the classical topics of physiology. It goes back over more than a hundred years to the time when Sarrus and Rameaux, Bergmann and Leuckart, and Richet noticed that weight- specific metabolic rate, that is, the intensity of metabolism as measured by oxygen consumption or calorie production per kilogram of body weight, decreases with increasing body size. A classical example is provided by Rubner's experiments with dogs of different size (Table 1). It appears that metabolic rate per kilogram decreases. If, however, metabolism is calculated per unit of body surface, approximately constant values appear. The comparison of metabolic rates in mammals led Rubner to the contention that warm-blooded animals produce daily about 1000 Cal. per square meter of body surface. This is the origin of the famous surface rule, which was explained by Rubner in terms of homeothermy. All warm-blooded animals heat their bodies to a temperature of ca. 37?C. Heat output takes place through the body surface. Hence, the same number of calories must be produced per unit surface in order to maintain the body temperature constant.
There are, however, considerable difficulties 217
218 THE QUARTERLY REVIEW OF BIOLOGY
1000
IL L co P DD o ED6Eh'0G RABBIT
~~~~80O OVS~~~~~~~MQMTO-'
= 3 X - - -~~~~~~~~~~~~~_T
-A SS X
ctS0O C 4W" I , EUOSELjEP 200O kg .39 5Sg log !50Q ioOs 509 g I kg SW tk!g 50k(s l0kg 500kq IOQOV9
BODY WEIGHT
FIG. 1. ALLomETRic DZEPENDENCE OF PULS5E FEREQuENcY ON BODY WEIGHT IN MAMMLS
It may be assumed that the volume of blood transported per minute is proportional to the basal metabolic rate, as the oxygen consumed must be transported by the blood. This volume is equal to stroke volume (S) X pulse frequency (F). In a rough first approximation, S may be taken as proportional to body weight (W). The basal metabolic rate follows interspecifically, in the series of mammals, the W! rule. Hence:
S.F. = CW.', and
= = C'W
The figmre shows that the allometry constant of pulse frequency, a =-.28. Notwithstanding the gross over simplirication which neglects anatomical, physiological, ecologicalo and other differences absolute body size is the dominating factor in the control of pulse frequency, in a range from the dwarf bat (4 g. body weight) to the ele- phant (2000 kg.). Modified after Bertalanffy (1951a).
TABLE 1 Metabolism in dogs
After Rubner (1902).
Weight in kg. Cal. production Cal. production per per kg. sq. m. body surface
3.1 85.8 1909 6.5 61.2 1073
11.0 57.3 1191 17.7 45.3 1047 19.2 44.6 1141 23.7 40.2 1082 30.4 34.8 984
in measuring the outer surfaces of animals exactly, but a simple mathematical device can be applied. If two bodies are reasonably similar in shape, their surfaces can be expressed as a 23 power of weight, since the cubic root of the volume or weight is a linear dimension, and therefore its square has the dimension of a surface. Hence, the surface areas of geometrically similar bodies can be obtained by multiplying the 23 power of the weight by a suitable constant. This is seen in the well-known formula of Meeh:
S =bW (1)
The surface rule of metabolism accordingly states that the basal metabolic rate is propor- tional to the /% power of the weight. In the case of man, the determination of the basal metab- olism is a clinical routine, in order to diagnose thyroid disorders and the like. Here the somewhat more complicated Dubois formula is applied. Dimensionally, however, the Dubois formula is identical with the surface rule. The Dubois formula is: S = kW0 425 X L0 725. As, presupposing geometrical similarity, length L = cW', this can be written: S = kWO-420. cW0 725(0 33) = bW
The relation between metabolic rate and body size can be studied either intraspecifically, i.e., by comparing animals of the same species and different body size, or interspecifically, i.e., by comparing adult animals of different species. We are at present mainly concerned with intraspecific comparison.
A grave objection can be raised against the surface rule as found in textbooks of physiology. In considering the quantitative relation between metabolic rate and body size, homeothermic vertebrates and, in particular, mammals are almost solely taken into account (e.g., Brody, 1945; Kleiber, 1947; Krebs, 1950). However, the case of mammals is by no means simple but rather
QUANTITATIVE LAWS IN METABOLISM AND GROWTH 219
is intricate. Moreover, as we shall see presently, many familiar conclusions and explanatory hypotheses fall flat if not only mammals but also poikilothermic vertebrates and invertebrates are taken into consideration. It is therefore necessary to consider the problem on the broader basis of comparative physiology. A considerable part of this work has been carried through in the author's laboratories.
In order to understand these results, one more mathematical formula is necessary. The depend- ence of the metabolic rate of an animal on body size can be expressed in the equation:
M = bWG, (2) where M is the metabolic rate per unit time, W the body weight, and a and b are constants. This is a special case of the so-called allometric fornula (Huxley, 1932) which expresses the dependence on body size for an enormous amount of morphological, biochemical, physiological, and evolutionary data. This formula can further be written in the following way:
log M = log b + o? log W (3)
That is to say, if metabolic rate is plotted against body weight double-logarithmically, we obtain a straight line the slope of which indicates the constant a. If a = 3, the metabolic rate follows the surface rule. If a = 1 or the slope is 450, the metabolic rate is proportional to weight. With 1 > a > 23, an intermediary case obtains.
If weight-specific values are taken, that is, if metabolic rate per unit weight is plotted instead of that of the total animal, the equation becomes:
M =bW (4)
Correspondingly, weight-specific metabolic rates, as a general rule, decrease with increasing weight, and the slope of the logarithmic plot is negative.
After these preliminaries, we can summarize the experimental results in the following way (Bertalanffy, 1941b, et seq.):
1. The surface rule also holds for poikilothermic vertebrates and certain invertebrates. The rule is, therefore, of a wide application; but the explana- tion given by Rubner is too restricted, for in poikilothermic animals there is no thermoregula- tion, and thus the latter cannot be the basic factor in the relation between body size and metabolic rate.
2. On the other hand, there are many classes
TABLE 2 CO2 production of Armadillidium pallasii
(Temperature 21?C.) After MUller (1943b).
Weight in mg. 15 33 50 100 160 Cmm. C02/hr. 3.0 5.2 7.2 11.2 15.2 Per g./hr. 200 174 144 112 94 Per unit surface (WI)/ 48. 5 54.2 53.0 49.8 51.6
hr.
of animals in which the surface rule does not hold.
3. Thus we come to the statement that several metabolic types exist with respect to the relation between metabolic rate and body size.
In view of what was said previously, three metabolic types, that is, three different ways of dependence of the metabolic rate on body size can be distinguished, this classification applying, as was emphasized, to intraspecific allometry, that is, to individuals of different sizes or to growing animals within one species.
In the first type, metabolic rate is proportional to a surface or the 23 power of the weight. Repre- sentatives of this type include fishes but also certain invertebrates, such as crustaceans, clams, and ascaris. Table 2 presents one example, the metabolic rate in the sowbug, Armadillidium. As can be seen, its oxygen consumption per unit weight decreases with increasing body size, but remains constant per unit surface. Subsequently it will be seen that sowbug and company reveal quite a bit about human growth as a central problem of physiology.
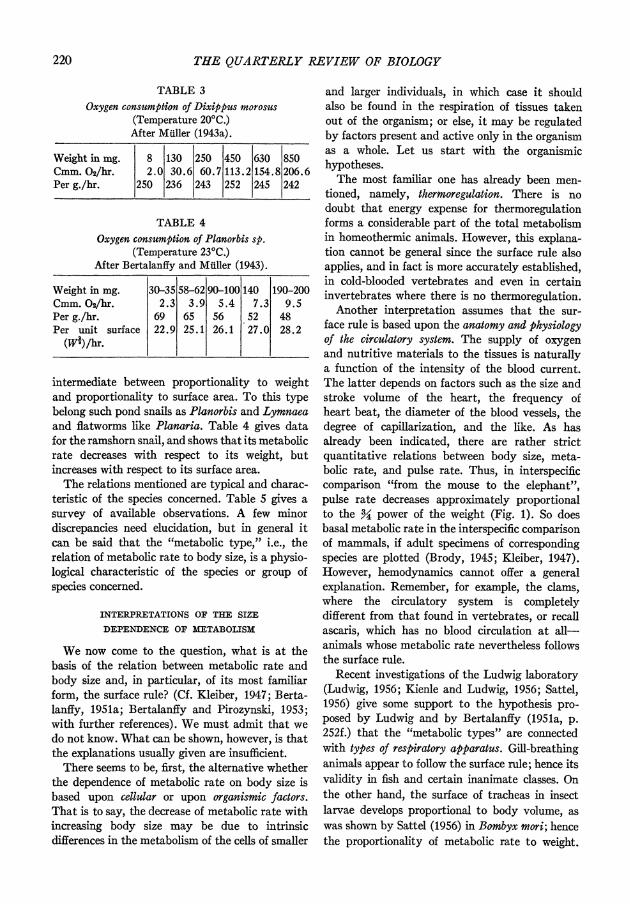
The second type is quite different. Here the metabolic rate is proportional not to surface area, but to weight itself, so oxygen consumption in an animal of double size is simply doubled, in an animal four times as large is quadrupled, etc. Direct proportionality of metabolic rate to weight is found in growing insect larvae and hemime- tabolous insects, as well as interspecifically, in comparing imagos of different related species. Table 3 shows metabolic rates in the walking stick, Dixippus morosus. Oxygen consumption per gram and hour appears to be constant over a wide range, covering all body sizes and the entire development. Other groups belonging to this type are land snails of the family Helicidae, intraspecifically as well as interspecifically, and annelids such as the earthworm.
Finally, in the third type metabolic rates are
220 THIE QUARTERLY REVIEW OF BIOLOGY
TABLE 3 Oxygen consumption of Dixippus morosus
(Temperature 20?C.) After Muller (1943a).
Weight in mg. 8 130 250 450 630 850 Cmm. 02/hr. 2.0 30.6 60.7 113.2 154.8 206.6 Per g./hr. 250 236 243 252 245 242
TABLE 4 Oxygen consumption of Planorbis sp.
(Temperature 23?C.) After Bertalanffy and Muller (1943).
Weight in mg. 30-35 58-62 90-100 140 190-200 Cmm. 02/hr. 2.3 3.9 5.4 7.3 9.5 Per g./hr. 69 65 56 52 48 Per unit surface 22.9 25.1 26.1 27.0 28.2
(WI)/hr.
intermediate between proportionality to weight and proportionality to surface area. To this type belong such pond snails as Planorbis and Lymnaea and filatworms like Planaria. Table 4 gives data for the ramshorn snail, and shows that its metabolic rate decreases with respect to its weight, but increases with respect to its surface area.
The relations mentioned are typical and charac- teristic of the species concerned. Table 5 gives a survey of available observations. A few minor discrepancies need elucidation, but in general it can be said that the "metabolic type," i.e., the relation of metabolic rate to body size, is a physio- logical characteristic of the species or group of species concerned.
INTERPRETATIONS OF THE SIZE DEPENDENCE OF METABOLISM
We now come to the question, what is at the basis of the relation between metabolic rate and body size and, in particular, of its most familiar form, the surface rule? (Cf. Kleiber, 1947; Berta- lanffy, 1951a; Bertalanffy and Pirozynski, 1953; with further references). We must admit that we do not know. What can be shown, however, is that the explanations usually given are insufficient.
There seems to be, first, the alternative whether the dependence of metabolic rate on body size is based upon cellular or upon organismic factors. That is to say, the decrease of metabolic rate with increasing body size may be due to intrinsic differences in the metabolism of the cells of smaller
and larger individuals, in which case it should also be found in the respiration of tissues taken out of the organism; or else, it may be regulated by factors present and active only in the organism as a whole. Let us start with the organismic hypotheses.
The most familiar one has already been men- tioned, namely, thermoregulation. There is no doubt that energy expense for thermoregulation forms a considerable part of the total metabolism in homeothermic animals. However, this explana- tion cannot be general since the surface rule also applies, and in fact is more accurately established, in cold-blooded vertebrates and even in certain invertebrates where there is no thermoregulation.
Another interpretation assumes that the sur- face rule is based upon the anatomy and physiology of the circulatory system. The supply of oxygen and nutritive materials to the tissues is naturally a function of the intensity of the blood current. The latter depends on factors such as the size and stroke volume of the heart, the frequency of heart beat, the diameter of the blood vessels, the degree of capillarization, and the like. As has already been indicated, there are rather strict quantitative relations between body size, meta- bolic rate, and pulse rate. Thus, in interspecific comparison "from the mouse to the elephant", pulse rate decreases approximately proportional to the % power of the weight (Fig. 1). So does basal metabolic rate in the interspecific comparison of mammals, if adult specimens of corresponding species are plotted (Brody, 1945; Kleiber, 1947). However, hemodynamics cannot offer a general explanation. Remember, for example, the clams, where the circulatory system is completely different from that found in vertebrates, or recall ascaris, which has no blood circulation at all- animals whose metabolic rate nevertheless follows the surface rule.
Recent investigations of the Ludwig laboratory (Ludwig, 1956; Kienle and Ludwig, 1956; Sattel, 1956) give some support to the hypothesis pro- posed by Ludwig and by Bertalanffy (1951a, p. 252f.) that the "metabolic types" are connected with types of respiratory apparatus. Gill-breathing animals appear to follow the surface rule; hence its validity in fish and certain inanimate classes. On the other hand, the surface of tracheas in insect larvae develops proportional to body volume, as was shown by Sattel (1956) in Bombyx mori; hence the proportionality of metabolic rate to weight.
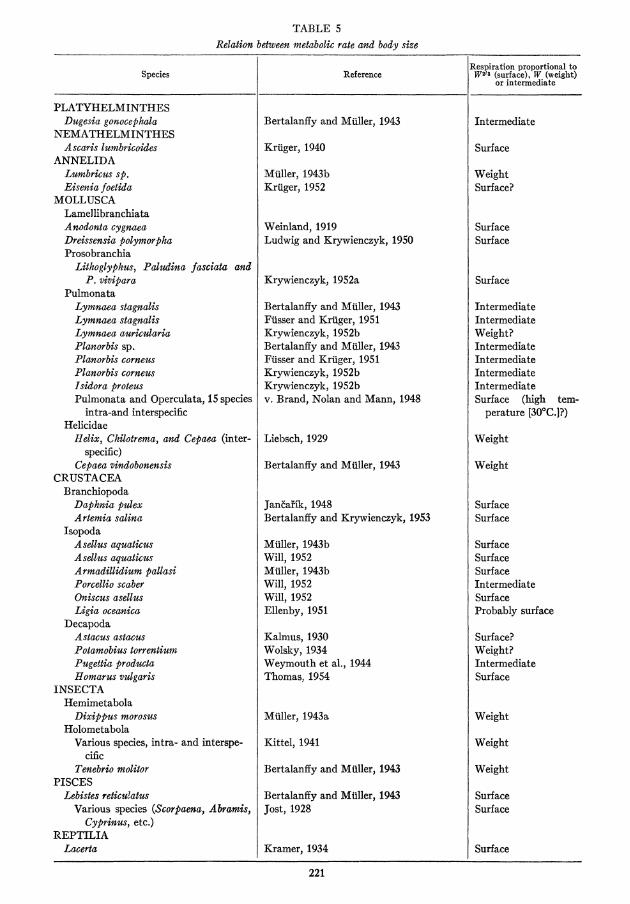
TABLE 5 Relation between metabolic rate and body size
Respiration proportional to Species Reference W2'8 (surface), W (weight)
or intermediate
PLATYHELMINTHES Dugesia gonocephala Bertalanffy and Muller, 1943 Intermediate
NEMATHELMINTHES Ascaris lumbricoides Kruger, 1940 Surface
ANNELIDA Lumbricus sp. Muller, 1943b Weight Eisenia foetida Kruger, 1952 Surface?
MOLLUSCA Lamellibranchiata Anodonta cygnaea Weinland, 1919 Surface Dreissensia polymorpha Ludwig and Krywienczyk, 1950 Surface Prosobranchia
Lithoglyphus, Paludina fasciata and P. vivipara Krywienczyk, 1952a Surface
Pulmonata Lymnaea stagnalis Bertalanffy and Muller, 1943 Intermediate Lymnaea stagnalis Fusser and Kruger, 1951 Intermediate Lymnaea acuricularia Krywienczyk, 1952b Weight? Planorbis sp. Bertalanffy and Maller, 1943 Intermediate Planorbis corneus Fusser and Kruger, 1951 Intermediate Planorbis corneus Krywienczyk, 1952b Intermediate Isidora proteus Krywienczyk, 1952b Intermediate Pulmonata and Operculata, 15 species v. Brand, Nolan and Mann, 1948 Surface (high ten-
intra-and interspecific perature [30?C.]?) Helicidae
Helix, Chilotrema, and Cepaea (inter- Liebsch, 1929 Weight specific)
Cepaea vindobonensis Bertalanffy and Muller, 1943 Weight CRUSTACEA
Branchiopoda Daphnia pulex Jan6aroik, 1948 Surface Artemia salina Bertalanffy and Krywienczyk, 1953 Surface
Isopoda Asellus aquaticus Muller, 1943b Surface Asellus aquaticus Will, 1952 Surface Armadillidium pallasi Muller, 1943b Surface Porcellio scaber Will, 1952 Intermediate Oniscus asellus Will, 1952 Surface Ligia oceanica Ellenby, 1951 Probably surface
Decapoda Astacus astacus Kalmus, 1930 Surface? Potamobius torrentiuin Wolsky, 1934 Weight? Pugettia producta Weymouth et al., 1944 Intermediate Homarus vulgaris Thomas, 1954 Surface
INSECTA Hemimetabola
Dixippus morosus Muller, 1943a Weight Holometabola
Various species, intra- and interspe- Kittel, 1941 Weight cific
Tenebrio molitor Bertalanffy and Muller, 1943 Weight PISCES
Lebistes reticulatus Bertalanffy and Muller, 1943 Surface Various species (Scorpaena, Abramis, Jost, 1928 Surface
Cyprinus, etc.) REPTILIA
Lacerta Kramer, 1934 Surface
221
222 THE QUARTERLY REVIEW OF BIOLOGY
Intermediate cases would result from the presence of two types of respiratory apparatus.
Still another explanation of the surface rule is based upon anatomical or chemical changes in composition with increasing body size. "Metaboli- cally active" organs such as the viscera, the brain, etc., are relatively larger in small as compared to large animals. So it can be assumed that they consume relatively more oxygen and are respon- sible for the higher weight-specific metabolic rate in smaller organisms. However, the relative growth of inner organs is very different from one organ to the other, and so it is improbable that it can yield the simple relation of the surface rule of metabolism (cf. Bertalanffy, 1951a). A quantita- tive estimate (Bertalanffy and Pirozynski, 1953) shows that this factor is not sufficient to account for the actual variations of basal metabolic rate.
Now we come to the interpretations in terms of intracellular factors. This amounts to saying that the decrease of weight-specific metabolic rate with increasing size, as expressed in the surface rule, is due to a corresponding decrease in the respiration of tissues. Tissue respiration is measured as Qo,, that is, ,l 02/mg. dry weight/hr., as determined with the Warburg apparatus. A considerable amount of work has recently been done along these lines, partly stimulated by our own work now to be presented, just as we may also say that the interest in comparative metab- olism as classified in the metabolic types men- tioned has been stimulated by the investigations on growth laws to be explained hereafter. The ques- tion of the size dependence of tissue respiration is a controversial one, but the statements to follow appear to be a fair presentation of the case.
In interspecific comparison of mammalian species of different sizes, ranging from the mouse to the horse, a decrease of Qo, with increasing body size is generally found, as a number of observers have established (Kleiber, 1941; Wey- mouth, Field, and Kleiber 1942; Krebs, 1950; Martin and Fuhrmann, 1955). This decrease, however, is not parallel in the various organs and, as a general rule, is less than would correspond to the surface rule or the 3 power rule of metabolism. In a corresponding way, a decrease with increasing body size was found in enzymatic systems con- nected with respiration, such as in the concentra- tion of glutathione (Gregory and Goss, 1933; Patru'sev, 1937), of cytochrome c (Rosenthal and Drabkin, 1943), of cytochrome oxidase (Kunkel
and Campbell, 1952), of succinodehydrase and malicodehydrase (Fried and Tipton, 1953).
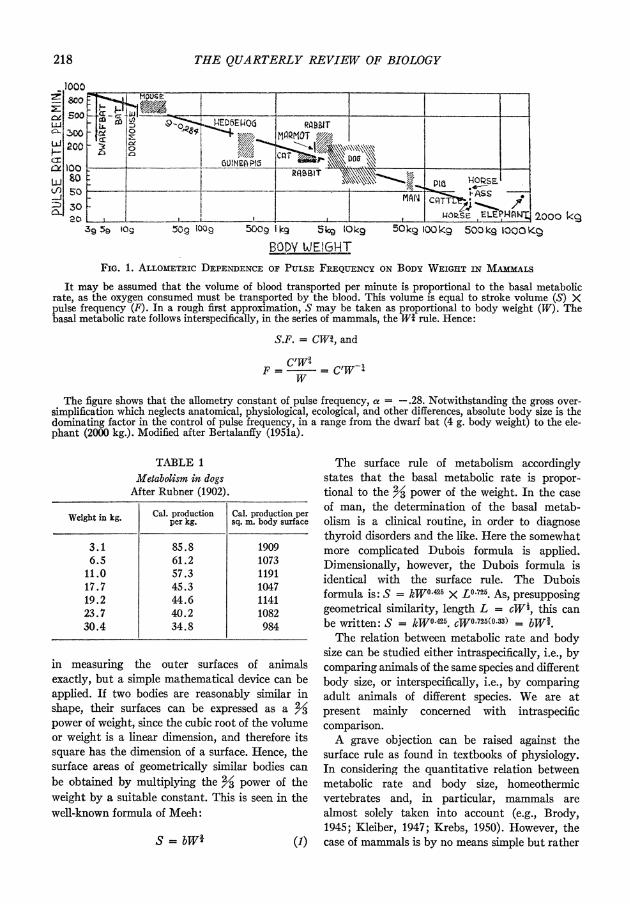
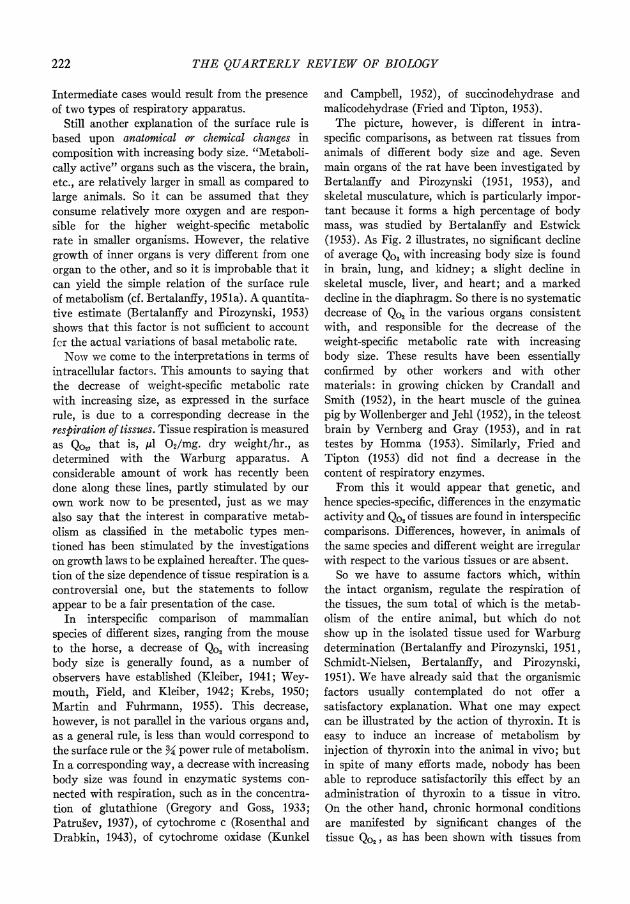
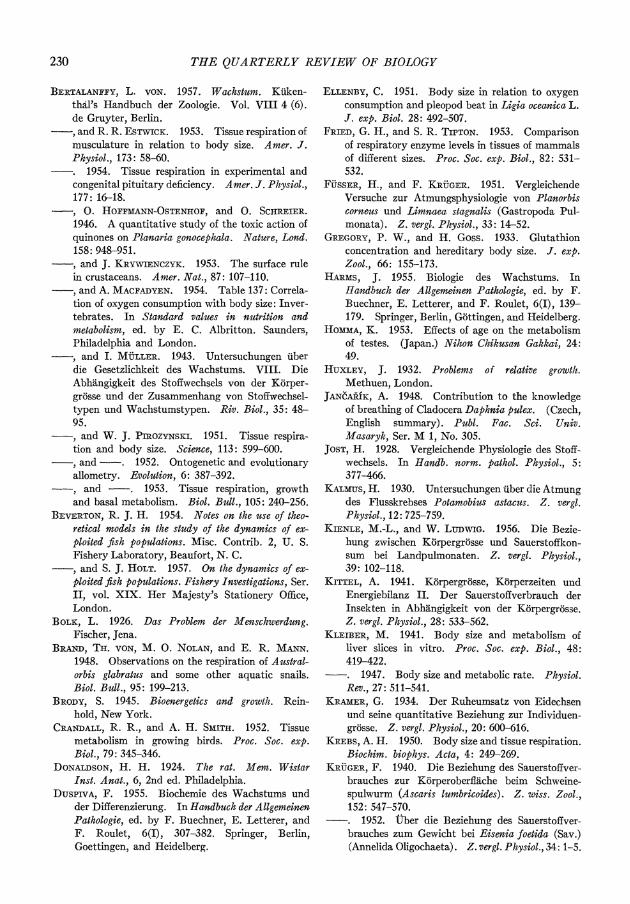
The picture, however, is different in intra- specific comparisons, as between rat tissues from animals of different body size and age. Seven main organs of the rat have been investigated by Bertalanffy and Pirozynski (1951, 1953), and skeletal musculature, which is particularly impor- tant because it forms a high percentage of body mass, was studied by Bertalanffy and Estwick (1953). As Fig. 2 illustrates, no significant decline of average Qo2 with increasing body size is found in brain, lung, and kidney; a slight decline in skeletal muscle, liver, and heart; and a marked decline in the diaphragm. So there is no systematic decrease of Qo, in the various organs consistent with, and responsible for the decrease of the weight-specific metabolic rate with increasing body size. These results have been essentially confirmed by other workers and with other materials: in growing chicken by Crandall and Smith (1952), in the heart muscle of the guinea pig by Wollenberger and Jehl (1952), in the teleost brain by Vernberg and Gray (1953), and in rat testes by Homma (1953). Similarly, Fried and Tipton (1953) did not find a decrease in the content of respiratory enzymes.
From this it would appear that genetic, and hence species-specific, differences in the enzymatic activity and Qo, of tissues are found in interspecific comparisons. Differences, however, in animals of the same species and different weight are irregular with respect to the various tissues or are absent.
So we have to assume factors which, within the intact organism, regulate the respiration of the tissues, the sum total of which is the metab- olism of the entire animal, but which do not show up in the isolated tissue used for Warburg determination (Bertalanffy and Pirozynski, 1951, Schmidt-Nielsen, Bertalanffy, and Pirozynski, 1951). We have already said that the organismic factors usually contemplated do not offer a satisfactory explanation. What one may expect can be illustrated by the action of thyroxin. It is easy to induce an increase of metabolism by injection of thyroxin into the animal in vivo; but in spite of many efforts made, nobody has been able to reproduce satisfactorily this effect by an administration of thyroxin to a tissue in vitro. On the other hand, chronic hormonal conditions are manifested by significant changes of the tissue Qo, as has been shown with tissues from
QUANTITATIVE LAWS IN METABOLISM AND GROWTH 223
15
7.~~~~~~~~~~~~~~z
6 t--Y?US
4
31 J l_ a 1o 20 30 40 50 60 eo MO no 300 400
BODY WEi6rT IN G. FIG. 2. TIssuE RESPIRATION or VARious ORGANS OF TIE WHITE RAT IN RELATION TO BODY WEIGHT
Qo2 = .dl 02/mg. dry wt./hr.
Only regression lines are shown; for individual data and statistical evaluation cf. the original paper. After Bertalanffy and Pirozynski (1953).
hypophysectomized animals and in pituitary dwarf mice, which lack somatotrophin (Bertalanffy and Estwick, 1954).
The writer does not feel happy about this state of affairs, and the situation would be much more satisfactory if a straightforward relation between the decrease of the weight-specific metabolic rate and the tissue respiration could be found. Indeed, the Ottawa study was started with this expectation, which, unfortunately, was not borne out by the facts.
The explanation of the surface rule and of the size-dependence of metabolism in general thus remains rather unsatisfactory. We have, at present, to take the metabolic type, in the sense defined, as an empirical datum of the species concerned. However, even this cautious attitude leads to certain remarkable inferences with respect to the problem of growth.
METABOLIC TYPES AND GROWTH TYPES
It has already been stated that, among the various animal classes, so-called metabolic types can be distinguished by virtue of the relation between the metabolic rate and the body size. Now as there are different metabolic types, there are also different growth types which are distin- guished by the course of growth as expressed in
the growth curves of the several species. It appears that we have been successful in establishing a definite and strict connection between metabolic types and growth types, in consequence of a general theory of growth which establishes rational quantitative laws of growth and indicates the physiological mechanism upon which growth is based.
Let us start with a rather obvious deliberation, first indicated by Putter (1920). Animal growth can be considered a result of a counteraction of synthesis and destruction, of the anabolism and catabolism of the building materials of the body. There will be growth so long as building up pre- vails over breaking down; the organism reaches a steady state if and when both processes are equal. We may express this in a general formula:
dWIdt = n WWm -KWn. (5)
In words: The change of body weight W is given by the difference between the processes of building up and breaking down; v and K are constants of anabolism and catabolism respec- tively, and the exponents m and n indicate that the latter are proportional to some power of the body weight W.
Obviously the growth of any organism is of an enormous complexity, whether we consider it

224 THE QUARTERLY REVIEW OF BIOLOGY
from a biochemical, physiological, morphological, or any other aspect. However, the justification of an overall formula and the simple model it implies lies in the following. Our equation states that the gross result of synthetic and degradative processes within the organism follows the law of allometry, that is, that the rate of these processes can be expressed as a power function of body mass. But this assumption is justified, because at least in a first approximation the rate of all physiological processes hitherto investigated can be expressed in allometric or power formulas (Adolph, 1949). The intrinsic complexity of the phenomenon concerned does not preclude it from following such a simple, general law. Remember, for example, what has been found in the dependence of the basal or resting metabolism of the intact animal. Of course, what is called the basal metabolic rate is, in fact, the outcome of innumerable and to a large extent unknown processes of intermediary metabolism. Not only this, but the growing organism undergoes changes at the biochemical, physiological, cellular, and morphological levels. Nevertheless, we can state quite definitely that a certain organism obeys, let us say, the surface rule; that is, that the rate of metabolism of the entire animal, whatever its size or developmental age, can be expressed as a function of the -'
power of its respective body weight. We have now more closely to define the processes
appearing in our basic equation. The catabolic processes mean, of course, the continuous loss of building material as it takes place in any living organism. Biochemically, this means the turnover of building materials and particularly of proteins, as demonstrated by the isotope techniques. Cytologically, it means the renewal of cells, as found in many tissues and organs, often at an unexpectedly high rate (cf. Leblond and Stevens, 1948; Storey and Leblond, 1951; F. D. Bertalanffy and Leblond, 1953; Leblond and Walker, 1956; a table of the rates of cell renewal as found by the Leblond school is given in Bertalanffy, 1957). The isotope and other techniques have shown that the animal organism maintains itself in a so-called dynamic or steady state (Schoenheimer, 1947), chemical components as well as cells being con- tinually worn out or degraded, and on the other hand being replaced by way of resynthesis and the formation of new cells. So far as the rate of catabolism is concerned, we may assume, as a first approximation and based upon various
physiological facts (cf. Bertalanify, 1951a), that it is directly proportional to weight. On the other hand, mathematical considerations (Bertalanffy, 1941b) show that our basic equation is rather insensitive to smaller deviations of the exponent n from unity. So we may put, without any con- siderable loss of generality, the exponent n equal to 1. This makes the solution of our basic equation much easier.
The solution of equation 5 (n = 1) is (Bertalanffy, 1941b):
W = {87/K - [vq/K - Wo (1-m)]e-(1_-tn)Kt}1-m (6)
with Wo = weight at time t = 0. The case is somewhat different with respect to
anabolism. The synthesis of high-molecular cell components needs, on the one hand, building blocks such as amino acids, sugars, phosphates, and so forth, and on the other hand energy which, in aerobic animals, is provided by oxidative processes. Both can be taken into account as limiting factors. The experimental results indicate that, so far as higher animals are concerned, there is a lawful connection between respiration, anab- olism, and growth which works out in the fol- lowing way.
The exponent n in our basic equation denotes the dependence of anabolism on body weight. If we insert for m that value which is experimentally found for the size dependence of resting metabo- lism, the growth laws for the organism in question follow automatically. Thus we can predict the growth type of an animal from its metabolic type, and this prediction has proved to be correct in a large number of cases, often in a quite unex- pected way.
In a first type, respiration is proportional to the 23 power of weight, according to the surface rule. Accordingly, the law of growth assumes the following form:
dW/dt - W2 -KW. (7)
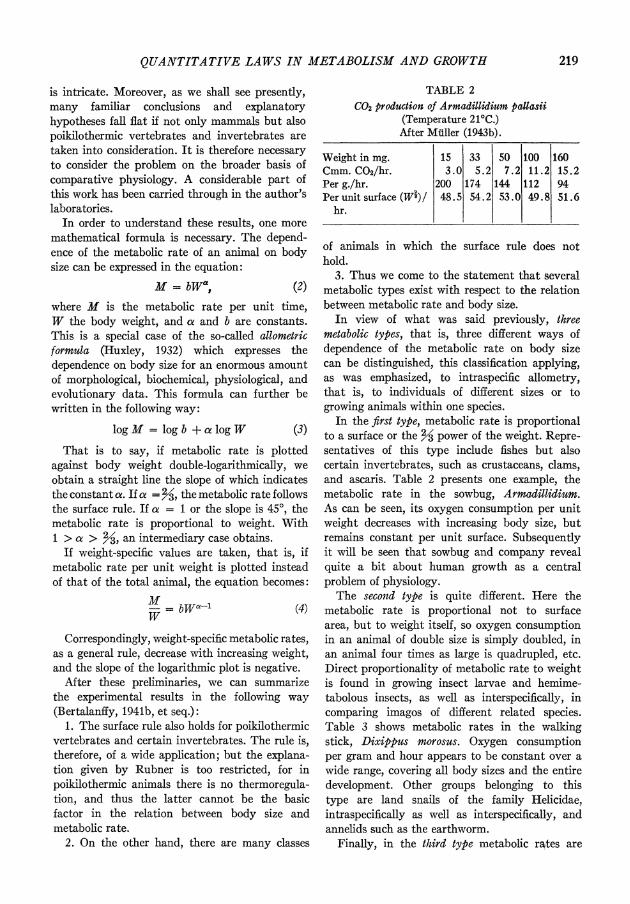
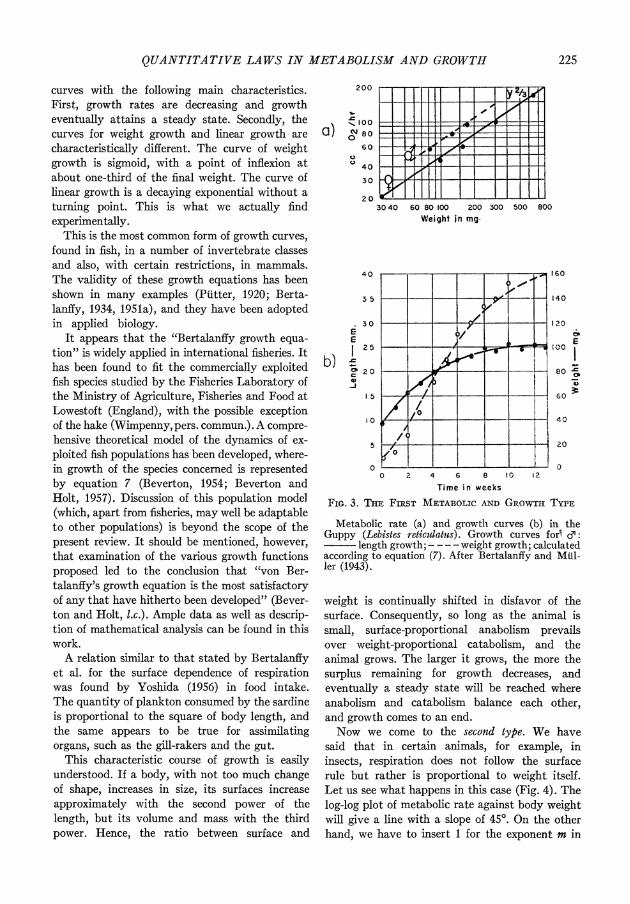
We shall not bother with the mathematical elaboration, but show immediately the results. Fig. 3 gives metabolism and growth in the small aquarium fish, Lebistes reticulatus. Metabolic rates, measured as oxygen consumption, are presented in the log-log or allometric plot. As will be re- membered, in the case of the surface rule the allometric regression line has a slope of 23. So far as the growth curves are concerned, the solu- tion of the growth equation gives theoretical
QUANTITATIVE LAWS IN METABOLISM AND GROWTH 225
curves with the following main characteristics. First, growth rates are decreasing and growth eventually attains a steady state. Secondly, the curves for weight growth and linear growth are characteristically different. The curve of weight growth is sigmoid, with a point of inflexion at about one-third of the final weight. The curve of linear growth is a decaying exponential without a turning point. This is what we actually find experimentally.
This is the most common form of growth curves, found in fish, in a number of invertebrate classes and also, with certain restrictions, in mammals. The validity of these growth equations has been shown in many examples (Putter, 1920; Berta- lanffy, 1934, 1951a), and they have been adopted in applied biology.
It appears that the "Bertalanffy growth equa- tion" is widely applied in international fisheries. It has been found to fit the commercially exploited fish species studied by the Fisheries Laboratory of the Ministry of Agriculture, Fisheries and Food at Lowestoft (England), with the possible exception of the hake (Wimpenny, pers. commun.). A compre- hensive theoretical model of the dynamics of ex- ploited fish populations has been developed, where- in growth of the species concerned is represented by equation 7 (Beverton, 1954; Beverton and Holt, 1957). Discussion of this population model (which, apart from fisheries, may well be adaptable to other populations) is beyond the scope of the present review. It should be mentioned, however, that examination of the various growth functions proposed led to the conclusion that "von Ber- talanify's growth equation is the most satisfactory of any that have hitherto been developed" (Bever- ton and Holt, l.c.). Ample data as well as descrip- tion of mathematical analysis can be found in this work.
A relation similar to that stated by Bertalanffy et al. for the surface dependence of respiration was found by Yoshida (1956) in food intake. The quantity of plankton consumed by the sardine is proportional to the square of body length, and the same appears to be true for assimilating organs, such as the gill-rakers and the gut.
This characteristic course of growth is easily understood. If a body, with not too much change of shape, increases in size, its surfaces increase approximately with the second power of the length, but its volume and mass with the third power. Hence, the ratio between surface and
200 __ _ - - -
a) C',j -0 0~ o 4-
40 ---- - - ---
3 0 -e00
2 0 - - 30 40 60 80 100 200 300 500 800
Weight In mg.
4 0 - - - - - -- 160
3 5 - -- _ 140
30 -- 6 - - 120
E E b) 125----_- 00
I 0 4~~~~- 80 ?' 2 0 - -
0 -0 0 2 4 6 8 10 12
Time in weeks
FIG. 3. IHE FIRST METABOLIC AND GROWTH TYPE
Metabolic rate (a) and growtlh curves (b) in the Guppy (Lebistes reticutatus). Growth curves for, d:
length growth; - - - - weight growth; calculated according to equation (7). After Bertalanffy and Mill- ler (1943).
weight is continually shifted in disfavor of the surface. Consequently, so long as the animal is small, surface-proportional anabolism prevails over weight-proportional catabolism, and the animal grows. The larger it grows, the more the surplus remaining for growth decreases, and eventually a steady state will be reached where anabolism and catabolism balance each other, and growth comes to an end.
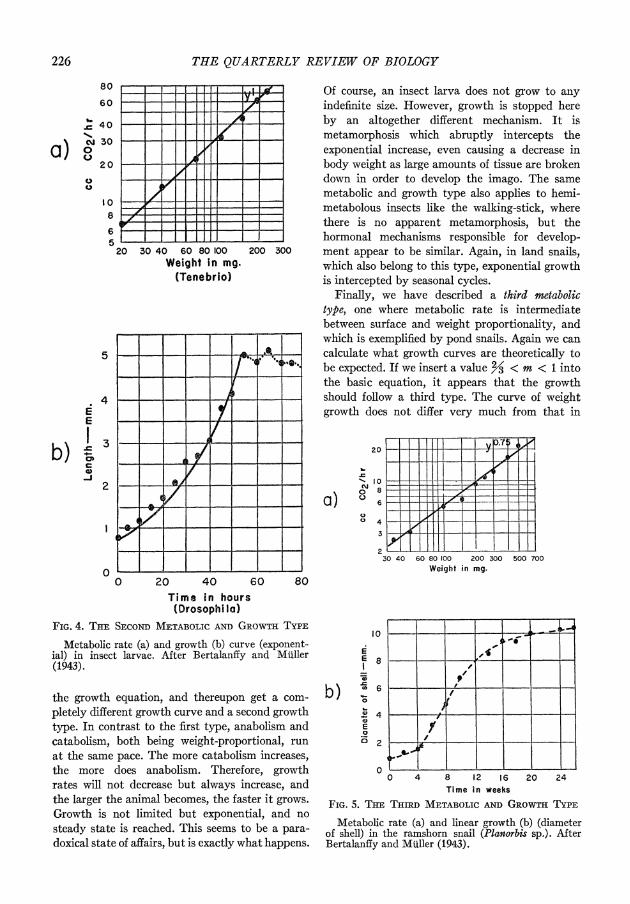
Now we come to the second type. We have said that in certain animals, for example, in insects, respiration does not follow the surface rule but rather is proportional to weight itself. Let us see what happens in this case (Fig. 4). The log-log plot of metabolic rate against body weight will give a line with a slope of 45?. On the other hand, we have to insert 1 for the exponent m in
226 THE QUARTERLY REVIEW OF BIOLOGY
80 60 - -
a)~~ 0 -j - -0
0
10 -A
5--- 20 30 40 60 80 100 200 300
Weight In mg. (Tenebrio)
5
.4- - E 1: 3 -?- >
b ) 2--f
o 20 40 60 80 Timqe in hours (Drosophi la)
FIG. 4. THE SECOND METABOLIC AND GROWnTY asPE
Metabolic rate (a) and growth (b) culrve (exponent- ial) in insect larvae. After Bertalanify and Muller (1943).
the growth equation, and thereupon get a com- pletely different growth curve and a second growth type. In contrast to the first type, anabolism and catabolism, both being weight-proportional, run at the same pace. The more catabolism increases, the more does anabolism. Therefore, growth rates will not decrease but always increase, and the larger the animal becomes, the faster it grows. Growth is not limited but exponential, and no steady state is reached. This seems to be a para- doxrical state of affairs, but is exactly what happenls.
Of course, an insect larva does not grow to any indefinite size. However, growth is stopped here by an altogether different mechanism. It is metamorphosis which abruptly intercepts the exponential increase, even causing a decrease in body weight as large amounts of tissue are broken down in order to develop the imago. The same metabolic and growth type also applies to hemi- metabolous insects like the walking-stick, where there is no apparent metamorphosis, but the hormonal mechanisms responsible for develop- ment appear to be similar. Again, in land snails, which also belong to this type, exponential growth is intercepted by seasonal cycles.
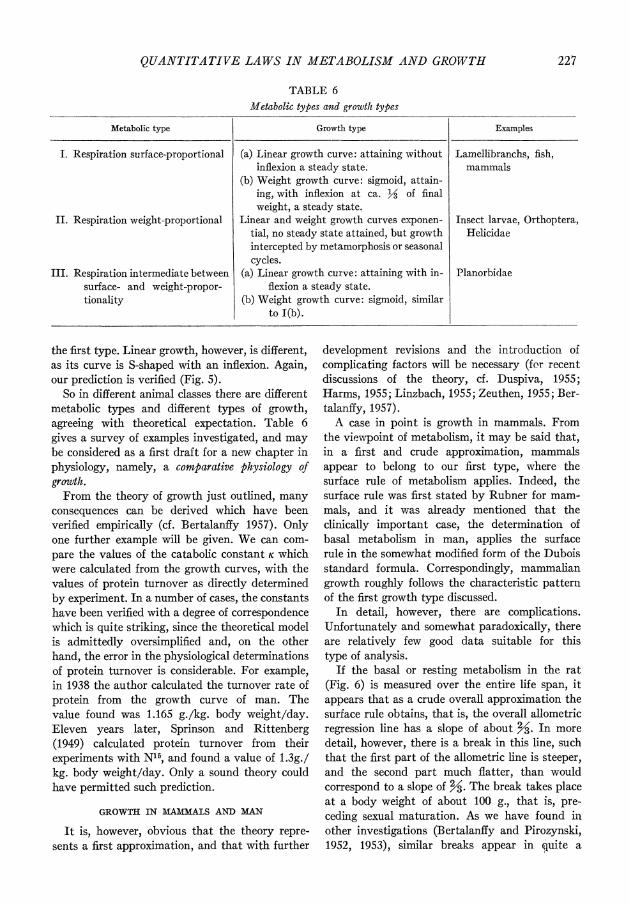
Finally, we have described a third metabolic type, one where metabolic rate is intermediate between surface and weight proportionality, and which is exemplified by pond snails. Again we can calculate what growth curves are theoretically to be expected. If we insert a value 23 < m < 1 into the basic equation, it appears that the growth should follow a third type. The curve of weight growth does not differ very much from that in
20
0 8jII7 a) 6 =
30 40 60 80 100 200 300 500 700 Weight in mg.
E8 = '- --V4 {>
0 4 _ _ cm e
0
0 4 8 12 16 20 24 Time in weeks
FIG. 5. THE THIRD METABOLIC AND GROWTH TYPE
Metabolic rate (a) and linear growth (b) (diameter of shell) in the ramshorn snail (Planorbis sp.). After Bertalanffy and Muller (1943).
QUANTITATIVE LAWS IN METABOLISM AND GROWTH 227
TABLE 6 Metabolic types and growth types
Metabolic type Growth type Examples
I. Respiration surface-proportional (a) Linear growth curve: attaining without Lamellibranchs, fish, inflexion a steady state. mammals
(b) Weight growth curve: sigmoid, attain- ing, with inflexion at ca. 13 of final weight, a steady state.
II. Respiration weight-proportional Linear and weight growth curves exponen- Insect larvae, Orthoptera, tial, no steady state attained, but growth Helicidae intercepted by metamorphosis or seasonal cycles.
III. Respiration intermediate between (a) Linear growth curve: attaining with in- Planorbidae surface- and weight-propor- flexion a steady state. tionality (b) Weight growth curve: sigmoid, similar
to I(b).
the first type. Linear growth, however, is different, as its curve is S-shaped with an inflexion. Again, our prediction is verified (Fig. 5).
So in different animal classes there are different metabolic types and different types of growth, agreeing with theoretical expectation. Table 6 gives a survey of examples investigated, and may be considered as a first draft for a new chapter in physiology, namely, a comparative physiology of growth.
From the theory of growth just outlined, many consequences can be derived which have been verified empirically (cf. Bertalanffy 1957). Only one further example will be given. We can com- pare the values of the catabolic constant K which were calculated from the growth curves, with the values of protein turnover as directly determined by experiment. In a number of cases, the constants have been verified with a degree of correspondence which is quite striking, since the theoretical model is admittedly oversimplified and, on the other hand, the error in the physiological determinations of protein turnover is considerable. For example, in 1938 the author calculated the turnover rate of protein from the growth curve of man. The value found was 1.165 g./kg. body weight/day. Eleven years later, Sprinson and Rittenberg (1949) calculated protein turnover from their experiments with N15, and found a value of 1.3g./ kg. body weight/day. Only a sound theory could have permitted such prediction.
GROWTH IN MAMMALS AND MAN
It is, however, obvious that the theory repre- sents a first approximation, and that with further
development revisions and the introduction of complicating factors will be necessary (for recent discussions of the theory, cf. Duspiva, 1955; Harms, 1955; Linzbach, 1955; Zeuthen, 1955; Ber- talanffy, 1957).
A case in point is growth in mammals. From the viewpoint of metabolism, it may be said that, in a first and crude approximation, mammals appear to belong to our first type, where the surface rule of metabolism applies. Indeed, the surface rule was first stated by Rubner for mam- mals, and it was already mentioned that the clinically important case, the determination of basal metabolism in man, applies the surface rule in the somewhat modified form of the Dubois standard formula. Correspondingly, mammalian growth roughly follows the characteristic pattern of the first growth type discussed.
In detail, however, there are complications. Unfortunately and somewhat paradoxically, there are relatively few good data suitable for this type of analysis.
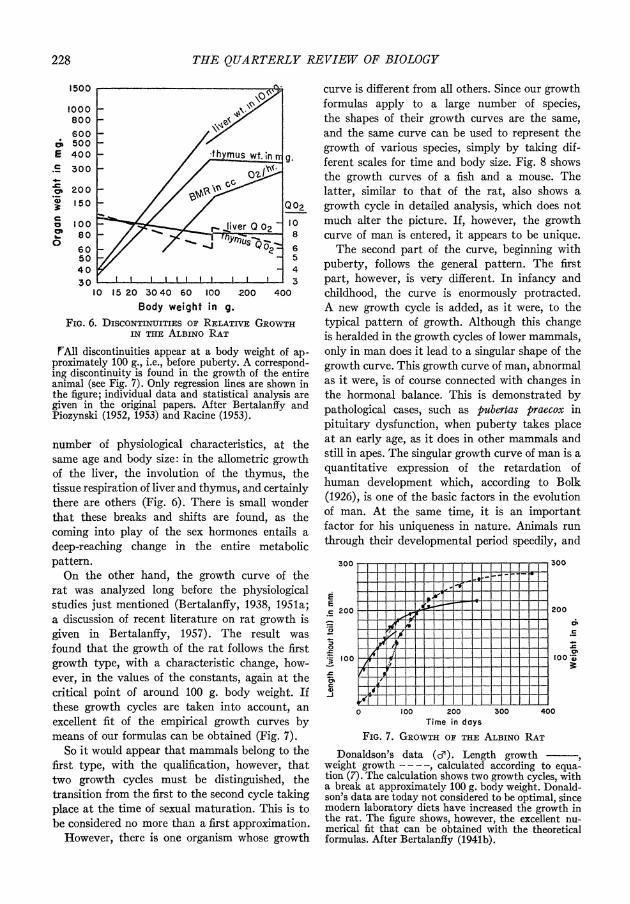
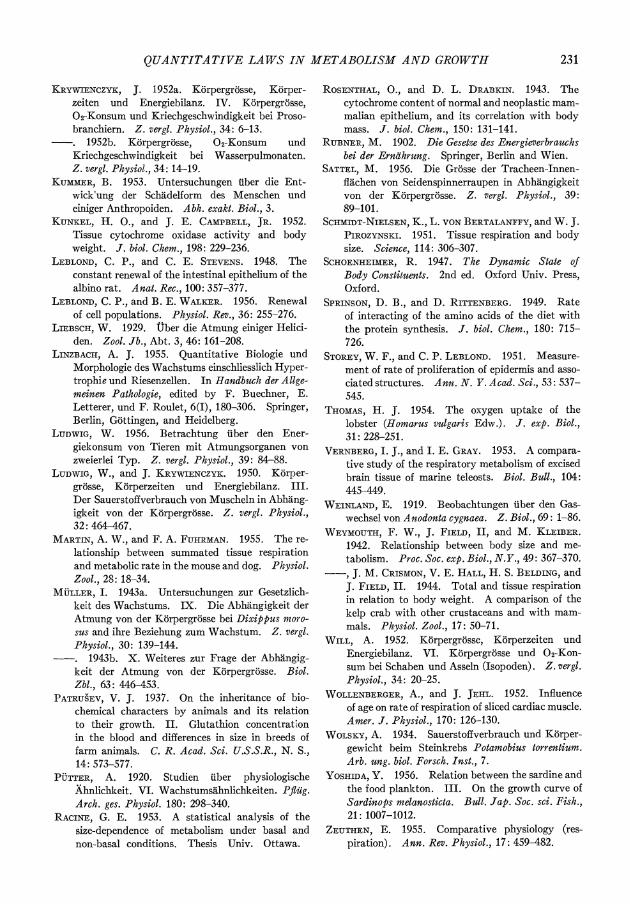
If the basal or resting metabolism in the rat (Fig. 6) is measured over the entire life span, it appears that as a crude overall approximation the surface rule obtains, that is, the overall allometric regression line has a slope of about 23. In more detail, however, there is a break in this line, such that the first part of the allometric line is steeper, and the second part much flatter, than would correspond to a slope of 23. The break takes place at a body weight of about 100 g., that is, pre- ceding sexual maturation. As we have found in other investigations (Bertalanify and Pirozynski, 1952, 1953), similar breaks appear in quite a
228 THE QUARTERLY REVIEW OF BIOLOGY
1500 _ .
1000 _ \P 800 _
600
E 400 *th YmuS Wt1n r g.
300
CP 100
8e0 ib. ver Qor2 n0 t is fn
50 5 4 0 4 30 11II 1II1II1 I I I
1 0 15 20 30 40 60 100 200 400~ Body weight i'n g.
FIG. 6. DISCONTINUITIES or RELATivE GRowTHI IN THlE ALBiNo RAT
!FAII discontinuities appear at a body weight of ap- proximately 100 g., i.e., before puberty. A correspond- ing discontinuity is found in the growth of the entire animal (see Fig. 7). Only regression lines are shown in the figure; individual data and statistical analysis are given in the original papers. After Bertalanffy and Piozynski (1952, 1953) and Racine (1953).
number of physiological characteristics, at the same age and body size: in the allometric growth of the liver, the involution of the thymus, the tissue respiration of liver and thymus, and certainly there are others (Fig. 6). There is small wonder that these breaks and shifts are found, as the coming into play of the sex hormones entails a deep-reaching change in the entire metabolic pattern.
On the other hand, the growth curve of the rat was analyzed long before the physiological studies just mentioned (Bertalanify, 1938, 1951a; a discussion of recent literature on rat growth is given in Bertalanffy, 1957). The result was found that the growth of the rat follows the first growth type, with a characteristic change, how- ever, in the values of the constants, again at the critical point of around 100 g. body weight. If these growth cycles are taken into account, an excellent fit of the empirical growth curves by means of our formulas can be obtained (Fig. 7).
So it would appear that mammals belong to the first type, with the qualification, however, that two growth cycles must be distinguished, the transition from the first to the second cycle taking place at the time of sexual maturation. This is to be considered no more than a first approximation.
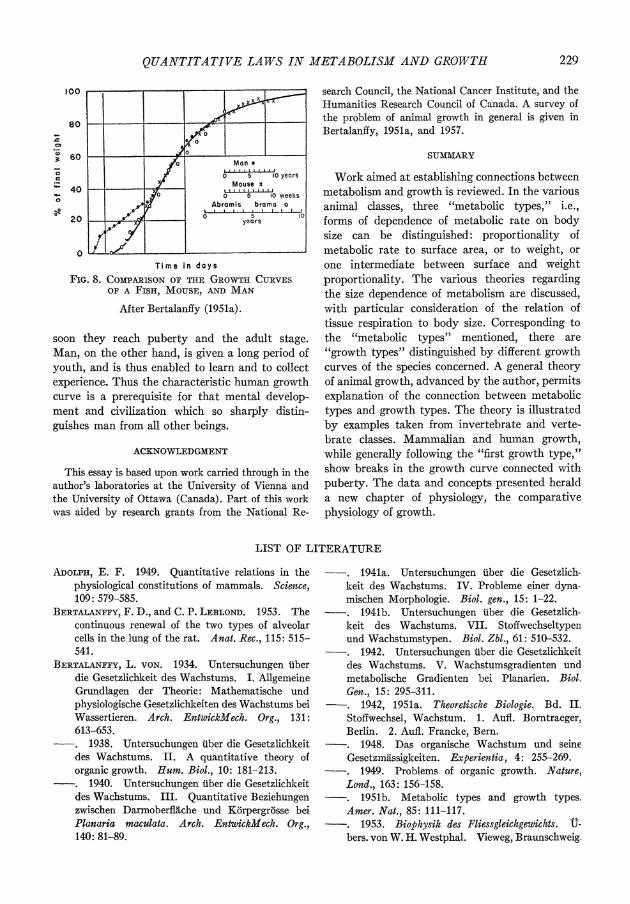
However, there is one organism whose growth
curve is different from all others. Since our growth formulas apply to a large number of species, the shapes of their growth curves are the same, and the same curve can be used to represent the growth of various species, simply by taking dif- ferent scales for time and body size. Fig. 8 shows the growth curves of a fish and a mouse. The latter, similar to that of the rat, also shows a growth cycle in detailed analysis, which does not much alter the picture. If, however, the growth curve of man is entered, it appears to be unique.
The second part of the curve, beginning with puberty, follows the general pattern. The first part, however, is very different. In infancy and childhood, the curve is enormously protracted. A new growth cycle is added, as it were, to the typical pattern of growth. Although this change is heralded in the growth cycles of lower mammals, only in man does it lead to a singular shape of the growth curve. This growth curve of man, abnormal as it were, is of course connected with changes in the hormonal balance. This is demonstrated by pathological cases, such as pubertas praecox in pituitary dysfunction, when puberty takes place at an early age, as it does in other mammals and still in apes. The singular growth curve of man is a quantitative expression of the retardation of human development which, according to Bolk (1926), is one of the basic factors in the evolution of man. At the same time, it is an important factor for his uniqueness in nature. Animals run through their developmental period speedily, and
300 _ _ _ _ _ _ _ _300
E _- - _- E c200 _ - _ - _ _ _ -200
R100 too _______
0 100 200 300 400 Time in days
FIG. 7. GROWTH OF THE ALBINO RAT
Donaldson's data (d1). Length growth weight growth ----, calculated according to equa- tion (7). The calculation shows two growth cycles, with a break at approximately 100 g. body weight. Donald- son's data are today not considered to be optimal, since modern laboratory diets have increased the growth in the rat. The figure shows, however, the excellent nu- merical fit that can be obtained with the theoretical formulas. After Bertalanffy (1941b).
QUANTITATIVE LAWS IN METABOLISM AND GROWTH 229
100
_80 - - z- -______ 80~~~~~~~~~~
- ________x ~ 0
3: (;0 _ _ < Man*
c o 0 5 lo years 40 _ 37 Mouse x
40 _ _ 5 o0 5 lO weeks Abramis brama o
20 0- ~~ ~~0 5 0
20 7V _____ years______
Time in days FIG. 8. CO1PARISON O0F THE GROWTH CURVES
OF A FISH, MOUSE, AND MAN
After Bertalanffy (1951a).
soon they reach puberty and the adult stage. Man, on the other hand, is given a long period of youth, and is thus enabled to learn and to collect experience. Thus the characteristic human growth curve is a prerequisite for that mental develop- ment and civilization which so sharply distin- guishes man from all other beings.
ACKNOWLEDGMENT
This essay is based upon work carried through in the author's laboratories at the University of Vienna and the University of Ottawa (Canada). Part of this work was aided by research grants from the National Re-
search Council, the National Cancer Institute, and the Humanities Research Council of Canada. A survey of the problem of animal growth in general is given in Bertalanffy, 1951a, and 1957.
SUMMARY
Work aimed at establishing connections between metabolism and growth is reviewed. In the various animal classes, three "metabolic types," i.e., forms of dependence of metabolic rate on body size can be distinguished: proportionality of metabolic rate to surface area, or to weight, or one intermediate between surface and weight proportionality. The various theories regarding the size dependence of metabolism are discussed, with particular consideration of the relation of tissue respiration to body size. Corresponding to the "metabolic types" mentioned, there are "growth types" distinguished by different growth curves of the species concerned. A general theory of animal growth, advanced by the author, permits explanation of the connection between metabolic types and growth types. The theory is illustrated by examples taken from invertebrate and verte- brate classes. Mammalian and human growth, while generally following the "first growth type," show breaks in the growth curve connected with puberty. The data and concepts presented herald a new chapter of physiology, the comparative physiology of growth.
LIST OF LITERATURE
ADOLPH, E. F. 1949. Quantitative relations in the physiological constitutions of mammals. Science, 109: 579-585.
BERTALANFFY, F. D., and C. P. LEBLOND. 1953. The continuous renewal of the two types of alveolar cells in the lung of the rat. Anat. Rec., 115: 515- 541.
BERTALANEBY, L. VON. 1934. Untersuchungen uber die Gesetzlichkeit des Wachstums. I. Allgemeine Grundlagen der Theorie: Mathematische und physiologische Gesetzlichkeiten des Wachstums bei Wassertieren. Arch. EntwickMech. Org., 131: 613-653.
-. 1938. Untersuchungen uber die Gesetzlichkeit des Wachstums. II. A quantitative theory of organic growth. Hum. Biol., 10: 181-213. . 1940. Untersuchungen tiber die Gesetzlichkeit des Wachstums. III. Quantitative Beziehungen zwischen Darmoberflache und KBrpergrosse bei Planaria maculata. Arch. EntwickMeck. Org., 140: 81-89.
. 1941a. Untersuchungen uber die Gesetzlich- keit des Wachstums. IV. Probleme einer dyna- mischen Morphologie. Biol. gen., 15: 1-22. . 1941b. Untersuchungen iiber die Gesetzlich- keit des Wachstums. VII. Stoffwechseltypen und Wachstumstypen. Biol. Zbl., 61: 510-532. . 1942. Untersuchungen uber die Gesetzlichkeit des Wachstums. V. Wachstumsgradienten und metabolische Gradienten bei Planarien. Biol. Gen., 15: 295-311. . 1942, 1951a. Theoretische Biologie. Bd. IL Stoffwechsel, Wachstum. 1. Aufl. Borntraeger, Berlin. 2. Aufl. Francke, Bern. . 1948. Das organische Wachstum und seine Gesetzmassigkeiten. Experientia, 4: 255-269. . 1949. Problems of organic growth. Nature, Lond., 163: 156-158. . 1951b. Metabolic types and growth types. Amer. Nat., 85: 111-117. . 1953. Biophysik des Fliessgleichgewiclsts. U- bers. von W. H. Westphal. Vieweg, Braunschweig.
230 THE QUARTERLY REVIEW OF BIOLOGY
BERTALANFFY, L. VON. 1957. Wackstum. Kuiken- thal's Handbuch der Zoologie. Vol. VIII 4 (6). de Gruyter, Berlin.
- , and R. R. ESTWICK. 1953. Tissue respiration of musculature in relation to body size. Amer. J. Physiol., 173: 58-60. . 1954. Tissue respiration in experimental and congenital pituitary deficiency. Amer. J. Physiol., 177: 16-18.
, 0. HOFFMANN-OSTENIOF, and 0. SCIRvEIER. 1946. A quantitative study of the toxic action of quinones on Planaria gonocephala. Nature, Lond. 158: 948-951. , and J. KRYWIENCZYK. 1953. The surface rule in crustaceans. Amer. Nat., 87: 107-110. , and A. MACFADYEN. 1954. Table 137: Correla- tion of oxygen consumption with body size: Inver- tebrates. In Standard values in nutrition and metabolism, ed. by E. C. Albritton. Saunders, Philadelphia and London.
-, and I. MPLLER. 1943. Untersuchungen tiber die Gesetzlichkeit des Wachstums. VIII. Die Abhangigkeit des Stoffwechsels von der Kh5rper- gr6sse und der Zusammenhang von Stoffwechsel- typen und Wachstumstypen. Riv. Biol., 35: 48- 95.
--, and W. J. PIROZYNSKI. 1951. Tissue respira- tion and body size. Science, 113: 599-600.
, and . 1952. Ontogenetic and evolutionary allometry. Evolution, 6: 387-392.
--, and - . 1953. Tissue respiration, growth and basal metabolism. Biol. Bull., 105: 240-256.
BEVERTON, R. J. H. 1954. Notes on the use of theo- retical models in the study of the dynamics of ex- ploited fish populations. Misc. Contrib. 2, U. S. Fishery Laboratory, Beaufort, N. C.
--, and S. J. HOLT. 1957. On the dynamics of ex- ploited fish populations. Fishery Investigations, Ser. II, vol. XIX. Her Majesty's Stationery Office, London.
BOLK, L. 1926. Das Problem der Menschwerdung. Fischer, Jena.
BRAND, TH. VON, M. 0. NOLAN, and E. R. MANN. 1948. Observations on the respiration of Austral- orbis glabratus and some other aquatic snails. Biol. Bull., 95: 199-213.
BRODY, S. 1945. Bioenergetics and growth. Rein- hold, New York.
CRANDALL, R. R., and A. H. SMITH. 1952. Tissue metabolism in growing birds. Proc. Soc. exp. Biol., 79: 345-346.
DONALDSON, H. H. 1924. The rat. Mem. Wistar Inst. Anat., 6, 2nd ed. Philadelphia.
DUSPIVA, F. 1955. Biochemie des Wachstums und der Differenzierung. In Handbuch der Allgemeinen Pathologie, ed. by F. Buechner, E. Letterer, and F. Roulet, 6(I), 307-382. Springer, Berlin, Goettingen, and Heidelberg.
ELLENBY, C. 1951. Body size in relation to oxygen consumption and pleopod beat in Ligia oceanica L. J. exp. Biol. 28: 492-507.
FRIED, G. H., and S. R. TIPTON. 1953. Comparison of respiratory enzyme levels in tissues of mammals of different sizes. Proc. Soc. exp. Biol., 82: 531- 532.
FRSSER, H., and F. KRUGER. 1951. Vergleichende Versuche zur Atmungsphysiologie von Planorbis corneus und Limnaea stagnalis (Gastropoda Pul- monata). Z. vergl. Physiol., 33: 14-52.
GREGORY, P. W., and H. Goss. 1933. Glutathion concentration and hereditary body size. J. exp. Zool., 66: 155-173.
HARMS, J. 1955. Biologie des Wachstums. In Handbuch der Allgemeinen Patkologie, ed. by F. Buechner, E. Letterer, and F. Roulet, 6(I), 139- 179. Springer, Berlin, Gottingen, and Heidelberg.
HOMMA, K. 1953. Effects of age on the metabolism of testes. (Japan.) Nihon Chikusan Gakkai, 24: 49.
HUXLEY, J. 1932. Problems of relative growtk. Methuen, London.
JAN?6AkfK, A. 1948. Contribution to the knowledge of breathing of Cladocera Daphnia pulex. (Czech, English summary). Publ. Fac. Sci. Univ. Masaryk, Ser. M 1, No. 305.
JOST, H. 1928. Vergleichende Physiologie des Stoff- wechsels. In Handb. norm. pathol. Physiol., 5: 377-466.
KALMuS, H. 1930. Untersuchungen uiber die Atmung des Flusskrebses Potamobius astacus. Z. vergl. Physiol., 12: 725-759.
KIENLE, M.-L., and W. LuDWIG. 1956. Die Bezie- hung zwischen Korpergrosse und Sauerstoffkon- sum bei Landpulmonaten. Z. vergl. Pltysiol., 39: 102-118.
KITTEL, A. 1941. K6rpergr6sse, Kt5rperzeiten und Energiebilanz II. Der Sauerstoffverbrauch der Insekten in Abhangigkeit von der K6rpergr6sse. Z. vergl. Physiol., 28: 533-562.
KLEIBER, M. 1941. Body size and metabolism of liver slices in vitro. Proc. Soc. exp. Biol., 48: 419-422.
-. 1947. Body size and metabolic rate. Physiol. Rev., 27: 511-541.
KRAMER, G. 1934. Der Ruheumsatz von Eidechsen und seine quantitative Beziehung zur Individuen- gr6sse. Z. vergl. Physiol., 20: 600-616.
KREBS, A. H. 1950. Body size and tissue respiration. Biochim. biophys. Acta, 4: 249-269.
KRU&GER, F. 1940. Die Beziehung des Sauerstoffver- brauches zur K6rperoberflbche beim Schweine- spulwurm (Ascaris lumbricoides). Z. wiss. Zool., 152: 547-570. . 1952. tjber die Beziehung des Sauerstoffver- brauches zum Gewicht bei Eisenia foetida (Sav.) (Annelida Oligochaeta). Z. vergl. Physiol., 34: 1-5.
QUANTITATIVE LAWS IN METABOLISM AND GROWTH 231
KRYWIENCZYK, J. 1952a. K6rpergrosse, K6rper- zeiten und Energiebilanz. IV. Korpergrosse, 02-Konsum und Kriechgeschwindigkeit bei Proso- branchiern. Z. vergl. Physiol., 34: 6-13. . 1952b. Korpergr6sse, 02-Konsum und Kriechgeschwindigkeit bei Wasserpulmonaten. Z. vergl. Physiol., 34: 14-19.
KUMMER, B. 1953. Untersuchungen uber die Ent- wick'ung der Schadelform des Menschen und einiger Anthropoiden. Abh. exakt. Biol., 3.
KUNKEL, H. O., and J. E. CAMTBELL, JR. 1952. Tissue cytochrome oxidase activity and body weight. J. biol. Chem., 198: 229-236.
LEBLOND, C. P., and C. E. STEVENS. 1948. The constant renewal of the intestinal epithelium of the albino rat. Anat. Rec., 100: 357-377.
LEBLOND, C. P., and B. E. WALKER. 1956. Renewal of cell populations. Physiol. Rev., 36: 255-276.
LIEBSCH, W. 1929. Uber die Atmung einiger Helici- den. Zool. Jb., Abt. 3, 46: 161-208.
LINZBACH, A. J. 1955. Quantitative Biologie und Morphologie des Wachstums einschliesslich Hyper- trophie und Riesenzellen. In Handbuclz der A,lge- meinen Pathologie, edited by F. Buechner, E. Letterer, und F. Roulet, 6(I), 180-306. Springer, Berlin, Gottingen, and Heidelberg.
LUDWIG, W. 1956. Betrachtung uber den Ener- giekonsum von Tieren mit Atmungsorganen von zweierlei Typ. Z. vergl. Physiol., 39: 84-88.
LUDWIG, W., and J. KRYWIENCZYK. 1950. Korper- grosse, Korperzeiten und Energiebilanz. III. Der Sauerstoffverbrauch von Muscheln in Abhang- igkeit von der K6rpergr6sse. Z. vergl. Physiol., 32: 464-467.
MARTIN, A. WV., and F. A. FUHRMAN. 1955. The re- lationship between summated tissue respiration and metabolic rate in the mouse and dog. Physiol. Zool., 28: 18-34.
MULLER, I. 1943a. Untersuchungen zur Gesetzlich- keit des Wachstums. IX. Die Abhangigkeit der Atmung von der Korpergrosse bei Dixippus moro- sus and ihre Beziehung zum Wachstum. Z. vergl. Physiol., 30: 139-144.
1943b. X. Weiteres zur Frage der Abhangig- keit der Atmung von der K6rpergrosse. Biol. Zbl., 63: 446453.
PATRUSEV, V. J. 1937. On the inheritance of bio- chemical characters by animals and its relation to their growth. II. Glutathion concentration in the blood and differences in size in breeds of farm animals. C. R. Acad. Sci. U.S.S.R., N. S., 14: 573-577.
PUTTER, A. 1920. Studien Uber physiologische Ahnlichkeit. VI. Wachstumsahnlichkeiten. Pftig. Arch. ges. Physiol. 180: 298-340.
RACINE, G. E. 1953. A statistical analysis of the size-dependence of metabolism under basal and non-basal conditions. Thesis Univ. Ottawa.
ROSENTHAL, O., and D. L. DRABKIN. 1943. The cytochrome content of normal and neoplastic mam- malian epithelium, and its correlation with body mass. J. biol. Chem., 150: 131-141.
RUBNER, M. 1902. Die Gesetze des Energiever brauchs bei der Ernahrung. Springer, Berlin and Wien.
SATTEL, M. 1956. Die Grosse der Tracheen-Innen- flachen von Seidenspinnerraupen in Abhangigkeit von der Korpergr6sse. Z. vergl. Physiol., 39: 89-101.
SCIMIDT-NIELSEN, K., L. VON BERTALANFFY, and W. J. PIROZYNSKI. 1951. Tissue respiration and body size. Science, 114: 306-307.
SCHOENHEIMER, R. 1947. The Dynamic State of Body Constituents. 2nd ed. Oxford Univ. Press, Oxford.
SPRINSON, D. B., and D. RITTENBERG. 1949. Rate of interacting of the amino acids of the diet with the protein synthesis. J. biol. Chem., 180: 715- 726.
STOREY, W. F., and C. P. LEBLOND. 1951. Measure- ment of rate of proliferation of epidermis and asso- ciated structures. Ann. N. Y. Acad. Sci., 53: 537- 545.
THOMAS, H. J. 1954. The oxygen uptake of the lobster (Homarus vulgaris Edw.). J. exp. Biol., 31: 228-251.
VERNBERG, I. J., and I. E. GRAY. 1953. A compara- tive study of the respiratory metabolism of excised brain tissue of marine teleosts. Biol. Bull., 104: 445-449.
WEINLAND, E. 1919. Beobachtungen ilber den Gas- wechsel von Anodonta cygnaea. Z. Biol., 69: 1-86.
WEYMOUTH, F. W., J. FIELD, II, and M. KLEIBER.
1942. Relationship between body size and me- tabolism. Proc. Soc. exp. Biol., N.Y., 49: 367-370. , J. M. CRISMON, V. E. HALL, H. S. BELDING, and J. FIELD, II. 1944. Total and tissue respiration in relation to body weight. A comparison of the kelp crab with other crustaceans and with mam- mals. Physiol. Zool., 17: 50-71.
WILL, A. 1952. K6rpergr6sse, K6rperzeiten und Energiebilanz. VI. K6rpergrosse und 02-Kon- sum bei Schaben und Asseln (Isopoden). Z. vergl. Physiol., 34: 20-25.
WOLLENBERGER, A., and J. JEHL. 1952. Influence of age on rate of respiration of sliced cardiac muscle. Amer. J. Physiol., 170: 126-130.
WOLSKY, A. 1934. Sauerstoffverbrauch und Korper- gewicht beim Steinkrebs Potamobius torrentium. Arb. ung. biol. Forsch. Inst., 7.
YOSHIDA, Y. 1956. Relation between the sardine and the food plankton. III. On the growth curve of Sardinops melanosticta. Bull. Jap. Soc. sci. Fish., 21: 1007-1012.
ZEUTHEN, E. 1955. Comparative physiology (res- piration). Ann. Rev. Physiol., 17: 459-482.