Embed Size (px)
Citation preview
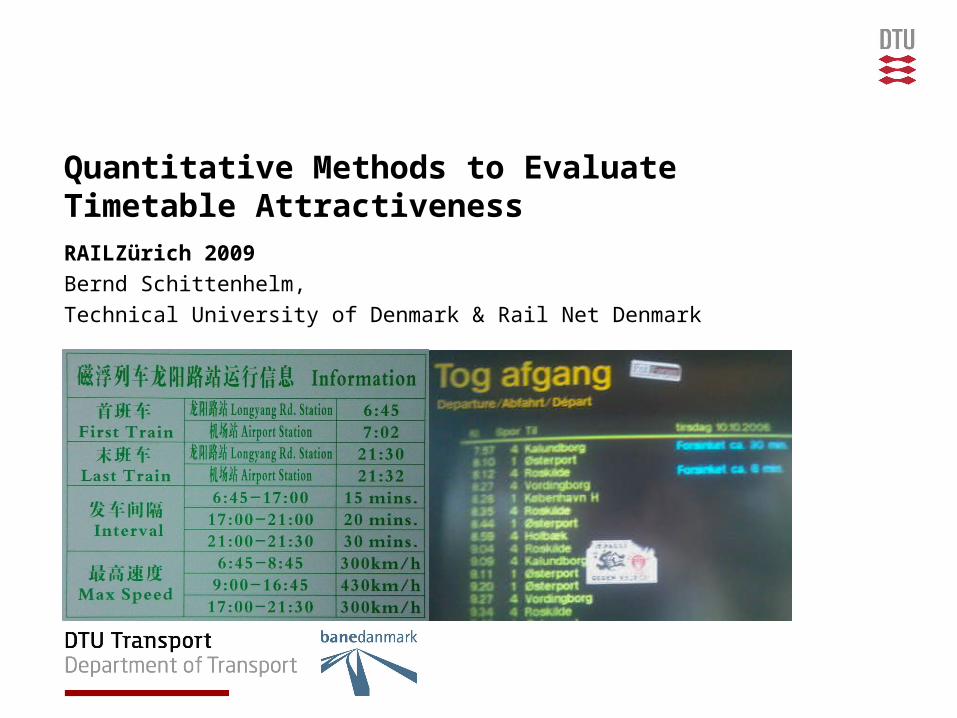
Quantitative Methods to Evaluate Timetable AttractivenessRAILZürich 2009Bernd Schittenhelm,Technical University of Denmark & Rail Net Denmark
12/02/2009Quantitative Methods to Evaluate Timetable Attractiveness
2 DTU Transport, Technical University of Denmark
Motivation
• Development of a multi-criteria timetable attractiveness objective function - e.g. to use for timetable generation
• Quantitative methods for fast evaluation of and easy comparison of candidate timetables
12/02/2009Quantitative Methods to Evaluate Timetable Attractiveness
3 DTU Transport, Technical University of Denmark
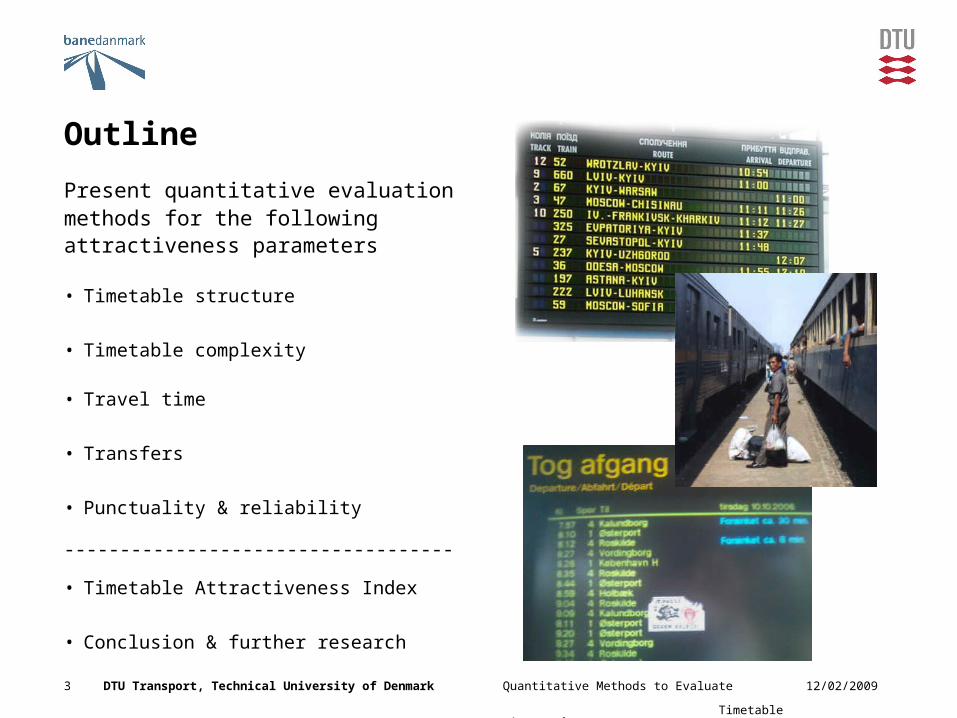
Outline
Present quantitative evaluationmethods for the followingattractiveness parameters
• Timetable structure
• Timetable complexity
• Travel time
• Transfers
• Punctuality & reliability
-----------------------------------
• Timetable Attractiveness Index
• Conclusion & further research
12/02/2009Quantitative Methods to Evaluate Timetable Attractiveness
4 DTU Transport, Technical University of Denmark
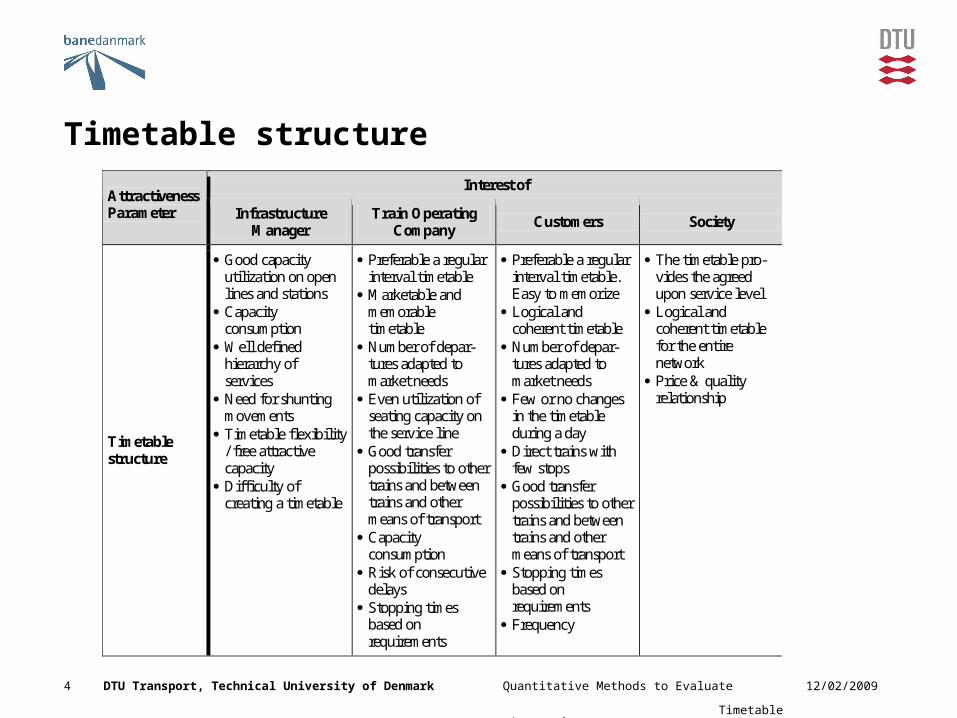
Timetable structureInterest of
Attractiveness Parameter Infrastructure
Manager Train Operating
Company Customers Society
Timetable structure
Good capacity utilization on open lines and stations
Capacity consumption
Well defined hierarchy of services
Need for shunting movements
Timetable flexibility / free attractive capacity
Difficulty of creating a timetable
Preferable a regular interval timetable
Marketable and memorable timetable
Number of depar-tures adapted to market needs
Even utilization of seating capacity on the service line
Good transfer possibilities to other trains and between trains and other means of transport
Capacity consumption
Risk of consecutive delays
Stopping times based on requirements
Preferable a regular interval timetable. Easy to memorize
Logical and coherent timetable
Number of depar-tures adapted to market needs
Few or no changes in the timetable during a day
Direct trains with few stops
Good transfer possibilities to other trains and between trains and other means of transport
Stopping times based on requirements
Frequency
The timetable pro-vides the agreed upon service level
Logical and coherent timetable for the entire network
Price & quality relationship
12/02/2009Quantitative Methods to Evaluate Timetable Attractiveness
5 DTU Transport, Technical University of Denmark
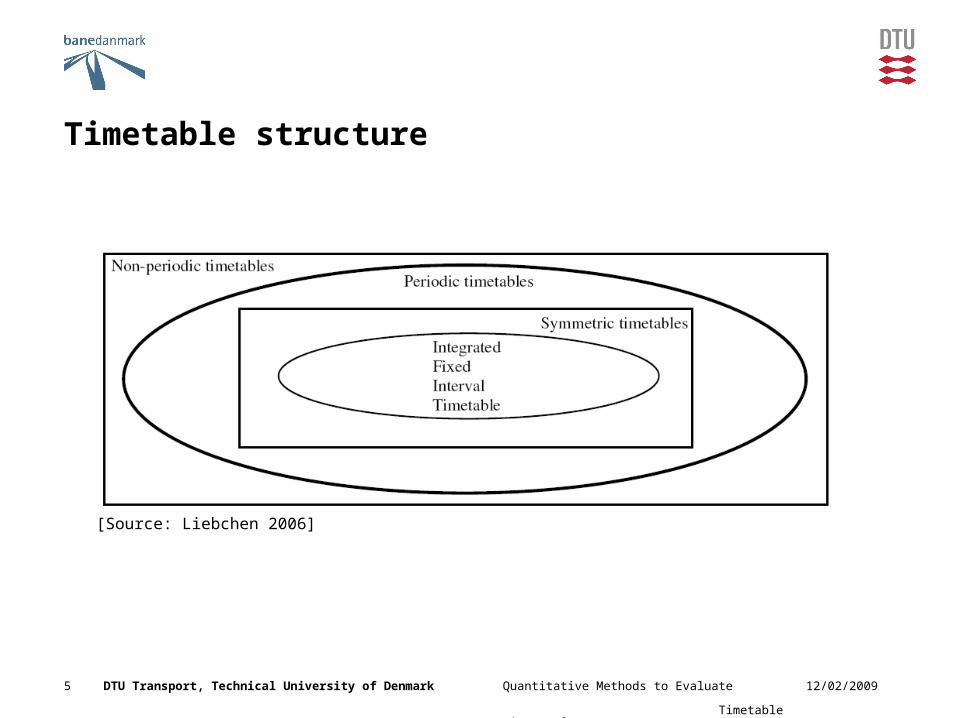
Timetable structure
[Source: Liebchen 2006]
12/02/2009Quantitative Methods to Evaluate Timetable Attractiveness
6 DTU Transport, Technical University of Denmark
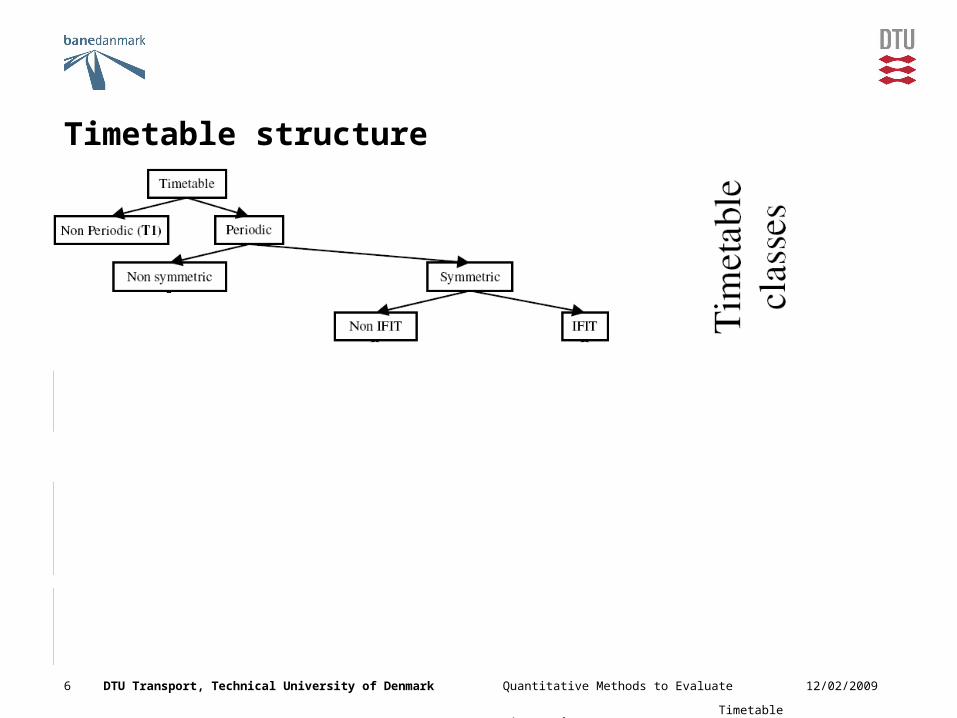
Timetable structure
12/02/2009Quantitative Methods to Evaluate Timetable Attractiveness
7 DTU Transport, Technical University of Denmark
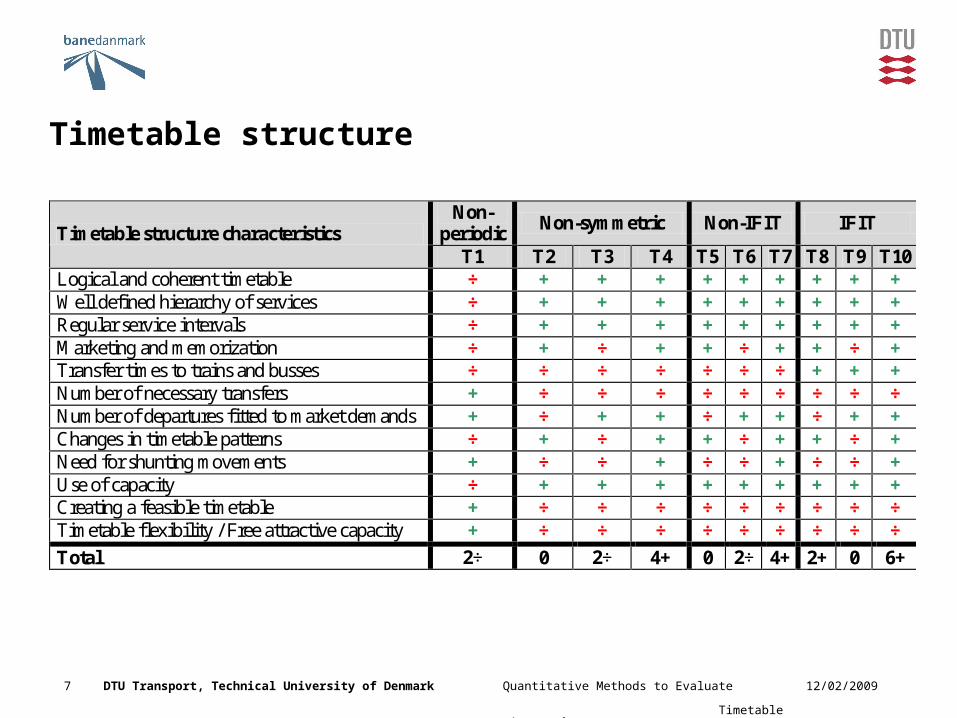
Timetable structure
Non- periodic
Non-symmetric Non-IFIT IFIT Timetable structure characteristics
T1 T2 T3 T4 T5 T6 T7 T8 T9 T10 Logical and coherent timetable ÷ + + + + + + + + + Well defined hierarchy of services ÷ + + + + + + + + + Regular service intervals ÷ + + + + + + + + + Marketing and memorization ÷ + ÷ + + ÷ + + ÷ + Transfer times to trains and busses ÷ ÷ ÷ ÷ ÷ ÷ ÷ + + + Number of necessary transfers + ÷ ÷ ÷ ÷ ÷ ÷ ÷ ÷ ÷ Number of departures fitted to market demands + ÷ + + ÷ + + ÷ + + Changes in timetable patterns ÷ + ÷ + + ÷ + + ÷ + Need for shunting movements + ÷ ÷ + ÷ ÷ + ÷ ÷ + Use of capacity ÷ + + + + + + + + + Creating a feasible timetable + ÷ ÷ ÷ ÷ ÷ ÷ ÷ ÷ ÷ Timetable flexibility / Free attractive capacity + ÷ ÷ ÷ ÷ ÷ ÷ ÷ ÷ ÷
Total 2÷ 0 2÷ 4+ 0 2÷ 4+ 2+ 0 6+
12/02/2009Quantitative Methods to Evaluate Timetable Attractiveness
8 DTU Transport, Technical University of Denmark
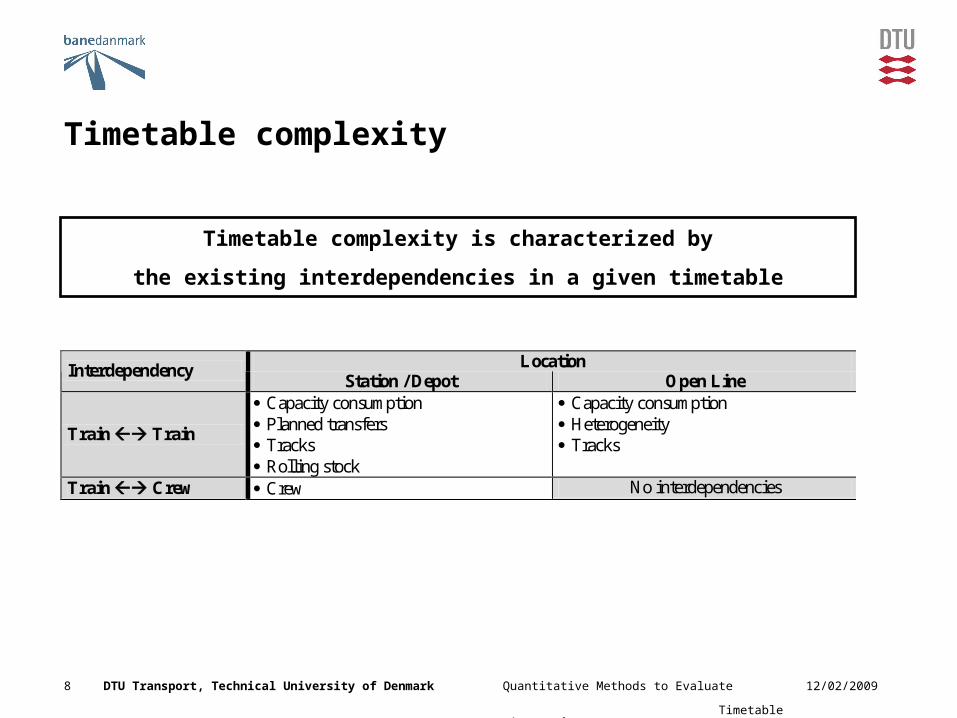
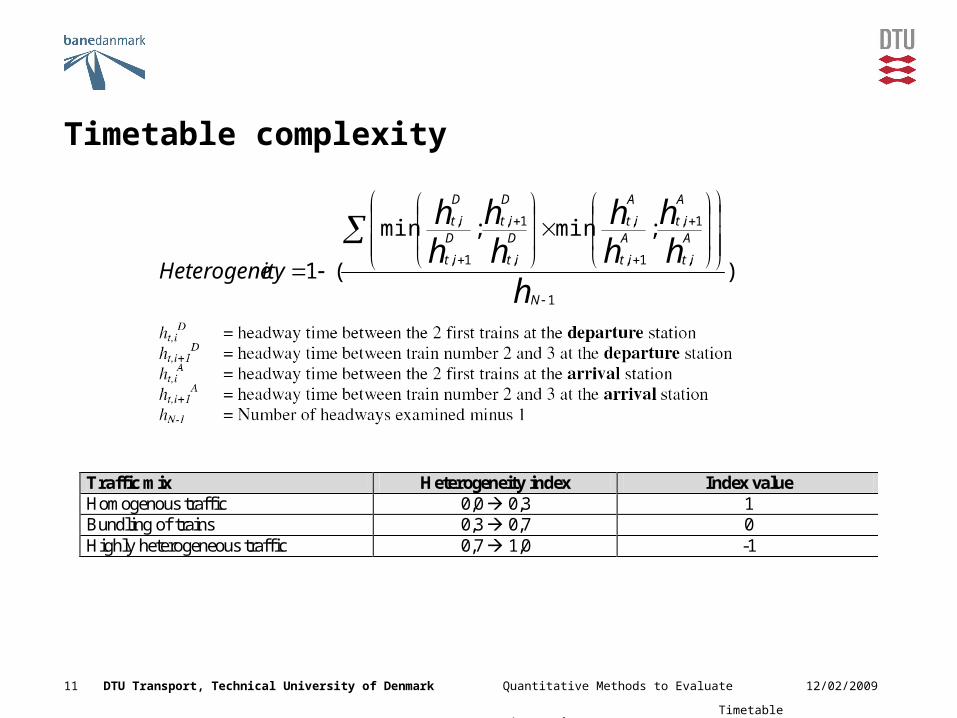
Timetable complexity
Timetable complexity is characterized by
the existing interdependencies in a given timetable
Location Interdependency Station / Depot Open Line
Train Train
Capacity consumption Planned transfers Tracks Rolling stock
Capacity consumption Heterogeneity Tracks
Train Crew Crew No interdependencies
12/02/2009Quantitative Methods to Evaluate Timetable Attractiveness
9 DTU Transport, Technical University of Denmark
Timetable complexity
Interest of Attractiveness Parameter Infrastructure
Manager Train Operating
Company Customers Society
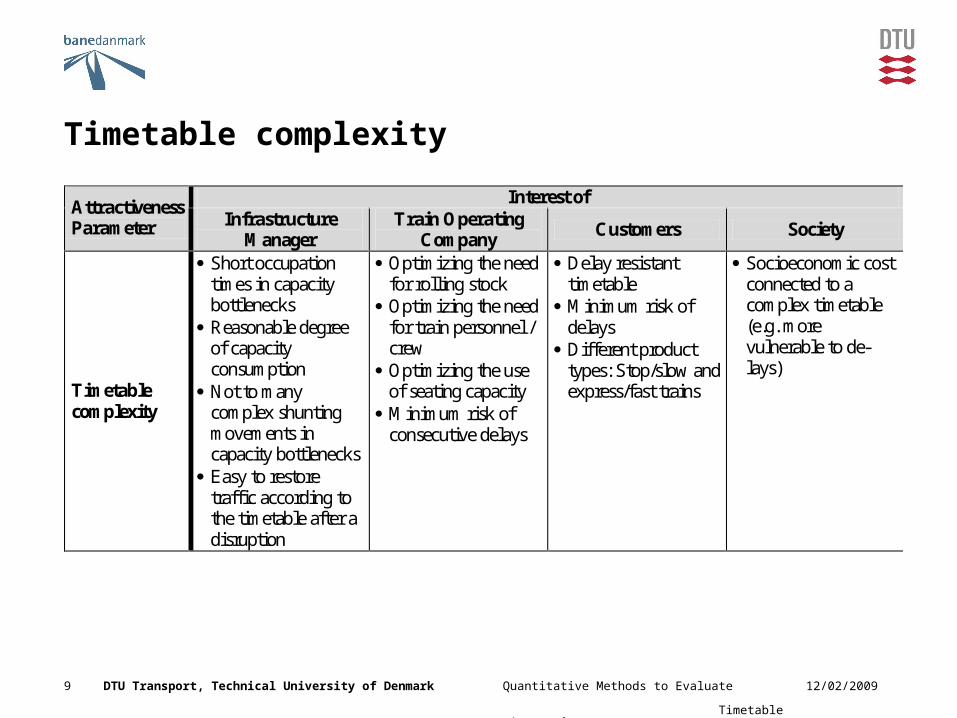
Timetable complexity
Short occupation times in capacity bottlenecks
Reasonable degree of capacity consumption
Not to many complex shunting movements in capacity bottlenecks
Easy to restore traffic according to the timetable after a disruption
Optimizing the need for rolling stock
Optimizing the need for train personnel / crew
Optimizing the use of seating capacity
Minimum risk of consecutive delays
Delay resistant timetable
Minimum risk of delays
Different product types: Stop/slow and express/fast trains
Socioeconomic cost connected to a complex timetable (e.g. more vulnerable to de-lays)
12/02/2009Quantitative Methods to Evaluate Timetable Attractiveness
10 DTU Transport, Technical University of Denmark
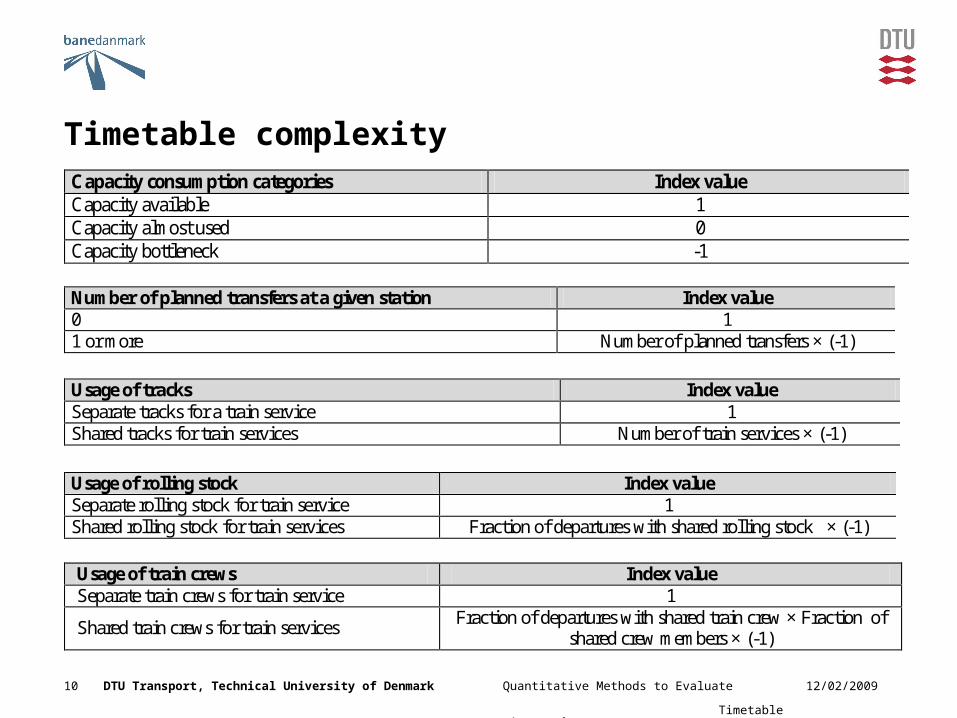
Timetable complexityCapacity consumption categories Index value Capacity available 1 Capacity almost used 0 Capacity bottleneck -1
Number of planned transfers at a given station Index value 0 1 1 or more Number of planned transfers × (-1)
Usage of tracks Index value Separate tracks for a train service 1 Shared tracks for train services Number of train services × (-1)
Usage of rolling stock Index value Separate rolling stock for train service 1 Shared rolling stock for train services Fraction of departures with shared rolling stock × (-1)
Usage of train crews Index value Separate train crews for train service 1
Shared train crews for train services Fraction of departures with shared train crew × Fraction of
shared crew members × (-1)
12/02/2009Quantitative Methods to Evaluate Timetable Attractiveness
11 DTU Transport, Technical University of Denmark
Timetable complexity
)
;min;min
(11
,
1,
1,
,
,
1,
1,
,
hhh
hh
hh
hh
N
A
it
A
itA
it
A
itD
it
D
itD
it
D
it
ityHeterogene
Traffic mix Heterogeneity index Index value Homogenous traffic 0,0 0,3 1 Bundling of trains 0,3 0,7 0 Highly heterogeneous traffic 0,7 1,0 -1
12/02/2009Quantitative Methods to Evaluate Timetable Attractiveness
12 DTU Transport, Technical University of Denmark
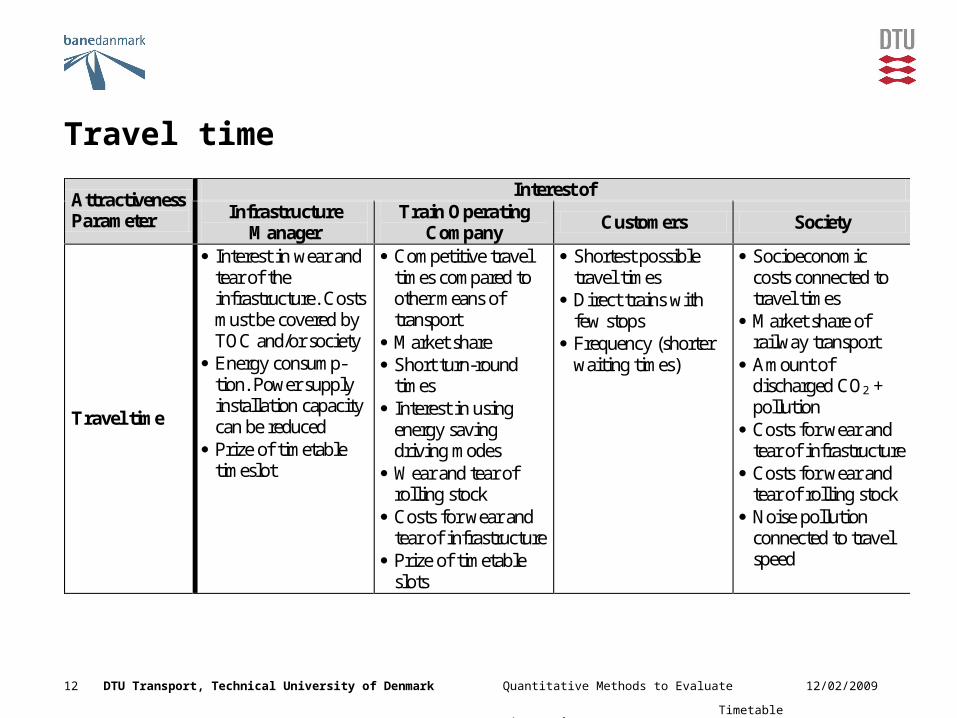
Travel time
Interest of Attractiveness Parameter Infrastructure
Manager Train Operating
Company Customers Society
Travel time
Interest in wear and tear of the infrastructure. Costs must be covered by TOC and/or society
Energy consump-tion. Power supply installation capacity can be reduced
Prize of timetable timeslot
Competitive travel times compared to other means of transport
Market share Short turn-round
times Interest in using
energy saving driving modes
Wear and tear of rolling stock
Costs for wear and tear of infrastructure
Prize of timetable slots
Shortest possible travel times
Direct trains with few stops
Frequency (shorter waiting times)
Socioeconomic costs connected to travel times
Market share of railway transport
Amount of discharged CO2 + pollution
Costs for wear and tear of infrastructure
Costs for wear and tear of rolling stock
Noise pollution connected to travel speed
12/02/2009Quantitative Methods to Evaluate Timetable Attractiveness
13 DTU Transport, Technical University of Denmark
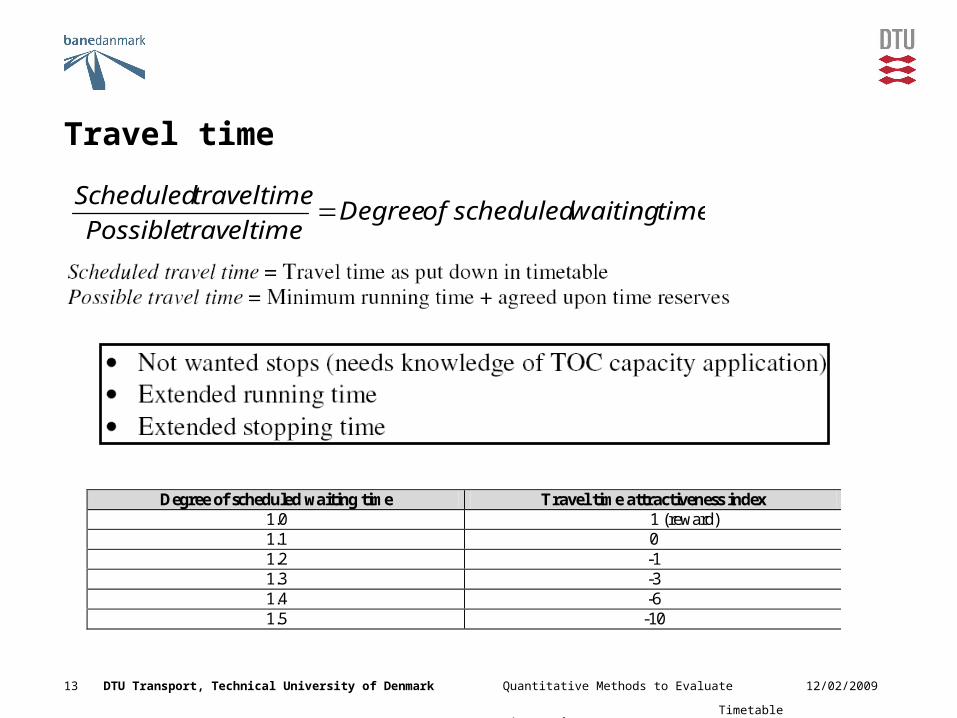
Travel time
timewaitingscheduledofDegreetimetravelPossible
timetravelScheduled
Degree of scheduled waiting time Travel time attractiveness index 1.0 1 (reward) 1.1 0 1.2 -1 1.3 -3 1.4 -6 1.5 -10
12/02/2009Quantitative Methods to Evaluate Timetable Attractiveness
14 DTU Transport, Technical University of Denmark
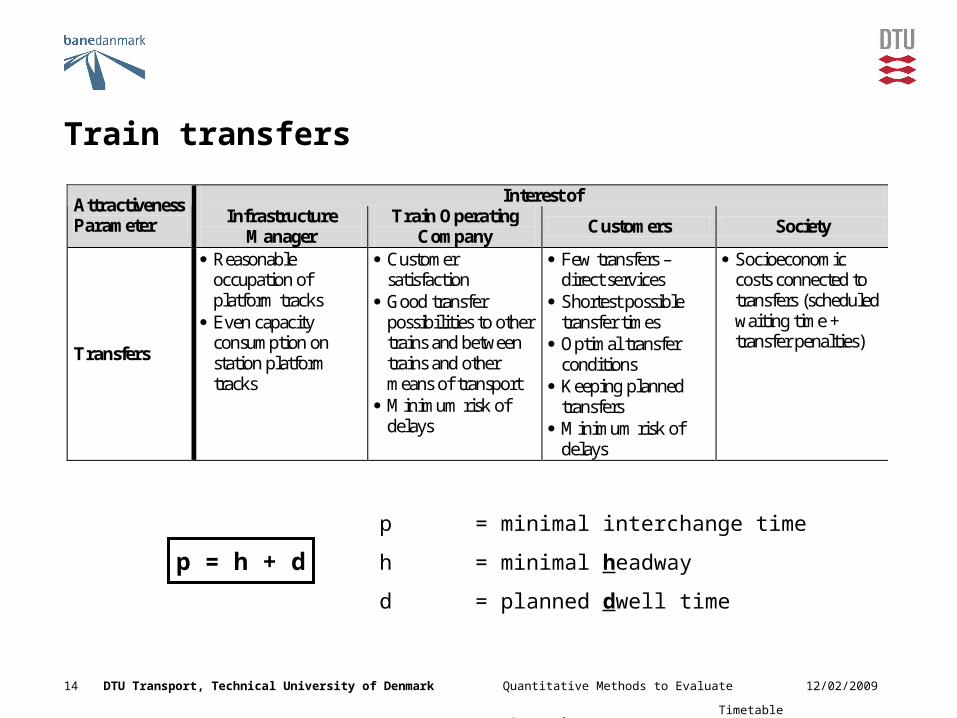
Train transfers
Interest of Attractiveness Parameter Infrastructure
Manager Train Operating
Company Customers Society
Transfers
Reasonable occupation of platform tracks
Even capacity consumption on station platform tracks
Customer satisfaction
Good transfer possibilities to other trains and between trains and other means of transport
Minimum risk of delays
Few transfers – direct services
Shortest possible transfer times
Optimal transfer conditions
Keeping planned transfers
Minimum risk of delays
Socioeconomic costs connected to transfers (scheduled waiting time + transfer penalties)
p = h + d
p = minimal interchange time
h = minimal headway
d = planned dwell time
12/02/2009Quantitative Methods to Evaluate Timetable Attractiveness
15 DTU Transport, Technical University of Denmark
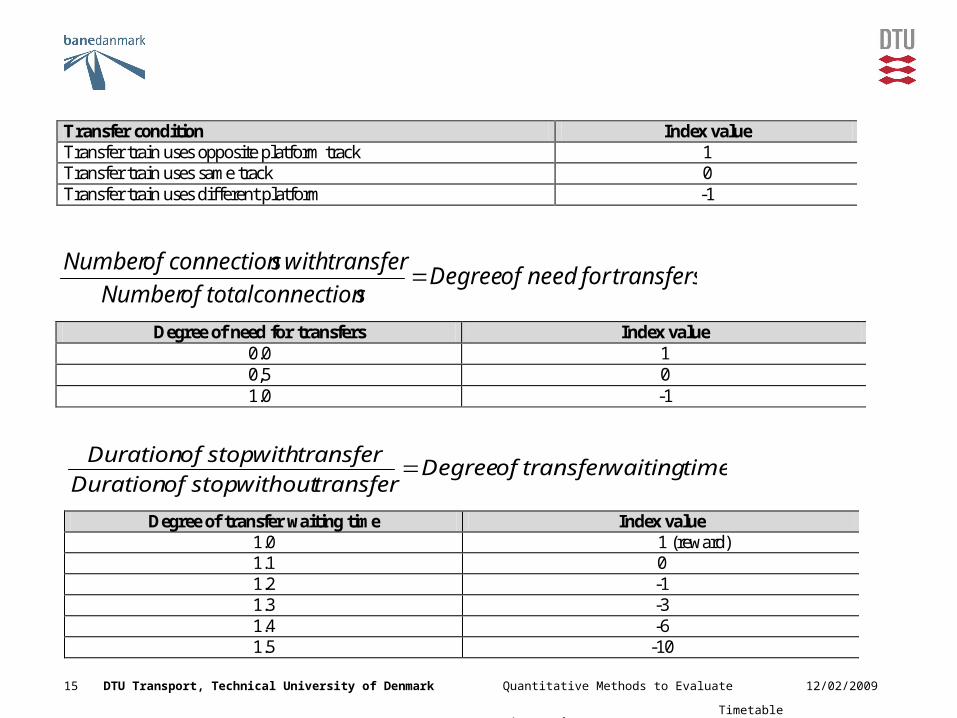
transfersforneedofDegreesconnectiontotalofNumber
transferwithsconnectionofNumber
Degree of need for transfers Index value 0.0 1 0,5 0 1.0 -1
timewaitingtransferofDegreetransferwithoutstopofDuration
transferwithstopofDuration
Degree of transfer waiting time Index value 1.0 1 (reward) 1.1 0 1.2 -1 1.3 -3 1.4 -6 1.5 -10
Transfer condition Index value Transfer train uses opposite platform track 1 Transfer train uses same track 0 Transfer train uses different platform -1
12/02/2009Quantitative Methods to Evaluate Timetable Attractiveness
16 DTU Transport, Technical University of Denmark
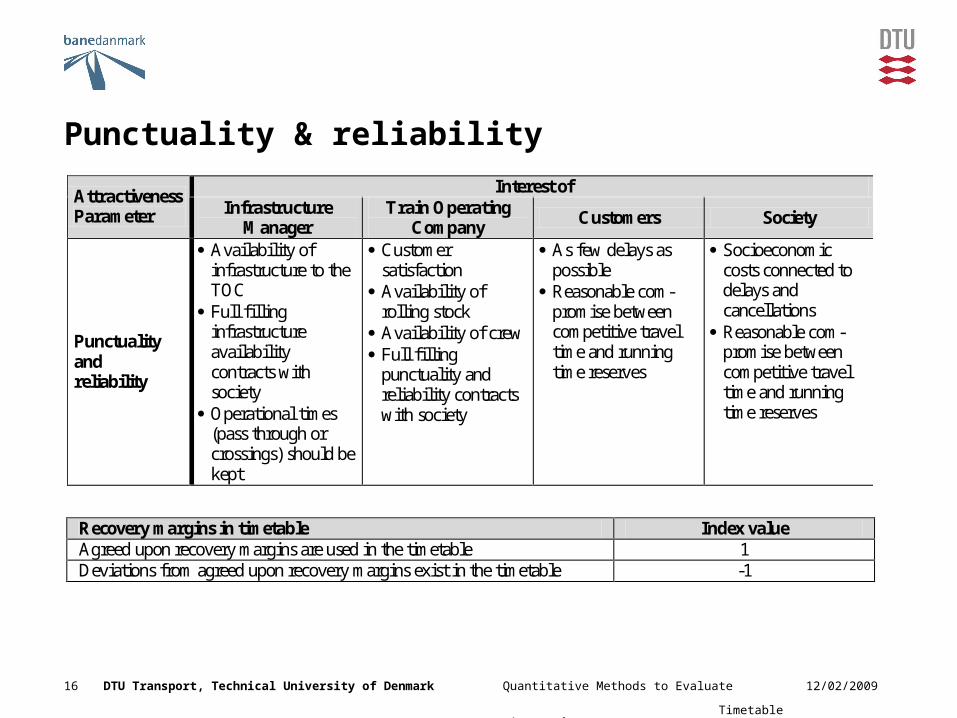
Punctuality & reliability
Interest of Attractiveness Parameter Infrastructure
Manager Train Operating
Company Customers Society
Punctuality and reliability
Availability of infrastructure to the TOC
Full filling infrastructure availability contracts with society
Operational times (pass through or crossings) should be kept
Customer satisfaction
Availability of rolling stock
Availability of crew Full filling
punctuality and reliability contracts with society
As few delays as possible
Reasonable com-promise between competitive travel time and running time reserves
Socioeconomic costs connected to delays and cancellations
Reasonable com-promise between competitive travel time and running time reserves
Recovery margins in timetable Index value Agreed upon recovery margins are used in the timetable 1 Deviations from agreed upon recovery margins exist in the timetable -1
12/02/2009Quantitative Methods to Evaluate Timetable Attractiveness
17 DTU Transport, Technical University of Denmark
Tim
eta
ble
Attra
ctiv
en
ess In
dex
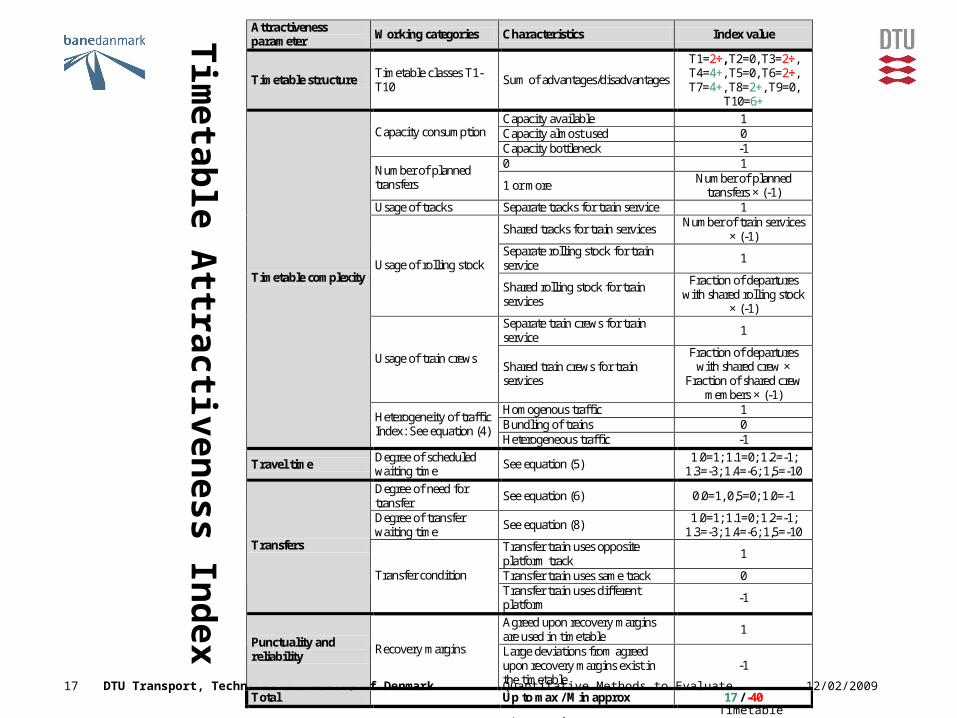
Attractiveness parameter
Working categories Characteristics Index value
Timetable structure Timetable classes T1-T10
Sum of advantages/disadvantages
T1=2÷, T2=0, T3=2÷, T4=4+, T5=0, T6=2÷, T7=4+, T8=2+, T9=0,
T10=6+
Capacity available 1 Capacity almost used 0 Capacity consumption Capacity bottleneck -1 0 1
Number of planned transfers 1 or more
Number of planned transfers × (-1)
Usage of tracks Separate tracks for train service 1
Shared tracks for train services Number of train services
× (-1) Separate rolling stock for train service
1 Usage of rolling stock
Shared rolling stock for train services
Fraction of departures with shared rolling stock
× (-1) Separate train crews for train service
1
Usage of train crews Shared train crews for train services
Fraction of departures with shared crew ×
Fraction of shared crew members × (-1)
Homogenous traffic 1 Bundling of trains 0
Timetable complexity
Heterogeneity of traffic Index: See equation (4)
Heterogeneous traffic -1
Travel time Degree of scheduled waiting time
See equation (5) 1.0=1; 1.1=0; 1.2=-1;
1.3=-3; 1.4=-6; 1,5=-10
Degree of need for transfer
See equation (6) 0.0=1, 0,5=0; 1.0=-1
Degree of transfer waiting time
See equation (8) 1.0=1; 1.1=0; 1.2=-1;
1.3=-3; 1.4=-6; 1,5=-10 Transfer train uses opposite platform track
1
Transfer train uses same track 0
Transfers
Transfer condition Transfer train uses different platform
-1
Agreed upon recovery margins are used in timetable
1 Punctuality and reliability
Recovery margins Large deviations from agreed upon recovery margins exist in the timetable
-1
Total Up to max / Min approx 17 / -40
12/02/2009Quantitative Methods to Evaluate Timetable Attractiveness
18 DTU Transport, Technical University of Denmark
Conclusion & further research
• Preliminary quantitative evaluations methods for the following timetabling issues
- Timetable structure- Timetable complexity- Travel time- Transfers- Punctuality and reliability
• Quantitative evaluation indexes need further research / refinement to improve each index individually and the general timetable attractiveness index e.g. identification of preferred national timetable structure by conducting interviews and implement results in a multi-criteria analysis
• Creation of a multi-criteria objective function for timetable generation
Quantitative Methods to Evaluate Timetable Attractiveness
Thank you for your attention!
Questions?
Bernd Schittenhelm, [email protected]