Embed Size (px)
Citation preview
BeBeC-2020-D04
1
QUANTITATIVE MODELING OF SOUND SOURCES AROUND CIVIL AIRCRAFT ON FINAL APPROACH
Takehisa Takaishi1, Tomohiro Kobayashi2, Takayuki Kato3, Keiji Shimoda3, and Takatoshi Yokota2
1Japan Aerospace Exploration Agency 6-13-1 Osawa, Mitaka, Tokyo 181-0015, Japan
2Kobayasi Institute of Physical Research3IHI Aerospace Engineering
ABSTRACT
Precise sound source modelling is needed to better evaluate the acoustic influences of landing gear and high-lift devices, to estimate the effectiveness of noise reduction technologies applied to them, and to investigate when they should be extended for landing. To model sound sources of civil aircraft, a 30 m-diameter microphone array was set up under the approach path to runway 16L at Narita International Airport in Japan, and a total of 186 civil aircraft flight passes on final approach with 25 aircraft types and 33 engine types were measured over three days. Beamforming in the time domain was applied, and acoustical maps were obtained at five emission angles. In case of the latest aircraft types with high-bypass turbofan engines, such as the Boeing 787, the nose and main landing gears were found to be the dominant noise sources. To model the sound power levels and directivities of each sound source, acoustical maps were integrated over 13 partial regions around the aircraft. The CLEAN algorithm applied to the limited regions of interest gave good estimations, and the predicted time history of sound pressure level on the ground agreed very well with measured values. In case of the B787-8, airframe noise was found to be responsible for 3/4 of 𝐿 .
1 INTRODUCTION
People living around airports have been exposed to significant aircraft noise for many years. In early jet era, turbojet engines were responsible for much of the noise, but engine noise has reduced substantially since the development of high-bypass ratio turbofan engines. Correspondingly, the proportion of aircraft noise generated by the airframe has increased, particularly by high lift-devices and the landing gear during final approach. The Japan Aerospace Exploration Agency (JAXA) launched the FQUROH (Flight demonstration of Quiet Technology to Reduce Noise from High-lift configurations) project in 2015 to verify
8th Berlin Beamforming Conference 2020 Takaishi et al.
2
through flight demonstration the feasibility of practical airframe noise reduction concepts such as modified high-lift devices and landing gear. In its second flight demonstration conducted in 2017, the overall sound pressure levels (SPLs) around the main landing gear and flaps were reduced by 4.4 dB and 3.5 dB, respectively [1]. An acoustic phased array with 195 microphones was used to evaluate the effectiveness of the noise reduction devices.
As another application of this advanced noise measurement capability, detailed sound source properties, including the precise position and frequency characteristics of emitters on and around an aircraft, can be used to construct an acoustic model of an aircraft that can be used to predict aircraft noise around airports. There are two major types of aircraft noise prediction model. One is the segmentation method used by tools such as the FAA’s AEDT and EUROCONTROL’s STAPES. These represent an aircraft as a point source of sound and are widely used for airport noise control because they can provide noise contours around airports in short computation time. However, they cannot evaluate the contributions of each discrete sound source. The other is the detailed simulation model, used in tools such as NASA’s ANNOP. This consists of precise models for each component and is widely used in aircraft design (especially for type certification), but it is often difficult to obtain the non-disclosed technical information. We therefore decided to make a noise prediction model from acoustic maps obtained by a microphone array, and demonstrated its capability using measured data of JAXA’s test aircraft as an example [2, 3].
In May 2019, sound sources around civil aircraft on final approach were measured by a 30 m-diameter microphone array deployed under the approach path to runway 16L of Narita International Airport. This paper presents the resulting aircraft acoustic maps and discusses improvements to postprocessing to obtain better agreement with ground SPL measurements.
2 FLYOVER TEST
2.1 Array setup
Fig. 1. Microphone array being deployed under the flight path.
Figure 1 show the 30 m-diameter microphone array which was deployed under the flight path to runway 16L at Narita International Airport. In the previous flyover tests conducted at Noto Airport, the microphone array was mounted on a 35 x 35 m square temporary platform built beside the airport’s runway [1, 2], but it cost about 13 million yen (110 thousand Euro) and took a lot of manpower to build the platform and install the microphones. To reduce the effort
3
to construct the Narita airport array, each microphone was mounted on a 200 mm-diameter circular plate modeled on a microphone holder using a silicone mold. These could be quickly placed directly on the ground as shown in Fig. 1. To further reduce the array set-up time and to confirm various technical issues, the number of microphones was also reduced. While previous tests had used 195 microphones distributed in 13 radial arms of 15 microphones each arranged in a geometric progression of intervals, the Narita airport array used 90 quarter-inch microphones in 6 radial arms of 15 microphones. Figure 2 compares the theoretical performances of these microphone arrays. The half-power beam width is defined as the angle between the half power (-3 db) points of the main lobe, and main lobe to sidelobe ratio is defined as the ratio of the power of the main lobe to the power of the strongest sidelobe. The half-power beam width (resolution) is the same for both arrays, but the main lobe to sidelobe ratio decreases as the number of microphones is reduced.
(a) Half-power beam width (b) Main lobe to sidelobe ratio
Fig. 2. Comparison of array performances with different number of microphones.
2.2 Flight path estimation
It is difficult to obtain aircraft tracking data sufficiently accurate to calculate the propagation of sounds from noise sources to each microphone at each moment in time. The test site was located under the extended runway centerline 1,210 m from the runway threshold, and all aircraft descended at a glideslope angle of 3º. Line sensor cameras with light-sensing arrays oriented perpendicularly to the flight direction were used to calculate ground speed, altitude, and lateral deviation from the extended runway centerline when the aircraft passed directly above the microphone array. The flight path was then reconstructed assuming that the airplane was flying on the glideslope at a constant linear velocity before and after the measurement point.
2.3 Analytical method
Beamforming in the time domain was applied to calculate acoustic maps around each aircraft. Suppose that a moving point source at position 𝝃 𝜏 radiates a sound signal of strength 𝜎 𝜏 at time 𝜏, and that the radiated sound is received by the nth microphone in an array at position 𝒙 at time 𝑡 . The received acoustic pressure 𝝌 𝑡 is given in the form
4 /
n n
n n
tc
x ξ ξ x ξ (1)
0
1
2
3
4
5
6
7
8
9
10
100 1000 10000
Hal
f pow
er b
eam
wid
th [
m]
Frequency [Hz]
N=195
N=90
0
5
10
15
20
100 1000 10000
Mai
n lo
be t
o si
de l
obe
rati
o [d
B]
Frequency [Hz]
N=195
N=90
8th Berlin Beamforming Conference 2020 Takaishi et al.
4
[4], and the retarded time 𝜏 is the solution of the equation ct nn / ξx (2)
where c is the speed of sound. Equation (1) is based on the mathematical transform from a moving reference frame to a static coordinate system. The denominator includes amplifier modification due to the Doppler effect, and is simplified as 4𝜋𝑅 1 𝑀𝑐𝑜𝑠𝜃 where 𝑅 ≡‖𝒙 𝝃 𝜏 ‖, 𝑀 ≡ ‖𝝃′ 𝜏 ‖ 𝑐⁄ , and 𝜃 is the emission angle between the path of the sound and the path of the moving point source at time 𝜏. The acoustic pressure received by microphones also includes a frequency shift due to Doppler effect, and this will be corrected when the time history of 𝜎 𝜏 in the moving coordinate system is resampled (de-Dopplerized [5]) by Eqn. (1). For each focused moving point 𝝃 in the source region, the expression of conventional Delay and Sum beamforming in the time domain is
1
1, ,
N
b n bn
bN
ξ ξ (3)
where N is the total number of microphones in the array. Transforming Eqn. (3) into the frequency domain yields
1
1, ,
N
b n bn
bN
ξ ξ (4)
where 𝜔 is angular frequency. The source power spectrum 𝐴 𝜔 is calculated as
*
1 1
1, ,
2
N N
n m n b m bn m
A w w
ξ ξ (5)
in which the asterisk denotes complex conjugation. A frequency-dependent weighting factor 𝑤 𝜔 should be 1/𝑁 if the contributions of all of microphones in the array are equal. In the current study, the weight factor was customized as
12Erf1
2
1))/2200(2( 2/1
effect
nnn R
rrw (6)
/2 310000 effectR (7) where 𝑟 is the distance from the nth microphone to the array center, and Erf abbreviates an error function. Auto-correlations of 𝐴 𝜔 were removed to eliminate self-noise caused by natural wind.
2
*
1 1
1 1, , ,
2 2
N N
b n m n b m bn m
m n
A b w w
ξ ξ ξ (8)
Since the microphones were installed on the ground, the amplitudes of incident sound waves would be doubled by reflection waves, so 20 log 2 6.0 dB was subtracted from beamforming results. Air absorption during propagation was corrected based on ISO 9613-1:1993. Displacement due to convection by wind was also corrected. Meteorological observation data recorded by a weather station beside the microphone array were used for these corrections.
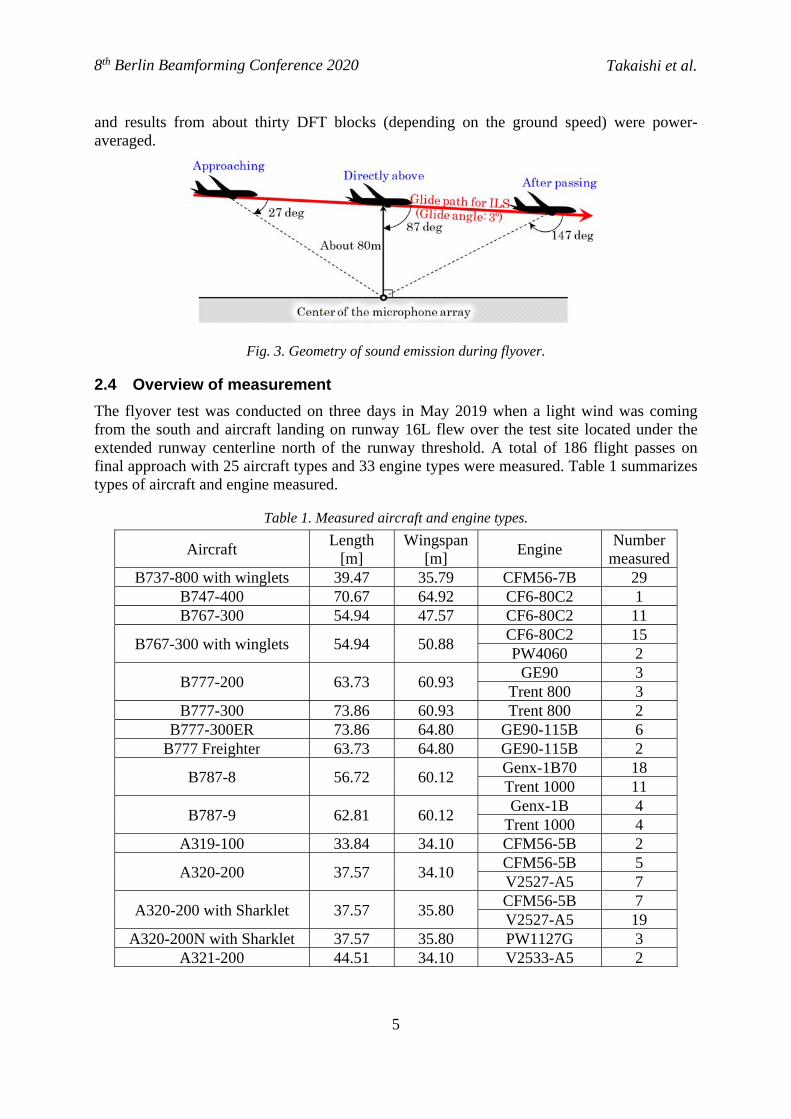
Acoustic maps at different emission angles were calculated to provide the directivity of sound radiated from each sound source. Figure 3 illustrates the geometry of sound emission during a microphone array flyover. Emission angle is defined as the angle between the flight path (=the 3º glideslope assumed in section 2.2) and the path of the sound radiated toward the reference microphone at the array center. Discrete Fourier Transform (DFT) analysis was applied when the aircraft was within 10 m of the position determined by the emission angle,
8th Berlin Beamforming Conference 2020 Takaishi et al.
5
and results from about thirty DFT blocks (depending on the ground speed) were power-averaged.
Fig. 3. Geometry of sound emission during flyover.
2.4 Overview of measurement
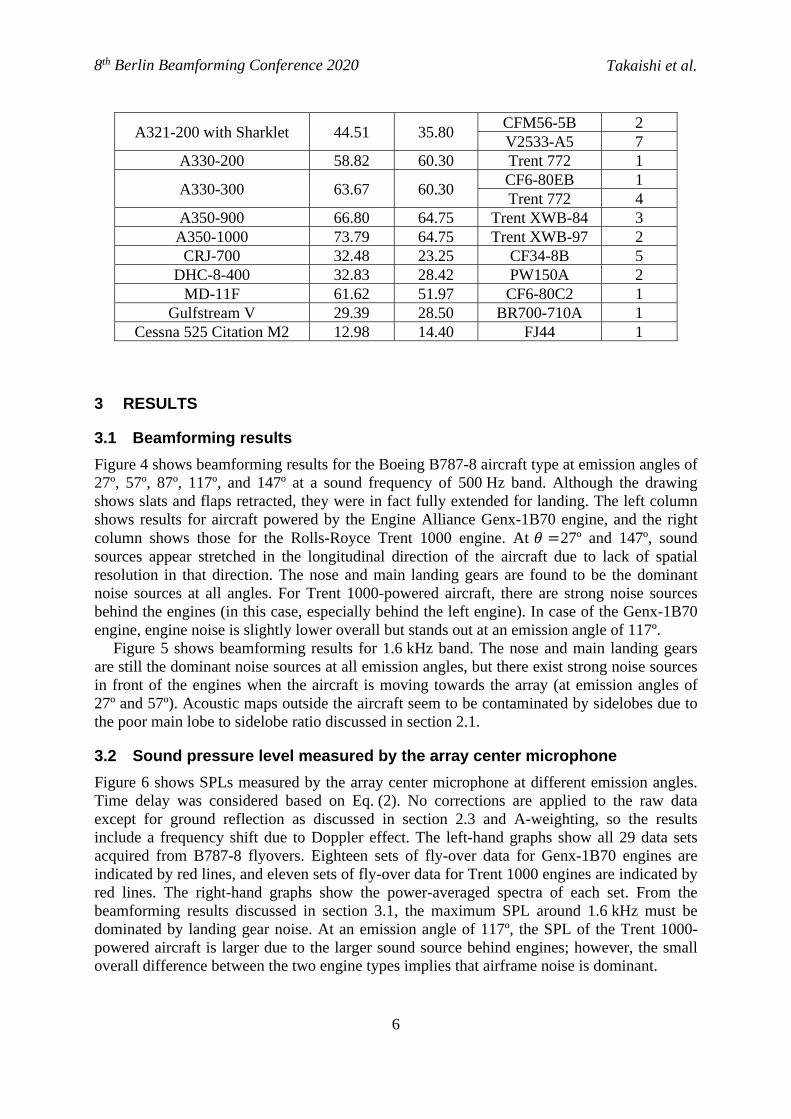
The flyover test was conducted on three days in May 2019 when a light wind was coming from the south and aircraft landing on runway 16L flew over the test site located under the extended runway centerline north of the runway threshold. A total of 186 flight passes on final approach with 25 aircraft types and 33 engine types were measured. Table 1 summarizes types of aircraft and engine measured.
Table 1. Measured aircraft and engine types.
Aircraft Length
[m] Wingspan
[m] Engine
Number measured
B737-800 with winglets 39.47 35.79 CFM56-7B 29 B747-400 70.67 64.92 CF6-80C2 1B767-300 54.94 47.57 CF6-80C2 11
B767-300 with winglets 54.94 50.88 CF6-80C2 15 PW4060 2
B777-200 63.73 60.93 GE90 3
Trent 800 3 B777-300 73.86 60.93 Trent 800 2
B777-300ER 73.86 64.80 GE90-115B 6B777 Freighter 63.73 64.80 GE90-115B 2
B787-8 56.72 60.12 Genx-1B70 18 Trent 1000 11
B787-9 62.81 60.12 Genx-1B 4
Trent 1000 4 A319-100 33.84 34.10 CFM56-5B 2
A320-200 37.57 34.10 CFM56-5B 5 V2527-A5 7
A320-200 with Sharklet 37.57 35.80 CFM56-5B 7 V2527-A5 19
A320-200N with Sharklet 37.57 35.80 PW1127G 3 A321-200 44.51 34.10 V2533-A5 2
8th Berlin Beamforming Conference 2020 Takaishi et al.
6
A321-200 with Sharklet 44.51 35.80 CFM56-5B 2 V2533-A5 7
A330-200 58.82 60.30 Trent 772 1
A330-300 63.67 60.30 CF6-80EB 1Trent 772 4
A350-900 66.80 64.75 Trent XWB-84 3A350-1000 73.79 64.75 Trent XWB-97 2CRJ-700 32.48 23.25 CF34-8B 5
DHC-8-400 32.83 28.42 PW150A 2MD-11F 61.62 51.97 CF6-80C2 1
Gulfstream V 29.39 28.50 BR700-710A 1 Cessna 525 Citation M2 12.98 14.40 FJ44 1
3 RESULTS
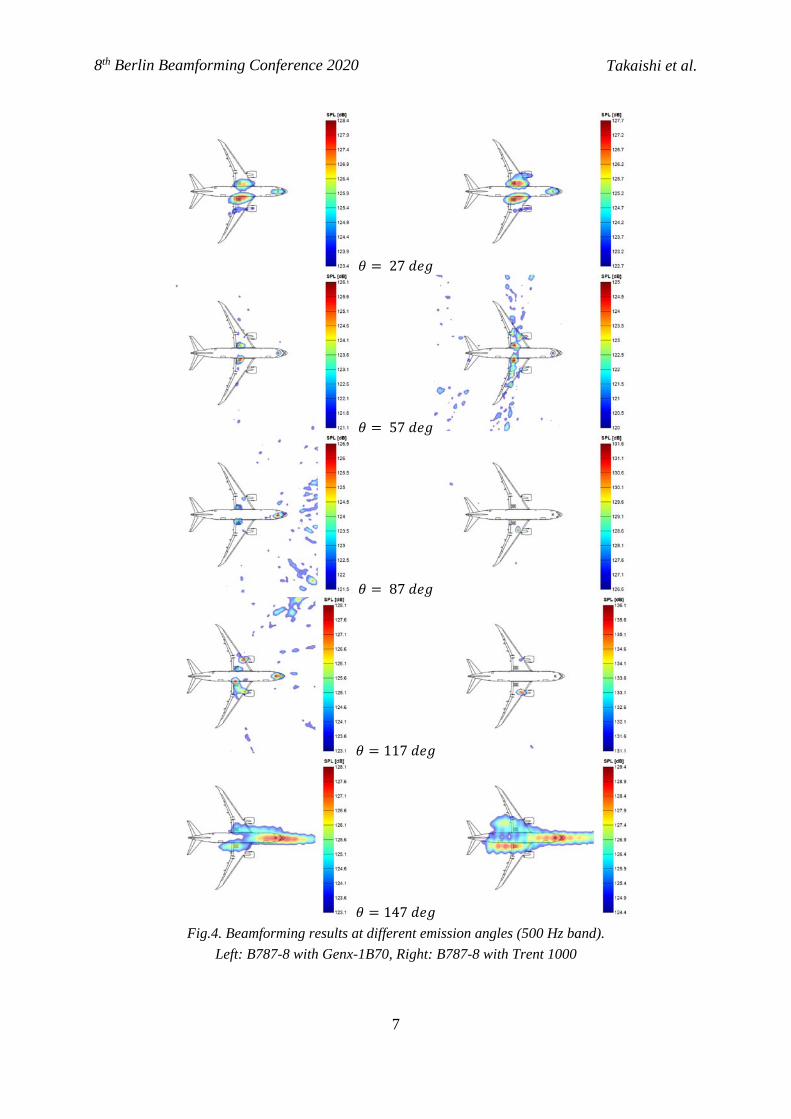
3.1 Beamforming results
Figure 4 shows beamforming results for the Boeing B787-8 aircraft type at emission angles of 27º, 57º, 87º, 117º, and 147º at a sound frequency of 500 Hz band. Although the drawing shows slats and flaps retracted, they were in fact fully extended for landing. The left column shows results for aircraft powered by the Engine Alliance Genx-1B70 engine, and the right column shows those for the Rolls-Royce Trent 1000 engine. At 𝜃 27º and 147º, sound sources appear stretched in the longitudinal direction of the aircraft due to lack of spatial resolution in that direction. The nose and main landing gears are found to be the dominant noise sources at all angles. For Trent 1000-powered aircraft, there are strong noise sources behind the engines (in this case, especially behind the left engine). In case of the Genx-1B70 engine, engine noise is slightly lower overall but stands out at an emission angle of 117º.
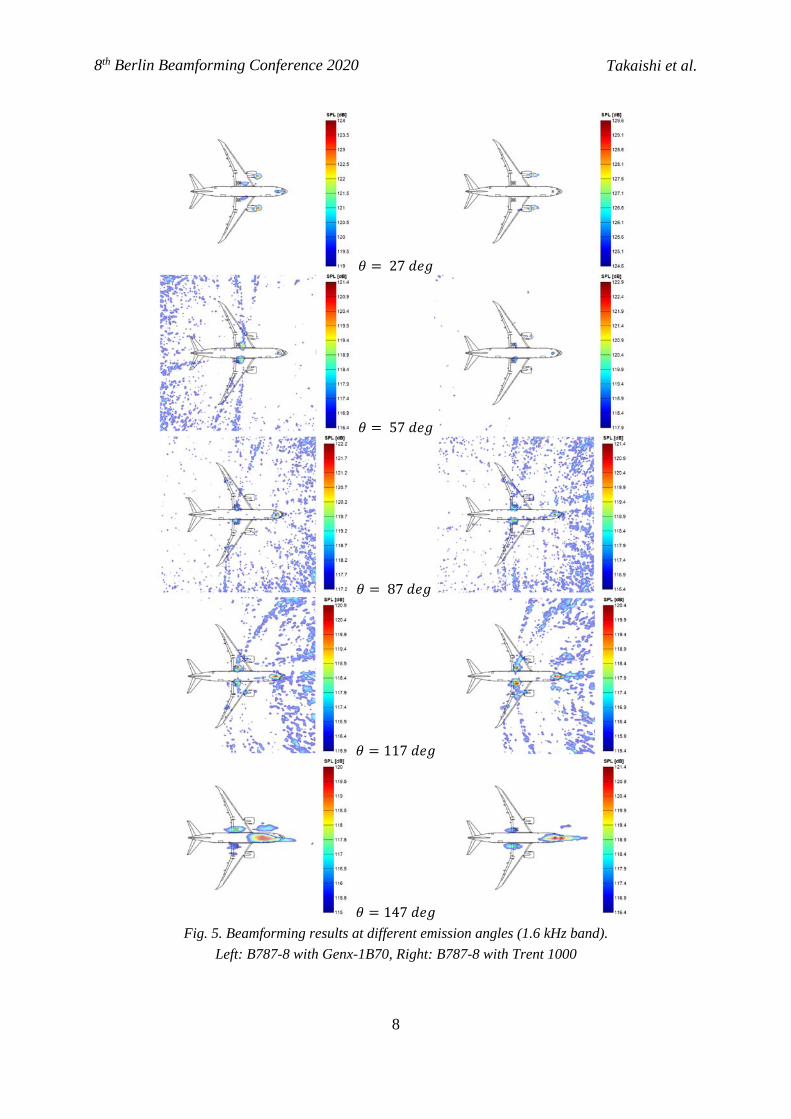
Figure 5 shows beamforming results for 1.6 kHz band. The nose and main landing gears are still the dominant noise sources at all emission angles, but there exist strong noise sources in front of the engines when the aircraft is moving towards the array (at emission angles of 27º and 57º). Acoustic maps outside the aircraft seem to be contaminated by sidelobes due to the poor main lobe to sidelobe ratio discussed in section 2.1.
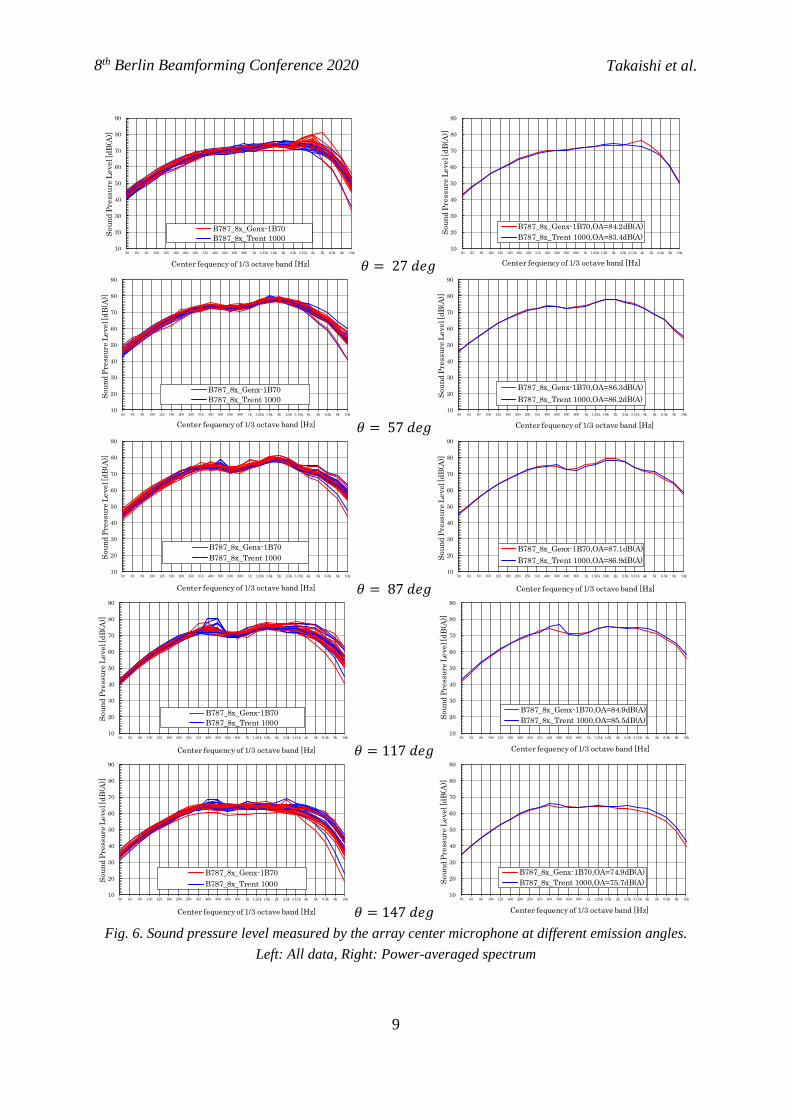
3.2 Sound pressure level measured by the array center microphone
Figure 6 shows SPLs measured by the array center microphone at different emission angles. Time delay was considered based on Eq. (2). No corrections are applied to the raw data except for ground reflection as discussed in section 2.3 and A-weighting, so the results include a frequency shift due to Doppler effect. The left-hand graphs show all 29 data sets acquired from B787-8 flyovers. Eighteen sets of fly-over data for Genx-1B70 engines are indicated by red lines, and eleven sets of fly-over data for Trent 1000 engines are indicated by red lines. The right-hand graphs show the power-averaged spectra of each set. From the beamforming results discussed in section 3.1, the maximum SPL around 1.6 kHz must be dominated by landing gear noise. At an emission angle of 117º, the SPL of the Trent 1000-powered aircraft is larger due to the larger sound source behind engines; however, the small overall difference between the two engine types implies that airframe noise is dominant.
8th Berlin Beamforming Conference 2020 Takaishi et al.
7
𝜃 27 𝑑𝑒𝑔
𝜃 57 𝑑𝑒𝑔
𝜃 87 𝑑𝑒𝑔
𝜃 117 𝑑𝑒𝑔
𝜃 147 𝑑𝑒𝑔Fig.4. Beamforming results at different emission angles (500 Hz band).
Left: B787-8 with Genx-1B70, Right: B787-8 with Trent 1000
8th Berlin Beamforming Conference 2020 Takaishi et al.
8
𝜃 27 𝑑𝑒𝑔
𝜃 57 𝑑𝑒𝑔
𝜃 87 𝑑𝑒𝑔
𝜃 117 𝑑𝑒𝑔
𝜃 147 𝑑𝑒𝑔Fig. 5. Beamforming results at different emission angles (1.6 kHz band).
Left: B787-8 with Genx-1B70, Right: B787-8 with Trent 1000
8th Berlin Beamforming Conference 2020 Takaishi et al.
9
𝜃 27 𝑑𝑒𝑔
𝜃 57 𝑑𝑒𝑔
𝜃 87 𝑑𝑒𝑔
𝜃 117 𝑑𝑒𝑔
𝜃 147 𝑑𝑒𝑔 Fig. 6. Sound pressure level measured by the array center microphone at different emission angles.
Left: All data, Right: Power-averaged spectrum
10
20
30
40
50
60
70
80
90
50 63 80 100 125 160 200 250 315 400 500 630 800 1k 1.25k 1.6k 2k 2.5k 3.15k 4k 5k 6.3k 8k 10k
Sou
nd P
ress
ure
Lev
el [d
B(A
)]
Center fequency of 1/3 octave band [Hz]
B787_8x_Genx-1B70B787_8x_Trent 1000
10
20
30
40
50
60
70
80
90
50 63 80 100 125 160 200 250 315 400 500 630 800 1k 1.25k 1.6k 2k 2.5k 3.15k 4k 5k 6.3k 8k 10k
Sou
nd P
ress
ure
Lev
el [d
B(A
)]
Center fequency of 1/3 octave band [Hz]
B787_8x_Genx-1B70,OA=84.2dB(A)B787_8x_Trent 1000,OA=83.4dB(A)
10
20
30
40
50
60
70
80
90
50 63 80 100 125 160 200 250 315 400 500 630 800 1k 1.25k 1.6k 2k 2.5k 3.15k 4k 5k 6.3k 8k 10k
Sou
nd P
ress
ure
Lev
el [d
B(A
)]
Center fequency of 1/3 octave band [Hz]
B787_8x_Genx-1B70B787_8x_Trent 1000
10
20
30
40
50
60
70
80
90
50 63 80 100 125 160 200 250 315 400 500 630 800 1k 1.25k 1.6k 2k 2.5k 3.15k 4k 5k 6.3k 8k 10k
Sou
nd P
ress
ure
Lev
el [d
B(A
)]
Center fequency of 1/3 octave band [Hz]
B787_8x_Genx-1B70,OA=86.3dB(A)
B787_8x_Trent 1000,OA=86.2dB(A)
10
20
30
40
50
60
70
80
90
50 63 80 100 125 160 200 250 315 400 500 630 800 1k 1.25k 1.6k 2k 2.5k 3.15k 4k 5k 6.3k 8k 10k
Sou
nd P
ress
ure
Lev
el [d
B(A
)]
Center fequency of 1/3 octave band [Hz]
B787_8x_Genx-1B70B787_8x_Trent 1000
10
20
30
40
50
60
70
80
90
50 63 80 100 125 160 200 250 315 400 500 630 800 1k 1.25k 1.6k 2k 2.5k 3.15k 4k 5k 6.3k 8k 10k
Sou
nd P
ress
ure
Lev
el [d
B(A
)]
Center fequency of 1/3 octave band [Hz]
B787_8x_Genx-1B70,OA=87.1dB(A)
B787_8x_Trent 1000,OA=86.9dB(A)
10
20
30
40
50
60
70
80
90
50 63 80 100 125 160 200 250 315 400 500 630 800 1k 1.25k 1.6k 2k 2.5k 3.15k 4k 5k 6.3k 8k 10k
Sou
nd P
ress
ure
Lev
el [d
B(A
)]
Center fequency of 1/3 octave band [Hz]
B787_8x_Genx-1B70B787_8x_Trent 1000
10
20
30
40
50
60
70
80
90
50 63 80 100 125 160 200 250 315 400 500 630 800 1k 1.25k 1.6k 2k 2.5k 3.15k 4k 5k 6.3k 8k 10k
Sou
nd P
ress
ure
Lev
el [d
B(A
)]
Center fequency of 1/3 octave band [Hz]
B787_8x_Genx-1B70,OA=84.9dB(A)B787_8x_Trent 1000,OA=85.5dB(A)
10
20
30
40
50
60
70
80
90
50 63 80 100 125 160 200 250 315 400 500 630 800 1k 1.25k 1.6k 2k 2.5k 3.15k 4k 5k 6.3k 8k 10k
Sou
nd P
ress
ure
Lev
el [d
B(A
)]
Center fequency of 1/3 octave band [Hz]
B787_8x_Genx-1B70B787_8x_Trent 1000
10
20
30
40
50
60
70
80
90
50 63 80 100 125 160 200 250 315 400 500 630 800 1k 1.25k 1.6k 2k 2.5k 3.15k 4k 5k 6.3k 8k 10k
Sou
nd P
ress
ure
Lev
el [d
B(A
)]
Center fequency of 1/3 octave band [Hz]
B787_8x_Genx-1B70,OA=74.9dB(A)B787_8x_Trent 1000,OA=75.7dB(A)
8th Berlin Beamforming Conference 2020 Takaishi et al.
10
3.3 Power level of each sound source (Improvement of domain integration)
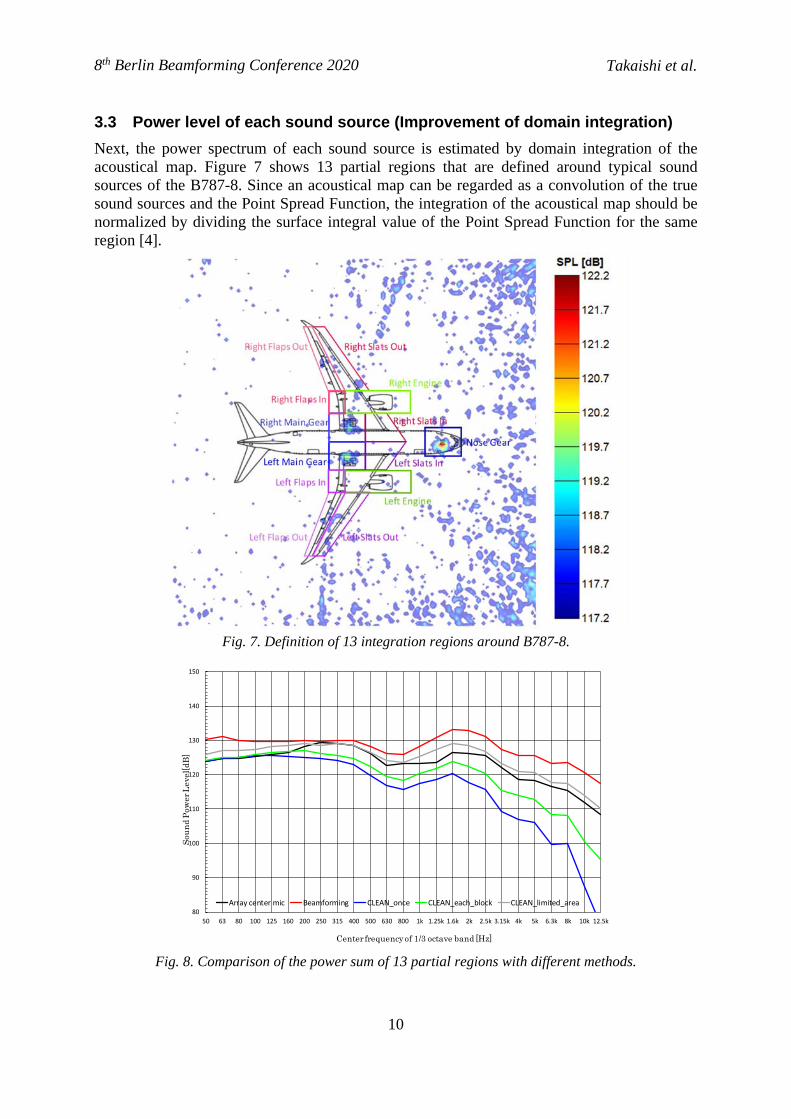
Next, the power spectrum of each sound source is estimated by domain integration of the acoustical map. Figure 7 shows 13 partial regions that are defined around typical sound sources of the B787-8. Since an acoustical map can be regarded as a convolution of the true sound sources and the Point Spread Function, the integration of the acoustical map should be normalized by dividing the surface integral value of the Point Spread Function for the same region [4].
Fig. 7. Definition of 13 integration regions around B787-8.
Fig. 8. Comparison of the power sum of 13 partial regions with different methods.
80
90
100
110
120
130
140
150
50 63 80 100 125 160 200 250 315 400 500 630 800 1k 1.25k 1.6k 2k 2.5k 3.15k 4k 5k 6.3k 8k 10k 12.5k
Sou
nd
Pow
er L
evel
[dB
]
Center frequency of 1/3 octave band [Hz]
Array center mic Beamforming CLEAN_once CLEAN_each_block CLEAN_limited_area
8th Berlin Beamforming Conference 2020 Takaishi et al.
11
Fig. 9. CLEAN applied once to power-averaged beamforming results.
Fig. 10. CLEAN applied to beamforming result at each block.
Fig. 11. CLEAN only applied to sound sources inside partial regions.
8th Berlin Beamforming Conference 2020 Takaishi et al.
12
𝜃 27 𝑑𝑒𝑔
𝜃 57 𝑑𝑒𝑔
𝜃 87 𝑑𝑒𝑔
𝜃 117 𝑑𝑒𝑔
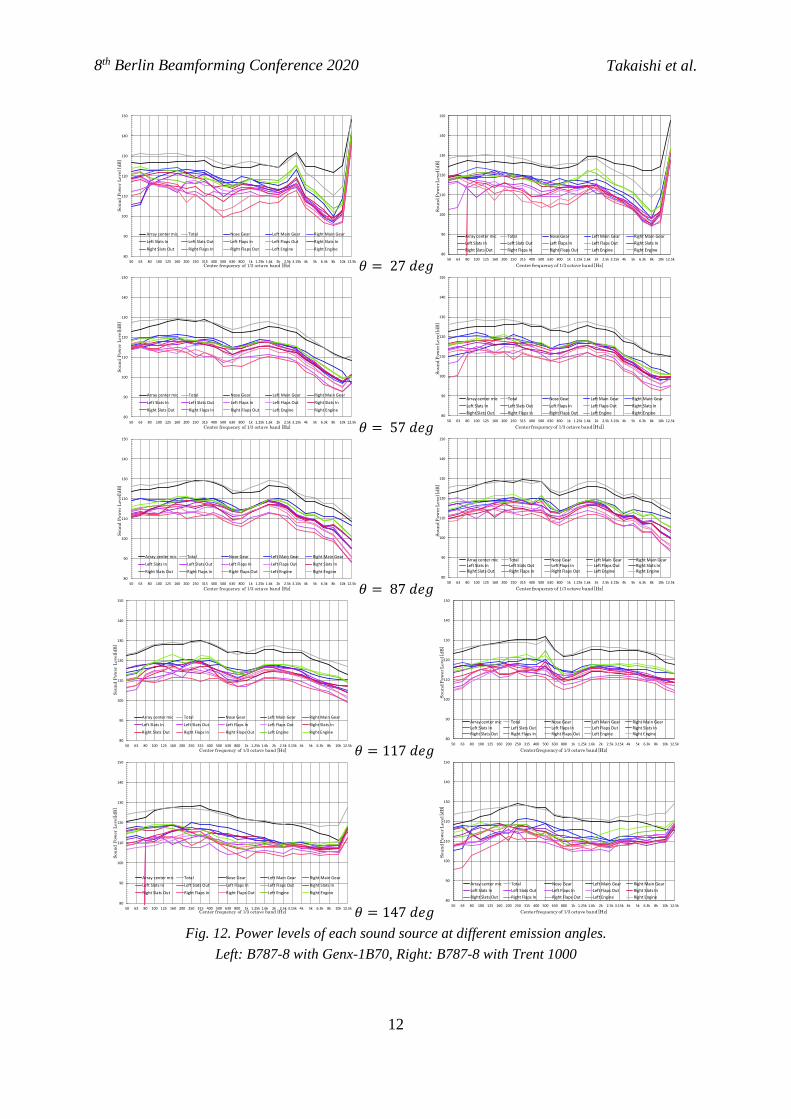
𝜃 147 𝑑𝑒𝑔Fig. 12. Power levels of each sound source at different emission angles.
Left: B787-8 with Genx-1B70, Right: B787-8 with Trent 1000
80
90
100
110
120
130
140
150
50 63 80 100 125 160 200 250 315 400 500 630 800 1k 1.25k 1.6k 2k 2.5k 3.15k 4k 5k 6.3k 8k 10k 12.5k
Sou
nd
Pow
er L
evel
[dB
]
Center frequency of 1/3 octave band [Hz]
Array center mic Total Nose Gear Left Main Gear Right Main Gear
Left Slats In Left Slats Out Left Flaps In Left Flaps Out Right Slats In
Right Slats Out Right Flaps In Right Flaps Out Left Engine Right Engine80
90
100
110
120
130
140
150
50 63 80 100 125 160 200 250 315 400 500 630 800 1k 1.25k 1.6k 2k 2.5k 3.15k 4k 5k 6.3k 8k 10k 12.5k
Sou
nd
Pow
er L
evel
[dB
]
Center frequency of 1/3 octave band [Hz]
Array center mic Total Nose Gear Left Main Gear Right Main Gear
Left Slats In Left Slats Out Left Flaps In Left Flaps Out Right Slats In
Right Slats Out Right Flaps In Right Flaps Out Left Engine Right Engine
80
90
100
110
120
130
140
150
50 63 80 100 125 160 200 250 315 400 500 630 800 1k 1.25k 1.6k 2k 2.5k 3.15k 4k 5k 6.3k 8k 10k 12.5k
Sou
nd
Pow
er L
evel
[dB
]
Center frequency of 1/3 octave band [Hz]
Array center mic Total Nose Gear Left Main Gear Right Main Gear
Left Slats In Left Slats Out Left Flaps In Left Flaps Out Right Slats In
Right Slats Out Right Flaps In Right Flaps Out Left Engine Right Engine80
90
100
110
120
130
140
150
50 63 80 100 125 160 200 250 315 400 500 630 800 1k 1.25k 1.6k 2k 2.5k 3.15k 4k 5k 6.3k 8k 10k 12.5k
Sou
nd
Pow
er L
evel
[dB
]
Center frequency of 1/3 octave band [Hz]]
Array center mic Total Nose Gear Left Main Gear Right Main Gear
Left Slats In Left Slats Out Left Flaps In Left Flaps Out Right Slats In
Right Slats Out Right Flaps In Right Flaps Out Left Engine Right Engine
80
90
100
110
120
130
140
150
50 63 80 100 125 160 200 250 315 400 500 630 800 1k 1.25k 1.6k 2k 2.5k 3.15k 4k 5k 6.3k 8k 10k 12.5k
Sou
nd
Pow
er L
evel
[dB
]
Center frequency of 1/3 octave band [Hz]
Array center mic Total Nose Gear Left Main Gear Right Main Gear
Left Slats In Left Slats Out Left Flaps In Left Flaps Out Right Slats In
Right Slats Out Right Flaps In Right Flaps Out Left Engine Right Engine80
90
100
110
120
130
140
150
50 63 80 100 125 160 200 250 315 400 500 630 800 1k 1.25k 1.6k 2k 2.5k 3.15k 4k 5k 6.3k 8k 10k 12.5k
Sou
nd
Pow
er L
evel
[dB
]
Center frequency of 1/3 octave band [Hz]
Array center mic Total Nose Gear Left Main Gear Right Main GearLeft Slats In Left Slats Out Left Flaps In Left Flaps Out Right Slats InRight Slats Out Right Flaps In Right Flaps Out Left Engine Right Engine
80
90
100
110
120
130
140
150
50 63 80 100 125 160 200 250 315 400 500 630 800 1k 1.25k 1.6k 2k 2.5k 3.15k 4k 5k 6.3k 8k 10k 12.5k
Sou
nd
Pow
er L
evel
[dB
]
Center frequency of 1/3 octave band [Hz]
Array center mic Total Nose Gear Left Main Gear Right Main Gear
Left Slats In Left Slats Out Left Flaps In Left Flaps Out Right Slats In
Right Slats Out Right Flaps In Right Flaps Out Left Engine Right Engine
80
90
100
110
120
130
140
150
50 63 80 100 125 160 200 250 315 400 500 630 800 1k 1.25k 1.6k 2k 2.5k 3.15k 4k 5k 6.3k 8k 10k 12.5k
Sou
nd
Pow
er L
evel
[dB
]
Center frequency of 1/3 octave band [Hz]
Array center mic Total Nose Gear Left Main Gear Right Main Gear
Left Slats In Left Slats Out Left Flaps In Left Flaps Out Right Slats In
Right Slats Out Right Flaps In Right Flaps Out Left Engine Right Engine
80
90
100
110
120
130
140
150
50 63 80 100 125 160 200 250 315 400 500 630 800 1k 1.25k 1.6k 2k 2.5k 3.15k 4k 5k 6.3k 8k 10k 12.5k
Sou
nd P
ower
Lev
el[d
B]
Center frequency of 1/3 octave band [Hz]
Array center mic Total Nose Gear Left Main Gear Right Main Gear
Left Slats In Left Slats Out Left Flaps In Left Flaps Out Right Slats In
Right Slats Out Right Flaps In Right Flaps Out Left Engine Right Engine
80
90
100
110
120
130
140
150
50 63 80 100 125 160 200 250 315 400 500 630 800 1k 1.25k 1.6k 2k 2.5k 3.15k 4k 5k 6.3k 8k 10k 12.5k
Sou
nd
Pow
er L
evel
[dB
]
Center frequency of 1/3 octave band [Hz]
Array center mic Total Nose Gear Left Main Gear Right Main Gear
Left Slats In Left Slats Out Left Flaps In Left Flaps Out Right Slats In
Right Slats Out Right Flaps In Right Flaps Out Left Engine Right Engine
8th Berlin Beamforming Conference 2020 Takaishi et al.
13
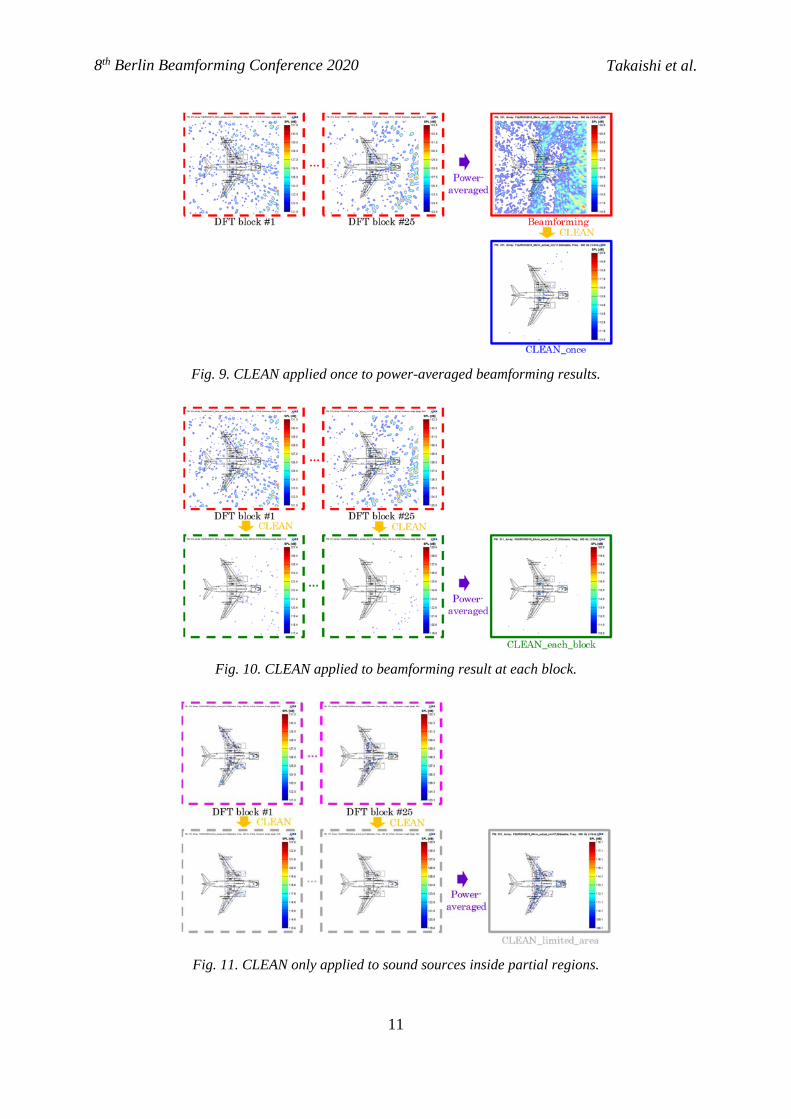
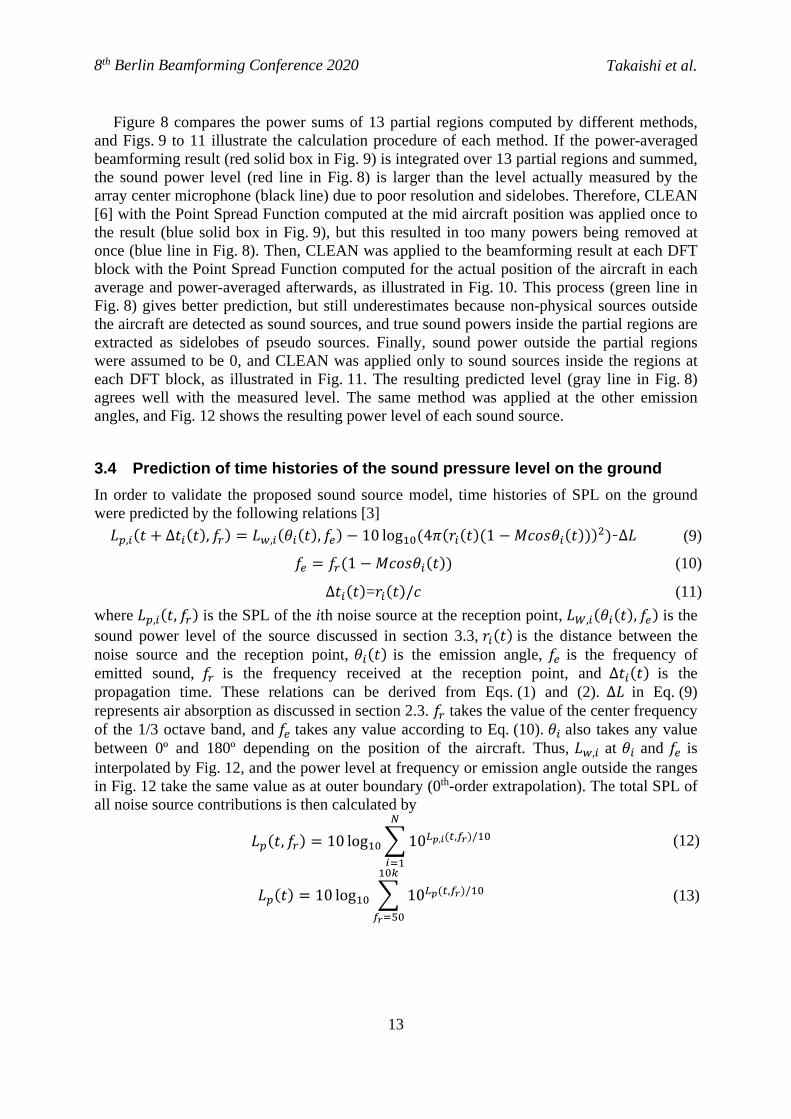
Figure 8 compares the power sums of 13 partial regions computed by different methods, and Figs. 9 to 11 illustrate the calculation procedure of each method. If the power-averaged beamforming result (red solid box in Fig. 9) is integrated over 13 partial regions and summed, the sound power level (red line in Fig. 8) is larger than the level actually measured by the array center microphone (black line) due to poor resolution and sidelobes. Therefore, CLEAN [6] with the Point Spread Function computed at the mid aircraft position was applied once tothe result (blue solid box in Fig. 9), but this resulted in too many powers being removed atonce (blue line in Fig. 8). Then, CLEAN was applied to the beamforming result at each DFTblock with the Point Spread Function computed for the actual position of the aircraft in eachaverage and power-averaged afterwards, as illustrated in Fig. 10. This process (green line inFig. 8) gives better prediction, but still underestimates because non-physical sources outsidethe aircraft are detected as sound sources, and true sound powers inside the partial regions areextracted as sidelobes of pseudo sources. Finally, sound power outside the partial regionswere assumed to be 0, and CLEAN was applied only to sound sources inside the regions ateach DFT block, as illustrated in Fig. 11. The resulting predicted level (gray line in Fig. 8)agrees well with the measured level. The same method was applied at the other emissionangles, and Fig. 12 shows the resulting power level of each sound source.
3.4 Prediction of time histories of the sound pressure level on the ground
In order to validate the proposed sound source model, time histories of SPL on the ground were predicted by the following relations [3]
𝐿 , 𝑡 Δ𝑡 𝑡 , 𝑓 𝐿 , 𝜃 𝑡 ,𝑓 10 log 4𝜋 𝑟 𝑡 1 𝑀𝑐𝑜𝑠𝜃 𝑡 -Δ𝐿 (9)
𝑓 𝑓 1 𝑀𝑐𝑜𝑠𝜃 𝑡 (10)
Δ𝑡 𝑡 =𝑟 𝑡 /𝑐 (11)
where 𝐿 , 𝑡, 𝑓 is the SPL of the ith noise source at the reception point, 𝐿 , 𝜃 𝑡 ,𝑓 is the sound power level of the source discussed in section 3.3, 𝑟 𝑡 is the distance between the noise source and the reception point, 𝜃 𝑡 is the emission angle, 𝑓 is the frequency of emitted sound, 𝑓 is the frequency received at the reception point, and Δ𝑡 𝑡 is the propagation time. These relations can be derived from Eqs. (1) and (2). Δ𝐿 in Eq. (9) represents air absorption as discussed in section 2.3. 𝑓 takes the value of the center frequency of the 1/3 octave band, and 𝑓 takes any value according to Eq. (10). 𝜃 also takes any value between 0º and 180º depending on the position of the aircraft. Thus, 𝐿 , at 𝜃 and 𝑓 is interpolated by Fig. 12, and the power level at frequency or emission angle outside the ranges in Fig. 12 take the same value as at outer boundary (0th-order extrapolation). The total SPL of all noise source contributions is then calculated by
𝐿 𝑡, 𝑓 10 log 10 , , / (12)
𝐿 𝑡 10 log 10 , / (13)
8th Berlin Beamforming Conference 2020 Takaishi et al.
14
500 Hz band
1.6 kHz band
Over all Fig. 13. Time histories of measured and predicted sound pressure levels at the array center.
Left: B787-8 with Genx-1B70, Right: B787-8 with Trent 1000
Figure 13 shows time histories of measured and predicted SPLs at the array center. The predicted total SPL (gray line) is in good agreement with the measured value (black line) at emission angles of 27º to 147º where the power level is interpolated. In the 1/3 octave band centered at 500 Hz, the nose and main landing gears are the most dominant noise sources during flyover, and the engine contribution is large at around 117º where jet noise behind the engine exit nozzle is dominant. In band around 1.6 kHz, engine noise is large in the forward
30
40
50
60
70
80
90
100
-5 -4 -3 -2 -1 0 1 2 3 4 5
27° 57° 87° 117° 147°
A-w
eig
ht
SP
L [
dB
]
Relative time [s]
500Hz
Total
Nose Gear
Left Main Gear
Right Main Gear
Left Slats In
Left Slats Out
Left Flaps In
Left Flaps Out
Right Slats In
Right Slats Out
Right Flaps In
Right Flaps Out
Left Engine
Right Engine
30
40
50
60
70
80
90
100
-5 -4 -3 -2 -1 0 1 2 3 4 5 30
40
50
60
70
80
90
100
-5 -4 -3 -2 -1 0 1 2 3 4 5
27° 57° 87° 117° 147°
A-w
eig
ht
SP
L [
dB
]
Relative time [s]
500Hz
Total
Nose Gear
Left Main Gear
Right Main Gear
Left Slats In
Left Slats Out
Left Flaps In
Left Flaps Out
Right Slats In
Right Slats Out
Right Flaps In
Right Flaps Out
Left Engine
Right Engine
30
40
50
60
70
80
90
100
-5 -4 -3 -2 -1 0 1 2 3 4 5
30
40
50
60
70
80
90
100
-5 -4 -3 -2 -1 0 1 2 3 4 5
27° 57° 87° 117° 147°
A-w
eig
ht
SP
L [
dB
]
Relative time [s]
1.6kHz
Total
Nose Gear
Left Main Gear
Right Main Gear
Left Slats In
Left Slats Out
Left Flaps In
Left Flaps Out
Right Slats In
Right Slats Out
Right Flaps In
Right Flaps Out
Left Engine
Right Engine
30
40
50
60
70
80
90
100
-5 -4 -3 -2 -1 0 1 2 3 4 5 30
40
50
60
70
80
90
100
-5 -4 -3 -2 -1 0 1 2 3 4 5
27° 57° 87° 117° 147°
A-w
eig
ht
SP
L [
dB
]
Relative time [s]
1.6kHz
Total
Nose Gear
Left Main Gear
Right Main Gear
Left Slats In
Left Slats Out
Left Flaps In
Left Flaps Out
Right Slats In
Right Slats Out
Right Flaps In
Right Flaps Out
Left Engine
Right Engine
30
40
50
60
70
80
90
100
-5 -4 -3 -2 -1 0 1 2 3 4 5
50
60
70
80
90
100
110
-5 -4 -3 -2 -1 0 1 2 3 4 5
27° 57° 87° 117° 147°
A-w
eig
ht
SP
L [
dB
]
Relative time [s]
OA(50-10k)
Total
Nose Gear
Left Main Gear
Right Main Gear
Left Slats In
Left Slats Out
Left Flaps In
Left Flaps Out
Right Slats In
Right Slats Out
Right Flaps In
Right Flaps Out
Left Engine
Right Engine
50
60
70
80
90
100
110
-5 -4 -3 -2 -1 0 1 2 3 4 5 50
60
70
80
90
100
110
-5 -4 -3 -2 -1 0 1 2 3 4 5
27° 57° 87° 117° 147°
A-w
eig
ht
SP
L [
dB
]
Relative time [s]
OA(50-10k)
Total
Nose Gear
Left Main Gear
Right Main Gear
Left Slats In
Left Slats Out
Left Flaps In
Left Flaps Out
Right Slats In
Right Slats Out
Right Flaps In
Right Flaps Out
Left Engine
Right Engine
50
60
70
80
90
100
110
-5 -4 -3 -2 -1 0 1 2 3 4 5
8th Berlin Beamforming Conference 2020 Takaishi et al.
15
direction due to the predominance of fan noise. Landing gear noise reaches its peak level around 87º.
Finally, the single event A-weighted sound exposure level is calculated by
𝐿 10 log1𝑇
10 / 𝑑𝑡 (14)
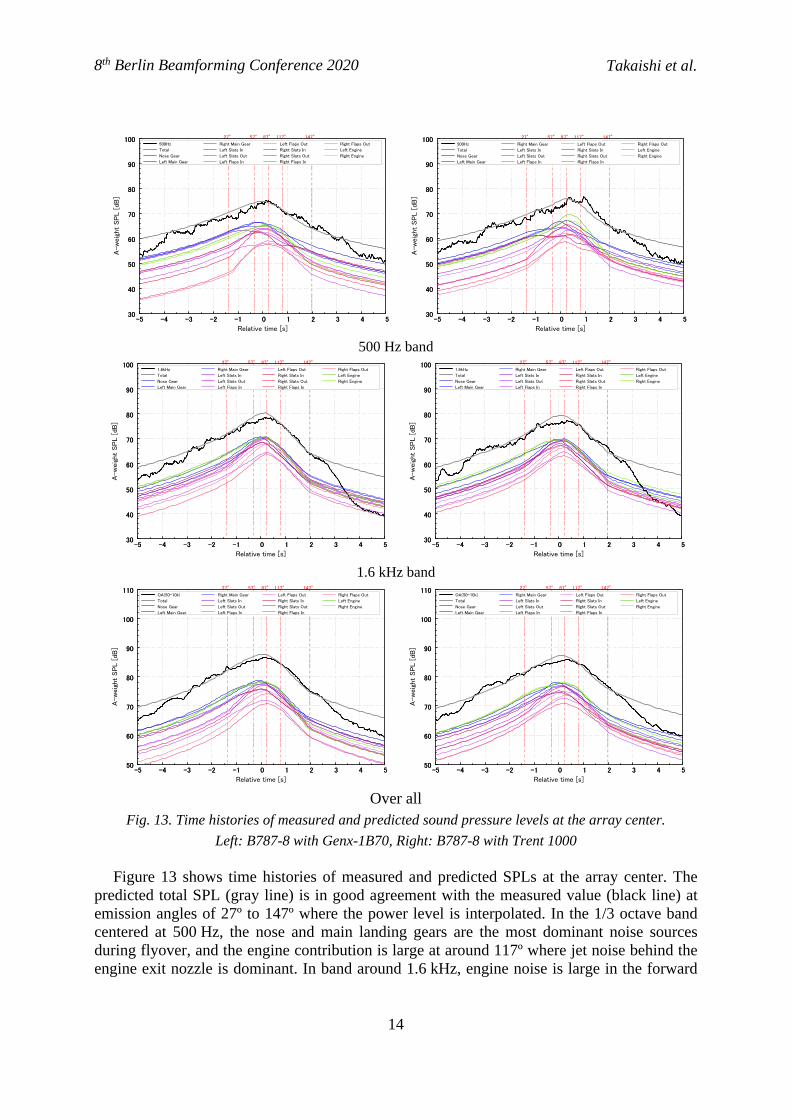
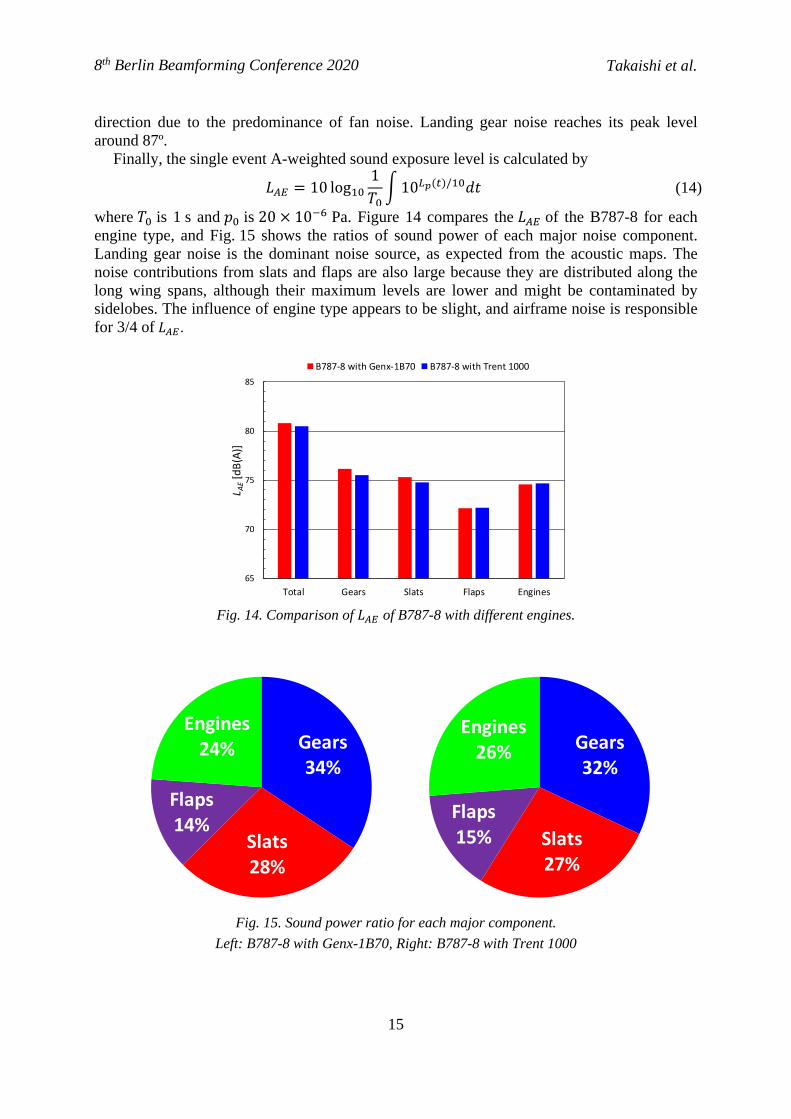
where 𝑇 is 1 s and 𝑝 is 20 10 Pa. Figure 14 compares the 𝐿 of the B787-8 for each engine type, and Fig. 15 shows the ratios of sound power of each major noise component. Landing gear noise is the dominant noise source, as expected from the acoustic maps. The noise contributions from slats and flaps are also large because they are distributed along the long wing spans, although their maximum levels are lower and might be contaminated by sidelobes. The influence of engine type appears to be slight, and airframe noise is responsible for 3/4 of 𝐿 .
Fig. 14. Comparison of 𝐿 of B787-8 with different engines.
Fig. 15. Sound power ratio for each major component.
Left: B787-8 with Genx-1B70, Right: B787-8 with Trent 1000
65
70
75
80
85
Total Gears Slats Flaps Engines
L AE[dB(A)]
B787‐8 with Genx‐1B70 B787‐8 with Trent 1000
Gears34%
Slats28%
Flaps14%
Engines24% Gears
32%
Slats27%
Flaps15%
Engines26%
8th Berlin Beamforming Conference 2020 Takaishi et al.
16
4 CONCLUSIONS
In order to model detailed sound source properties necessary for precise airport noise prediction, a 30 m-diameter microphone array of 90 microphones was deployed under the final approach path to runway 16L at Narita International Airport, and a total of 186 civil aircraft flight passes with 25 aircraft types and 33 engine types were measured over three days in May 2019. Beamforming in the time domain was applied with additional methods such as weight factors for each microphone and diagonal removal from the source power spectrum. Aircraft position tracking data were reconstructed from position and velocity directly overhead the array measured by line sensor cameras assuming flight on a 3º glideslope at a constant velocity. In case of the latest aircraft types with high-bypass turbofan engines, such as the Boeing 787, the nose and main landing gears were found to be the dominant noise sources, and seem to be the main contributors to the maximum SPL on the ground around 1.6 kHz. Acoustical maps were integrated over 13 partial regions around the aircraft to model the sound power levels and directivities of each sound source. Although the standard CLEAN algorithm removed too much of the source powers due to sidelobes, applying CLEAN to the limited regions of interest gave good estimations, and the predicted time histories of SPL on the ground agreed very well with measured values. In case of the B787-8, airframe noise was found to be responsible for 3/4 of 𝐿 . As a future problem, we are planning another flyover test with a greater number of microphones to reduce the effect of sidelobes as discussed in section 2.1.
Acknowledgements
The authors would like to express gratitude to Mr. Satoshi Tomizawa and Mr. Shinji Hori of Narita International Airport Corporation, and Dr. Yasuaki Kawase and Mr. Miroku Tani of Narita International Airport Promotion Foundation, for their kind support in conducting the flyover test. We would also like to express our sincere thanks to Mr. Shunsuke Koda of the Kobayasi Institute of Physical Research, Dr. Patricio A. Ravetta of AVEC, Dr. Kenichiro Nagai and Dr. Yuzuru Yokokawa of JAXA for their technical support and helpful advice.
REFERENCES
[1] K. Yamamoto, et al. “FQUROH: A Flight Demonstration Project for Airframe NoiseReduction Technology – the 2nd Flight Demonstration.” AIAA-2018-4087, 2018. 24thAIAA/CEAS Aeroacoustics Conference, Atlanta, Georgia, 25-29 June, 2018.
[2] T. Takaishi, K. Yamamoto, T. Kobayashi, and T. Yokota. “Localization of noisesources around aircraft in flight based on time-domain beamforming technique.”Proceedings of INTER-NOISE 2018, 602-613, Chicago, IL, 26-29 August, 2018.
[3] T. Kobayashi, T. Yokota, K. Makino, and T. Takaishi. “Precise sound source model foraircraft noise prediction based on noise source distribution determined by phased arraybeamforming.” Proceedings of INTER-NOISE 2018, 3599-3610, Chicago, IL, 26-29August, 2018.
[4] P. Sijtsma and R. W. Stoker. “Determination of Absolute Contributions of AircraftNoise Components Using Fly-over Array Measurements.” AIAA-2004-2958, 2004.10th AIAA/CEAS Aeroacoustics Conference, Manchester, United Kingdom, 10-12May, 2004.
8th Berlin Beamforming Conference 2020 Takaishi et al.

17
[5] G. P. Howell, A. J. Bradley, M. A. McCormick, and J. D. Brown. “De-Dopplerizationand Acoustic Imaging of Aircraft Flyover Noise Measurements.” J. Sound Vib., 105,151–1177, 1986.
[6] P. Sijtsma. “CLEAN Based on Spatial Source Coherence.” AIAA-2007-3436, 2007.13th AIAA/CEAS Aeroacoustics Conference, Rome, Italy, 21-23 May, 2007.
8th Berlin Beamforming Conference 2020 Takaishi et al.