Embed Size (px)
Citation preview
BearWorks BearWorks
MSU Graduate Theses
Spring 2019
Quantitative Reasoning: Individual Differences In Heart Rate and Quantitative Reasoning: Individual Differences In Heart Rate and
Response Latency Response Latency
Abigail L. Van Nuland Missouri State University, [email protected]
As with any intellectual project, the content and views expressed in this thesis may be
considered objectionable by some readers. However, this student-scholar’s work has been
judged to have academic value by the student’s thesis committee members trained in the
discipline. The content and views expressed in this thesis are those of the student-scholar and
are not endorsed by Missouri State University, its Graduate College, or its employees.
Follow this and additional works at: https://bearworks.missouristate.edu/theses
Part of the Biological Psychology Commons, Cognition and Perception Commons, and the
Cognitive Psychology Commons
Recommended Citation Recommended Citation Van Nuland, Abigail L., "Quantitative Reasoning: Individual Differences In Heart Rate and Response Latency" (2019). MSU Graduate Theses. 3383. https://bearworks.missouristate.edu/theses/3383
This article or document was made available through BearWorks, the institutional repository of Missouri State University. The work contained in it may be protected by copyright and require permission of the copyright holder for reuse or redistribution. For more information, please contact [email protected].
QUANTITATIVE REASONING: INDIVIDUAL DIFFERENCES IN HEART RATE AND
RESPONSE LATENCY
A Master’s Thesis
Presented to
The Graduate College of
Missouri State University
TEMPLATE
In Partial Fulfillment
Of the Requirements for the Degree
Master of Science, Experimental Psychology
By
Abigail Van Nuland
May 2019
ii
QUANTITATIVE REASONING: INDIVIDUAL DIFFERENCES IN HEART RATE AND
RESPONSE LATENCY
Psychology
Missouri State University, May 2019
Master of Science
Abigail Van Nuland
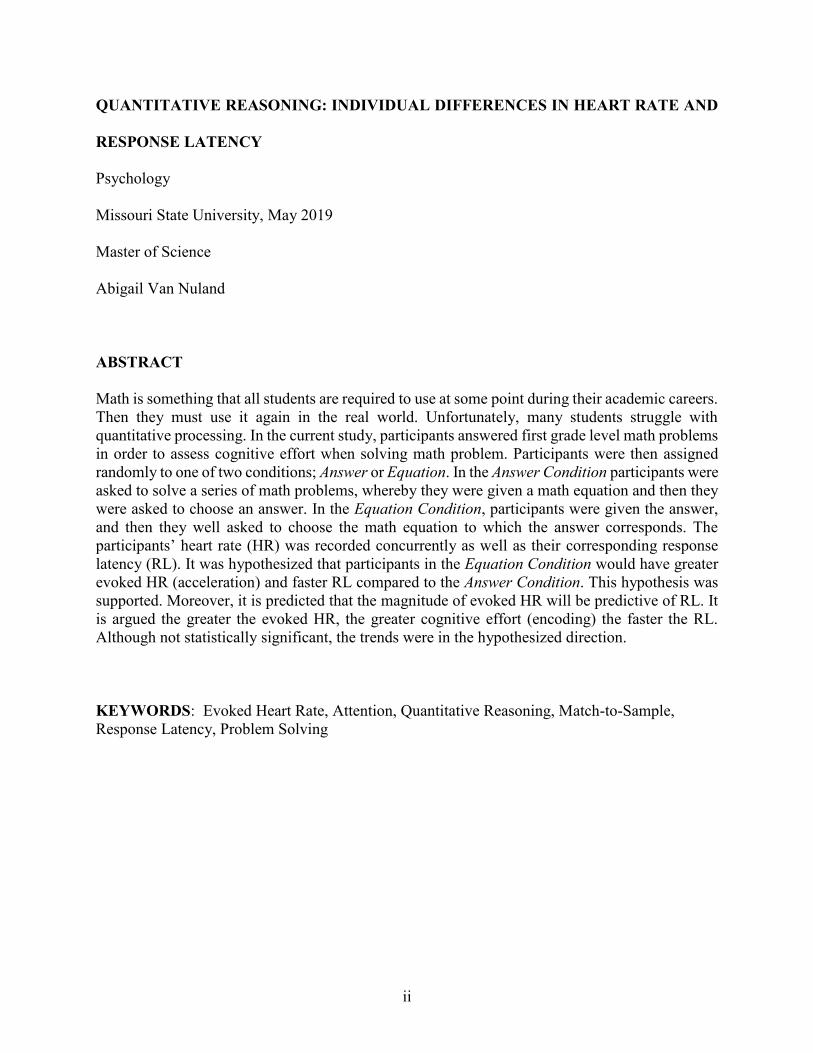
ABSTRACT
Math is something that all students are required to use at some point during their academic careers.
Then they must use it again in the real world. Unfortunately, many students struggle with
quantitative processing. In the current study, participants answered first grade level math problems
in order to assess cognitive effort when solving math problem. Participants were then assigned
randomly to one of two conditions; Answer or Equation. In the Answer Condition participants were
asked to solve a series of math problems, whereby they were given a math equation and then they
were asked to choose an answer. In the Equation Condition, participants were given the answer,
and then they well asked to choose the math equation to which the answer corresponds. The
participants’ heart rate (HR) was recorded concurrently as well as their corresponding response
latency (RL). It was hypothesized that participants in the Equation Condition would have greater
evoked HR (acceleration) and faster RL compared to the Answer Condition. This hypothesis was
supported. Moreover, it is predicted that the magnitude of evoked HR will be predictive of RL. It
is argued the greater the evoked HR, the greater cognitive effort (encoding) the faster the RL.
Although not statistically significant, the trends were in the hypothesized direction.
KEYWORDS: Evoked Heart Rate, Attention, Quantitative Reasoning, Match-to-Sample,
Response Latency, Problem Solving
iii
QUANTITATIVE REASONING: INDIVIDUAL DIFFERENCES IN HEART RATE AND
RESPONSE LATENCY
By
Abigail Van Nuland
A Master’s Thesis
Submitted to the Graduate College
Of Missouri State University
In Partial Fulfillment of the Requirements
For the Degree of Master of Science, Psychology
May 2019
Approved:
D. Wayne Mitchell, Ph.D., Thesis Committee Chair
Melisa D. Fallone, Ph.D., Committee Member
Bogdan Kostic, Ph.D., Committee Member
Julie Masterson, Ph.D., Dean of the Graduate College
In the interest of academic freedom and the principle of free speech, approval of this thesis
indicates the format is acceptable and meets the academic criteria for the discipline as
determined by the faculty that constitute the thesis committee. The content and views expressed
in this thesis are those of the student-scholar and are not endorsed by Missouri State University,
its Graduate College, or its employees.
iv
TABLE OF CONTENTS
Introduction Page 1
Quantitative Processing Page 1
Attention and HR Page 5
Individual Differences in HR Page 7
Attention and Unconscious Thought Page 9
The Aims of the Current Study Page 10
Method Page 12
Participants Page 12
Materials Page 12
Procedure Page 14
Results Page 16
Data Screening Page 16
Demographics Page 16
Primary Analyses Page 17
Changes in Evoked HR across DMTST Non-Repeating
Problems
Page 18
Changes in Evoked HR across DMTST Repeating Problems Page 18
Changes in Evoked HR within DMTST Problems Page 20
Changes in RL across DMTST Non-Repeating Problems Page 21
Correlational Analyses: Relationship between HR and
Subsequent RL
Page 23
Discussion Page 26
Evoked HR Page 26
Response Latency Page 29
The Relationship between HR and RL Page 31
Limitations Page 31
Future Research Page 31
Conclusions Page 33
References Page 34
Appendices Page 37
Appendix A. Problems Utilized in Stimuli Page 37
Appendix B. Stimulus Equation Condition Page 38
Appendix C. Stimulus Answer Condition Page 39
Appendix D. Institutional Review Board Approval Page 40
Appendix E. Informed Consent Form Page 41
Appendix F. Demographics Questionnaire Page 42
v
LIST OF TABLES
Table 1. Inferential Statistics for One-Sample t-test Comparison for Non-
Repeated Stimulus Page 20
Table 2. Inferential Statistics for One-Sample t-test Comparison for Repeated
Stimulus Page 21
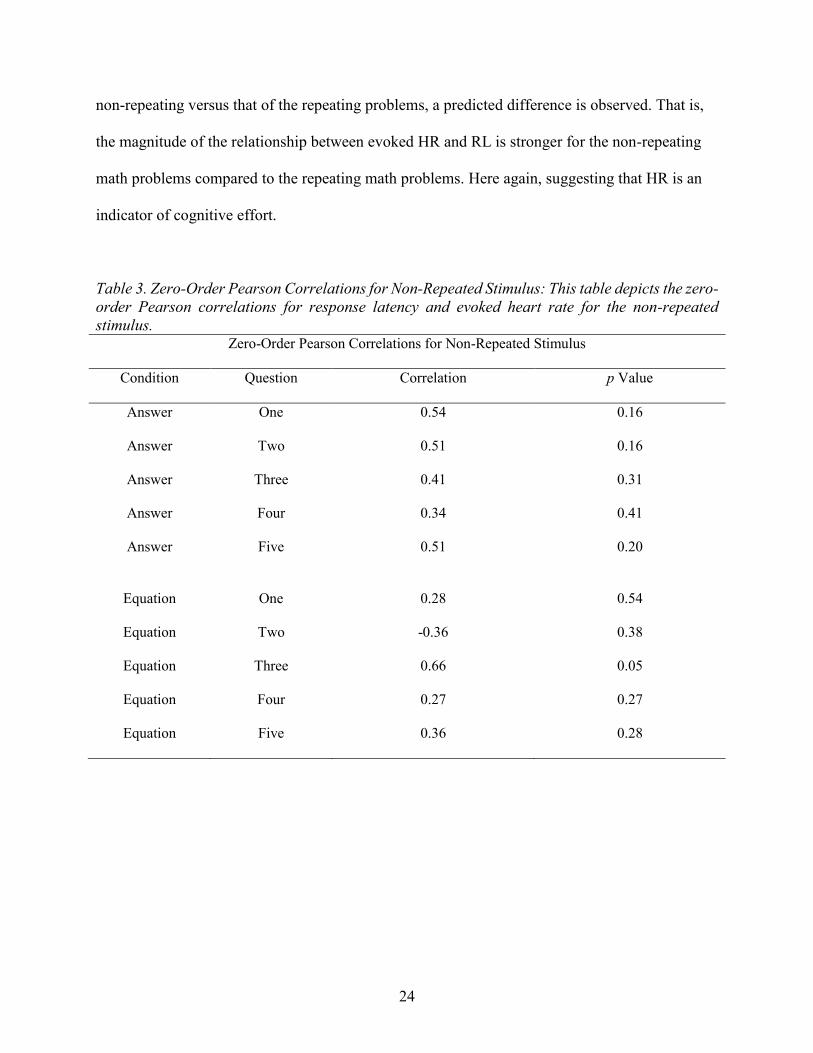
Table 3. Zero-Order Pearson Correlations for Non-Repeated Stimulus Page 24
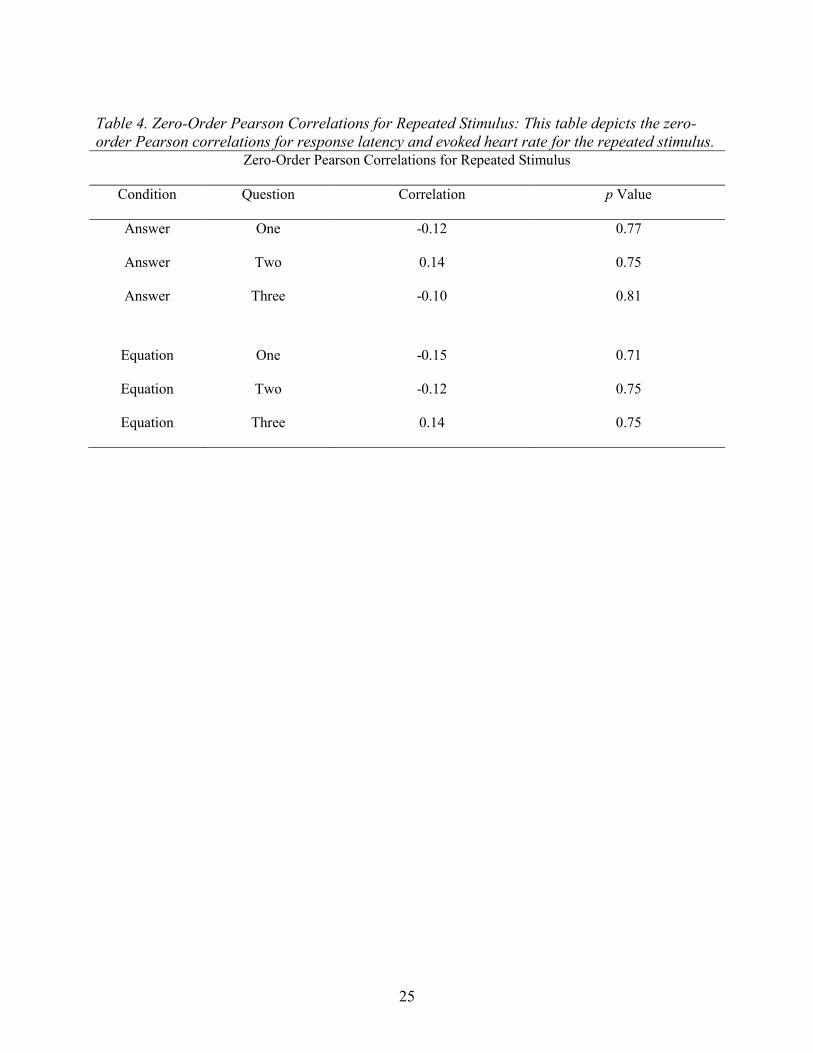
Table 4. Zero-Order Pearson Correlations for Repeated Stimulus Page 25
Table 5. Effect Sizes for Heart Rate Difference from Zero During Problem
Presentation Page 29
vi
LIST OF FIGURES
Figure 1. Evoked Heart Rate During the Problem Presentation During Non-
Repeated Stimulus Page 19
Figure 2. Evoked Heart Rate Differ During the Problem Presentation During
Repeated Stimulus
Page 19
Figure 3. Response Latency Across Problems During Non-Repeated Stimulus Page 22
Figure 4. Response Latency Across Problems During Repeated Stimulus Page 23
1
INTRODUCTION
Students often complain when they are required to enroll in a course that includes a
mathematical component, even though basic math is something they often use in day to day life.
These courses are encountered initially when students first enter school, and never go away no
matter what path in life they take. Whether it is advanced calculus, or counting change in a cash
register, quantitative reasoning is something that all students are forced to become comfortable
with. Even though students are exposed to this form of information at an early age, there are
some that never quite grasp an understanding of it.
Quantitative Processing
Successful problem solvers, and unsuccessful problem solvers have been found to exhibit
different methods in the way they solve quantitative problems. It has been shown that
unsuccessful problem solvers only base their solution to a quantitative problem on numbers,
while successful problem solvers construct a model (Hegarty, Mayer, & Monk, 1995). While this
study was done using word problems, it seems that it is safe to generalize the results to basic
algebra due to the fact that it involves quantitative intelligence. Essentially, this means that
unsuccessful solvers are focused completely on the numbers and leave the context of the problem
out of their solution. Whereas successful problem solvers put it into context and create a model
with the information provided: they realize that all mathematical concepts are related. It was not
clear as to whether this was a conscious, or unconscious process. It seems that there are
individual differences in the solving of math problems. Interestingly, unsuccessful problem
solvers did not change their strategy as the trials progressed. Even when faced with failure, they
2
did not change the way they approached the problem. They showed the same pattern of errors
through the study (Hegarty, Mayer, & Monk, 1995). It is fair to question whether this is because
they are not aware of any other problem-solving strategies. Students are often punished when
they do not solve problems in the same manner as their teacher, even if they arrive at the same
correct answer. It is obvious that many students struggle in math courses, but is this because we
have failed to teach them more than one problem solving method?
There is evidence that this may be true. One reason that Japanese students often
outperform American students in mathematics is because American students are often taught
short cuts to solve math problems with emphasis on getting the correct answer, whereas Japanese
schools emphasize understanding how the answer is achieved (Stevenson & Stigler, 1992). This
emphasis on understanding how an answer is achieved, versus just knowing what the correct
answer is, is theorized to be an important part of learning math. While we can see that teaching
students how to understand what they are doing in math improves their ability to solve problems,
this is not a cure-all solution for students who struggle in math.
It has been shown that math elicits emotional and behavioral reactions from some
individuals. For example, math can evoke an emotional, panicked response from students, and
learners of all demographics (Tobias, 1978). These emotional responses are defined typically as
math anxiety. Math anxiety has been shown in every demographic and can have negative
impacts on education.
Some researchers argue that self-reported math anxiety is just another symptom of overall
trait anxiety. Dreger and Aiken (1957) hypothesized that trait anxiety and math anxiety were
conceptually different ailments, but this was not corroborated until Hembree (1990) found that
there a moderate correlation (r = .38) between trait anxiety and math anxiety. While individuals
3
who self-report high levels of math anxiety do tend to score higher on traditional measures of
trait anxiety, these two types of anxiety are clearly separate entities. Consequently, researchers
have suggested that math anxiety, and test anxiety are interchangeable. Similarly, it was found
that the relationship between math anxiety and test anxiety share a coefficient of determination
(R2) of .37 (Dew, Galassi and Galassi, 1983). This means that only 37% of variance in one of
these variables can be accounted for by the other variable. Researchers have since concluded that
it is unlikely that math anxiety is completely restricted to testing situations, and that these two
types of anxiety are in fact different (Hembree, 1990). While math anxiety does have
relationships with both trait anxiety, and test anxiety, it has been shown to be its own type of
anxiety.
Math anxiety has been shown to have detrimental effects on the education of individuals
who must live with it. It has been found that there is a positive relationship between self-reported
math anxiety and the time it takes to respond to a math problem, which indicates reduced
processing efficiency (Hunt et al., 2015). This is quantitative evidence that math anxiety, and
inefficient processing both contribute to inappropriate mapping and modeling of numerical
problems. This is supported as well by the fact that an increase in math anxiety is reflected in an
increase in fixations and dwell time when using eye tracking technology (Hunt et al., 2015). Eye
tracking has become a common way to study specific forms of anxiety. When spider-anxious
individuals are presented with a picture of an arachnoid, participants tend immediately and fixate
on the creature, then will avoid attending to the picture for the rest of the trial (Rinck & Becker,
2006). Individuals who did not report spider-anxious tendencies did not show these same
patterns of fixations. These are the same patterns we see with individuals with math anxiety.
4
They immediately attend, and fixate to the numbers, but then avoid them for the rest of the trial
(Hunt et al., 2015).
In academic settings, this could lead to slow completion of tests and homework for a
math class, and moreover, in natural settings math issues could affect creating a budget and
taking advantage of store discounts. Math anxiety prevents consumers from correctly calculating
discount prices and going for deals that are not as beneficial to them (Suri, Monroe, & Koe,
2013). For example, when given the choice between an absolute discount ($10 off a $50
purchase) and a relative discount (20% off a $50 purchase), they are more likely to pick the item
that is only $10 (Suri et al., 2013). The same study found that this effect is still there even when
the participant is offered a greater relative discount ($10 off a $50 purchase, and 25% off a $50
purchase) (Suri et al., 2013). Over time, these deficits can build up and have real impact on these
individuals’ lives. If the student misses out on good test scores on every math test they take, their
GPA will decrease, and they may not have the opportunities for higher education than their non-
math anxious classmates. All students are consumers, or will someday become consumers, and if
they are not taking advantage of as many discounts as their non-math anxious peers, they may
pay for it financially as well.
As noted above, math anxiety can affect individuals emotionally and behaviorally,
however such findings have led researchers to questions whether math anxiety has physiological
symptoms. When math-anxious individuals solved difficult math problems, the evoked HR
increase across trials, but not for verbal problems of the similar difficulty (Faust, 1992). The
comparison between the verbal problems, and the math problems demonstrated that the evoked
HR response could be a function of math anxiety. Students who did not report symptoms of math
anxiety showed the same pattern of HR acceleration between the verbal and math problems
5
(Faust, 1992). This is evidence that teaching students the logic of solving math problems will
increase their ability to solve them, but that some students may have a physiological and
behavioral reaction when it comes to learning math. The development of math anxiety can start
at an early age, and the effect can be experienced throughout life. The magnitude of gray matter
found in the brain at age 8, has been found to predict longitudinal gains in quantitative ability,
but not in reading abilities (Evans et al., 2015). Intrinsic connectivity analysis revealed that the
strength of functional coupling among these regions also predicted gains in quantitative abilities.
The children who had low levels of gray matter had more reports of math anxiety later in life
(Evans et al., 2015). Once again, this is evidence that individual differences in quantitative
processing may be more than just a lack of motivation or effort, but instead is linked to a
physiological deficiency.
Obviously, there are individual differences in the ability to solve math problems, with or
without the presence of math anxiety. It is the contention of the author that individual differences
in HR could be a reliable assessment of cognitive effort when solving math problems. The
following section is a brief review of link between attention and HR in an effort to support the
use of HR as an indicator of cognitive activity when solving math problems.
Attention and HR
Attention is a process that takes place outside of our conscious awareness. According to
Gibson, attention refers to perceiving in relation to a task or goal which is externally or internally
motivated (Gibson & Rader, 1979). In Gibson’s theory of perception, motivation is an important
component of attention. Perceiving an object or event is not enough to result in learning. One has
to be motivated and learn to attend selectively to the stimulus event. The person may orient their
6
attention to a puppy playing on the grass, hence perceive this stimulus event; but the person who
selective attends to aspects of the puppy’s play, and decides to go and pet the puppy is to it has
tailored their behavior to this stimulus event; therefore, joining perception, attention and the
individual’s subsequent behavior. According to Gibson, for someone to be described as attending
to a stimulus, they must be motivated to perform a task or achieve something (Gibson & Rader,
1979). Gibson emphasizes that motivation is a large part of attention. This may not have to be an
action. For example, I may be motivated to look at the puppy playing in the grass because I see
something moving and my superior colliculus is stimulated. Unlike perception, issues with
attention are usually due to a behavioral or psychological deficiency (Gibson & Rader, 1979).
Learning through attention is generally known as the perceptual pickup of information that has
optimal utility for the task at hand, resulting in perception that is efficient and economical for
performance (Gibson & Rader, 1979).
Jennings (1986) hypothesized that the act of attending may serve to allocate energy to
support processing of information by changing cardiac function. Essentially, Jennings believed
that HR could be an indicator of other processes, such as attention. The physiological measure of
HR as an indicator of other psychological functions is not a new concept but is not a concept that
has been explored fully. Processes outside our conscious attention are very difficult to measure,
but not impossible with the physiological measures and technology we have today. Attention can
be selective and/or an unconscious process. Regardless, attention that can be very difficult to
measure directly. It has been suggested that physiological measures provide information about
attention (Jennings, 1986). Jennings suggests an organizational framework to determine whether
a process actually measures attention. First, is an autonomic change an indicator of attention?
Next, does autonomic change facilitate attention? Last, does autonomic change regulate
7
attention? If these three questions can be answered positively, we can be confident that attention
is being measured, according to Jennings.
HR itself is measured traditionally using “beats per minute.” Simply put, HR is the
number of times your heart beats per minute, otherwise known as your pulse. Resting HR is
typically between 60 – 100 beats per minute. Athletes tend to have very low resting HRs, while
overweight people tend to have very high resting HRs. In research, HR tends to be monitored by
an electrocardiograph. An electrocardiograph measures electrical impulse generated by the heart,
which cause the heart to contract and pump blood through the body (Prajent, 2011). There are
many ways to measure HR, but an electrocardiograph is by far the most accurate. The electrical
impulses are generated by the depolarization and repolarization of the heart. Repolarization is the
relaxation of the heart muscle, while depolarization is when the heart muscle clenches. An
electrocardiograph uses electrical nodes on the ankles and wrist to detect HR. Employing HR as
a measure of attention provides a means by which researchers can observe small, unconscious
changes in the human psyche with accuracy. In the past, this science has relied on self-report
measures, and other less accurate measures to define and study concepts. It is the contention of
this author that physiological changes in HR can been used to assess individual differences in
cognitive effort. However, there are several factors that influence HR. For example, body
temperature, physical activity, medication, and emotions can all effect HR (Stauss, 2003). Hence
researchers should make note of these confounding factors when assessing changes in HR. Such
changes in HR could be something other than the treatment effect, resulting in a Type 1 error.
Individual Differences in HR. While Jennings’s (1986) approach to HR was theoretical,
HR has been shown to be an indicator of attention in several populations. Richards and Casey
(1991) found that during sustained attention HR decelerated below baseline (pre-stimulus
8
presentation) and when attention was terminated, HR returned to the baseline level. Although
this study was conducted on infants, it is often generalized to adult samples. It is particularly
interesting because, we see the relationship between HR and attention, but it also introduced a
method for investigating visual information processing during infancy.
HR variability has also been found on several different cognitive tasks. One study found
that tasks such as solving math problems and solving anagrams increased HR while excess noise
and watching flashing lights decreased HR (Lacey, Keagan, Lacey & Moss, 1963). First, this is
interesting because we see HR variability in different situations, but the situations where HR
decreased involved little to no cognitive effort. Watching lights flash requires almost no
cognitive effort, whereas the participants much cognitively engage to accurately solve the math
problems. This is support once again for Jennings’s theoretical framework that HR and sustained
attention have a relationship, because here we see variability based on the task. This study also
generalized that cardiac acceleration is related directly to rejection of environmental input (Lacey
et al., 1963). Essentially, the researchers argued that HR variability is associated with changes in
mental effort. This is the first important step in supporting Jennings’s theoretical framework.
This evidence provides support that HR has a place in psychological cognitive research, giving
unconscious thoughts and processes to be studied with accuracy. Later, it was found that HR
deceleration facilitates attention in both the intake and output of information processing (Lacey
& Lacey, 1974). Essentially, HR slows down as our body interprets information, and engages in
a cognitive task.
HR has also been shown to represent other unconscious processes. For example,
Quintana et al. (2012) found that HR variability as a marker for the ability to respond to social
and emotional cues. That is the greater HR variability the better one is at recognizing emotional
9
cues. This is, important because there is increasing evidence that cognitive processes and HR are
associated, but it remains unclear the interaction between problem complexity, emotions, and
HR. Emotions are a complex cognitive process and it can be difficult to assess on how others are
feeling or have trouble “reading a room.” Using HR as an individual difference measure of
attention and/or emotion could improve our ability to identify individuals with these cognitive or
emotional issues. Researchers have been able to demonstrate individual differences in HR on
several tasks, but little work has been done when relating attention, heart rate, and unconscious
thought.
Attention and Unconscious Thought. Attention is an often studied topic in the field of
psychology. For example, researchers have explored attention bias in children using HR as their
measure of attention. They found that vicarious learning led to lasting changes (Reynolds, Field,
& Askew, 2014). As well, HR, although not statistically significant (small sample size), was
correlated positively with avoidance behavior (slower response times in fear induced situations).
While this study is not focusing on longitudinal learning, this is evidence that learning, and
attention can be measured using HR. And too, the direction and magnitude of HR change has
been found to be a function of cognitive demands. Hershman and Gibson (1979) found that,
depending upon task demands and environmental stimulation, differential direction of evoked
HR was observed. HR acceleration was observed during mental elaboration, particularly on the
easy tasks, and HR deceleration when external stimulation (e.g., white noise) was a presented
during completing a cognitive task. This again, lends support for the Lacey and Lacey (1974)
environmental intake-rejection hypothesis, and moreover, demonstrated that that physiological
measures such as HR can be used a measure of attention.
10
Both the above studies show that HR and attention are correlated, however, the
magnitude of this relationship and the theoretical interpretation is still an empirical question.
Hershman and Gibson (1979) had a small sample, Reynolds et al. (2014) had a sample of
children, which one could argue that this limits the generalization of their respective findings.
Although Reynolds et al. (2014) found that attentional bias and fear related learning was related
to anxiety and subsequent changes in HR, the magnitude of this relationship is questionable
given that the measures of anxiety were based upon the children’s self-reports via anxiety and
fear belief questionnaires.
The Aims of the Current Study
The aim of the current study is to investigate the relationship between attention, as
assessed via HR, while solving simple math problems. Participants were given five first grade
level math problems. Participants were given either a math equation, and asked to select the
correct answer, or given the answer, and asked to select the correct equation. In the condition
that is referred to as Equation, the participants were given a math problem and asked to select an
answer. In the condition that will be referred to as Answer, the participants were given the
answer to a math problem and then asked to select the problem it belongs to.
It was predicted that there will be individual differences in evoked HR as function of
condition. It is hypothesized that the participants in the Equation Condition will display greater
HR acceleration during the presentation of the question compared to participants in the Answer
Condition. Also, it was hypothesized that participants in the Answer Condition will have slower
RL then participants in the Equation Condition, meaning that it will take them longer to solve the
math problem. The differences in HR are argued to represent individual differences in cognitive
11
processing effort. Given such individual differences, a secondary hypothesis was that HR, within
conditions, would be correlated with RL. That is that the greater the evoked HR (acceleration),
which we argue indicates cognitive effort, the faster the participant’s RL. It is assumed that the
magnitude of HR acceleration would indicate more in-depth processing of the math equation,
hence a more readiness to respond.
12
METHOD
Participants
Given that HR was the primary dependent variable, the a priori power analysis was
employed using an estimated effect size (Cohen’s f = .35) based upon to the literature review and
recent MSU theses (e.g., Eschman, 2013; Ham, 2015) assessing evoked HR on a match-to-
sample task. A literature review of HR differences across a variety of studies revealed the
measure of eta squared between two studies was 0.22, 95% CI (0.07, 0.43). The average Cohen’s
d measure for these studies was 1.00, 95% CI (0.42, 1.58). And converting the Cohen’s of 1.00
to an eta squared, results an eta squared of .20, which is in concordance with observed effect
sizes of evoked HR found by Eschman (2013) and Ham (2015). Thereby, using GPower,
employing a power of .80, an alpha of .05 for the primary statistical analysis (a mixed ANOVA
(1 between X 5 within) it was found that a sample size of 21 participants per condition would be
appropriate.
The participants in this study (N = 37) were recruited from an introductory psychology
course at a midsized midwestern university. The participants were given course credit for their
participation. The sample of participants was compiled of females (n = 20) and males (n = 17).
The mean age of participants was 19.73 (SD = 2.88) years. The maximum age of participants
was 32 years, and a minimum of 18 years.
Materials
A Bio-Pac electrocardiograph was used to measure HR via a BIOPAC System MP30
amplifier. Disposable leads (Medicotest Blue Sensor, N-00-S) were placed on both the
13
participant’s ankles and on their left wrist. The BIOPAC System was interfaced with the
laboratory computer (Dell OPTIPLEX GX-820) which recorded and stored all the HR data.
In order to ensure the math problems were equated, 38 participants were required to
answer a series of simple math problems. Five math problems were selected randomly from a 40
question quiz given to this sample upper classman undergraduate psychology students.
Demographic information was not collected and is not expected to be pertinent to calibrating the
stimulus. All 40 quiz questions were written to be at a first-grade level of difficulty. The math
problems that were found to have the same percentage correct (100%), were assigned a number,
then five problems were selected randomly employing a random number generator. The final
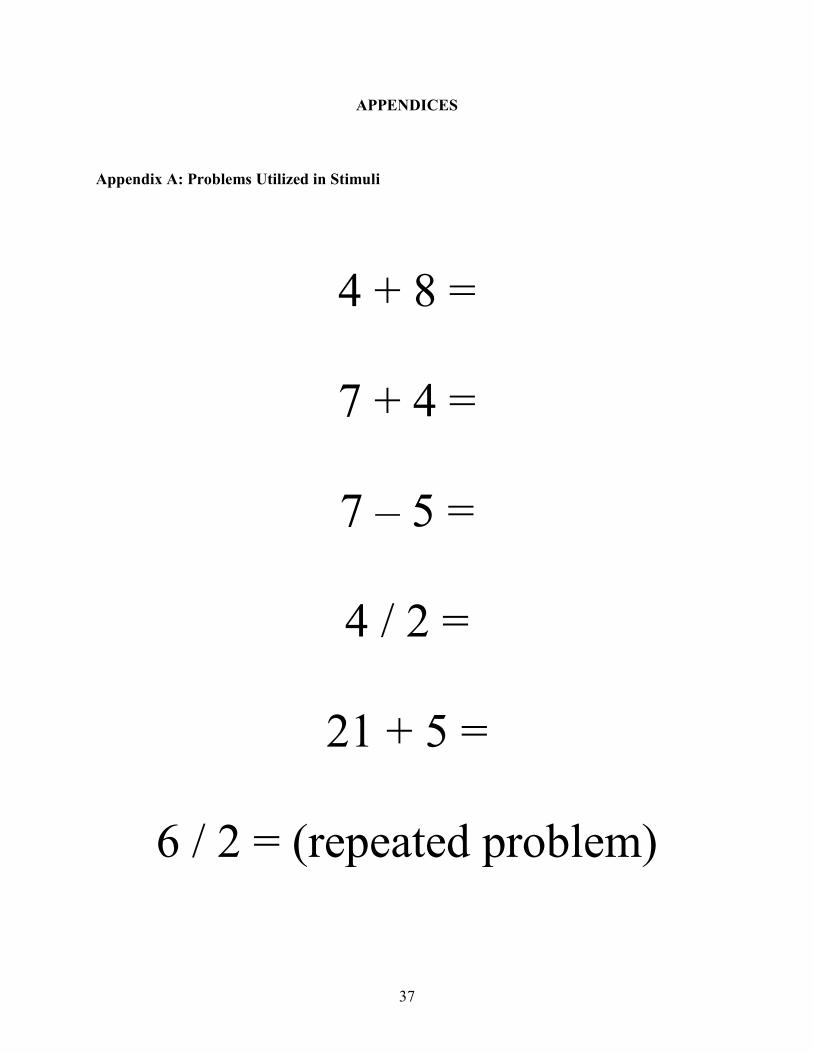
math problems used in this study are listed in Appendix A.
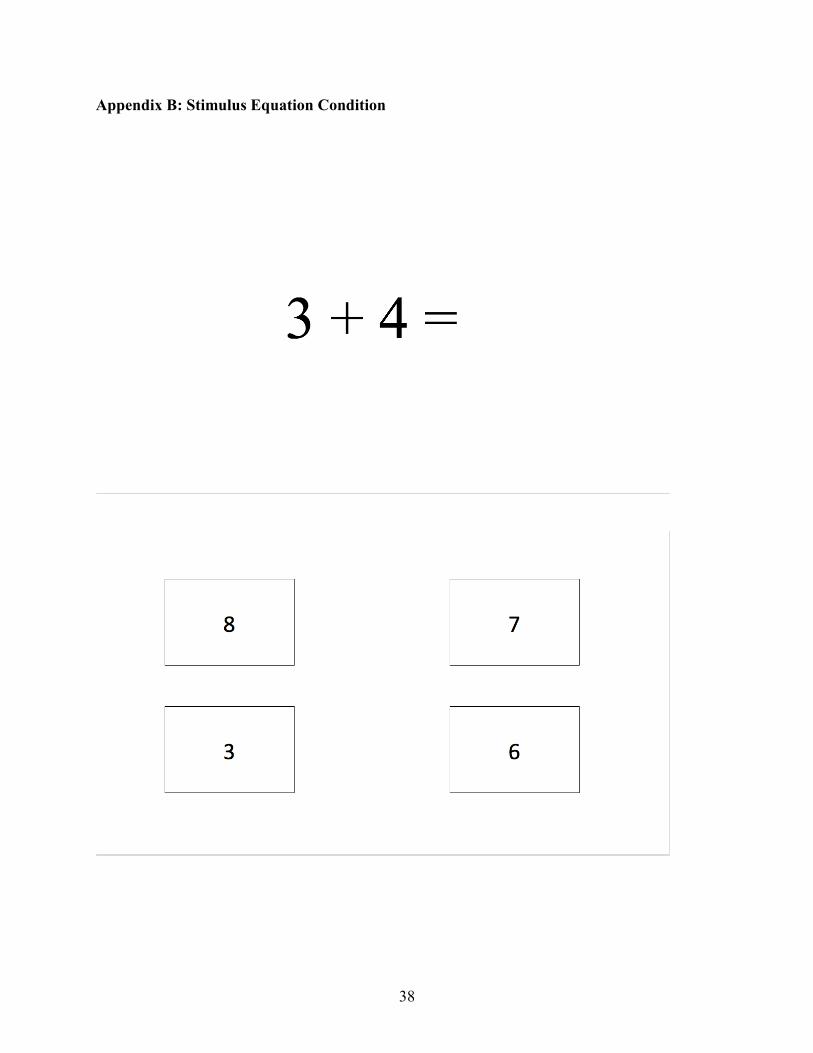
The equated math problems were presented via a Delayed Match-to-Sample Task
(DMTST). The participants were assigned to one of two conditions; an Answer or Equation
condition. In both conditions’ participants were asked to solve the same 5 math problems,
however the problem characteristics differed depending upon assigned condition. In the Equation
Condition, participants were given the answer, and then they were asked to choose the math
equation to which the answer corresponds. An Example of a trail in the Equation Condition can
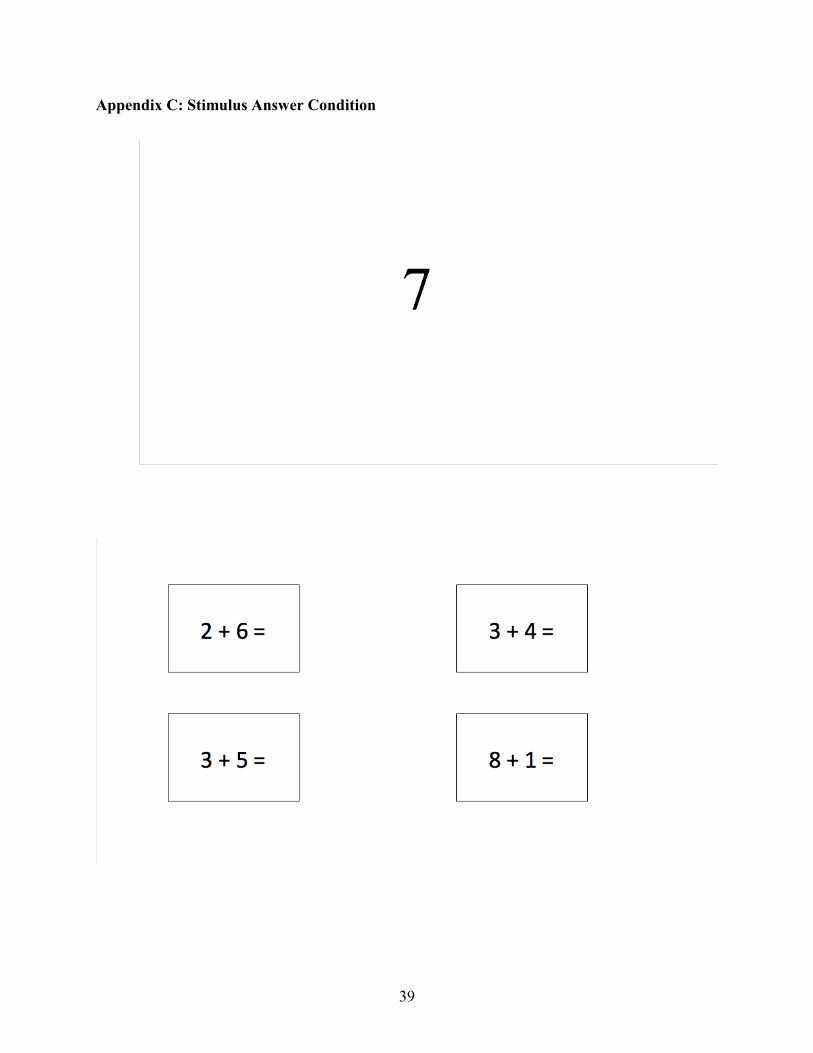
be found in Appendix B. In the Answer Condition participants were given a math equation and
then they were asked to choose the corresponding correct answer. An Example of a trial in the
Answer Condition can be found in Appendix C.
A sixth problem was selected to be repeated three times after the original 5 problems. The
repeated problem was employed as a manipulation check, because theoretically, cognitive effort
should be minimal (no significant change in evoked HR) given the problem has been solved.
14
Procedure
The study was first sent to the Institutional Review Board for approval and did not
continue until approval was given (see appendix D). The approval code for the study was IRB-
FY2019-109 on October 23rd, 2018. Upon arriving at the study, the participants were given a
brief orientation to the study, then asked to read and sign a consent form (see Appendix E).
Contingent on their consent to participant, each participant was asked to complete a brief
Demographic Form (see Appendix F) assessing age and information that could have a direct
effect on their respective HR (e.g., daily exercise, recent food and caffeine intake, medications,
and any pre-existing cardiac conditions). These questions are based loosely upon conditions
Strauss (2003) suggested affect HR. Once consent was obtained, the participant was given a
shortened version of the quantitative portion of the WAIS in order to establish equality of math
ability within conditions. Time to answer the WAIS math questions was used as an assessment of
each participant’s math ability.
Once the participant completed the WAIS questions, they were seated approximately 65
cm in front of the image display monitor, whereby the disposable electrodes were attached. The
participants were asked to sit relaxed and quiet, and to restrict body movement. At this point,
approximately two minutes of resting HR was recorded. An average of the resting HR was used
to represent each participant’s Baseline HR. Once the resting HR was established the DMTST
began.
The DMTST was presented using a PowerPoint presentation. The presentation went as
follows: a stimulus sample was presented for 5 sec, then an offset of the sample stimulus for 5
sec (a blank black screen was present), then the presentation of 4 test math problem solutions for
5 sec, however only one problem solution is correct. The participants were asked to select the
15
from the 4 test stimuli that matches the sample stimulus solution. RL was calculated from the
onset of the 4 test stimuli to the verbal response from the participant selecting of one of the test
stimuli.
For the Equation Condition the sample stimulus was the math equation and the 4 test
stimuli were possible answers. Here the goal was for the participant to select correctly the test
stimulus answer that corresponded to the sample stimulus equation. See Appendix B for an
equation DMTST example. Conversely, in the Answer condition, the sample stimulus was the
answer to the math equation. The test stimuli were 4 math equations. The goal was for the
participant was to match correctly the test stimulus equation that corresponded to the sample
stimulus answer. See Appendix C for an answer DMTST example. Both the Answer and
Equation participants were given 5 novel DMTST math problems, and then the 6th DMTST
problem was repeated for 4 more trials. The repeating problem is to establish a post hoc control
(manipulation check) establishing that changes in HR are a function of cognitive effort.
16
RESULTS
Data Screening
Before analysis, the data was screened for accuracy to assure that the data were entered
correctly. Two different researchers entered the data into separate excel spreadsheets. The
researchers then checked the other data for accuracy, and the findings were compared. The data
set was screened for accuracy again after the data was uploaded into SPSS. This last accuracy
check found that none of the values were out of bounds and appeared to be correct.
The HR differences scores were calculated for all math problems in the form of (A – B)
where A represents the participant’s HR during the sample stimulus presentation and B
represents the participant’s baseline HR.
The data was then screened for outliers using Mahalanobis distance scores, and outliers
were removed from the data set. Last, the data was screened for assumptions of linearity,
normality, homogeneity, homoscedasticity, and additivity. It was found that all the assumptions
were met.
Demographics
The sample size for the Answer Condition was 19 participants, comprised of 7 females
and 12 males. The Equation Condition sample size was 18 participants, comprised of 13 females
and 5 males. The average age of the participants in the Answer Condition was 20.32 (SD = 3.73)
years, and for the Equation Condition the average age was 19.11 (SD = 1.45) years. The two
conditions also share the same median age of 19 years.
17
WAIS math Ability Assessment. Before data were collected via the DMTST, the
participants completed a shortened version of the WAIS math subscale to assess their cognitive
ability. The total time it took the participants to answer first 10 subscale problems was measured.
The mean time (seconds) to complete the ten problems was 127.99 (SD = 37.21) seconds. These
scores were then converted to Z Scores, with a maximum score of z = 3.04, and a minimum z
score of z = -1.54. No participant fell below 2 standard deviations from the mean when the scores
were standardized. The participants that scored above 2 standard deviations were not removed
from analysis due to the fact that they still had the cognitive capacity to solve the first-grade
level math problems.
There were no differences between conditions on the math ability assessment. In the
Answer Condition, the mean time to complete the math ability assessment was 124.86 (SD =
40.57) seconds. In the Equation Condition, the mean time to complete the math assessment was
127.88 (SD = 34.19) seconds. Based upon the results of an Independent t-test, no significant
differences in math ability was found, t(35) = 0.49, p = 0.63, d = .08.
Primary Analyses
There are three primary data analyses: (1) those to assess changes in evoked HR across
DMTST math problems between and within the Equation versus the Answer Condition for the
non-repeating and repeating math problems; (2) those to assess changes in RL across DMTST
math problems between the Equation vs the Answer Condition for the non-repeating and
repeating math problems; and (3) those used to explore the relationship between evoked HR and
RL within the Equation and Answer conditions. The results of each of these analyses are
presented in the following sections.
18
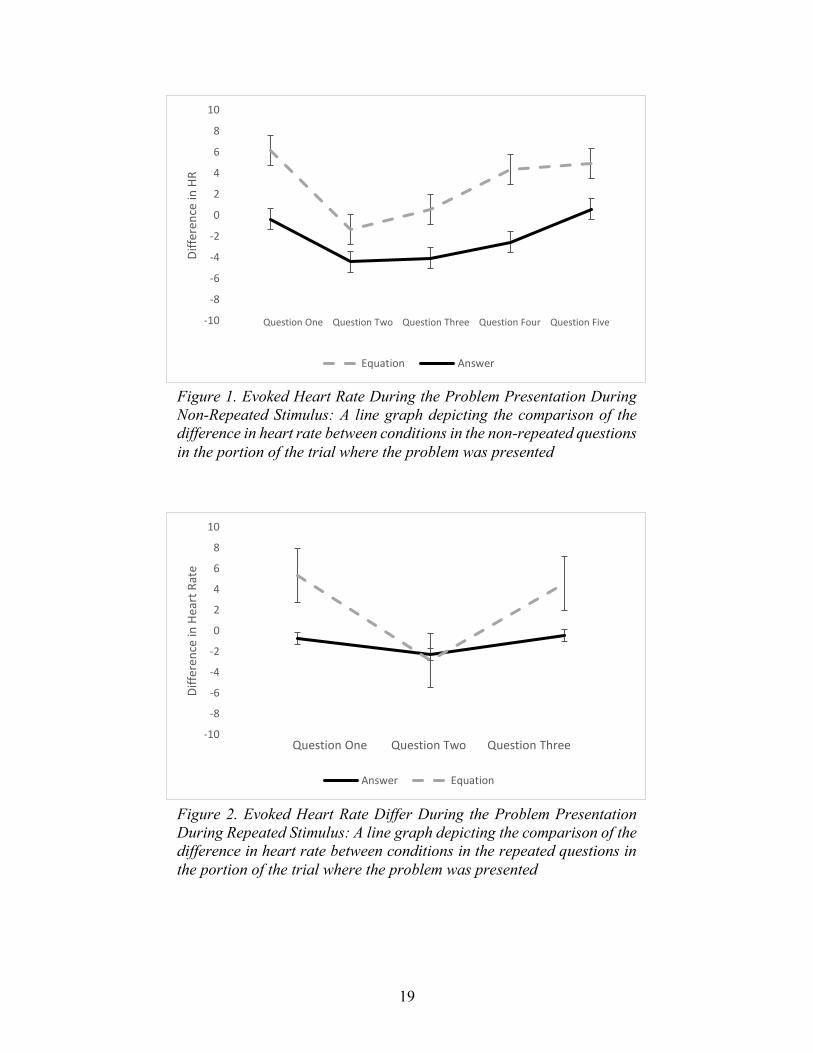
Changes in Evoked HR across DMTST Non-Repeating Problems. A 2 (Condition:
Answer, Equation) X 5 (DMTST Math Problems) ANOVA with repeated measures on the last
factor was calculated. The descriptive statistics for this comparison are presented in Figure 1. No
significant interaction was evident (F(1,35) = .34, p = .85; ɳp2 = .02). However, a significant
main effect for Condition was found (F(1,36) = 4.88, p = .04; ɳp2 = .21) indicating that the
average evoked HR for the Equation condition was significantly lower than that of the Answer
condition. Also, a significant main effect for Question was observed. (F(1,36) = 3.59, p = .02; ɳp2
= .17). In order to assess the differences in the questions, two separate repeated measures
ANOVAs were calculated, one for each of the conditions. For the Equation Condition, there
were significant differences between questions (F(4,45) = 2.09, p = .05). And based upon follow-
up LSD post hoc comparisons, it was found that Question 2 had significantly lower evoked HR
compared Question 1 (p = .02). No other questions were found to have a significant difference.
For the Answer Condition there were no significant differences between questions (F(4,49) =
1.73, p = .16).
Changes in Evoked HR across DMTST Repeating Problems. A 2 (Condition:
Answer, Equation) X 3 (DMTST Math Problem) ANOVA with repeated measures on the last
factor was calculated. The descriptive statistics for this comparison can be seen in Figure 2. As
predicted, no significant main effect of Condition (F(1,35) = 3.23, p = .06; ɳp2 = .17) or Question
was evident (F(1,36) = .02, p = .88; ɳp2 = .00); and no significant interaction was observed
(F(1,36) = .75, p = .75; ɳp2= .01). In summary, these findings lend support that HR is an indicator
of cognitive effort. Since the problem was solved no substantial cognitive effort is need for
solution, hence no change in evoked HR.
19
-10
-8
-6
-4
-2
0
2
4
6
8
10
Dif
fere
nce
in H
R
Question One Question Two Question Three Question Four Question Five
Equation Answer
-10
-8
-6
-4
-2
0
2
4
6
8
10
Dif
fere
nce
in H
eart
Rat
e
Question One Question Two Question Three
Answer Equation
Figure 1. Evoked Heart Rate During the Problem Presentation During
Non-Repeated Stimulus: A line graph depicting the comparison of the
difference in heart rate between conditions in the non-repeated questions
in the portion of the trial where the problem was presented
Figure 2. Evoked Heart Rate Differ During the Problem Presentation
During Repeated Stimulus: A line graph depicting the comparison of the
difference in heart rate between conditions in the repeated questions in
the portion of the trial where the problem was presented
20
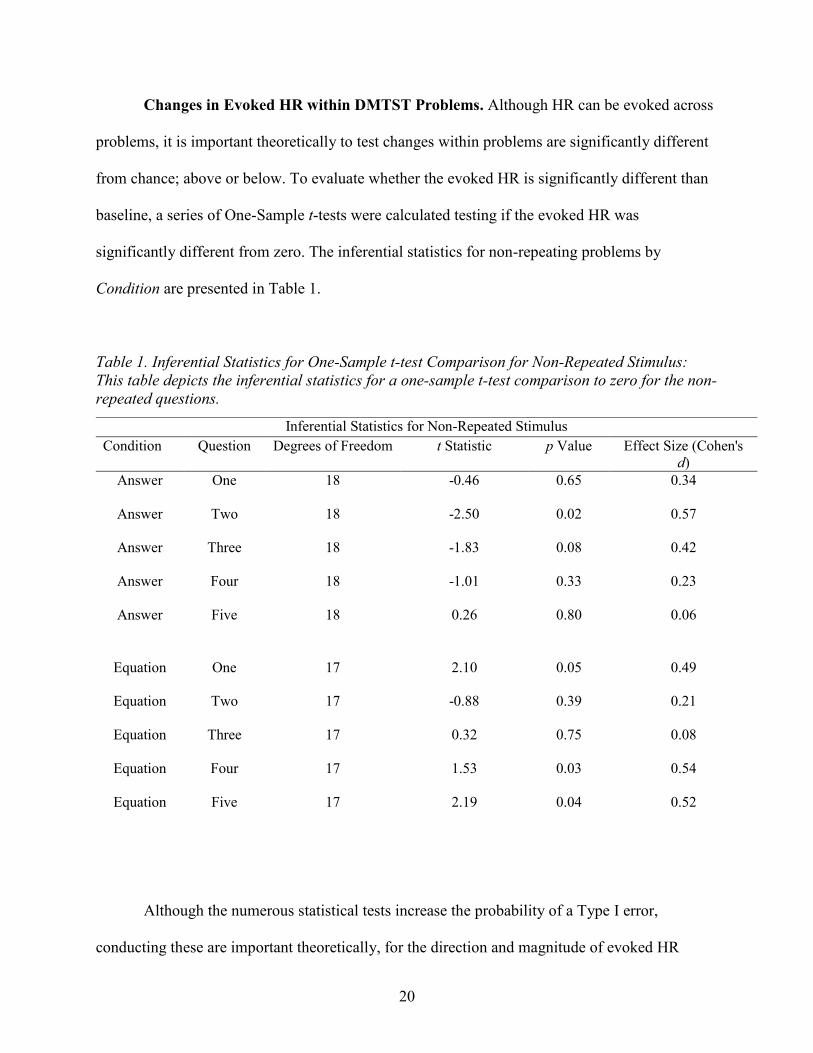
Changes in Evoked HR within DMTST Problems. Although HR can be evoked across
problems, it is important theoretically to test changes within problems are significantly different
from chance; above or below. To evaluate whether the evoked HR is significantly different than
baseline, a series of One-Sample t-tests were calculated testing if the evoked HR was
significantly different from zero. The inferential statistics for non-repeating problems by
Condition are presented in Table 1.
Table 1. Inferential Statistics for One-Sample t-test Comparison for Non-Repeated Stimulus:
This table depicts the inferential statistics for a one-sample t-test comparison to zero for the non-
repeated questions.
Although the numerous statistical tests increase the probability of a Type I error,
conducting these are important theoretically, for the direction and magnitude of evoked HR
Inferential Statistics for Non-Repeated Stimulus
Condition Question Degrees of Freedom t Statistic p Value Effect Size (Cohen's
d)
Answer One 18 -0.46 0.65 0.34
Answer Two 18 -2.50 0.02 0.57
Answer Three 18 -1.83 0.08 0.42
Answer Four 18 -1.01 0.33 0.23
Answer Five 18 0.26 0.80 0.06
Equation One 17 2.10 0.05 0.49
Equation Two 17 -0.88 0.39 0.21
Equation Three 17 0.32 0.75 0.08
Equation Four 17 1.53 0.03 0.54
Equation Five 17 2.19 0.04 0.52
21
change represents the type of underlying cognitive activity. Given an alpha correction, none of
the one-sample t-test can be viewed as statistically significant. However, the pattern (direction)
of difference between the conditions fit with the predicted hypotheses. That is, HR acceleration
was observed for the Equation condition HR deceleration was observed for the Answer
condition.
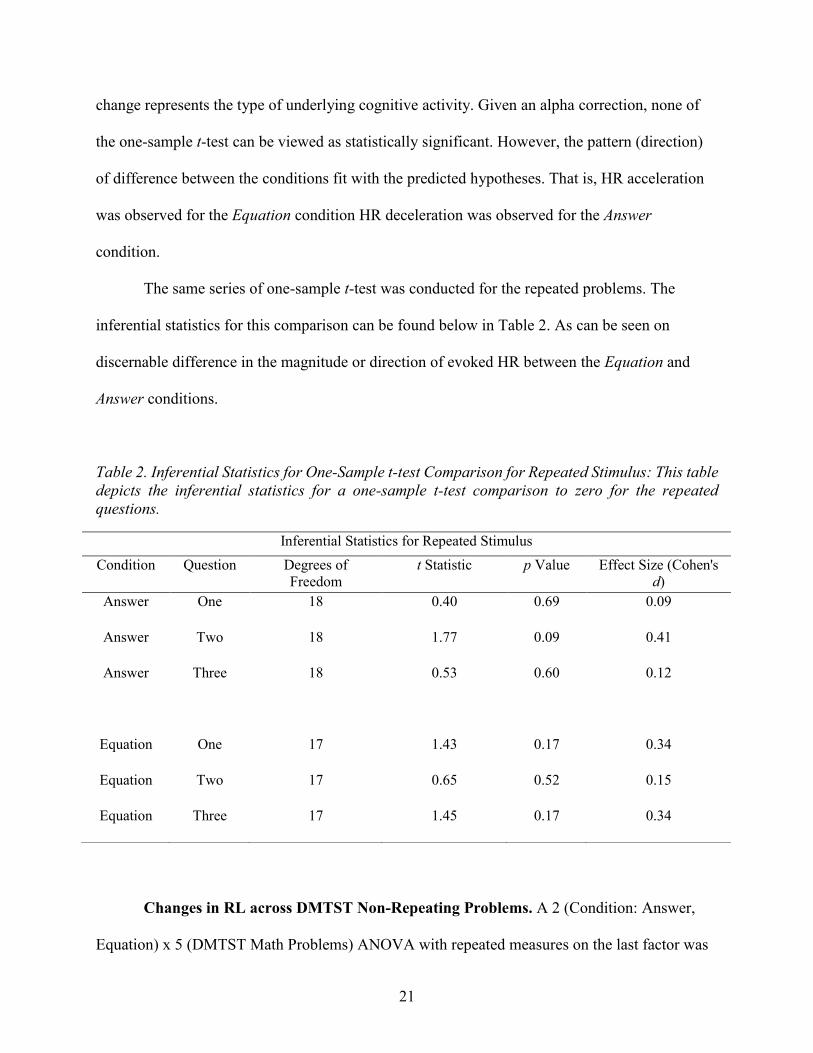
The same series of one-sample t-test was conducted for the repeated problems. The
inferential statistics for this comparison can be found below in Table 2. As can be seen on
discernable difference in the magnitude or direction of evoked HR between the Equation and
Answer conditions.
Table 2. Inferential Statistics for One-Sample t-test Comparison for Repeated Stimulus: This table
depicts the inferential statistics for a one-sample t-test comparison to zero for the repeated
questions.
Changes in RL across DMTST Non-Repeating Problems. A 2 (Condition: Answer,
Equation) x 5 (DMTST Math Problems) ANOVA with repeated measures on the last factor was
Inferential Statistics for Repeated Stimulus
Condition Question Degrees of
Freedom
t Statistic p Value Effect Size (Cohen's
d)
Answer One 18 0.40 0.69 0.09
Answer Two 18 1.77 0.09 0.41
Answer Three 18 0.53 0.60 0.12
Equation One 17 1.43 0.17 0.34
Equation Two 17 0.65 0.52 0.15
Equation Three 17 1.45 0.17 0.34
22
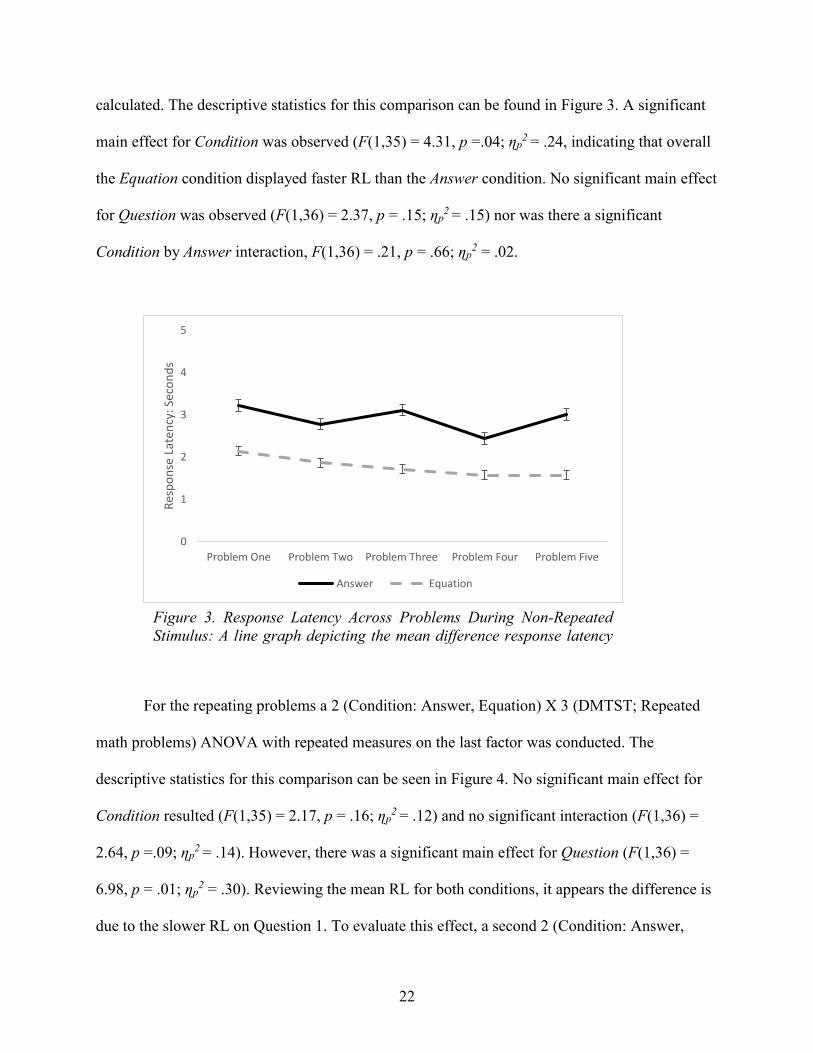
calculated. The descriptive statistics for this comparison can be found in Figure 3. A significant
main effect for Condition was observed (F(1,35) = 4.31, p =.04; ɳp2 = .24, indicating that overall
the Equation condition displayed faster RL than the Answer condition. No significant main effect
for Question was observed (F(1,36) = 2.37, p = .15; ɳp2 = .15) nor was there a significant
Condition by Answer interaction, F(1,36) = .21, p = .66; ɳp2 = .02.
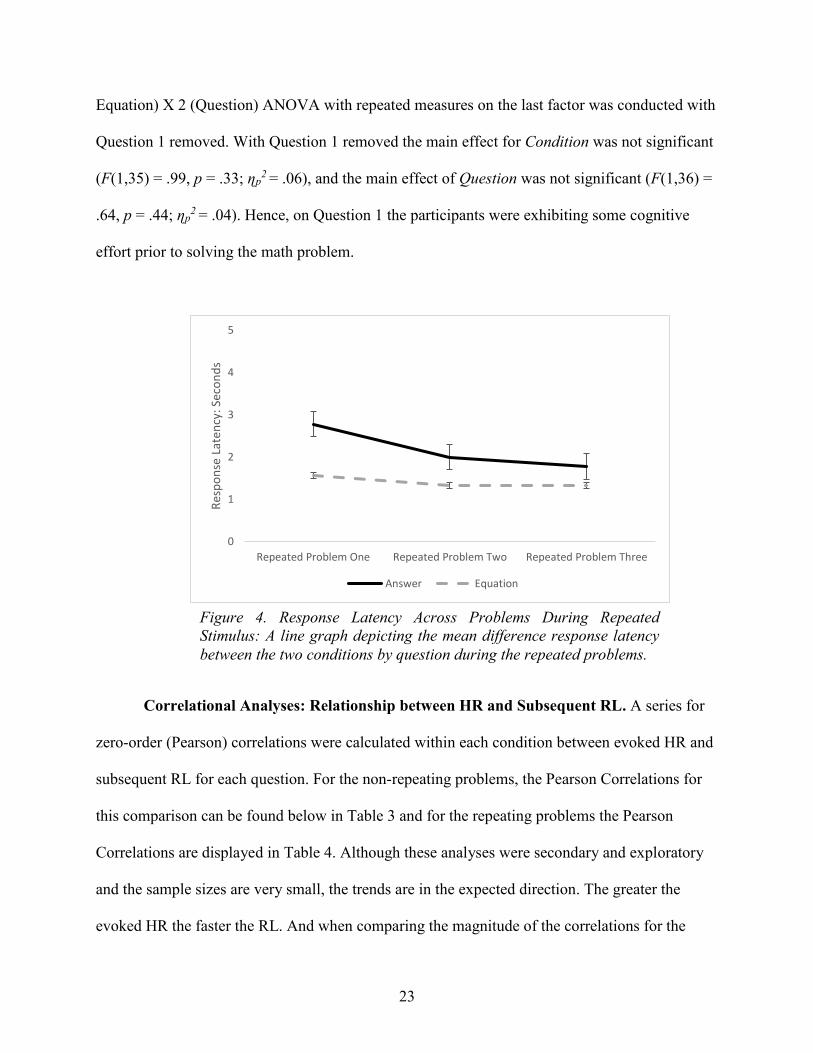
For the repeating problems a 2 (Condition: Answer, Equation) X 3 (DMTST; Repeated
math problems) ANOVA with repeated measures on the last factor was conducted. The
descriptive statistics for this comparison can be seen in Figure 4. No significant main effect for
Condition resulted (F(1,35) = 2.17, p = .16; ɳp2 = .12) and no significant interaction (F(1,36) =
2.64, p =.09; ɳp2 = .14). However, there was a significant main effect for Question (F(1,36) =
6.98, p = .01; ɳp2 = .30). Reviewing the mean RL for both conditions, it appears the difference is
due to the slower RL on Question 1. To evaluate this effect, a second 2 (Condition: Answer,
0
1
2
3
4
5
Problem One Problem Two Problem Three Problem Four Problem Five
Res
po
nse
Lat
ency
: Sec
on
ds
Answer Equation
Figure 3. Response Latency Across Problems During Non-Repeated
Stimulus: A line graph depicting the mean difference response latency
between the two conditions by question.
23
Equation) X 2 (Question) ANOVA with repeated measures on the last factor was conducted with
Question 1 removed. With Question 1 removed the main effect for Condition was not significant
(F(1,35) = .99, p = .33; ɳp2 = .06), and the main effect of Question was not significant (F(1,36) =
.64, p = .44; ɳp2 = .04). Hence, on Question 1 the participants were exhibiting some cognitive
effort prior to solving the math problem.
Correlational Analyses: Relationship between HR and Subsequent RL. A series for
zero-order (Pearson) correlations were calculated within each condition between evoked HR and
subsequent RL for each question. For the non-repeating problems, the Pearson Correlations for
this comparison can be found below in Table 3 and for the repeating problems the Pearson
Correlations are displayed in Table 4. Although these analyses were secondary and exploratory
and the sample sizes are very small, the trends are in the expected direction. The greater the
evoked HR the faster the RL. And when comparing the magnitude of the correlations for the
0
1
2
3
4
5
Repeated Problem One Repeated Problem Two Repeated Problem Three
Res
po
nse
Lat
ency
: Sec
on
ds
Answer Equation
Figure 4. Response Latency Across Problems During Repeated
Stimulus: A line graph depicting the mean difference response latency
between the two conditions by question during the repeated problems.
24
non-repeating versus that of the repeating problems, a predicted difference is observed. That is,
the magnitude of the relationship between evoked HR and RL is stronger for the non-repeating
math problems compared to the repeating math problems. Here again, suggesting that HR is an
indicator of cognitive effort.
Table 3. Zero-Order Pearson Correlations for Non-Repeated Stimulus: This table depicts the zero-
order Pearson correlations for response latency and evoked heart rate for the non-repeated
stimulus. Zero-Order Pearson Correlations for Non-Repeated Stimulus
Condition Question Correlation p Value
Answer One 0.54 0.16
Answer Two 0.51 0.16
Answer Three 0.41 0.31
Answer Four 0.34 0.41
Answer Five 0.51 0.20
Equation One 0.28 0.54
Equation Two -0.36 0.38
Equation Three 0.66 0.05
Equation Four 0.27 0.27
Equation Five 0.36 0.28
25
Table 4. Zero-Order Pearson Correlations for Repeated Stimulus: This table depicts the zero-
order Pearson correlations for response latency and evoked heart rate for the repeated stimulus. Zero-Order Pearson Correlations for Repeated Stimulus
Condition Question Correlation p Value
Answer One -0.12 0.77
Answer Two 0.14 0.75
Answer Three -0.10 0.81
Equation One -0.15 0.71
Equation Two -0.12 0.75
Equation Three 0.14 0.75
26
DISCUSSION
Evoked HR
It was hypothesized that evoked HR would be evidence of cognitive processing, and that
in the Equation Condition participants would exhibit greater HR acceleration compared to those
in the Answer Condition. This was due to the fact that we expected participants in the Equation
Condition, who were given the problem first, would be engaging in some cognitive effort to
solve that problem. We expected modest cognitive effort in the Answer Condition but did expect
to observe primarily an anticipatory readiness to respond in the form of HR deceleration.
In summary, the predicted differences in evoked HR were observed, as can be seen in
Figures 1 and 2. When first presented with the problem, the participants in the Equation
Condition had evoked HR that was higher than baseline, which is argued to be a sign of
increased cognitive effort. During this period, the evoked HR in the Answer Condition were at,
or lower than the baseline. This observed decrease in evoked HR is argued to be a function of an
anticipatory readiness to respond as opposed to cognitive effort. This finding would be in
concordance with Lacey and Lacey’s (1974) intake-rejection hypothesis. This makes sense
because it was hypothesized originally that this pattern would emerge. The participants in the
Equation Condition would display HR acceleration during the presentation of the problem,
because they will be solving the math problem. When a participant is presented a first-grade
level problem (4 + 8 =), the participant will work to solve the math problem, and then employ
some mental elaboration to hold the solution in memory until asked to select an answer from four
options. We see the opposite pattern in the Answer Condition. When a participant is presented
the answer during the presentation of the problem, the participant has no problem yet to solve,
27
hence no cognitive effort. However, anticipation and a readiness to respond develops, resulting
in HR deceleration.
Further evidence that HR is an indicator of cognitive activity can be seen in the HR on
the repeated math problems. No significant changes in HR were observed from baseline and no
significant differences between conditions were observed. Since the problem solution has been
solved, no cognitive effort or anticipatory response is required.
There was a Question effect in the first analysis. The evoked HR was greater for Question
1, particularly for participants in the Equation condition. It seems that math problem difficulty of
the question would not account for this effect, given all questions were equated on level of
difficulty. It is more likely that the response to Question 1 was a function of being the first
question, and the participants were acclimating to the testing situation. It is still unclear whether
Question 1 evoked this difference or if this difference occurred due to the placement of the
problem. There were no differences between questions when the questions were repeated. It is
important to remember that the repeated questions were all the same. There are no differences
between questions in the other subsequent analyses, which supports further that the issue is not
with the question itself.
These two factors of Question and Condition did not interact significantly in any of the
analyses of HR. The effect size measures for the main effect of Condition accounted for
approximately 21% of the variability between groups. This supports the finding that the two
conditions are not only different statistically as a function of the problem manipulation, but also,
this effect size is considered to be large and is in agreement with those reported in the literature.
And comparing these effect sizes to those of the repeated questions lends further support that the
observed Condition and Question HR differences are a due the math problem manipulation.
28
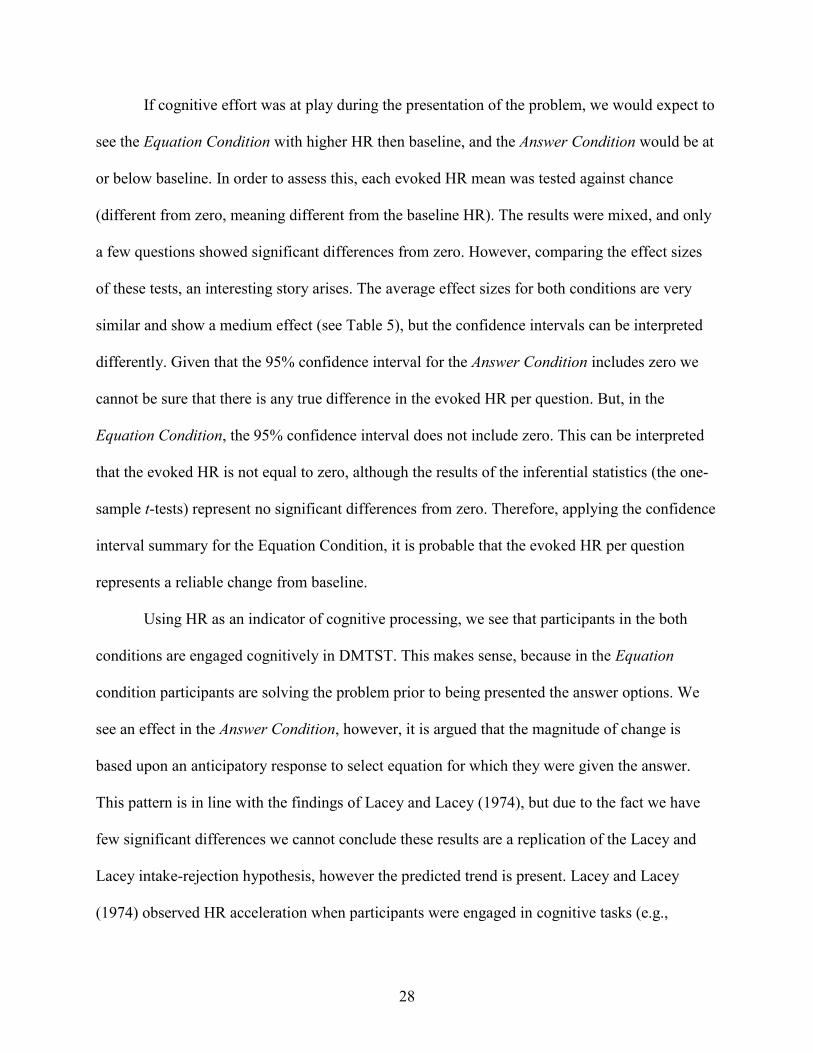
If cognitive effort was at play during the presentation of the problem, we would expect to
see the Equation Condition with higher HR then baseline, and the Answer Condition would be at
or below baseline. In order to assess this, each evoked HR mean was tested against chance
(different from zero, meaning different from the baseline HR). The results were mixed, and only
a few questions showed significant differences from zero. However, comparing the effect sizes
of these tests, an interesting story arises. The average effect sizes for both conditions are very
similar and show a medium effect (see Table 5), but the confidence intervals can be interpreted
differently. Given that the 95% confidence interval for the Answer Condition includes zero we
cannot be sure that there is any true difference in the evoked HR per question. But, in the
Equation Condition, the 95% confidence interval does not include zero. This can be interpreted
that the evoked HR is not equal to zero, although the results of the inferential statistics (the one-
sample t-tests) represent no significant differences from zero. Therefore, applying the confidence
interval summary for the Equation Condition, it is probable that the evoked HR per question
represents a reliable change from baseline.
Using HR as an indicator of cognitive processing, we see that participants in the both
conditions are engaged cognitively in DMTST. This makes sense, because in the Equation
condition participants are solving the problem prior to being presented the answer options. We
see an effect in the Answer Condition, however, it is argued that the magnitude of change is
based upon an anticipatory response to select equation for which they were given the answer.
This pattern is in line with the findings of Lacey and Lacey (1974), but due to the fact we have
few significant differences we cannot conclude these results are a replication of the Lacey and
Lacey intake-rejection hypothesis, however the predicted trend is present. Lacey and Lacey
(1974) observed HR acceleration when participants were engaged in cognitive tasks (e.g.,
29
solving math problems), compared to HR deceleration when allocating attention (getting ready)
to perform the math problem task.
Table 5. Effect Sizes for Heart Rate Difference from Zero During Problem Presentation: A table
depicting the average effect size and their 95% Confidence Intervals.
Presentation of the Problem
Condition
Measure of Effect
Size
Effect Size
Obtained
95% Confidence
Interval
Answer Cohen’s d 1.08 0.27 1.85
Answer Cohen’s d 0.79 0.06 1.49
Answer Cohen’s d 0.58 -0.11 1.24
Answer Cohen’s d 0.32 -0.33 0.95
Answer Cohen’s d 0.08 -0.54 0.70
Average 0.57 -0.13 1.25
Equation Cohen’s d 0.63 0.03 1.27
Equation Cohen’s d 0.27 -0.34 0.86
Equation Cohen’s d 0.30 0.15 0.69
Equation Cohen’s d 0.69 0.08 1.34
Equation Cohen’s d 0.66 0.09 1.30
Average 0.51 0.02 1.09
Response Latency
30
It was hypothesized originally that the magnitude of evoked HR would also be correlated
with RL. That is, participants with greater evoked HR will have faster RL when solving the math
problems. Overall, RL between the two conditions were significantly different, with the Answer
Condition resulting in slower RL than the Equation Condition. When a math problem was
repeated, no significant RL differences between the conditions were observed. This can be
interpreted in that when cognitive effort is not required (the answer is known), differences in RL
between conditions would not be expected.
On the repeating problems there were no significant differences in RL for the Question.
This was surprising. It is difficult to tell why this occurred, because there are no differences at
face value of these questions. When the repeated question was first presented, the participants
took longer to respond, but the RL difference between questions diminished over trials; RL
became faster. It is probable that the first presentation took some cognitive effort and visual
search for the answer. On the subsequent repeated presentations, no effort is needed for the
problem has been solved and no visual search for the answer is required, hence faster RL. This
effect was consistent between conditions.
There were significant differences in RL between the Answer and Equation conditions on
the non-repeating problems. It is not clear that the slower RL observed in the Answer condition
was due to the participants having to search visually for the correct option and concurrently solve
the math problem and then visual search for the correct equation and/or whether the participant is
just taking longer to read? However, on the repeated problems, there were no significant
differences in RL between the Answer and Equation conditions. There is obviously some
difference in RL, however, given the possible confounds, the attentional processes that account
31
for individual differences in RL cannot be identified within the constraints of the employed
research design.
The Relationship between HR and RL
It was found that HR and RL did not correlate significantly. However, a consistent trend
in the pattern of the relationship between evoked HR and subsequent RL resulted in both
conditions. Moreover, the strength of the HR and RL relationships were weaker for the repeated
problems. Although these correlational analyses were exploratory, the results do support the
connection between HR and RL that could be important theoretically in the study of cognitive
processing.
Limitations
One major limitation of this study is the small sample size (underpowered). Therefore,
the probability of a Type 1 error increases. This limitation could be corrected by collecting more
data and/or by replication. However, the observed effect sizes and the standard errors between
conditions provide evidence the probability of Type 1 errors are low.
Another limitation of this study is that the majority of the sample was female and the
majority were white. This makes it difficult to generalize the results to all demographics. The
sample was also comprised of college-aged students, which makes it difficult to generalize to
other populations (e.g., children and older adults). While the hypotheses were not expected to be
different between demographic groups, the generalization of these findings are limited.
Future Research
32
First, it could be interesting to assess the effect of math anxiety on RL and the magnitude
of subsequent physiological responses. Partialing out the effect of math anxiety could be a start
to identify the contribution of cognitive processing during math problem solving. Which in turn,
could better define the changes in HR as an indicator of cognitive activity.
Future research could also implement math problems of increasing difficulty, instead of
using first grade level math problems. By varying math difficulty, individual differences in math
solutions could be more readily identified. Belmont and Mitchell (1987) argued that to
investigate individual differences in cognitive strategy use, one has to identify problems that are
at an optimal level of difficulty. Otherwise, problems that are too easy or too difficult no strategy
use will be observed. According to Belmont and Mitchell (1987) without determining
appropriate levels ofmath difficulty, accurate measurement of cognitive processing differences
and how such processes relate to problem solving would be unattainable.
One final suggested approach to studying individual differences in math problem solving
is application of eye tracking technology. Replicating this study employing eye tracking
technology could provide a unique assessment of how participants are actually solving math
problems. Eye tracking technology provides a means of measuring where attention is directed,
number of fixations, fixation durations, and latency to attend to stimulus areas. Using such eye
movement measures would allow a detailed analysis of the components of the math formulas,
which could permit insights into the learning process, as well as insights into cognitive
processing that is unavailable typically to measure. Also, eye tracking would permit an
observational map of participants’ problem solving behavior when making match-to-sample
choices. Such could further a working knowledge of individual differences in math ability, which
in turn could afford the designing of appropriate math teaching methods.
33
Conclusions
The findings, for the most part, were in the direction as hypothesized. And too, the results
provide further theoretical support regarding the magnitude and direction of evoked HR during
problem solving.
Overall, RL was found to be significantly different between conditions, with the Answer
Condition having slower RL compared to the Equation. It was hypothesized that RL would be
due to cognitive effort, but it is difficult to make the distinction between cognitive effort and the
possibility of just taking longer to read, especially during the match-to-sample in the Answer
condition. For during the match-to-sample selection, not only does the participant have to
process the equation and solve the math problem, but has to search visually for the correct
option. The cognitive effort hypothesis is supported by the evoked HR being higher, but
evidence is lacking to explain individual differences in RL. In sum, it is the contention of the
author that the use of HR as a measure of cognitive processing shows promise, for both the study
of individual differences in cognition as well as testing cognitive theory.
34
REFERENCES
Belmont, J.M., & Mitchell, D. W. (1987). The general strategies hypothesis as applied to
cognitive theory in mental retardation. Intelligence, 11, 91-105
Dew, K. M. H., Galassi, J. P., & Galassi, M. D. (1983). Mathematics anxiety: Some basic
issues. Journal of Counseling Psychology, 30, 443–446.
Dreger, R. M., & Aiken, L. R. (1957). The identification of number anxiety in a college
population. Journal of Educational Psychology, 48, 344–351.
Eschman, B. T. (2013). Individual Differences in Visual Scanning Behavior and Heart
Rate on a Match-To-Sample Task. Missouri State University Graduate
Theses. https://bearworks.missouristate.edu/theses/1798.
Evans, T. M., Kochalka, J., Ngoon, T. J., Wu, S. S., Qin, S., Battista, C., & Menon, V. (2015).
Brain structural integrity and intrinsic functional connectivity forecast 6 year longitudinal
growth in children's numerical abilities. The Journal of Neuroscience, 35(33), 11743-
11750.
Faust, M. W. (1992). Analysis of physiological reactivity in mathematics anxiety (Unpublished
doctoral dissertation, Bowling Green State University, Bowling Green, Ohio).
Gibson, Eleanor & Rader, Nancy. (1979). Attention: The Perceiver as Performer. New York:
Plenum Press
Ham, J. M. (2015). Observed changes in anticipatory heart rate on a delayed-match-to-
sample task. Missouri State University Graduate Theses.
https://bearworks.missouristate.edu/theses/1838.
Hegarty, M., Mayer, R. E., & Monk, C. A. (1995). Comprehension of arithmetic word
problems: A comparison of successful and unsuccessful problem solvers. Journal of
Educational Psychology, 87(1), 18-32.
35
Hembree, R. (1990). The nature, effects, and relief of mathematics anxiety. Journal for
Research in Mathematics Education, 21, 33–46.
Hershman, A. I., & Gibson, D. (1979). HR alteration and cognitive efficiency. Bulletin of the
Psychonomic Society, 14(2), 99-102.
Hunt, T. E., Clark, C. D., & Sheffield, D. (2015). Exploring the relationship between
mathematics anxiety and performance: An eye‐tracking approach. Applied
Cognitive Psychology, 29(2), 226–231.
Jennings, J. R. (1986). Bodily changes during attending. Psychophysiology: Systems,
processes, and applications (pp. 268-289). New York: Guilford.
Lacey, B. C., & Lacey, J. I. (1974). Studies of heart rate and other bodily processes in
sensorimotor behavior. American Psychologist, 33(2), 99-113
Luque-Casado, A., Perales, J. C., Cárdenas, D., & Sanabria, D. (2016). Heart rate variability and
cognitive processing: The autonomic response to task demands. Biological
Psychology, 11383-90.
Prajent. (2011). How to read a normal ECG (Electrocardiogram). Hubpages. Retrieved from
https://hubpages.com/health/How-to-read-a-normal-ECGElectrocardiogram
Quintana, D. S., Guastella, A. J., Outhred, T., Hickie, I. B., & Kemp, A. H. (2012). Heart rate
variability is associated with emotion recognition: direct evidence for a relationship
between the autonomic nervous system and social cognition. International Journal of
Psychophysiology, 86(2), 168-172.
Reynolds, G., Field, A. P., & Askew, C. (2014). Effect of vicarious fear learning on
children’s heart rate responses and attentional bias for novel
animals. Emotion, 14(5), 995-1006.
Richards, J. E. & Casey, B. J. (1991). Heart rate variability during attention phases in young
infants. Psychophysiology, 28(1), 43-53.
36
Rinck, M., & Becker, E. S. (2006). Spider fearful individuals attend to threat, then quickly avoid
it: Evidence from eye movements. Journal of Abnormal Psychology, 115(2), 231–238.
Stauss, H. M. (2003). Heart rate variability. American Journal of Physiology-Regulatory,
Integrative and Comparative Physiology, 285(5), R927-R931.
Stevenson, H. W., & Stigler, J. W. (1992). The learning gap. New York: Summit Books.
Suri, R., Monroe, K. B., & Koe, U. (2013). Math anxiety and its effects on consumers’
preference for price promotion formats. Journal of the Academy of Marketing
Science, 41, 271–282.
Tobias, S. (1978). Overcoming math anxiety. Boston, MA: Houghton
Mifflin.
37
APPENDICES
Appendix A: Problems Utilized in Stimuli
4 + 8 =
7 + 4 =
7 – 5 =
4 / 2 =
21 + 5 =
6 / 2 = (repeated problem)
38
Appendix B: Stimulus Equation Condition
39
Appendix C: Stimulus Answer Condition
40
Appendix D: Institutional Review Board Approval
To: D Mitchell Psychology RE: Notice of IRB Approval Submission Type: Initial Study #: IRB-FY2019-109 Study Title: Heart Rate, Attention, and Quantitative Reasoning Decision: Approved Approval Date: October 23, 2018 Expiration Date: October 23, 2019 This submission has been approved by the Missouri State University Institutional Review Board
(IRB) for the period indicated. _______________________________________________________________________________________________________________________________________________________________ Federal regulations require that all research be reviewed at least annually. It is the Principal
Investigator’s responsibility to submit for renewal and obtain approval before the expiration date.
You may not continue any research activity beyond the expiration date without IRB approval.
Failure to receive approval for continuation before the expiration date will result in automatic
termination of the approval for this study on the expiration date. You are required to obtain IRB approval for any changes to any aspect of this study before they
can be implemented. Should any adverse event or unanticipated problem involving risks to
subjects or others occur it must be reported immediately to the IRB. This study was reviewed in accordance with federal regulations governing human subjects research, including those found at 45 CFR 46 (Common Rule), 45 CFR 164 (HIPAA), 21 CFR 50 & 56 (FDA), and 40 CFR 26 (EPA), where applicable. Researchers Associated with this Project: PI: D Mitchell Co-PI: Primary Contact: Abigail van Nuland Other Investigators:

41
Appendix E: Informed Consent Form
Missouri State University Consent of Participation
Infant Perception and Learning Laboratory
This study is part of the Missouri State University Psychology Graduate Program designed to give us
more information and to fulfill a thesis requirement for Abigail Van Nuland. The following information is
provided so that you can decide whether you wish to participate in this study. If you agree to participate,
you will (not necessarily in this order) complete a brief baseline task and demographic questionnaire, and
we will observe your visual responses, and corresponding heart rate, to series of math problems. During
the viewing you will have 3 electrodes attached to you (one on each of your ankles and one on your right
wrist) so to record and monitor your heart rate. One of the members of the research lab should have
explained the purposes and procedures of the study to you and will answer any questions you might have.
Please be assured that if you agree to participate, you are free to withdraw from the study even after you
have signed this consent form. If you wish to withdraw, simply stop any on-going task and tell the
research staff you wish not to continue. Should you decide to terminate the research session; all data
pertaining to you that have been collected will be destroyed.
There are no anticipated risks in this study that are outside those encountered in everyday life. You have
the right to withdraw from the study at any time in order to remove any chance of psychological harm if
they feel uncomfortable. You will benefit by receiving credit for your introductory psychology course and
will also benefit by contributing to science. Due to the fact that there are no risks outside those associated
with day to day life, the participant is not taking a risk when participating in this study and is within
reasonable limits. The benefits of participating in this study greatly outnumber the risks. This session has
been scheduled for approximately one hour, and we anticipate taking up that whole period of time.
Since it is our policy to protect the confidentiality of all our participants, your name will not be included
in any data analyses, subsequent publication or presentations related to this research study. All raw data
collected during this study will be identified only by code-number to ensure confidentiality of the
information collected.
If questions arise after you have left the research laboratory, feel free to give D. Wayne Mitchell, Ph.D. a
call at 417-836-6941 or [email protected]. We do not anticipate any risk to you as a
result of participating in this study, but it is unlikely that this study will provide you with any direct
benefits. Your participation will, however, make an important contribution to our scientific knowledge,
and we very much appreciate your cooperation.
I have read the above description of the study and I agree to participate.
Participant's Name (please print): _________________________________________.
Participant’s Signature: _________________________________________.
Witness’s Signature: _________________________________________.
42
Appendix F: Demographics Questionnaire
1. Participant Number
2. Baseline Task Time
3. How old are you?
4. What is your gender?
5. What time did you last eat?
a. Briefly describe how much you ate?
6. Have you had caffeine in the past 3 hours
a. Approximately how much
7. Are you currently taking any cold medicine, allergy medicine or prescribed medicine?
a. Please explain
8. Do you exercise regularly
a. How often and how long
b. What type of exercise
9. Do you smoke?
a. On average, how much do you smoke?
10. What mode of transportation did you use to get to the study?