Embed Size (px)
Citation preview

Quantitative
Research Methods
General studies / ISSS
Tero Mamia
Introduction to Research Methods:Quantitative Research Methods & SPSS Basic Course
� The course is part of the compulsory general studies
� Book exam:� Gilbert (ed.), Researching Social Life. Sage 1992 and
� Rose, D. & Sullivan, O., Introducing Data Analysis for Social Scientists.
� Friday 24.2.2006 12-16
� Friday 28.4.2006 12-16
� Room D10b, Main Building
� Registration required (Dept of sociology and social psychology)
� Or: Gilbert + Rose&Sullivan chapters 1-3, 5 (9, 12) + lectures (4 x 2 h):� Friday 17.2.2006,14-16 (B275)
� Fridays 24.2.-10.3.2006, 12-14 (B275)
� Examination: WHEN??

Objectives
� To understand:� the logic and basic principles of quantitative
research
� the idea of inferential statistics: generalization from sample to population
� To learn:� How to obtain quantitative data?
� How to describe data and single variables?
� How to analyse relationships (dependencies) between two or more variables?

Lectures topics
� The quantitive method
� Research design and research process
� Sampling
� Types of variables and descriptive analysis
� Inferenetial statistics: from sample to population
� Associations between two variables: bivariate analysis
� Analysing three or more variables: elaboration and multivariate analysis

The logic of social research
“…as social researchers we believe that patterns and regularities occur in society and that these are not simply random. The task we are faced with is to ask why these patterns exist: in other words to produce explanations of them.
We couch these explanations in terms of theories. Theories allow us to select out from a mass of confusing material those elements of reality which are of concern to us. On the basis of theory we can develop hypotheses about relationships which ought to exist, if the theory is valid.”
(Rose & Sullivan 1996, 10)

Classic hypothetic-deductive research
Theories
Empirical generalizations
Observations
Hypotheses
THEORY
EMPIRISM
Deductive reasoning
Induction

Notes on studying societies
and human beings
� the object of study is not ”deaf” � reflects and responds to new knowledge
� the object of study is not static but in constant flux � temporality of knowledge
� human beings are rational and self-conscious agents � causality problematic (probabilistic rather than deterministic)
� researcher is part of the object of study (society) � objectivity problematic
� measurement problematic?

Description and explanation
� Social scientist ask basically two types of questions:
1. What exists / happens in society?
� Descriptive research
2. Why does it exist / happen?
� Explanatory research
� Most research includes both description and explanation.
� Good explanatory research can only be built on solid descriptive knowledge.
� It does not make sense to ask: ”Why is social inequality increasing?” unless we have a good conception about ”social inequality” and descriptive research that can demonstrate convincingly that it does increase
� Social research can also aim at comparison or classification

Theoretical and empirical research
� Empirical research has as the object of study some aspect (problem) of reality� Research data is obtained by some systematic method of
empirical observation
� Theoretical research studies problems related to concepts, perspectives or theories of a given field (discpiline)� Research data consists of previous research (analysis and
synthesis)
� Sometimes empirical and theoretical research are pitted against each other: more fruitful to see them as complementing each other
� Scientific research as a dialogue between theory and empirism
� Most research inolves both theoretical and empirical element

Quantitative and qualitative research
� Qualitative research aims at understanding. It answers primarily to how? –questions.
� Quantitative research aims at (causal) explanation. It answers primarily to why? –questions.
� Both qualitative and quantitative research can aim at description of social reality.
� Complementary - not contradictory
� different kinds of research questions and objects of research
� different perspectives on the same research objects / questions (methodological triangulation)
� differenet stages in the research process� quantitative � qualitative
� qualitative � quantitative

The quantitative method
� Based on the idea that social phenomena can be quantified, measured and expressed numerically.
� The information about a social phenomenon is expressed in numeric terms that can be analysed by statistical methods.
� The observations can be directly numeric information or can be classified into numeric variables.
� Observation are transformed into a data matrix in which each observation unit (e.g. individual) occupies one row and each variable one column.
� The data matrix is the starting point for the analysis.

Observation matrix
43.350454559
…
53300300345458
55600300233447
54300400144436
13200400334545
14200350344434
53180350525343
15700380435552
23134550435541
Q_14_2Q_14_1Q_13Q_12Q_1_5Q_1_4Q_1_3Q_1_2Q_1_1case

Observation units and variables
� variable = observable and measurable
characteristic of an observation unit, which
varies across different units
� observation unit (i.e. research unit, case)
� individual
� group (e.g. family, household, couple)
� institution, organization or community (e.g. school,
enterprise, municipality)
� text (e.g. newspaper article, a novel, research)
� event or activity (war, strike, revolution)

Quantitative Research:
Strengths...
� Enables the research and description of social structures and processes that are not directly observable.
� Well-suited for quantitative description, comparisons between groups, areas etc.
� Description of change.
� Analysis and explanation of (causal) dependencies between socialphenomena.
...and Weaknesses.
� Simplifies and ”compresses” the complex reality: abstract and constrained persective.
� Only applicable for measurable (quantifiable) phenomena
� Presumes relatively extensive knowledge on the subject matter inorder to be able to ask ”correct” questions.
� Difficult to study processes or ”dynamic” phenomena: produces static view of the reality
� Description of actors’ perspectives, intentions and meanings difficult.

Research as dialogue between theory
and empirical observations
� Some kind of implicit theories about the nature of reality always directs our observation and interpretation of reality!
� Since we cannot ”get away” from theory in scientific research it should be made explicit! (transparency of research)
� Theory provides us with a framework for the research
� Outlining and conceptualization of research problems
� Guides observation & helps in interpretation
� Locates the research in scientific discussion
� Empirical data analysis as such is not scientific research.
� Data analysis should always be based on and discuss with theory and earlier research (theoretical framework).
� Theoretical formulation of research results enables generalization and enhances the “explanatory power” of the results.

The research processResearch
idea
Literature
review
Theoretical
formulation of the
research problem
Empirical
research questions
(operationalization)
Research design
(planning)Data
collection
Data
analysis
Answering
the empirical
research questions
Theoretical
interpretation
of the results
Comparison
with earlier
research
Conclusions

Planning research1. Selection of the theme / topic� personal interest
� social significance
� theoretical interest
� “researchability”
� ethical questions: who’s interests does the research serve?
2. Getting acquainted with previous research on the same theme
� What do we know about the theme of research? What we don’t know?
� How has the theme been theoretically tackled (conseptualized)?
� Is there pre-existing data available?

3. Selection of the theoretical approach
4. Specification of the research problem
� into questions that can be answered by research
� conseptualization
5. Planning the empirical research process
� research design
� most suitable methods for the research problems and
the design
� how to obtain data? (sampling)
� operationalization: measures and indicators

”Research design”
� Logical structure of the reseach (data).
� “The function of a research design is to ensure that the evidence obtained enables us to answer the initial question as unambiguously as possible.”(David de Vaus: Research Design in Social Research, 2001)
� Empirical support for practically any hypothesis can usually be obtained by manipulating data.
� Good research design prevents this kind of manipulative use of data by taking into account possible alternative explanations and enabling comparisons and judgements between them.

� Research questions ”dominate” the design.
� Data and methods are to be selected so that the research questions can be answered.
� Adopt a ”sceptical mindset”!
Research problems
MethodsData
The greatest challenge to any thinker is stating the problem in a way
that will allow a solution. (Bertrand Russell)
Research designs
1. Experimental design
2. Longitudinal design
3. Cross-sectional design
4. Case study design
� Design ≠ method of data collection
� Design ≠ quantitative / qualitative
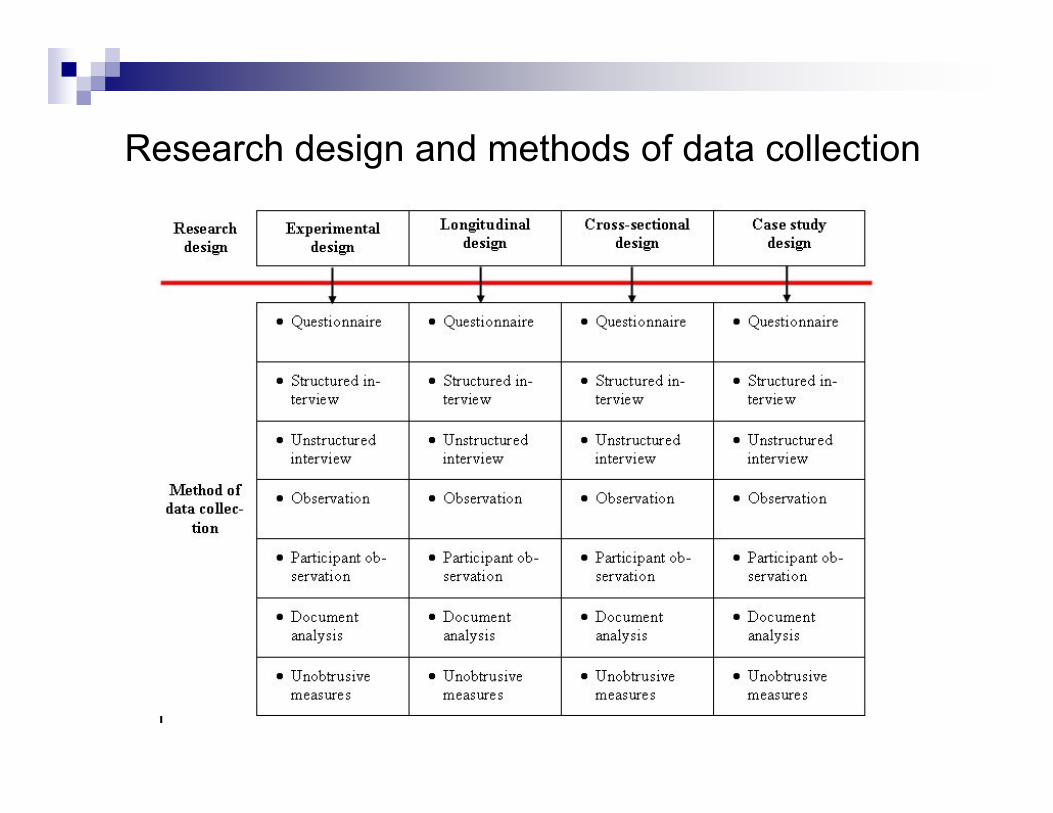
Research design and methods of data collection
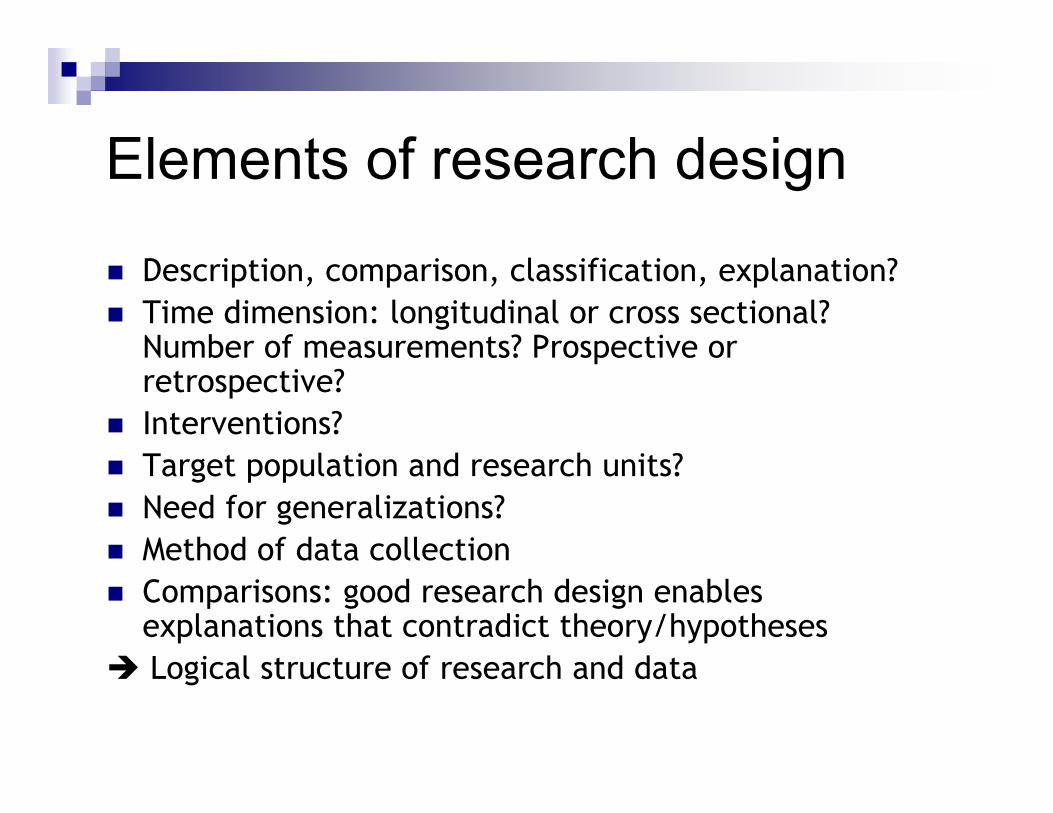
Elements of research design
� Description, comparison, classification, explanation?
� Time dimension: longitudinal or cross sectional? Number of measurements? Prospective or retrospective?
� Interventions?
� Target population and research units?
� Need for generalizations?
� Method of data collection
� Comparisons: good research design enables explanations that contradict theory/hypotheses
� Logical structure of research and data

Examples on the effect of design
� Research on the effects of marriage on mental health of men and women (Jessie Bernard)
� Design: comparison of married men and women
� Results: “anxiety disorder”
� Women 11,6 %
� Men 6,2 %
� Conclusion: men do well out in marriage in comparison to women - especially in terms of mental health
� Are the results convincing? Do we have enough comparsions?

“anxiety disorder” (Bernard)

“Sceptical mind set” - example
Marital status Happiness /
welfare
Happiness /
welfare
Happiness /
welfare
Happiness /
welfareWealth / sosio-
economic position
Values / religion
Model 1
Model 2
Model 3
Model 4
Marital status
Marital status
Marital status

Example: Effects of divorce law reform
� In Australia “no fault” divorce law reform in Dec 1975
� Crude divorce rate:1975: 1,8
1976: 4,5
� Public outcry: erosion of social order because of the law refrom!
� Is the interpretaion correct? Are the alternative explanations? Is the research design optimal and comparison adequate?

Divorce law reform
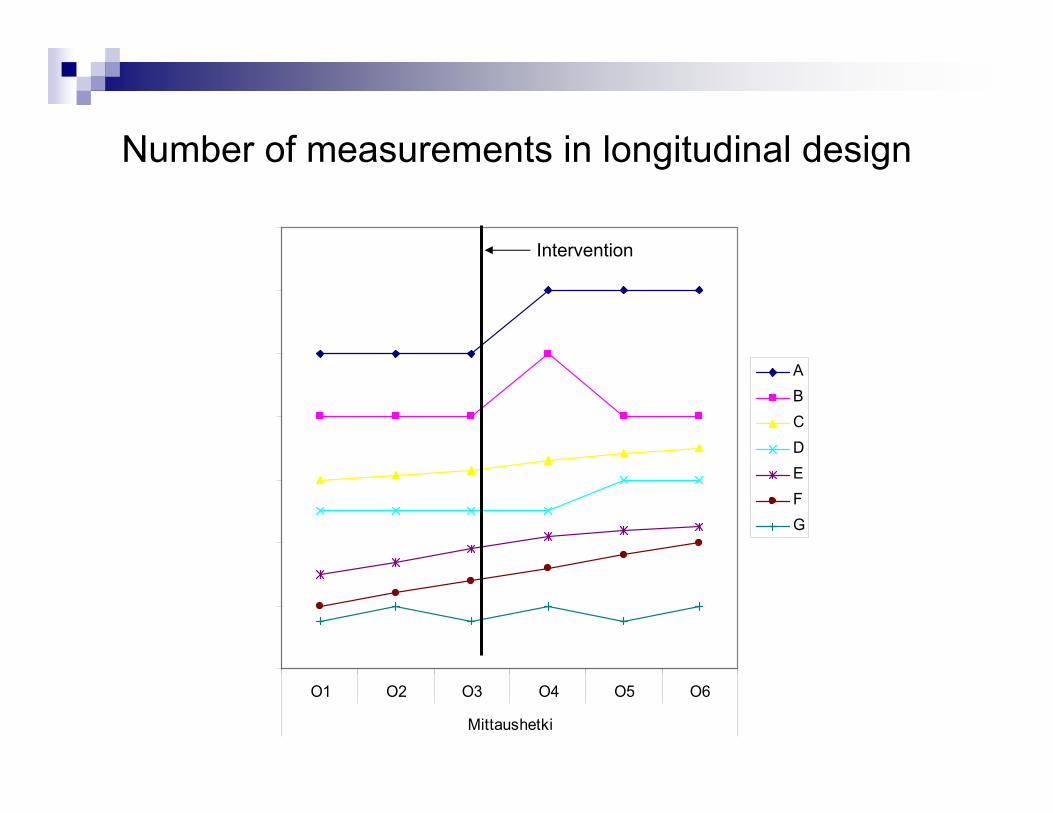
Number of measurements in longitudinal design
0
2
4
6
8
10
12
14
O1 O2 O3 O4 O5 O6
Mittaushetki
A
B
C
D
E
F
G
Intervention

Sampling – selection of observation units
� When we are studying a very large group of cases (e.g. Finnish adult population), it is usually not possible to obtain observations of all the cases.
� Therefore, we study a sample of the group (population) which represents the larger whole.
� There is always a risk that the units selected in the sample are somehow exceptional, i.e. the sample does represent the population (sampling error).
� We minimize this risk by random sampling.
� In a random sample the risk of sampling error can be statisticalle estimated.
� With random (and representative) sample we can with a definite level of confidence make generalizations from sample to the population.

Sampling: central concepts
Universe
(theoretical target
population)
Population
(empirical target
population)
sometimes called
sampling frame
Original
sample
Final
sample
(data)
Loss (non-
response)
The aim of sampling is to produce a miniature copy of the population. Each member of
the population has an equal likelihood of being selected into the sample. Hence we can
make inferences about the larger population based on the sample.

Sampling methods
� Probability sampling vs. purposive (non-probability) sampling methods
1. Simple random sampling
2. Systematic selection (interval sampling)
3. Stratified sampling (proportional and disproportional)
4. Clustered sampling
5. Quota sampling (non-probability method)

Representativeness
1. Equivalence of universe and population (sampling frame)
2. Equivalence of population and sample
� when sampling is done correctly these should be equivalent within a certain error margin
� the bigger the sample, the lesser the likelihood of sampling error � How big is big enough?
3. Equivalence of original and final sample
� representativeness of the (final) sample
� response rate? 50% - satisfactory, 60% - good, 70%-100% - excellent
� has non-response created bias in the sample (comparison with the known population data)

Methods for obtaining data
� Survey research (all require a structured questionnaire, where each observation unit is posed with the exact same questions)� postal questionnaire survey
� e-mail questionnaire survey
� (Internet polls)
� face-to-face interviews
� telephone interviews
� Systematic observation
� Text analysis
� Statistical data (secondary analysis)
� Register data

Ethical principles in obtaining data
� no harm may be done to the participants
� “informed consent“
� anonymity
� confidence