Embed Size (px)
Citation preview
NeuroImage 42 (2008) 568–581
Contents lists available at ScienceDirect
NeuroImage
j ourna l homepage: www.e lsev ie r.com/ locate /yn img
Quantitative tractography metrics of white matter integrity in diffusion-tensor MRI
Stephen Correia a,⁎, Stephanie Y. Lee b, Thom Voorn c, David F. Tate d, Robert H. Paul e,Song Zhang f, Stephen P. Salloway a,g, Paul F. Malloy a, David H. Laidlaw b
a Department of Psychiatry and Human Behavior, Warren Alpert Medical School of Brown University, USAb Department of Computer Science, Brown University, USAc Vrije Universitet, Amsterdam, Faculty of Earth and Life Sciences, The Netherlandsd Departments of Radiology and Psychiatry, Center for Neurological Imaging, Brigham and Women's Hospital, Harvard Medical School, USAe University of Missouri, St. Louis, Department of Psychology, Behavioral Neuroscience, USAf Mississippi State University, Department of Computer Science and Engineering, USAg Department of Clinical Neuroscience, Warren Alpert Medical School of Brown University, USA
⁎ Corresponding author. Department of PsychiatryAlpert Medical School of Brown University, Providence V(116) 830 Chalkstone Ave. Providence, RI 02908-4799, U
E-mail address: [email protected] (S. Corr
1053-8119/$ – see front matter. Published by Elsevier Idoi:10.1016/j.neuroimage.2008.05.022
a b s t r a c t
a r t i c l e i n f oArticle history:
We present new quantitat Received 13 March 2008Revised 30 April 2008Accepted 8 May 2008Available online 24 May 2008ive diffusion-tensor imaging (DTI) tractography-based metrics for assessingcerebral white matter integrity. These metrics extend prior work in this area. Tractography models of cerebralwhite matter were produced from each subject's DTI data. The models are a set of curves (e.g., “streamtubes”)derived from DTI data that represent the underlying topography of the cerebral white matter. Nine metricswere calculated in whole brain tractography models and in three “tracts-of-interest”: transcallosal fibers andthe left and right cingulum bundles. The metrics included the number of streamtubes and several otherbased on the summed length of streamtubes, including some that were weighted by scalar anisotropymetrics and normalized for estimated intracranial volume. We then tested whether patients with subcorticalischemic vascular disease (i.e., vascular cognitive impairment or VCI) vs. healthy controls (HC) differed on themetrics. The metrics were significantly lower in the VCI group in whole brain and in transcallosal fibers butnot in the left or right cingulum bundles. The metrics correlated significantly with cognitive functions knownto be impacted by white matter abnormalities (e.g., processing speed) but not with those more stronglyimpacted by cortical disease (e.g., naming). These new metrics help bridge the gap between DTI tractographyand scalar analytical methods and provide a potential means for examining group differences in white matterintegrity in specific tracts-of-interest.
Published by Elsevier Inc.
Introduction
Diffusion tensor imaging (DTI) is a magnetic resonanceimaging (MRI) technique that measures the directionallydependent rate of water self-diffusion in each image voxel.These measures are in the form of a second-order diffusiontensor (Basser et al., 1994), which can be decomposed intothree non-negative eigenvalues and three eigenvectors thatdescribe the magnitude and orientation of water diffusion ineach image voxel. Water diffusion in cerebral white mattertends to be anisotropic due to the highly linear organization ofwhite matter fibers. That is, water will preferentially diffusemore rapidly along white matter tracts because physical
and Human Behavior, Warreneteran's Affairs Medical CenterSA. Fax: +1 401 457 3370.eia).
nc.
barriers such as axonal walls restrict watermovement in otherdirections (Beaulieu, 2002; Sun et al., 2005). Medical condi-tions such as subcortical ischemic injury, inflammation,neurodegenerative diseases, and traumatic brain injury causereductions in the linear organization ofwhitematter pathwayswith corresponding reductions in linear anisotropy (Beaulieu,2002; Sun et al., 2005). DTI is sensitive to these changes inlinear anisotropy, making it a powerful in vivo imaging tool forstudying the microstructural integrity of cerebral whitematter.
The majority of studies using DTI to assess white mattermicrostructure in clinical samples have been based on two-dimensional grayscale maps of scalar values such as meandiffusivity (MD), ameasure of the rate of diffusion in each imagevoxel, and fractional anisotropy (FA), a measure of the extent towhich that diffusion is directionally restricted. Generally, thesebasic scalar measures are derived from the eigenvalues of themulti-valued tensor data and do not incorporate eigenvectorinformation. The scalar values in each image voxel are then
569S. Correia et al. / NeuroImage 42 (2008) 568–581
mapped to two-dimensional grayscale images. An exception isthe colorized FAmaps inwhich color indicates fiber orientationbased on the principal eigenvector (e.g., Pajevic and Pierpaoli,1999;Wakana et al., 2004).With respect to anisotropy, theworkpresented in this paper is basedmainly onWestin et al.'s (1997)linear anisotropy measure, which is based on the principaleigenvalues and describes the direction of fastest diffusion.
Tractography methods complement scalar methods byproviding detailed information about the orientation andcurvature of white matter pathways as they course throughthe brain. These methods utilize both the tensor eigenvaluesand the eigenvectors to calculate trajectories in the directionof fastest diffusion. The trajectories are then portrayed graphi-cally using curved lines (Xue et al., 1999) or glyphs such ashyperstreamlines,whichwere initially proposedbyDelmarcelleand Hesselink (1993) as a means of visualizing other types ofsecond-order tensorfields and then subsequentlyapplied toDT-MRI data by Zhang et al. (2003). Tractography has gained itswidest acceptance in neuroscience studies exploring whitematter connectivity, effects of pathologies on connectivity, andimprovement of data acquisition and visualization methods(e.g., Huang et al., 2005; Wakana et al., 2004, 2005).
Only a few preliminary methodological studies haveexplored the utility of combining tractography with quantita-tive scalar measures (i.e., “quantitative tractography”) forclinical research where group comparisons are important. Forexample, Ciccarelli et al. (2003a,b), studied the reproducibilityof tract-“normalized” volume (NV) and FA in threewhitematterpathways traced by the fast marching tractography (FMT)algorithm (Parker, 2000; Parker et al., 2002a,b). The results(Ciccarelli et al., 2003a) showed variability in measures of tractvolume and fractional anisotropy across different fiber bundles,suggesting that fiber organization has an impact on thereproducibility of tractography algorithms. Ciccarelli et al.(2003a,b) also examined the extent of intersubject variabilityin the anterior corpus callosum, optic radiations, and pyramidaltracts. They found that the tractography maps correspondedwell to known anatomy and that there was greater intersubjectvariability at the terminal ends of tracts adjacent to cerebralcortex, but lower variability in the core of tracts and no right–left differences in variability. Ding et al. (2003) also demon-strated good reproducibility of tractography-basedmetrics suchas curvature, torsion, parallel diffusivity, and perpendiculardiffusivity along bundle length. Huang et al. (2005) have alsoused quantitativemethods for parcellating projections from thecorpus callosum to cortical regions. Smith et al. (2006)developed tract-based spatial statistics, which combines tracto-graphy with voxel-based morphometry metrics to derive awhite matter fiber “skeleton” of FA values that can then can becompared on a voxel-by-voxel basis across groups. Jiang et al.(2006) have developed the freely available software DTIStudio(www.mristudio.org), which calculates tractography modelsfrom raw diffusion data and then provides an interface thatallows users to identify white matter tracts-of-interest. Theprogram provides tractography-based statistics such as lengthandnumberof streamtubes, butnoweighting for scalar values isprovided.MedINRIA, another freely available DTI software pack-age (Fillard et al., 2007, www-sop.inria.fr/asclepios/software/MedINRIA), provides metrics similar to that provided byDTIStudio. Philips Medical Systems (Best, Netherlands) offers asoftware package called PRIDE (Philips Research IntegratedDevelopment Environment). Others (e.g., Ashtari et al., 2007)have used elaborate registration algorithms that permit over-
laying of tracts-of-interest derived from tractography modelsproduced by programs such as DTIStudio, MedINRIA, or PRIDEonto scalar FA maps to determine the structural integrity of theselected tracts. Each of these methods demonstrated thepotential utility of using quantitative tractography.
The present study proposes several new quantitativetractography metrics for quantifying cerebral white matterintegrity in whole brain white matter and in specific whitematter tracts-of-interest (TOIs). The impetus for developingthese metrics was to quantify observed qualitative differencesin the tractography models of patients with known vascularwhite matter disease compared to age-matched controls. Therationale for themetrics and their potential clinical utility is asfollows: Acquired reductions in white matter structuralintegrity result in local decreases in linear diffusion anisotropy.When these decreases reach or exceed a certain pre-specifiedthreshold, they cause the streamtube algorithm (or othersimilar tractography generating algorithms) to terminateprematurely. This should result in shorter streamtubes andpossibly either fewer or greater numbers of streamtubes de-pending on the nature of thewhitematter injury; for example,fiber dropout should result in fewer streamtubes whereasinjuries that cause diffusion changes without completedropout should result in a greater number of short stream-tubes. Thus, the motivation for the metrics is not purelydescriptive; rather, we assume that the output of streamtubegeneration algorithms is, in fact, reflective of underlying ac-quired white matter pathology. Also, compared with tradi-tional scalar metrics such as linear anisotropy or fractionalanisotropy, the metrics proposed in this paper operate on apart of or the entire tractography model, and therefore mightbe more effective in detecting tract-specific changes. More-over, we assume that the quantitative tractography metricssuch as those used in DTIStudio (Jiang et al., 2006), MedINRIA(Fillard et al., 2007), PRIDE and the ones presented in this paperare capable of detecting important subtle differences in thestructural integrity of specificwhitematter pathways betweengroups of individuals with and without white matter injury.
In this report, we define the metrics and demonstrate theirstability across multiple streamtube models derived from asingle dataset for one healthy control. Then, as an initial andpreliminary validity test, we compare the metrics of a smallcohort of patients with known vascular whitematter injury (i.e.,vascular cognitive impairment, VCI) and a demographically-matched cohort of healthy controls. VCI provides a good modelfor assessing the clinical and research utility of quantitative DTIsince ischemic white matter injury is associated with acharacteristic pattern of increased diffusivity and decreasedanisotropy (Jones et al., 1999). These diffusion changes arethought to reflect axonal loss (Beaulieu, 2002) with possiblecontributions from demyelination (Le Bihan et al., 2001), gliosis(Larsson et al., 2004), or other pathological processes.
Materials and methods
DTI acquisition
MRI data was collected on a 1.5T Siemens Symphonyscanner. First, an anatomic 3D T1 MPRAGE (one acquisition,sagittal) was acquired as follows: 0.85 mm slices, no gap, 176slices, 256×256 matrix, 21.7×21.7 cm FOV, TR=1900, TE=4.31,TI=1100, NEX=1, and flip angle=15; acquisition time was justover 8 min. For the DTI data, Siemens MDDW protocol was
570 S. Correia et al. / NeuroImage 42 (2008) 568–581
used to collect three co-registered sagittal double spin-echo,echo-planar diffusion-weighted volumes of the entire brain.After the initial scan, subsequent acquisitions were spatiallyoffset in the slice direction by 1.7 mm and 3.4 mm. Parametersfor each acquisitionwere as follows: 5mm thick slices, 0.1mminter-slice spacing, 30 slices per acquisition, matrix=128×128,FOV=21.7 cm×21.7 cm, TR=7200 ms, TE=156 ms, no partialechoes, and NEX=3. Bipolar diffusion encoding gradients(b=0, 1000 mm/s2) were applied in 12 non-collinear direc-tions (the maximum number available under our licensingagreement at the time of data collection) calculated auto-matically by Siemens software (the precise gradient directionsand strengths are available on request). The reverse polarityduring the second echo of the double-spin-echo acquisitionunwinds eddy currents that accumulate during the first echo(Reese et al., 2003). Total time for the three acquisitions wasslightly less than 15 min. The three acquisitions wereinterleaved to achieve 1.7 mm3 resolution images and thenup-sampled (equivalent to zero-filling) to 0.85 mm3 isotropicvoxels for analysis. The interleaving overlaps the slice profilesof the acquisition making through-plane interpolation possi-ble, which produces isotropic voxels that reduce tractographybias related to fiber orientation (Laidlaw et al., 2004). Whilethis is an unusual protocol, it avoids aliasing artifacts andproduces images that are only slightly less sharp in thethrough-plane direction than within plane while retainingsub-millimeter voxel dimensions. Typically, DTI acquisitionsfor use with tractography require more diffusion encodingdirections than were used here.
Motion was controlled with the use of a vacu-pillow headrestraint system provided by the scanner manufacturer. Wealso used repeated reminders during the scan session of theimportance of remaining motionless and other measures (e.g.,relaxation videos) to promote subject comfort in the scanner.We found that these methods worked well for most cases. Alldatasets included in the current paper were screened forexcessive motion artifact. Since the effect of motion correctionmethods on tractography models is not fully understood, wedid not institute post-acquisition motion correction to thedata due to concerns about introducing misalignment ofadjacent voxels on a streamtube from the rearrangement ofthe spatial locations of the tensors. There is no reason tosuspect a group×motion interaction that would bias ourresults. Therefore, motion would be considered a source ofrandom variability affecting both groups equally.
Streamtube generation
Custom in-house software was used to calculate tensorsand then derive the three principal eigenvalues and eigen-vectors for each image voxel after interleaving the three sets ofdiffusion-weighted images (Ahrens et al., 1998). Streamtubemodels of cerebral white matter were created for each subjectbased on the major eigenvector field of the diffusion tensorfield, as described in detail in Zhang et al. (2003). Briefly, thestreamtubes were generated by seeding in the data volumewith a density of one seed per 0.85 mm3. Seed points werechosen to ensure that streamtubes pass through all regions ofhigh linear anisotropy and are not restricted to the samplepoints of the volume image. Tricubic B-spline functions wereused to interpolate the tensor field so that there is no limit tothe number of seed points, locations of the seed points, or thetrajectory of the streamtubes. The location of each seed point
was randomly jittered across the underlying grid to avoidaliasing artifacts. In our method, streamtubes begin from aseed point and propagate along the major eigenvector fieldbidirectionally with a step size of 1 mm. The trajectory of thestreamtube passing through the seed point is found usingsecond-order Runge–Kutta integration. Streamtube trajec-tories are restricted to regions of high linear anisotropy andare clipped to the data volume and to regions of sufficientlyhigh signal-to-noise ratio. The seeding scheme of one seed per0.85 mm3 produces an overly dense set of streamtubes thatare culled using an algorithm based on three metrics: thelength of a trajectory (minimum=10.0 mm), the linear aniso-tropy along a trajectory (minimum=0.10), and the distancebetween them (minimum=1.7 voxels). This algorithm ensuresculling of fibers that are highly similar in their trajectory andspatial proximity as these may be considered redundant. Forthe definition of the distance between two streamtubes andthe details of the streamtube generation, please see Zhanget al. (2003). We have found that these parameters limit thenumber of anatomically implausible fibers in regions of lowanisotropy while retaining linear structures in most of thewhite matter. The resultant models bear a close resemblanceto known white matter structures such as cortical u-fibers,corpus callosum, superior longitudinal fasciculus, uncinatefasciculus, and cingulum bundles; other white matter struc-tures are also easily identified. Moreover, other groups (Jianget al., 2006; Wakana et al., 2004) have demonstrated goodcorrelations between physical white matter anatomy and DTImodels of white matter fibers. All streamtube models used ingroup comparisons were generated with an input seeding thatinitiated a streamtube in every voxel (0.85 mm3) of thevolume. This seeding dimension was selected in an attempt tocapture features as small as one-half of the intrinsic 1.7 mmresolution of the data. Other seeding dimensions were testedin the reproducibility study (see below).
Tract-of-interest selection
We implemented a method for interactive tract-of-interest(TOI) selection similar to the volume-of-interest (VOI)approach of Akers et al. (2004) and that resembles the morerecent methods published byMori and colleagues (Jiang et al.,2006) and others (Fillard et al., 2007). Briefly, our interactiveuser interface permits the operator to view the streamtubemodel alongside the T2-weighted images. The user can rotateand translate the streamtube model in all three axes using acomputer mouse. This allows the user maximum flexibility inviewing themodel from different perspectives and in zoomingon specific structures of interest. In addition, the user has theability to threshold models by linear anisotropy in order to seedeeper white matter pathways that may be obscured by onesnearer the surface. The user can then define three-dimensionalbox-shaped “voxels-of-interest.” The size and shape of theboxes are controlled by the user and can be dragged and placedanywhere in the streamtubemodel using the computermouseor by inputting specific values for the box dimensions andlocation. There is no limit to the number of boxes that can beplaced in a model. Once placed, a series of Boolean operationsallows the user to select only fibers that pass through a box, orthat connect two or more boxes, and in this way, identify theTOIs. TOIs selected in this manner are manually edited toremove streamtubes that have anatomically questionabletrajectories (i.e., streamtubes with sharp directional changes).

Table 1Metric abbreviations and definitions
Abbreviation Definition
TL Total Length: The total summed length of all streamtubes in the tract ofinterest
TWLCL Total Weighted Length: The total summed length of all streamtubes inthe tract of interest after weighting each streamtube by its average linearanisotropy (CL)
TWLFA Total Weighted Length: The total summed length of all streamtubes inthe tract of interest after weighting each streamtube by fractionalanisotropy (FA)
NS Number of Streamtubes: The total number of streamtubes in the tract ofinterest
NTL Normalized Total Length: TL normalized for estimated intracranialvolume
NTWLCL Normalized Total Weighted Length: TWLCL normalized by intracranialvolume
NTWLFA Normalized Total Weighted Length: TWLFA normalized by intracranialvolume
NNS Normalized Number of Streamtubes: The total number of streamtubescorrected for estimated intracranial volume
ATL Average Total Length: The total summed length of all streamtubesdivided by the number of streamtubes in a tract-of-interest
571S. Correia et al. / NeuroImage 42 (2008) 568–581
Upon selecting a TOI, the user can then calculate quantitativemeasures such as the number or summed lengths of stream-tubes included in the TOIs.
Since the tractography volumes are three-dimensional andTOI selection is based on each participant's own anatomy, co-registration is not necessary. For each subject, we quantifiedthe streamtube data for the whole brain and three TOIs:transcallosal fibers and the left and right cingulum bundles.TOI selection was performed by an experienced rater (TV)trained and supervised by two faculty with good knowledge ofwhite matter anatomy (SC and DT). The rater ensured thatstreamtube models were displayed at a consistent magnifica-tion and orientation prior to each TOI selection. Transcallosalfibers were defined as all streamtubes passing through thecorpus callosum selected by placing a long narrow box downthe midline of the corpus callosum and encompassing itsinferior–superior extent. The left and right cingulum bundleswere identified visually in the models and were segmented byroughly placing three equal sized voxels-of-interest along thelength of the bundle in the second, fourth, and most posteriorsixth of the bundle. Given the potential errors that can occur inDTI fiber tracking (Jiang et al., 2006; Mori and van Zijl, 2002),we adopted a conservative approach to identifying andremoving anatomically questionable fibers on the basis oftheir trajectory with reference to anatomical guides (e.g.,(Carpenter, 1991; Haines, 2004;Wakana et al., 2004). The finalTOI results were inspected by SC and DT for appropriateness.
Proposed metrics
For each TOI we derived the following quantitative tracto-graphy metrics: 1) total length (TL), 2) total weighted length(weighted for linear anisotropy) (TWLCL), 3) total weightedlength (weighted for FA) (TWLFA), 4) number of streamtubes(NS), 5) normalized total length (NTL), 6) normalized totalweighted length – linear anisotropy (NTWLCL), 7) normalizedtotal weighted length – FA (NTWLFA), 8) normalized number ofstreamtubes (NNS), and 9) average length (AL). Three metrics,TL, NS, and AL, are comparable to metrics output by DTIStudio(Jiang et al., 2006),MedINRIA (Fillard et al., 2007), and PRIDE. Asdescribed below, the other metrics extend these by includingscalar metrics and therefore should provide more subtle andpotentially important information about the white matterintegrity. Abbreviations and descriptions of these metrics aresummarized in Table 1. The metrics are defined conceptuallyand mathematically as follows.
Total length of a TOI was defined as:
TL ¼ ∑8saS
Ls ð1Þ
where Ls is the length in millimeters of a single streamtube scontained within the set of streamtubes S in the given TOI.This metric should provide a coarse marker of the overallmicrostructural integrity of a TOI.
We calculated two total weighted length (TWL) metrics.One weights TL by the average linear anisotropy, i.e., Westin's(1997) cl (TWLCL) of the streamtubes comprising the TOI; theother weights TL by fractional anisotropy (TWLFA). Theseweighted metrics potentially provide additional informationabout the integrity of the tract. For example, they might besensitive to differences in tract integrity across groups (i.e.,differences in the average linear anisotropy or fractionalanisotropy of the tract) that are insufficient to impact TL, but
nonetheless reflect a disease state. TWLCL and TWLFA differ inthat the former only considers the linear component of thediffusion tensor whereas the latter considers all three of theprincipal diffusion tensor eigenvalues; as such, TWLFA may bea more robust marker of white matter integrity. The TWLmetrics are defined as follows:
TWLCL ¼ ∑8saS
Cs � Lsð Þ ð2Þ
TWLFA ¼ ∑8saS
FAs � Lsð Þ ð3Þ
where Cs is the average linear anisotropy and FAs is averagefractional anisotropy along a streamtube (i.e., summed acrossall vertices used to generate a streamtube and divided by thenumber of vertices). We would expect the TWL metrics to beinversely correlated with TOI injury.
NS quantifies the number of streamtubes in a TOI:
NS ¼ jj S jj : ð4Þ
NS may provide useful information about white matterintegrity not captured by the length metrics and may besensitive to white matter changes, particularly in shorter,denser tracts. NS might provide a complement to the lengthmetrics. For example, lower TL could occur because of brokenfibers due to local minima in linear anisotropy or to loss offibers. In the former situation, lower TLmight be accompaniedby higher NS, whereas in the latter situation, both TL and NSmight be decreased.
The values of NS, TL, and the two TWLmetrics, however, arelikely influenced by brain size, and thus may require furthercorrection. Therefore, we normalized these metrics byapproximate intracranial volume. We chose to normalize byintracranial volume instead of brain volume because it likelyprovides a better index of brain size prior to the impact of ageand pathology (Bigler, 2004).
The volume of the intracranial vault was approximatedfrom MPRAGE volumes using SPM5 (http://www.fil.ion.ucl.ac.uk/spm/). Images were segmented into gray matter, whitematter, and cerebrospinal fluid tissue compartments (includ-ing surface CSF) using default parameter settings and retained
572 S. Correia et al. / NeuroImage 42 (2008) 568–581
in native space, then a further threshold was applied to assure95% probability of a voxel being included in the finalmaps. Theestimated intracranial volumes (ICV) were obtained bysumming the three probability maps.
We normalized NS, TL, and the two TWLmetrics by dividingour length metrics by the ratio of each participant's approx-imate intracranial volume to the average intracranial volumeof all participants. That is, we computed normalized numberof streamtubes (NNS), normalized total length (NTL), and twonormalized total weighted length metrics (NTWLCL andNTWLFA) as follows:
NTL ¼ TL
V=PV
ð5Þ
NTWLCL ¼ TWLCLV=
PV
ð6Þ
NTWLFA ¼ TWLFAV=
PV
ð7Þ
NNS ¼ NS
V=PV
ð8Þ
where V is approximate intracranial volume, and VP
is themean approximate intracranial volume for the healthy con-trols and VCI subjects combined. (The ratio in the denominatoris designed to avoid confusing and difficult to interpret unitssuch as mm/ml in the final metrics.) Normalizing the tracto-graphy metrics by total intracranial volume permits directcomparison across participants by controlling for differencesthat might be present in our models due to head size (largerhead size may influence the number and length of tractsgenerated).
Our final metric AL is a non-normalized measure of theaverage length of streamtubes in a TOI:
AL ¼ TLNS
ð9Þ
AL may provide slightly different information from TL,possibly helping to discriminate between individuals withsimilar TL values but different white matter integrity. Forexample, an individual with good white matter integrityreflected in long streamtubes vs. one with poor white matterintegrity reflected by many shorter streamtubes. We addi-tionally calculated normalized AL and average values for ourother length metrics by dividing each by NS but chose to omitthem from these analyses due to the high degree of colinearitybetween the measures (rN .72). For thoroughness, we alsodetermined the average FA across all streamtubes in thewholebrain model and in each specific TOI.
The nine metrics are clearly interdependent and in mostcases will behave similarly in most disorders impacting whitematter. That is, the pathology will drive all metric values in thesame direction (e.g., fewer and shorter streamtubes). How-ever, the different metrics likely have different implicationsfor the nature of white matter integrity loss in variousdiseases. For example, inflammatory processes such as multi-ple sclerosis might reasonably lower diffusion anisotropy butif this loss does not fall below the anisotropy threshold in thestreamtube generation algorithm, then fibers will still begenerated despite having reduced integrity. In this scenario,
the length metrics that are weighted for linear or fractionalanisotropy (e.g., NTWLFA, NTWLCL) might be more sensitive tothe pathology than TL and NS precisely because the lattermetrics do not capture subtle differences in anisotropy thatfall above the pre-specified threshold for streamtube genera-tion. Alternatively, diseases associated with multiple subcor-tical lacunar infarcts that cause complete tissue necrosismightactually result in a greater number of short tubes (i.e., longtubes that have become discontinuous as a result of an infarct)thanmight result from disorders that cause fiber dropout (e.g.,Wallerian degeneration in Alzheimer's disease). In brief,conventional MRI has such limited specificity for characteriz-ing the precise pathophysiological underpinnings of whitematter changes that consideration of all nine metrics seemsreasonable in this initial study of this approach to quantifyingthe integrity of entire white matter TOIs.
Reproducibility study
Two important factors potentially affect the reliability ofour metrics: 1) the degree to which our streamtube genera-tion algorithm yields consistent results; and 2) the degree towhich our DTI acquisition parameters yield consistent results.Two studies were conducted to address these issues: onein which we evaluated the stability or our metrics acrossmultiple models of the same dataset, and one in which wemeasured their consistency across multiple acquisitions of thesame subject. In each of these, we evaluated only our threecore metrics, NS and TL, and TWLCL. We focused on these threemetrics only because they are directly affected by ouralgorithm and by the DTI acquisition. The other metrics aremathematical derivatives of these core metrics based onaveraging or on factors such as intracranial volume or themanner inwhich anisotropy is calculated. Such derivatives areindependent of our streamtube generation algorithm or theraw data and therefore will not impact the coefficient ofvariance metric we used to determine reliability.
Consistency of streamtube generationOur jittered seeding method for streamtube generation re-
duces the likelihood of the output model being overly in-fluenced by the grid, that is, it helps to ensure that no places inthe image volume are systematically undersampled. The costfor this small random jitter is that each run of the algorithm ona single dataset produces slightly different streamtubemodels,even if the input data and parameters are held constant. Dif-ferences in the location of seed points likely affect the specificvoxels that the streamtubes pass through which, in turn, willaffect their number, length, and anisotropic weighting. Suchinconsistencies introduce error variance in our metrics which,if too great, could mask true group differences (i.e., increasedrisk of Type 2 error). To address this concern, we assessed theconsistency of ourmetrics in seven streamtubemodels derivedfrom one dataset of a single healthy control subject. The sevenmodels were produced for each of three different seedingparameters that varied in coarseness (i.e., 1.7 mm3, 0.85 mm3,and 0.64 mm3), for a total of 21 models. Other streamtubeparameters were held constant as described previously. Wethen assessed the coefficient of variance in our metrics acrossthe seven whole brain models produced at each seedingparameter. This method allowed us to determine the impact ofboth random jitter and different seeding parameters on theconsistency of our metrics.
573S. Correia et al. / NeuroImage 42 (2008) 568–581
Consistency of data acquisitionTo examine the consistency of our DTI acquisition protocol,
we examined the consistency of our metrics across datacollected from a single healthy 45-year-old, right-handedcontrol subject scanned on three different occasions.
Validity study
ParticipantsTo have utility for clinical research, our metrics must have
different values in patients with known white matter injurycompared to those presumed to have normal white matter.We addressed this by comparing the values of our metrics ina group of patients with known vascular white matter injury(i.e., vascular cognitive impairment or VCI) vs. a group ofdemographically similar healthy control subjects. VCI is aform of late-life cognitive impairment related to whitematter injury from subcortical ischemic microvascular dis-ease (Erkinjuntti, 2002; P. Sachdev, 1999). Patients with VCItypically have impairments that are greater than expectedfor age in the cognitive domains of processing speed, atten-tion, and executive functioning, and somewhat milderdeficits in memory (de Jager, 2004; Desmond, 2004; O'Brienet al., 2003; P. S. Sachdev et al., 2004). The level of cognitiveimpairment and its impact on daily functioning is insufficientto warrant a diagnosis of dementia (Rockwood, 2002).The neuroimaging features of VCI include subcortical whitematter hyperintensities on T2-weighted MRI and subcorticallacunar infarction on T1-weighted MRI (Erkinjuntti, 2002).
Participants included 14 patients with VCI (mean age=59.23±12.17, range=40.18–79.22) and 18 healthy individuals(mean age=64.36 ±14.16, range=43.77–83.62) who served ascontrol group. VCI was diagnosed by consensus at multi-disciplinary case conferences considering data from clinicalhistory, neurological exam, neuropsychological testing, andclinical brain MRI scans and using previous criteria specifiedby (Erkinjuntti, 2002). All VCI participants had impairments(i.e., performance falling more than 1.0 standard deviationsbelow demographically-corrected means) on tests of execu-tive cognitive functioning and/or memory and had MRIevidence of subcortical ischemic vascular disease (i.e., sub-cortical white matter hyperintensities on T2-weighted imagesand/or lacunar infarction on T1-weighted images) that wasgreater than expected for age. None had neuroimaging orclinical evidence of large vessel stroke. None met diagnosticcriteria for dementia. In eight patients, VCI was due toCADASIL (cerebral autosomal dominant arteriopathy withsubcortical infarcts and leukoencephalopathy), a geneticform of subcortical ischemic microvascular disease with ear-lier onset compared to the more common non-genetic form(Salloway and Desbiens, 2004). Healthy control participantswere screened by self-report to ensure the absence of currentclinically relevant neurological or psychiatric symptomsand all had normal global cognition as evidenced by scoresof 25 or greater on the 30-item Mini-Mental State Exam(Folstein et al., 1975). All data were collected as part ofongoing studies of DTI and cognitive and behavioralfunctioning in patients with disorders known to adverselyimpact white matter integrity (e.g., Brennan-Krohn et al.,2004; Correia et al., 2005a,b). Each of these research studieswas conducted with approval from our Institutional ReviewBoards, and all subjects provided written informed consentprior to participation.
Cognitive testsIf our metrics are valid, clinically-relevant markers of white
matter integrity, then they should correlate more stronglywith cognitive variables thought to be sensitive to whitematter injury than with those thought to be more stronglyassociated with cortical pathology. We explored these as-sociations in the entire sample (i.e., VCI and controls com-bined) using whole brain models only while controlling forage. We controlled for age to help control for the knowneffects of age on cognitive function, especially processingspeed (Kirasic et al., 1996), and on white matter integritymeasured by DTI (Sullivan et al., 2005). The Trail Making Testparts A & B (TMT-A&B) (Reitan, 1958) were used as measuresof psychomotor processing speed and executive function(cognitive set switching), respectively. Poorer performance onthese cognitive domains has been shown to be associatedwithincreases in white matter hyperintensities thought to reflectsubcortical small vessel ischemic injury on T2-weightedimages (Gunning-Dixon and Raz, 2000). The Boston NamingTest (BNT) (Kaplan et al., 1983) is a test of confrontationalnaming thought to be sensitive to cortical dysfunction(Lukatela et al., 1998; Votaw et al., 1999).
Statistical analysesAll statistical analyses were performed using SPSS 14.0 for
Windows (Chicago, IL).
Reliability. The stability of our metrics across repeated ac-quisitions of the same subject was examined using percentdifferences between the same metrics acquired at differenttimes. To evaluate the stability of our metrics, coefficients ofvariance (COV, mean-centered) were calculated for NS, TL, andTWLCL from the seven streamtube models produced at each ofthe three seeding parameters in a randomly selected healthycontrol dataset. COV for these metrics were calculated inwhole brain streamtube models only. Intrarater and interraterreliability for the corpus callosum and cingulum bundles wereassessed using intraclass correlation coefficients (two-wayrandom model, absolute agreement).
Correlation analyses. We used bivariate Pearson correlationcoefficients to explore the association between our metricsand age in the whole brain models in healthy controls and inVCI participants. We used partial correlations, controlling forage, to assess the association between our whole-brainmetrics including average FA and cognition. Cognitive vari-ables were subjects' performance on TMT-A, TMT-B, and BNT.
Group comparisons. As a preliminary step, we examined thedistributions of our variables for normality and homogeneityof variance. We used MANCOVA to test for significantdifferences in our nine metrics plus average FA between theVCI and healthy control groups in whole brain models whilecontrolling for age. We expected that patients with VCI wouldhave lower values than healthy controls on all our metrics. Asnoted above, we retained all nine metrics in our analyses ofwhole brain models since each potentially captures slightlydifferent information about the integrity of a specific TOI.Moreover, we had no a priori assumptions about which metricwould differentiate groups best. However, retaining such alarge number of highly collinear variables (see results for thewhole brain analysis below) for all analyses increases the riskof Type I error. Therefore, for the transcallosal and cingulum

Table 3Metric consistency across three separate data acquisitions of a single healthy control at aseeding dimension of 0.85 mm3 (mean±SD and coefficient of variance (COV))
Seed NS TL (mm) TWLCL (mm)
0.85 mm3 17210±47 549166±5072 148967±1998COV=0.3% COV=0.9% COV=1.3%
Note. all values are rounded.
574 S. Correia et al. / NeuroImage 42 (2008) 568–581
TOI analyses we retained only the five metrics that bothdiffered significantly between groups and had the largesteffect sizes in the whole brain analysis. This approach alsolimits the risk of Type II error that could arise from theinclusion of weaker metrics in TOI analysis, which may havelower statistical power due to the smaller number ofstreamtubes. As further protection against Type I error, alphawas set at .05 for each omnibus MANCOVA and to .01 forsubsequent pair-wise comparisons. Given the results of ourtests for normality (see Results), we repeated the analysesusing non-parametric Mann–Whitney U tests to evaluate theextent to which violations of normality may have influencedour results. We applied an alpha level of .01 for the non-parametric analyses.
Results and discussion
For clarity, we present the results of each analysis followedimmediately by a brief discussion. We start with thereproducibility study and then follow with the results anddiscussion for whole brain and the three TOIs: transcallosalfibers and the left and right cingulum bundles. These sectionsare followed by an overall discussion.
Results: reproducibility study
Consistency of streamtube generationWe assessed the stability of our metrics vis-à-vis our
streamtube generation algorithm in multiple models from asingle dataset of a healthy control. Seven streamtube modelswere produced for each of three different seeding dimensions(1.7 mm3, 0.85 mm3 seeding, and 0.64 mm3; 21 total models).The metrics were measured in whole brain models. Coeffi-cients of variance (COV) were calculated for TL, NS, and TWLCLacross the seven models for each seeding point. In the wholebrain models, COV did not exceed 1.0% for NS, TL, or TWLCL atany of the three seeding densities (see Table 2). The resultsshowed comparable COV when using coarser seeding para-meters (see Table 2). Note that all other metrics reported inthis paper were measured in models generated with a seedingspacing of (0.85 mm3) to match the voxel dimensions in ourdatasets.
Consistency of data acquisitionThe consistency of our metrics across repeated data
acquisitions was assessed in three datasets acquired from asingle healthy control participant collected at three differenttime points. This test was also limited to NS, TL, and TWLCLevaluated in a single whole-brain streamtube model for each
Table 2Consistency of the metrics across seven iterations of the streamtube algorithm at eachof three seeding dimensions in a single healthy control (mean PLUS/MINUS SIGN SD andcoefficient of variance (COV))
Seed NS TL (mm) TWLCL (mm)
1.70 mm3 7895±11 108978±844 26874±256COV=0.1% COV=0.8% COV=1.0%
0.85 mm3 11856±28 138752±823 33639±245COV=0.2% COV=0.8% COV=0.9%
0.64 mm3 13406±40 151180±703 36381±157COV=0.3% COV=0.8% COV=0.4%
Note. all values are rounded.
acquisition. For this test we used a seeding dimension of0.85 mm3. COVs on the percent-difference metric are pre-sented in Table 3 and did not exceed 1.3%.
TOI selection has a subjective element to it. Intrarater andinterrater reliability for transcallosal fibers and the left andright cingulum bundles was assessed for NS and TL in tendatasets selected at random. We report only on these twobecause they are the only two that are directly affected byraters' decisions (anisotropy weighting is not directly affectedby raters' decisions) and all remaining metrics are derivedfrom these. Thus, reliability for the remaining metrics can beassumed to be comparable. Intraclass correlation coefficientswere 0.95 or greater for both metrics across the three TOIs.Interrater reliability was .87 or greater for both metrics acrossall three TOIs.
Discussion: reproducibility study
These results demonstrate that our core metrics are stableacross subjects with respect to subtle differences in thetractography models that could arise from jittering the seedpoints in the streamtube generation algorithm. The resultsalso show that our metrics are stable across multiple datasetsacquired at different times. These results indicate that ourmetrics are robust to issues that can arise with serial datacollection such as differences in head placement in thescanner or subtle changes in the scanner itself. Our intraraterand interrater reliability analysis indicates that trained raterscan be consistent over time and with each other in TOIselection, at least for the relatively large and easily identifiedfiber bundles analyzed in this project.
Results: validity study (whole brain metrics)
The groups did not differ significantly by age (t=1.08;p= .29). The intracranial volume estimates for healthy controls(1571 mL±160 mL) and VCI groups (1679 mL±171 mL) did notdiffer significantly (t=−1.84, p= .08).
Levene's test revealed adequate homogeneity of variancebetween groups for most metrics across TOIs. Exceptionsincluded NNS in the whole brain (p= .05) and NS in the corpuscallosum (p= .04). Shapiro–Wilks tests revealed that the as-sumption of normality was met for most but not all metrics,but there was no consistent pattern of any one metric notmeeting this assumption across groups in each TOI. No singlecase in either group was a clear and/or consistent outlieracross the metrics and TOIs. Given the results of the normalityand outlier assessment, we decided to retain all cases and toexamine the consistency of results using both parametric andnon-parametric techniques to test for group differences in themetrics in the whole brain and various TOIs. Assumptions ofhomogeneity of variance and normality were met for wholebrain average FA.
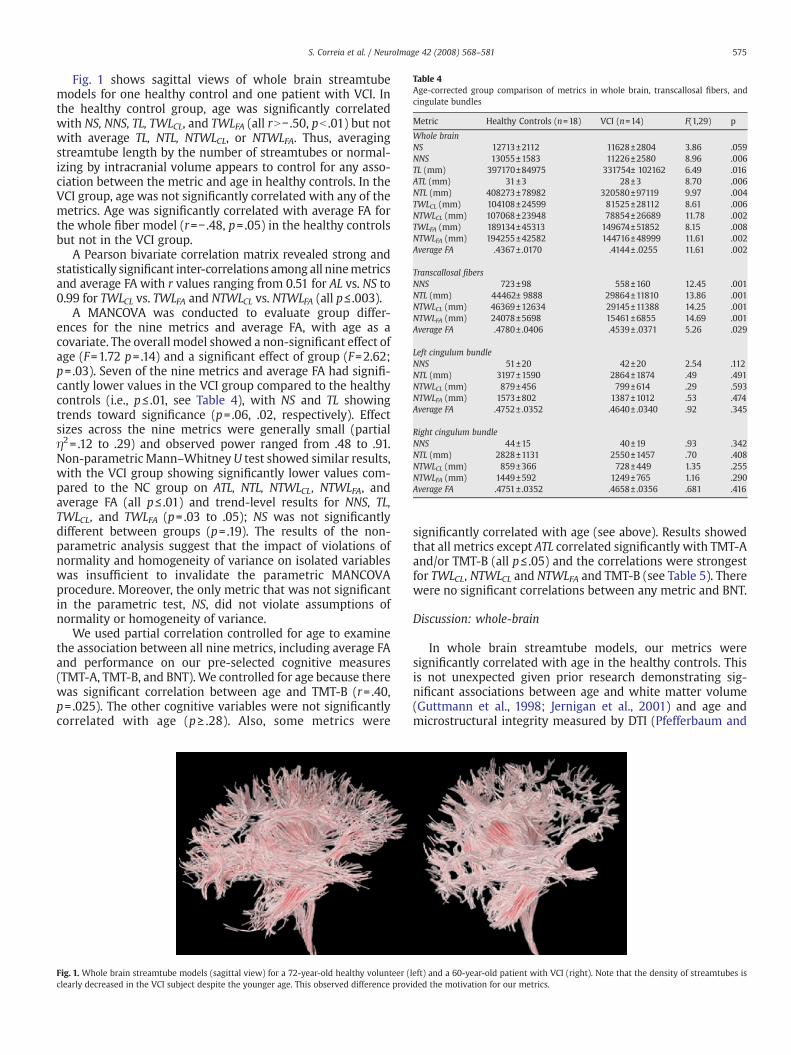
Table 4Age-corrected group comparison of metrics in whole brain, transcallosal fibers, andcingulate bundles
Metric Healthy Controls (n=18) VCI (n=14) F(1,29) p
Whole brainNS 12713±2112 11628±2804 3.86 .059NNS 13055±1583 11226±2580 8.96 .006TL (mm) 397170±84975 331754± 102162 6.49 .016ATL (mm) 31±3 28±3 8.70 .006NTL (mm) 408273±78982 320580±97119 9.97 .004TWLCL (mm) 104108±24599 81525±28112 8.61 .006NTWLCL (mm) 107068±23948 78854±26689 11.78 .002TWLFA (mm) 189134±45313 149674±51852 8.15 .008NTWLFA (mm) 194255±42582 144716±48999 11.61 .002Average FA .4367± .0170 .4144± .0255 11.61 .002
Transcallosal fibersNNS 723±98 558±160 12.45 .001NTL (mm) 44462± 9888 29864±11810 13.86 .001NTWLCL (mm) 46369±12634 29145±11388 14.25 .001NTWLFA (mm) 24078±5698 15461±6855 14.69 .001Average FA .4780± .0406 .4539± .0371 5.26 .029
Left cingulum bundleNNS 51±20 42±20 2.54 .112NTL (mm) 3197±1590 2864±1874 .49 .491NTWLCL (mm) 879±456 799±614 .29 .593NTWLFA (mm) 1573±802 1387±1012 .53 .474Average FA .4752± .0352 .4640± .0340 .92 .345
Right cingulum bundleNNS 44±15 40±19 .93 .342NTL (mm) 2828±1131 2550±1457 .70 .408NTWLCL (mm) 859±366 728±449 1.35 .255NTWLFA (mm) 1449±592 1249±765 1.16 .290Average FA .4751± .0352 .4658± .0356 .681 .416
575S. Correia et al. / NeuroImage 42 (2008) 568–581
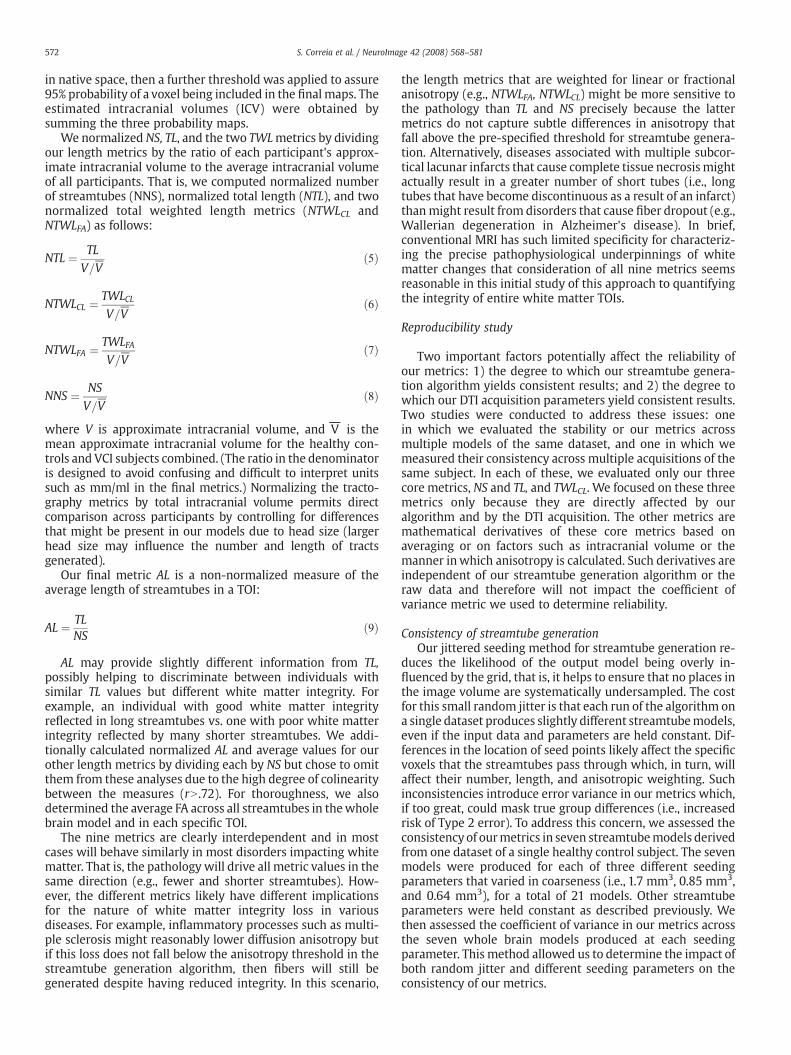
Fig. 1 shows sagittal views of whole brain streamtubemodels for one healthy control and one patient with VCI. Inthe healthy control group, age was significantly correlatedwith NS, NNS, TL, TWLCL, and TWLFA (all rN− .50, pb .01) but notwith average TL, NTL, NTWLCL, or NTWLFA. Thus, averagingstreamtube length by the number of streamtubes or normal-izing by intracranial volume appears to control for any asso-ciation between the metric and age in healthy controls. In theVCI group, age was not significantly correlated with any of themetrics. Age was significantly correlated with average FA forthe whole fiber model (r=− .48, p= .05) in the healthy controlsbut not in the VCI group.
A Pearson bivariate correlation matrix revealed strong andstatistically significant inter-correlations among all ninemetricsand average FA with r values ranging from 0.51 for AL vs. NS to0.99 for TWLCL vs. TWLFA and NTWLCL vs. NTWLFA (all p≤ .003).
A MANCOVA was conducted to evaluate group differ-ences for the nine metrics and average FA, with age as acovariate. The overall model showed a non-significant effect ofage (F=1.72 p= .14) and a significant effect of group (F=2.62;p= .03). Seven of the nine metrics and average FA had signifi-cantly lower values in the VCI group compared to the healthycontrols (i.e., p≤ .01, see Table 4), with NS and TL showingtrends toward significance (p= .06, .02, respectively). Effectsizes across the nine metrics were generally small (partialη2= .12 to .29) and observed power ranged from .48 to .91.Non-parametricMann–Whitney U test showed similar results,with the VCI group showing significantly lower values com-pared to the NC group on ATL, NTL, NTWLCL, NTWLFA, andaverage FA (all p≤ .01) and trend-level results for NNS, TL,TWLCL, and TWLFA (p= .03 to .05); NS was not significantlydifferent between groups (p= .19). The results of the non-parametric analysis suggest that the impact of violations ofnormality and homogeneity of variance on isolated variableswas insufficient to invalidate the parametric MANCOVAprocedure. Moreover, the only metric that was not significantin the parametric test, NS, did not violate assumptions ofnormality or homogeneity of variance.
We used partial correlation controlled for age to examinethe association between all nine metrics, including average FAand performance on our pre-selected cognitive measures(TMT-A, TMT-B, and BNT). We controlled for age because therewas significant correlation between age and TMT-B (r= .40,p= .025). The other cognitive variables were not significantlycorrelated with age (p≥ .28). Also, some metrics were
Fig. 1. Whole brain streamtube models (sagittal view) for a 72-year-old healthy volunteer (clearly decreased in the VCI subject despite the younger age. This observed difference prov
significantly correlated with age (see above). Results showedthat all metrics except ATL correlated significantly with TMT-Aand/or TMT-B (all p≤ .05) and the correlations were strongestfor TWLCL, NTWLCL and NTWLFA and TMT-B (see Table 5). Therewere no significant correlations between any metric and BNT.
Discussion: whole-brain
In whole brain streamtube models, our metrics weresignificantly correlated with age in the healthy controls. Thisis not unexpected given prior research demonstrating sig-nificant associations between age and white matter volume(Guttmann et al., 1998; Jernigan et al., 2001) and age andmicrostructural integrity measured by DTI (Pfefferbaum and
left) and a 60-year-old patient with VCI (right). Note that the density of streamtubes isided the motivation for our metrics.
Table 5Partial correlations (controlled for age) between metrics and cognitive tests in wholebrain TOI (whole sample, n=32)
Metric Cognitive Test
TMT-A TMT-B BNT
NS − .41⁎ − .38⁎ .02NNS − .42⁎ − .41⁎ .03TL − .39⁎ − .42⁎ .17ATL − .28 − .38 .35NTL − .37⁎ − .43⁎ .19TWLCL − .41⁎ − .45⁎⁎ .19NTWLCL − .39⁎ − .45⁎⁎ .21TWLFA − .41⁎ − .44⁎ .17NTWLFA − .39⁎ − .45⁎⁎ .19Average FA − .40⁎ − .33 − .08
Note. TMT-A=Trail Making Test part A; TMT-B=Trail Making Test part B; BNT=BostonNaming Test.⁎.05≤p≤ .02.⁎⁎p= .01.
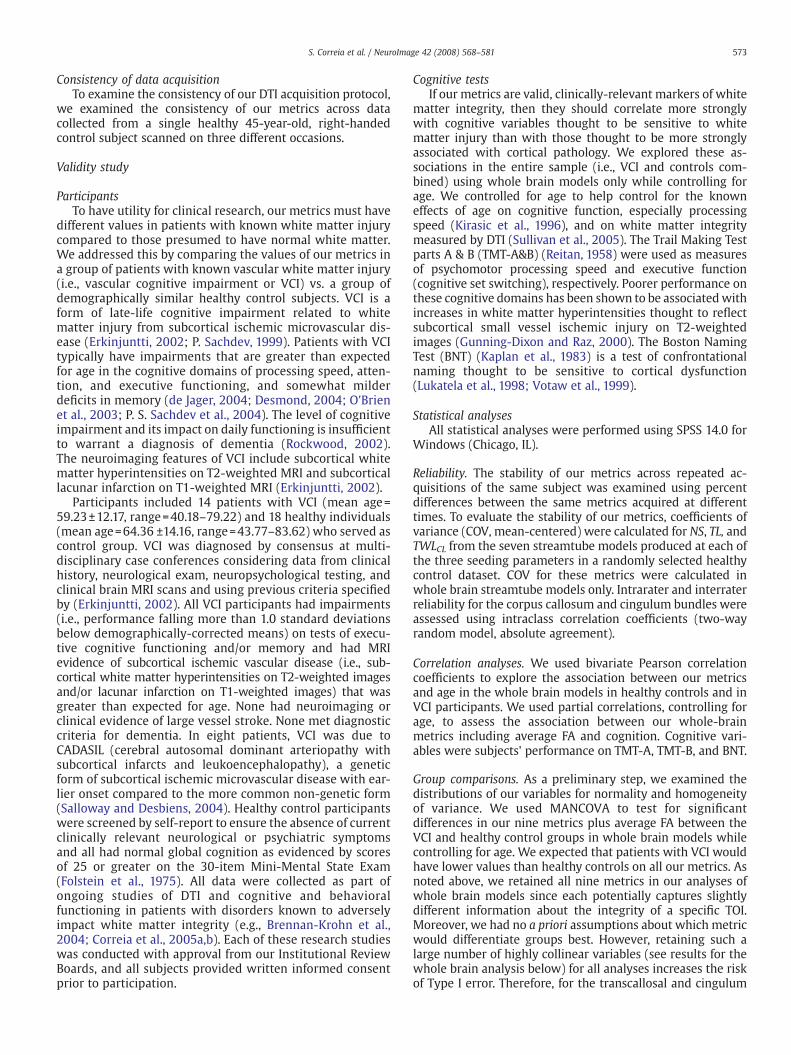
Fig. 2. Transcallosal fibers for a 48-year-old healthy volunteer showing placement ofvoxels-of-interest (in red) in axial view (top of image is anterior); for context, the leftpanel shows the fibers superimposed on a b=0 gray scale image.
576 S. Correia et al. / NeuroImage 42 (2008) 568–581
Sullivan, 2003; Pfefferbaum et al., 2000). The absence ofsignificant correlations between age and our metrics in theVCI group may reflect an alteration of the normal relationshipbetween age and white matter integrity in the presence ofsubcortical vascular disease.
There is a high degree of collinearity among the ninemetrics. This is not unexpected since all of the length-basedmetrics are derived from TL and TL is clearly positivelyassociated with NS. That is, in almost all cases higher NS willcorrespond to higher TL and lower NSwill correspond to lowerTL, except possibly in caseswhere there are lots of short brokenfibers. The significant correlation between average FA and theother metrics is also not surprising since average FA wascalculated across the streamtubes only. This result suggeststhat we could have reduced the number of variables in ouranalyses by choosing one of the metrics. However, as notedpreviously, there are conceptual differences between theaspects of white matter integrity each metric is capturing.Therefore, we decided to retain all metrics in this initial test oftheir efficacy in thewhole brain fibermodels, recognizing that,given the collinearity effects, it would be unlikely for any onemetric to outperform the others. As noted previously, webalanced this approach in the subsequent TOI analysis bylimiting the number of variables to those that performed thebest. One could argue that these metrics provide little addi-tional information than average FA since FA correlates stronglywith the other metrics and because it the largest effect size forseparating groups. However, consideration of FA in isolationpotentially omits certain important features of the whitematter such as the number and length of fibers in a TOI —information that might have clinical value to assessing theoverall health of a fiber bundle in certain disorders.
Compared to healthy controls, the VCI group had signifi-cantly lower values for average FA and for seven of the ninemetrics after controlling for age in these whole brain models.The remaining twometrics were nearly significant. This resultis not at all unexpected given that the VCI group was selectedfor the presence of subcortical ischemic white matter changeson T2-weighted MRI. The importance of the results for thecurrent validation study is that they provide evidence that ourmetrics are sensitive to white matter changes in a group ofindividuals with known vascular white matter injury.
The results of our correlation analysis indicate that ourmetrics decreased, time to complete the TMT-A and B tasks
increased. In contrast, our metrics correlated very weaklywithBNT and did not approach significance. These preliminaryresults need to be verified in a larger sample. Nonetheless,they provide additional support for the validity of our metrics;specifically, they appear to capture clinically relevant informa-tion about white matter integrity and its association withcognitive status.
Whole brain TOI metrics could be viewed as providing a“brute force” method for comparing groups on overall whitematter integrity. Thepotential advantage of this approach is thatthe whole brain TOI includes all white matter including regionsthat, on conventional MRI, appear normal or abnormal. Thus,our whole brain TOI metrics may provide more robust markersof white matter structural integrity than either volumetricmeasures of T2-lesions obtained from conventionalMRI imagesor scalarDTImeasures taken fromregion-of-interest analyses innormal-appearing white matter. The whole brain approach,however, is not useful for testing hypotheses about the integrityof particular white matter pathways or their relation tocognitive and behavioral function. To explore the potentialutility of our metrics for answering such questions, weexamined whether the VCI and healthy control groups differedon ourmetrics for three discrete TOIs: 1) transcallosalfibers andthe 2) left and right cingulum bundles. We chose to focus onthese TOIs because they are prominent and easily identifiedaspects of the anatomy and because they represent two distinctcategories of white matter fibers: commissural (i.e., inter-hemispheric) and association (i.e., intra-hemispheric) fibers.
Results: validity study (discrete tracts-of-interest)
The five metrics with the largest effect sizes in the wholebrain analysis were NTWLCL, NTWLFA, NTL, average FA, andNNS (partial η2= .289, .286, .256, .247, and .236, respectively).These five metrics were compared between groups intranscallosal and cingulum TOIs. Means and standard devia-tions for these five metrics in each TOI are reported in Table 4.
Transcallosal fibersFig. 2 shows the transcallosal fiber selection in a healthy
control.The overall MANCOVA model revealed a non-significant
effect of age (F=1.51; p= .22); and a significant effect of group
577S. Correia et al. / NeuroImage 42 (2008) 568–581
(F=3.64; p= .02). The VCI group had significantly lower valueson all five metrics compared to the healthy controls (Table 3).Effect sizes across the seven metrics were small to moderatewith partial η2 ranging from .15 for average FA and from .30 to.34 for the remainingmetrics. Observed power ranged from .60for average FA and from .93 to .96 for the remaining metrics.NTWLFA had the largest effect size and highest observed power.The group differences for the metrics were also significantwhen tested using the non-parametric Mann–Whitney U testwith p≤ .01 for all metrics except average FA (p= .04). Theresults of the non-parametric analysis suggest that the impactof violations of normality and homogeneity of variance onisolated variables were insufficient to invalidate the para-metric MANCOVA procedure.
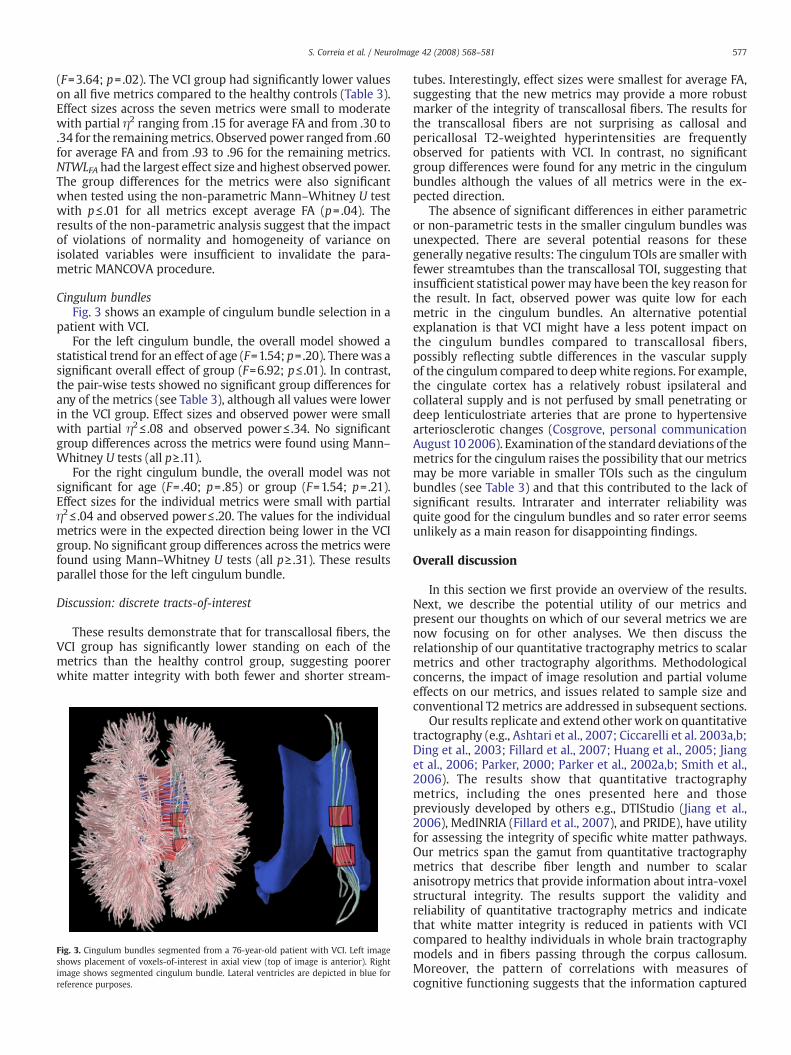
Cingulum bundlesFig. 3 shows an example of cingulum bundle selection in a
patient with VCI.For the left cingulum bundle, the overall model showed a
statistical trend for an effect of age (F=1.54; p=.20). Therewas asignificant overall effect of group (F=6.92; p≤ .01). In contrast,the pair-wise tests showed no significant group differences forany of the metrics (see Table 3), although all values were lowerin the VCI group. Effect sizes and observed power were smallwith partial η2≤ .08 and observed power≤ .34. No significantgroup differences across the metrics were found using Mann–Whitney U tests (all p≥ .11).
For the right cingulum bundle, the overall model was notsignificant for age (F=.40; p=.85) or group (F=1.54; p=.21).Effect sizes for the individual metrics were small with partialη2≤ .04 and observed power≤ .20. The values for the individualmetrics were in the expected direction being lower in the VCIgroup. No significant group differences across the metrics werefound using Mann–Whitney U tests (all p≥ .31). These resultsparallel those for the left cingulum bundle.
Discussion: discrete tracts-of-interest
These results demonstrate that for transcallosal fibers, theVCI group has significantly lower standing on each of themetrics than the healthy control group, suggesting poorerwhite matter integrity with both fewer and shorter stream-
Fig. 3. Cingulum bundles segmented from a 76-year-old patient with VCI. Left imageshows placement of voxels-of-interest in axial view (top of image is anterior). Rightimage shows segmented cingulum bundle. Lateral ventricles are depicted in blue forreference purposes.
tubes. Interestingly, effect sizes were smallest for average FA,suggesting that the new metrics may provide a more robustmarker of the integrity of transcallosal fibers. The results forthe transcallosal fibers are not surprising as callosal andpericallosal T2-weighted hyperintensities are frequentlyobserved for patients with VCI. In contrast, no significantgroup differences were found for any metric in the cingulumbundles although the values of all metrics were in the ex-pected direction.
The absence of significant differences in either parametricor non-parametric tests in the smaller cingulum bundles wasunexpected. There are several potential reasons for thesegenerally negative results: The cingulum TOIs are smaller withfewer streamtubes than the transcallosal TOI, suggesting thatinsufficient statistical powermay have been the key reason forthe result. In fact, observed power was quite low for eachmetric in the cingulum bundles. An alternative potentialexplanation is that VCI might have a less potent impact onthe cingulum bundles compared to transcallosal fibers,possibly reflecting subtle differences in the vascular supplyof the cingulum compared to deepwhite regions. For example,the cingulate cortex has a relatively robust ipsilateral andcollateral supply and is not perfused by small penetrating ordeep lenticulostriate arteries that are prone to hypertensivearteriosclerotic changes (Cosgrove, personal communicationAugust 10 2006). Examination of the standard deviations of themetrics for the cingulum raises the possibility that our metricsmay be more variable in smaller TOIs such as the cingulumbundles (see Table 3) and that this contributed to the lack ofsignificant results. Intrarater and interrater reliability wasquite good for the cingulum bundles and so rater error seemsunlikely as a main reason for disappointing findings.
Overall discussion
In this section we first provide an overview of the results.Next, we describe the potential utility of our metrics andpresent our thoughts on which of our several metrics we arenow focusing on for other analyses. We then discuss therelationship of our quantitative tractography metrics to scalarmetrics and other tractography algorithms. Methodologicalconcerns, the impact of image resolution and partial volumeeffects on our metrics, and issues related to sample size andconventional T2 metrics are addressed in subsequent sections.
Our results replicate and extend other work on quantitativetractography (e.g., Ashtari et al., 2007; Ciccarelli et al. 2003a,b;Ding et al., 2003; Fillard et al., 2007; Huang et al., 2005; Jianget al., 2006; Parker, 2000; Parker et al., 2002a,b; Smith et al.,2006). The results show that quantitative tractographymetrics, including the ones presented here and thosepreviously developed by others e.g., DTIStudio (Jiang et al.,2006), MedINRIA (Fillard et al., 2007), and PRIDE), have utilityfor assessing the integrity of specific white matter pathways.Our metrics span the gamut from quantitative tractographymetrics that describe fiber length and number to scalaranisotropy metrics that provide information about intra-voxelstructural integrity. The results support the validity andreliability of quantitative tractography metrics and indicatethat white matter integrity is reduced in patients with VCIcompared to healthy individuals in whole brain tractographymodels and in fibers passing through the corpus callosum.Moreover, the pattern of correlations with measures ofcognitive functioning suggests that the information captured
578 S. Correia et al. / NeuroImage 42 (2008) 568–581
by the metrics is clinically relevant. The lack of significantgroup differences in the cingulate bundles was unexpectedand possibly reflects either low statistical power due to therelatively smaller number of streamtubes in the cingulate TOIsor to differences in their vulnerability to vascular injury.
The results demonstrate some impact of age on our metricsin the healthy control group in the whole brain models, sug-gesting that VCI disrupts the normal association between ageand white matter integrity. Not surprisingly, there is con-siderable and significant shared variance among the metrics.This suggests that the metrics are somewhat interchangeablefrom a statistical perspective. However, conceptually eachmetric provides unique information about the underlyingwhite matter integrity. Therefore, retaining them in thewhole brain analysis in this initial validation study seemedjustified.
Potential utility of our metrics
Among our metrics, those that weight length by linear orfractional anisotropy and then normalize to intracranialvolume may be especially useful in the context of acquiredwhite matter injury in which anisotropy is lower due toinflammation, infarction, or other pathological process but notsufficiently low to alter TL or NS. These length-based metricsmight also be useful for gauging the magnitude of age-relatedreductions in white matter integrity and its impact oncognitive functioning. For example, the total length ofmyelinated axons is reduced by as much as 47% in old age,with the greatest loss evident in small-diameter fibers, whichmyelinate later in life in frontal regions of the brain(Pakkenberg, 1989). Such changes may well be related to thedecline in circumscribed executive cognitive functions seen inaging (Brennan et al., 1997; Wecker et al., 2000).
The effect sizes obtained for the transcallosal fibers suggestthat our metrics, particularly NTWLFA, are more robust thanaverage FA as markers of the structural integrity of whitematter tracts. This finding is in line with our presumption thatmetrics such as NTWLFA capture more complete informationabout the integrity of a tract than average FA. The effect sizesfor NTLWFA and NTWLCL were similar in both whole brain andtranscallosal fibers, reflecting the similarity between FA andCL. However, we have focused our ongoing work on NTWLFAsince FA incorporates both linear and planar anisotropy in asingle metric making it a conceptually more attractive andpossibly more sensitive metric than NTWLCL which quantifiesonly the linear anisotropy. Moreover, because it captures bothlinear and planar anisotropy, NTWLFA might perform better inregions where fibers cross because of the tendency of theseregions to show reductions in linear anisotropy that are ac-companied by increases in planar anisotropy. It is important tonote, however, that our work focuses mainly on adults withpathological loss of white matter integrity and that it ispossible that other metrics have greater applicability to otherclinical conditions.
Relationship to scalar metrics and other tractography algorithms
Our metrics and conventional scalar metrics provide com-plementary information about white matter integrity. Therelative utility of the two approaches depends in large part onthe research question. For example, voxel-based morpho-metric or tract-based spatial statistics may be more useful
than quantitative tractography for initial exploration of whitematter regions that differ between diagnostic groups. Theseapproaches might be followed with quantitative tractographyanalyses for further characterization of the structural integrityof specific tracts and their relationship to behavior andcognition.
Our metrics could also be used in combination with scalarmetrics to provide different levels of information about whitematter integrity. In one sense, a tract-of-interest simplyidentifies a set of voxels that comprise a functionally mean-ingful anatomical structure. Scalar metrics such as meandiffusivity, intravoxel coherence, and parallel or radialdiffusivity derived from the diffusion tensor of the voxelsincluded in a tract-of-interest could help further characterizeits structural integrity and provide clues to the nature of groupdifferences in tract integrity. For example, consider a situationwhere one group has significantly lower NTWLFA than anothergroup in a particular tract-of-interest. Follow-up analysisusing scalar metrics such as radial and parallel diffusivitymight provide insight as to whether the differences in NTWLFAreflect demyelination compared to some other process (Buddeet al., 2007; Song et al., 2002, 2005). Variability in structuralintegrity along the trajectory of a tract-of-interest could helpisolate specific regions that are vulnerable to injury. Theseregions could be identified by examining the distribution ofscalar values along the voxels that comprise the tract (Claydenet al., 2007). Scalar metrics may also be useful in disambig-uating quantitative tractography results in areas of crossingfibers (see “Image Resolution and Partial Volume Effects”below). One important caveat is that there may be limitationsto the combined analysis of our metrics and scalar metrics inthe same statistical model due to colinearity.
Another area of concern regards the validity of our metricswhen applied to alternative fiber tracking methods or to dataacquired differently or at higher field strengths. Since mosttractography algorithms solve an integration problem in thefirst eigenvector field of the diffusion tensor field, the basicprinciple underlying our metrics should hold with other fibertracking methods. This expectation assumes that there isrelative uniformity across methods in terms of the topographyand density of fiber pathways generated. Of course, themetricsare quite likely to acquire different values across methods orwith different parameter settings on the samemethod,makingdirect comparison of results based on alternative fiber trackingalgorithms difficult.
Methodological issues
Our emphasis on length measures derives from an ob-servation of shorter fibers in the tractography models of in-dividuals with white matter injury. It also reflects thelikelihood that many acquired disorders affecting whitematter produce local reductions in diffusion anisotropy that,in turn, impact the number and length of streamtubes outputby the streamtube generation algorithm. The extent of thiseffect, however, depends on the predetermined minimumlinear anisotropy and length thresholds set in the streamtubegeneration algorithm. The anisotropy and minimum lengthcriteria (≥10 mm) in our algorithm were chosen to limit thenumber of spurious, anatomically implausible fibers whileretaining a maximal number of anatomically plausible ones.Moreover, our experience is that lower levels of anisotropycause streamtubes to intrude on regions that are obviously
579S. Correia et al. / NeuroImage 42 (2008) 568–581
gray matter. Adjusting these parameters could impact themagnitude of the obtainedmetrics but is unlikely to change thepattern of results. This expectation is supported by the results ofa repeat of the current study using a higher anisotropy setting(results not shown) in which the value of our metrics changed,but the pattern of group differences remained unchanged.
The TOI used in this study were relatively easy to identifyand segment from their surroundings precisely because theystand out from fibers around them and are quite homogeneousin their topography. We anticipate that our metrics would besensitive to changes in white matter integrity even in lessdiscrete fiber bundles or in regions that are topographicallyambiguous because of high numbers of crossing or kissingfibers (e.g., inferior anterior internal capsule). However, thisassumption has not been tested.
The anatomical correctness of our streamtube models (orany other tractography method) is key for assuring accuratetract-of-interest. This issue has been addressed by others usingcolor coding and identification of specific white matter tractsby experts who are knowledgeable about white matteranatomy (e.g., (Wakana et al., 2004)). Preliminary work inour lab (data not shown) has shown that the TOIs used in thisanalysis and others (e.g., uncinate fasciculus, superior long-itudinal fasciculus, inferior longitudinal fasciculus, forcepsmajor and minor) are easily and reliably identified by expertraters (Zhang et al., 2006).
An argument could be made that normalization of ourmetrics would be most appropriate if done according to someyet-to-be-defined length metric rather than by intracranialvolume, that divides length (or number of streamtubes) byvolume. In the absence of some such measure, the term in thedenominator of our normalization formula was designed toavoid unwieldy and difficult-to-interpret units such as mm/mL.Examination of the values of the F statistic reported in Table 3suggests that normalizing our metrics reduced some degree oferror variance.
Subject motion during scanning can impact the derivationof streamtube models which, in turn, may affect calculation ofour metrics. Qualitatively, our datasets had minimal motionartifact. Although patients with dementia may be less apt toremain still during a scan than healthy controls, the level ofcognitive impairment in our patients was quite mild and nonemet diagnostic criteria for dementia. Accordingly, it is reason-able to believe that motion artifact was sufficiently similar inboth groups to conduct this initial test of themetrics. Applyingmotion correction before calculating tensors may improve thereliability and robustness of the results, but at this time thereis no true consensus on an optimal method for implementingmotion correction in DTI data.
Image resolution and partial volume effects
Our tractography algorithm was based on diffusion dataacquired in 12 directions and our image resolution (prior tointerleaving) is relatively low. Other studies have stressed theimportance of acquiring data in more directions to improvethe anatomical accuracy of tractography models (Hirsch et al.,2003; Ozarslan and Mareci, 2003). However, the extent of thisbenefit is debated (Wedeen et al., 2005). Our use of 12gradient directions in this study is based on two main factors.First, our data acquisition began prior to the wider acceptanceand implementation of high-angular resolution scanning.Second, because of non-technical institutional constraints,
12 directions was the maximum that we could obtain on ourscanner when we started data acquisition. A higher numberof gradient directions and higher overall image resolutionmight have improved the representativeness of the tracto-graphy models and the absolute values obtained in ouranalysis. Our core assumptions that streamtube length andnumber capture important features of the underlying anat-omy seem likely to hold with additional diffusion encodingdirections and higher spatial resolution, although this has notbeen tested. A related issue is the potential impact of morediffusion encoding directions and higher spatial resolutionon rater reliability. Such improvements ought to permitraters to make more fine-grained decisions about what fibersshould be included or excluded from a tract-of-interest butwhether this would improve or reduce intrarater or inter-rater reliability has not been determined.
One area of concern that we have not directly assessed isthe reliability of our method in regions with high partialvolume effects or of crossing or kissing fibers causingincoherent diffusion. Tractography methods that rely onthe principal direction of diffusion may have difficultymoving past such regions. This is a well-known problem intractography and our method, which depends on tracto-graphic results as a building block, will be impacted by it. It islikely that the different metrics will be impacted in differentways. For example, the total length of a tract-of-interest willlikely be shorter because fibers will not pass through regionsof incoherent diffusion if linear anisotropy drops below thepre-specified threshold for fiber propagation. The number offibers may go up, if what would have otherwise been a singlepath is divided where a second tract crosses the tract ofinterest. The specific effects on the metrics will also besomewhat dependent on the decisions made to segment thetract such as where segmentation boxes are placed relativeto the location of diffusion ambiguity.
In healthy normal brains, regions of crossing or kissingfibers should not produce a significant subject-by-region bias.Rather, they should simply be a source of noise that isrelatively stable across individuals (although intra- and inter-rater reliability may suffer due to the ambiguity in thetractography results in these regions). However, it is possiblethat in patient groups, the metrics could acquire misleadingvalues in areas of fiber crossing if one group of fibers isselectively impacted by the disease (e.g., Wallerian degenera-tion from a distal focal lesion). This potential problem mightbe partly minimized by coupling tractographic methods withhigher angular resolution acquisitions to produce paths thatcontinue accurately through regions of crossing fibers. Thesepaths could then be used to calculate our un-weightedmetrics,thereby reducing some of the ambiguity we currently have.Ideally, the metrics could be weighted by some yet-to-be-determined scalar metric (other than FA or CL) that capturesthe relative linearity of each fiber compartment in a region ofcrossing or kissing fibers. This would further attenuate theproblems caused by partial volume effects and producemetrics that are more directly coupled to the underlyinganatomy and pathology. Alternatively, conventional scalar DTImetrics such as mean diffusivity, planar anisotropy, andisotropy (Westin et al., 2002) might help resolve ambiguityabout the nature of diffusion characteristics in such regions.For example, differences arising from disruption of all fibersin a crossing region should cause a local increase in isotropywhereas preferential disruption of one crossing fiber bundle
580 S. Correia et al. / NeuroImage 42 (2008) 568–581
might result in decreased planar anisotropy and increasedlinear anisotropy or changes in their orientation.
Sample size and relation to T2 metrics
Further validation of ourmetrics in larger samples andwithother disorders impacting white matter will help confirm thevalidity and clinical utility of ourmetrics. Inparticular, itwill beimportant to evaluate the extent to which our metrics addincremental predictive accuracy over and above other mea-surements of white matter integrity such as region-of-interestapproaches using scalar DTI metrics and T2 white matterlesion volume for discriminating patients from controls. Ofcourse, incremental predictive validity depends on the patientpopulation and specific tracts-of-interest being studied. Pre-liminary data from our lab (not shown) suggests that NTWLFAand NTWLCL are more strongly correlated with cognitivefunction than T2-weighted lesion volume in patients withCADASIL (Patel et al., 2007) and in patients withmild cognitiveimpairment (Patel et al., 2008).
Summary and conclusion
We explored the potential clinical utility of nine metricsderived from cerebral DTI tractography data. The validity of themetrics was evaluated inwhole brainwhite matter and in threedistinct TOIs in patients with VCI vs. healthy controls. Aftercontrolling for age, the VCI group had significantly lower metricvalues than the healthy controls in whole brain models and intranscallosal fibers. The metrics were not significantly differentbetween groups in the left and right cingulumbundles, althoughthe VCI group had lower standing on all metrics in the analysis.This study extends priorwork showing that quantitativemetricscan be derived from DTI tractography data that provideclinically-relevant information about the microstructural integ-rity of cerebral whitematter. In particular, themetrics presentedhere provide a means for combining basic metrics that describewhite matter morphology (e.g., length and number of fibers)with intra-voxel scalar anisotropy metrics while consideringtracts in their entirety. The metrics can be used in whole brainmodels of white matter connectivity or in specific white matterpathways. A potential strength of our approach is that since themodels are defined in a 3D environment, TOI selection can occuron a dataset-by-dataset basis so that the unique individualvariability in white matter bundle shape considered in its en-tirety can be preserved— information that may be lost withsophisticated image registration to a common template. Quanti-tative tractographymetrics are potentially a powerful alternativeto the non-tractography scalar-based approaches to DTI analysiscommonly used clinical studies and provide researchers withrobust and conceptually valid tools for assessing the structuralintegrity of specific white matter pathways.
References
Ahrens, E.T., Laidlaw, D.H., Readhead, C., Brosnan, C.F., Fraser, S.E., Jacobs, R.E., 1998. MRmicroscopy of transgenic mice that spontaneously acquire experimental allergicencephalomyelitis. Magn. Reson. Med. 40 (1), 119–132.
Akers, D., Sherbondy, A., Mackenzie, R., Dougherty, R., Wandell, B., 2004. Exploration ofthe brain's white matter pathways with dynamic queries. Paper presented at theIEEE Visualization '04, San Antonio.
Ashtari, M., Cottone, J., Ardekani, B.A., Cervellione, K., Szeszko, P.R., Wu, J., et al., 2007.Disruption of white matter integrity in the inferior longitudinal fasciculus in adoles-cents with schizophrenia as revealed by fiber tractography. Arch. Gen. Psychiatry64 (11), 1270–1280.
Basser, P.J., Mattiello, J., LeBihan, D.,1994. MR diffusion tensor spectroscopy and imaging.Biophys. J. 66 (1), 259–267.
Beaulieu, C., 2002. The basis of anisotropic water diffusion in the nervous system — atechnical review. NMR Biomed. 15 (7–8), 435–455.
Bigler, E.D., 2004. Neuropsychological results and neuropathological findings at autopsyin a case of mild traumatic brain injury. J. Int. Neuropsychol. Soc. 10 (5), 794–806.
Brennan, M., Welsh, M.C., Fisher, C.B., 1997. Aging and executive function skills: anexamination of a community-dwelling older adult population. Percept. Mot. Skills84 (3 Pt 2), 1187–1197.
Brennan-Krohn, T., Correia, S., Zhang, S., Laidlaw, D., Malloy, P., Salloway, S., 2004.Diffusion-tensor imaging and executive function in vascular cognitive impairment.Paper presented at the International Society of Magnetic Resonance in Medicine:Workshop on Aging Connections: Advanced MRI of Age-Related White MatterChanges in the Brain (poster), Boston (October 21–23, 2004).
Budde, M.D., Kim, J.H., Liang, H.F., Schmidt, R.E., Russell, J.H., Cross, A.H., et al., 2007.Toward accurate diagnosis of white matter pathology using diffusion tensorimaging. Magn. Reson. Med. 57 (4), 688–695.
Carpenter,M.B.,1991. Core Text of Neuroanatomy, 4th ed.Williams &Wilkins, Baltimore.Ciccarelli, O., Parker, G.J., Toosy, A.T.,Wheeler-Kingshott, C.A., Barker, G.J., Boulby, P.A., et al.,
2003a. From diffusion tractography to quantitative white matter tract measures: areproducibility study. Neuroimage 18 (2), 348–359.
Ciccarelli, O., Toosy, A.T., Parker, G.J., Wheeler-Kingshott, C.A., Barker, G.J., Miller, D.H., et al.,2003b. Diffusion tractography based groupmapping ofmajor white-matter pathwaysin the human brain. Neuroimage 19 (4), 1545–1555.
Clayden, J., Zhang, S., Correia, S., Laidlaw, D., 2007. Fine-grained comparison of anisotropydifferences between groups ofwhitematter tracts. Paper presented at the Proceedingsof the International Society of Magnetic Resonance in Medicine, Berlin, Germany.
Correia, S., Brennan-Krohn, T., Schlicting, E., Zhang, S., Laidlaw, D., Malloy, P., et al., 2005a.Diffusion-tensor imaging in vascular cognitive impairment and mild cognitiveimpairment: relationship with executive functioning. (Poster abstract). Paper pre-sented at the 2nd Congress of the International Society for Vascular, Cognitive andBehavioural Disorders (VAS-COG), Florence, Italy. June 8–12.
Correia, S., Brennan-Krohn, T., Zhang, S., Laidlaw, D., Malloy, P., Salloway, S., 2005b.Diffusion-tensor imaging and executive function in subcortical ischemic vasculardisease andmild cognitive impairment. Paper presented at the 33rdAnnualMeetingof the International Neuropsychological Society, St. Louis, MO. February 2–5, 2005.
Cosgrove, R.G., personal communication August 10, 2006.de Jager, C.A., 2004. Changes over time in memory, processing speed and clock drawing
tests help to discriminate between vascular cognitive impairment, mild cognitiveimpairment and Alzheimer's disease. Neurol. Res. 26 (5), 481–487.
Delmarcelle, T., Hesselink, L., 1993. Visualizing second-order tensor fields with hyper-stream lines. IEEE Comput. Graph. Appl. 13 (4), 25–33.
Desmond, D.W., 2004. The neuropsychology of vascular cognitive impairment: is therea specific cognitive deficit? J. Neurol. Sci. 226 (1–2), 3–7.
Ding, Z., Gore, J.C., Anderson, A.W., 2003. Classification and quantification of neuronalfiber pathways using diffusion tensor MRI. Magn. Reson. Med. 49 (4), 716–721.
Erkinjuntti, T., 2002. Diagnosis and management of vascular cognitive impairment anddementia. J. Neural Transm., Suppl. 63, 91–109.
Fillard, P., Souplet, J., Toussaint, N., 2007.Medical ImageNavigation and Research Tool byINRIA (MedINRIA). France.
Folstein, M., Folstein, E., McHugh, P., 1975. Mini-Mental State Exam: a practical methodfor grading the cognitive status of patients. J. Psychiatr. Res. 12, 189–198.
Gunning-Dixon, F.M., Raz, N., 2000. The cognitive correlates of whitematter abnormalitiesin normal aging: a quantitative review. Neuropsychology 14 (2), 224–232.
Guttmann, C.R., Jolesz, F.A., Kikinis, R., Killiany, R.J., Moss, M.B., Sandor, T., et al., 1998.White matter changes with normal aging. Neurology 50 (4), 972–978.
Haines, D., 2004. Neuroanatomy: An atlas of structures, sections, and systems, 6th ed.Lippincott Williams & Wilkins, Baltimore.
Hirsch, J.G., Schwenk, S.M., Rossmanith, C., Hennerici, M.G., Gass, A., 2003. Deviationsfrom the diffusion tensormodel as revealed by contour plot visualization using highangular resolution diffusion-weighted imaging (HARDI). Magma, 16 (2), 93–102.
Huang, H., Zhang, J., Jiang, H., Wakana, S., Poetscher, L., Miller, M.I., et al., 2005. DTItractography based parcellation of white matter: application to the mid-sagittalmorphology of corpus callosum. Neuroimage 26 (1), 195–205.
Jernigan, T.L., Archibald, S.L., Fennema-Notestine, C., Gamst, A.C., Stout, J.C., Bonner, J., et al.,2001. Effects of age on tissues and regions of the cerebrum and cerebellum. Neurobiol.Aging 22 (4), 581–594.
Jiang, H., van Zijl, P.C., Kim, J., Pearlson, G.D., Mori, S., 2006. DTIStudio: resource programfor diffusion tensor computation and fiber bundle tracking. Comput. MethodsPrograms Biomed. 81 (2), 106–116.
Jones, D.K., Lythgoe, D., Horsfield, M.A., Simmons, A., Williams, S.C., Markus, H.S., 1999.Characterization of white matter damage in ischemic leukoaraiosis with diffusiontensor MRI. Stroke 30 (2), 393–397.
Kaplan, E., Goodglass, H., Weintraub, S., 1983. The Boston Naming Test, 2nd ed. Lea andFebiger, Philadelphia.
Kirasic, K.C., Allen, G.L., Dobson, S.H., Binder, K.S., 1996. Aging, cognitive resources, anddeclarative learning. Psychol. Aging. 11 (4), 658–670.
Laidlaw, D., Zhang, S., Bastin, M.E., Correia, S., Salloway, S., Malloy, P., 2004.Ramifications of isotropic sampling and acquisition orientation on DTI analyses.(poster). Paper presented at the Twelfth Scientific Meeting and Exhibition,International Society for Magnetic Resonance in Medicine, Kyoto, Japan.
Larsson, E.M., Englund, E., Sjobeck, M., Latt, J., Brockstedt, S., 2004. MRI with diffusiontensor imaging post-mortem at 3.0 T in a patient with frontotemporal dementia.Dement. Geriatr. Cogn. Disord. 17 (4), 316–319.
Le Bihan, D., Mangin, J.F., Poupon, C., Clark, C.A., Pappata, S., Molko, N., et al., 2001. Diffusiontensor imaging: concepts and applications. J. Magn. Reson. Imaging 13 (4), 534–546.
581S. Correia et al. / NeuroImage 42 (2008) 568–581
Lukatela, K., Malloy, P., Jenkins, M., Cohen, R., 1998. The naming deficit in earlyAlzheimer's and vascular dementia. Neuropsychology 12 (4), 565–572.
Mori, S., van Zijl, P.C., 2002. Fiber tracking: principles and strategies — a technicalreview. NMR Biomed. 15 (7–8), 468–480.
O'Brien, J.T., Erkinjuntti, T., Reisberg, B., Roman, G., Sawada, T., Pantoni, L., et al., 2003.Vascular cognitive impairment. Lancet Neurol. 2 (2), 89–98.
Ozarslan, E., Mareci, T.H., 2003. Generalized diffusion tensor imaging and analyticalrelationships between diffusion tensor imaging and high angular resolutiondiffusion imaging. Magn. Reson. Med. 50 (5), 955–965.
Pajevic, S., Pierpaoli, C., 1999. Color schemes to represent the orientation of anisotropictissues from diffusion tensor data: application to white matter fiber tract mappingin the human brain. Magn. Reson. Med. 42 (3), 526–540.
Pakkenberg, B., 1989. What happens in the leucotomised brain? A postmortemmorphological study of brains from schizophrenic patients. J. Neurol. Neurosurg.Psychiatry. 52 (2), 156–161.
Parker, G.J., 2000. Tracing fibre tracts using fast marching. Proceedings of theInternational Society of Magnetic Resonance in Medicine, p. 85.
Parker, G.J., Stephan, K.E., Barker, G.J., Rowe, J.B., MacManus, D.G., Wheeler-Kingshott, C.A.,et al., 2002a. Initial demonstration of in vivo tracing of axonal projections in themacaque brain and comparisonwith the human brain using diffusion tensor imagingand fast marching tractography. Neuroimage 15 (4), 797–809.
Parker, G.J., Wheeler-Kingshott, C.A., Barker, G.J., 2002b. Estimating distributedanatomical connectivity using fast marchingmethods and diffusion tensor imaging.IEEE. Trans. Med. Imaging. 21 (5), 505–512.
Patel, K., Correia, S., Foley, J., Schlicting, E., Zhang, S., Laidlaw, D., et al., 2007. Cognitiveimpairment, hippocampal volume, and white matter integrity in CADASIL. Paperpresented at the 35th Annual Meeting of the International NeuropsychologicalSociety, Portland, OR.
Patel, K., Correia, S., Laidlaw, D., Salloway, S., 2008. Functional implications of whitematter vs. grey matter changes in mild cognitive impairment. Paper presented atthe 36th Annual Meeting of the International Neuropsychological Society.Waikoloa, HI. Feb. 6–9.
Pfefferbaum, A., Sullivan, E.V., 2003. Increased brain white matter diffusivity in normaladult aging: Relationship to anisotropy and partial voluming. Magn. Reson. Med.49 (5), 953–961.
Pfefferbaum, A., Sullivan, E.V., Hedehus, M., Lim, K.O., Adalsteinsson, E., Moseley, M.,2000. Age-related decline in brainwhitematter anisotropymeasuredwith spatiallycorrected echo-planar diffusion tensor imaging.Magn. Reson.Med. 44 (2), 259–268.
Reese, T.G., Heid, O., Weisskoff, R.M., Wedeen, V.J., 2003. Reduction of eddy-current-induced distortion in diffusionMRI using a twice-refocused spin echo. Magn. Reson.Med. 49 (1), 177–182.
Reitan, R., 1958. Validity of the Trail Making Test as an indicator of organic braindamage. Percept. Mot. Skills. 8, 271–276.
Rockwood, K., 2002. Vascular cognitive impairment and vascular dementia. J. Neurol.Sci. 203–204, 23–27.
Sachdev, P., 1999. Vascular cognitive disorder. Int. J. Geriatr. Psychiatry 14 (5), 402–403.Sachdev, P.S., Brodaty, H., Valenzuela, M.J., Lorentz, L., Looi, J.C., Wen,W., et al., 2004. The
neuropsychological profile of vascular cognitive impairment in stroke and TIApatients. Neurology 62 (6), 912–919.
Salloway, S., Desbiens, S., 2004. CADASIL and other genetic causes of stroke and vasculardementia. In: Paul, R., Cohen, R., Ott, B., Salloway, S. (Eds.), Vascular Dementia:Cerebrovascular Mechanisms and Clinical Management. Humana Press, Totowa, NJ,pp. 87–98.
Smith, S.M., Jenkinson, M., Johansen-Berg, H., Rueckert, D., Nichols, T.E., Mackay, C.E.,et al., 2006. Tract-based spatial statistics: voxelwise analysis of multi-subjectdiffusion data. Neuroimage 31 (4), 1487–1505.
Song, S.K., Sun, S.W., Ramsbottom, M.J., Chang, C., Russell, J., Cross, A.H., 2002.Dysmyelination revealed through MRI as increased radial (but unchanged axial)diffusion of water. Neuroimage 17 (3), 1429–1436.
Song, S.K., Yoshino, J., Le, T.Q., Lin, S.J., Sun, S.W., Cross, A.H., et al., 2005. Demyelinationincreases radial diffusivity in corpus callosum of mouse brain. Neuroimage 26 (1),132–140.
Sullivan, E.V., Adalsteinsson, E., Pfefferbaum, A., 2005. Selective age-related degra-dation of anterior callosal fiber bundles quantified in vivo with fiber tracking.Cereb Cortex. 16 (7), 1030–1039.
Sun, S.W., Song, S.K., Harms, M.P., Lin, S.J., Holtzman, D.M., Merchant, K.M., et al., 2005.Detection of age-dependent brain injury in a mouse model of brain amyloidosisassociated with Alzheimer's disease using magnetic resonance diffusion tensorimaging. Exp. Neurol. 191 (1), 77–85.
Votaw, J.R., Faber, T.L., Popp, C.A., Henry, T.R., Trudeau, J.D., Woodard, J.L., et al., 1999. Aconfrontational naming task produces congruent increases and decreases in PETand fMRI. Neuroimage 10 (4), 347–356.
Wakana, S., Jiang, H., Nagae-Poetscher, L.M., van Zijl, P.C., Mori, S., 2004. Fiber tract-based atlas of human white matter anatomy. Radiology 230 (1), 77–87.
Wakana, S., Nagae-Poetscher, L.M., Jiang, H., van Zijl, P., Golay, X., Mori, S., 2005.Macroscopic orientation component analysis of brain white matter andthalamus based on diffusion tensor imaging. Magn. Reson. Med. 53 (3),649–657.
Wecker, N.S., Kramer, J.H., Wisniewski, A., Delis, D.C., Kaplan, E., 2000. Age effects onexecutive ability. Neuropsychology 14 (3), 409–414.
Wedeen, V.J., Hagmann, P., Tseng, W.Y., Reese, T.G., Weisskoff, R.M., 2005. Mappingcomplex tissue architecture with diffusion spectrum magnetic resonance imaging.Magn. Reson. Med. 54 (6), 1377–1386.
Westin, C.F., Peled, S., Gubjartsson, H., Kikinis, R., Jolesz, F., 1997. Geometrical diffusionmeasures for MRI from tensor basis analysis. Paper presented at the InternationSociety for Magnetic Resonance in Medicine. Vancouver, Canada.
Westin, C.F., Maier, S.E., Mamata, H., Nabavi, A., Jolesz, F.A., Kikinis, R., 2002.Processing and visualization for diffusion tensor MRI. Med. Image Anal. 6 (2),93–108.
Xue, R., van Zijl, P.C., Crain, B.J., Solaiyappan, M., Mori, S., 1999. In vivo three-dimensionalreconstruction of rat brain axonal projections by diffusion tensor imaging. Magn.Reson. Med. 42 (6), 1123–1127.
Zhang, S., Demiralp, C., Laidlaw, D., 2003. Visualizing diffusion tensor MR imagesusing streamtubes and streamsurfaces. IEEE Trans. Vis. Comput. Graph. 9 (4),454–462.
Zhang, S., Correia, S., Tate, D., Laidlaw, D., 2006. Correlating DTI fiber clusters withwhite matter anatomy. Paper presented at the 14th ISMRM Scientific Meeting &Exhibition. Seattle, WA.