Embed Size (px)
Citation preview
RUNNING TITLE COMES HERE IN RUNNING TITLE STYLE
1
QUANTITATIVE UPDATE OF THE EBA MREL REPORT (DECEMBER 2016 DATA)
20 December 2017
QUANTITATIVE UPDATE ON MREL (DECEMBER 2016 DATA)
2
Summary The EBA has previously produced quantitative analysis on MREL in its June 2016 interim MREL Report1 and December 2016 Final report on MREL2. These two analyses were respectively based on data as of 30 June 2015 and 31 December 2015. The EBA has now updated the quantitative analysis of the Final report on MREL. This update covers the analysis of MREL ratios, MREL capacity, MREL quality and estimated MREL funding needs of the full sample of 112 EU banks as of end December 2016. In addition, a consistent sample of 100 banks is used to compare the evolution of MREL over the year 2016.
To ensure comparability, analysis in this note is conducted using the same methodology as outlined in the Final report on MREL. As a result, interpretation of the findings is subject to the same limitations and caveats, including the absence of actual bank-specific MREL decisions by resolution authorities and data quality considerations. As in the previous exercises this analysis provides aggregate averages that must be read with caution as there is significant variance across individual banks. High variance of MREL ratios across banks is illustrated by the median and quartile MREL values presented in box plot diagrams. Key data analysis caveats are summarised in the annex to this document.
Full sample – December 2016 data
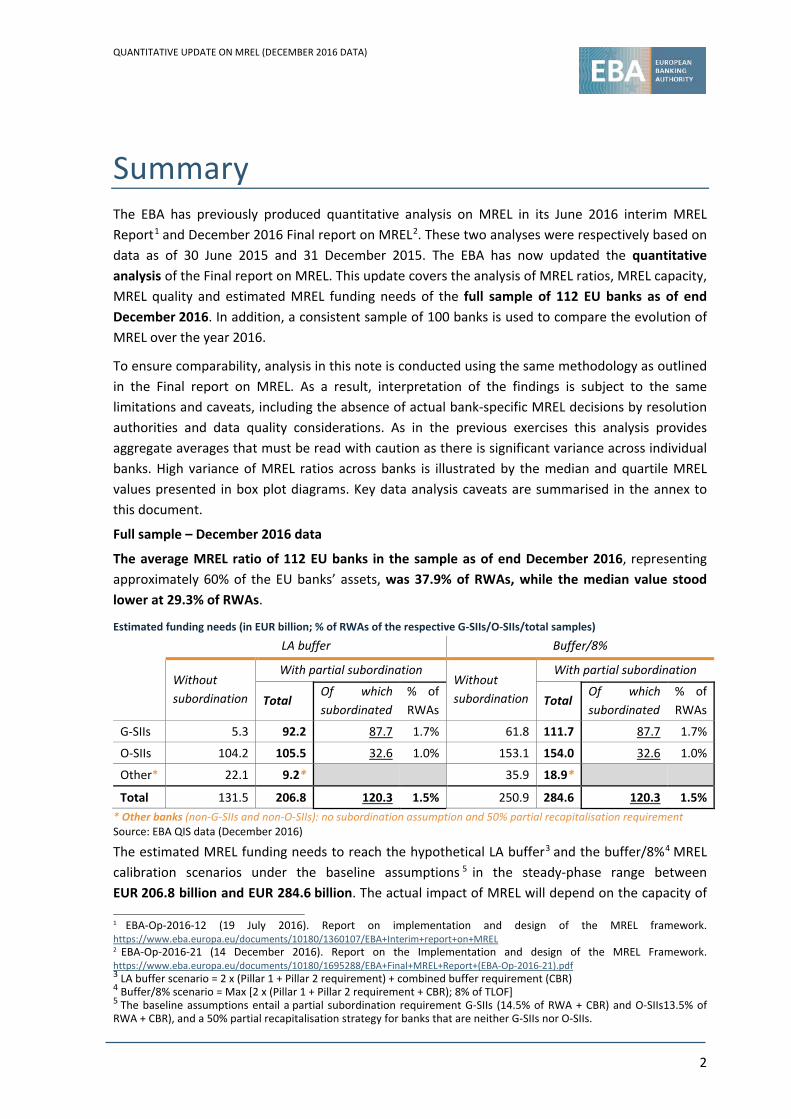
The average MREL ratio of 112 EU banks in the sample as of end December 2016, representing approximately 60% of the EU banks’ assets, was 37.9% of RWAs, while the median value stood lower at 29.3% of RWAs.
Estimated funding needs (in EUR billion; % of RWAs of the respective G-SIIs/O-SIIs/total samples)
LA buffer Buffer/8%
Without subordination
With partial subordination Without subordination
With partial subordination
Total Of which subordinated
% of RWAs
Total Of which subordinated
% of RWAs
G-SIIs 5.3 92.2 87.7 1.7% 61.8 111.7 87.7 1.7%
O-SIIs 104.2 105.5 32.6 1.0% 153.1 154.0 32.6 1.0%
Other* 22.1 9.2* 35.9 18.9*
Total 131.5 206.8 120.3 1.5% 250.9 284.6 120.3 1.5% * Other banks (non-G-SIIs and non-O-SIIs): no subordination assumption and 50% partial recapitalisation requirement Source: EBA QIS data (December 2016)
The estimated MREL funding needs to reach the hypothetical LA buffer3 and the buffer/8%4 MREL calibration scenarios under the baseline assumptions 5 in the steady-phase range between EUR 206.8 billion and EUR 284.6 billion. The actual impact of MREL will depend on the capacity of 1 EBA-Op-2016-12 (19 July 2016). Report on implementation and design of the MREL framework. https://www.eba.europa.eu/documents/10180/1360107/EBA+Interim+report+on+MREL 2 EBA-Op-2016-21 (14 December 2016). Report on the Implementation and design of the MREL Framework. https://www.eba.europa.eu/documents/10180/1695288/EBA+Final+MREL+Report+(EBA-Op-2016-21).pdf 3 LA buffer scenario = 2 x (Pillar 1 + Pillar 2 requirement) + combined buffer requirement (CBR) 4 Buffer/8% scenario = Max [2 x (Pillar 1 + Pillar 2 requirement + CBR); 8% of TLOF] 5 The baseline assumptions entail a partial subordination requirement G-SIIs (14.5% of RWA + CBR) and O-SIIs13.5% of RWA + CBR), and a 50% partial recapitalisation strategy for banks that are neither G-SIIs nor O-SIIs.
QUANTITATIVE UPDATE ON MREL (DECEMBER 2016 DATA)
3
markets to absorb the volumes of MREL issuances needed for the build-up of MREL, and the corresponding capacity of banks (especially deposit-funded banks) to access markets, including to access to deep, developed markets.
There is a significant variance of MREL ratios across individual banks, especially among non G-SIIs. Individual bank results vary depending on systemic importance, size and cross-border activity, as well as funding models (namely deposit-taking intensity):
1) The average MREL ratio for G-SIIs is lower than the sample average (33.6% of RWAs) and slightly higher for O-SIIs (41.9% of RWAs). The average MREL ratio for other banks (non G-SIIs and non O-SIIs) is significantly higher (50.6% of RWAs) than the sample average.
2) However, median MREL ratios provide a different insight: for half of the G-SIIs MREL ratios are below 29.9% of RWAs. The median ratio is lower for O-SII (29.0% of RWAs) and lowest for the other banks (23.0% of RWAs). High variance across the sub-samples is present.
3) From a funding profile perspective, retail deposit-funded banks have lower than average MREL ratios, with almost half exhibiting MREL ratios below 21% of RWAs.
In order to assess the minimum subordination requirements stemming from the TLAC term sheet, as in the Final report on MREL6 the EBA has assumed a partial subordination requirement of 14.5% of RWAs + CBR for G-SIIs. With a view to an improved resolvability of O-SIIs and a level playing field with G-SIIs, a partial subordination requirement of 13.5% of RWAs + CBR has also been tested in relation to O-SIIs, assuming that it would only enter into force (hypothetically) in 2022.
The minimum partial subordination requirement would result in a need for G-SIIs in the sample to issue an additional EUR 87.7 billion in subordinated debt in either LA buffer or buffer/8% scenario, which would account for 1.7% of their all G-SIIs’ RWAs. The minimum partial subordination requirement would result in a need for O-SIIs in the sampleto issue and additional EUR 32.6 billion in subordinated debt. This would account for 1.0% of O-SIIs’ RWAs. Given the heterogeneity across the O-SIIs subsample, resolution authorities may need to set MREL targets and transitional periods on a case-by-case basis, taking into account the resolution strategy for the institution, the relevant debt market for that bank, and its liability structure.
In relation to other banks (non-G-SIIs and non-O-SIIs), no automatic subordination requirement has been assumed. In addition, for those banks a 50% recapitalisation requirement rather than 100% has been tested, which further reduced estimated MREL funding needs.
When applying the buffer/8% scenario7, the analysis shows that, for G-SIIs and O-SIIs, in 10 cases (out of 63) the 8% of TLOF benchmark is higher than the general MREL requirement in the Buffer scenario. It is higher than the institutions’ current MREL eligible resources in only 4 cases.
The impact of an 8% benchmark and assessed estimated MREL funding needs may be higher if resolution authorities exclude from MREL some of the liabilities governed by the law of a third-country8 or if consider that part of MREL-eligible liabilities are likely to be excluded from bail-in9.
Consistent sample – December 2016 and December 2015 data 6 EBA-Op-2016-21 (14 December 2016). Report on the Implementation and design of the MREL Framework. 7 In which banks in the sample should meet the higher of twice capital requirements and buffers and 8% of total liabilities and own funds (TLOF). 8 Article 45(5) of the BRRD 9 Under Article 3 of the RTS on MREL.
QUANTITATIVE UPDATE ON MREL (DECEMBER 2016 DATA)
4
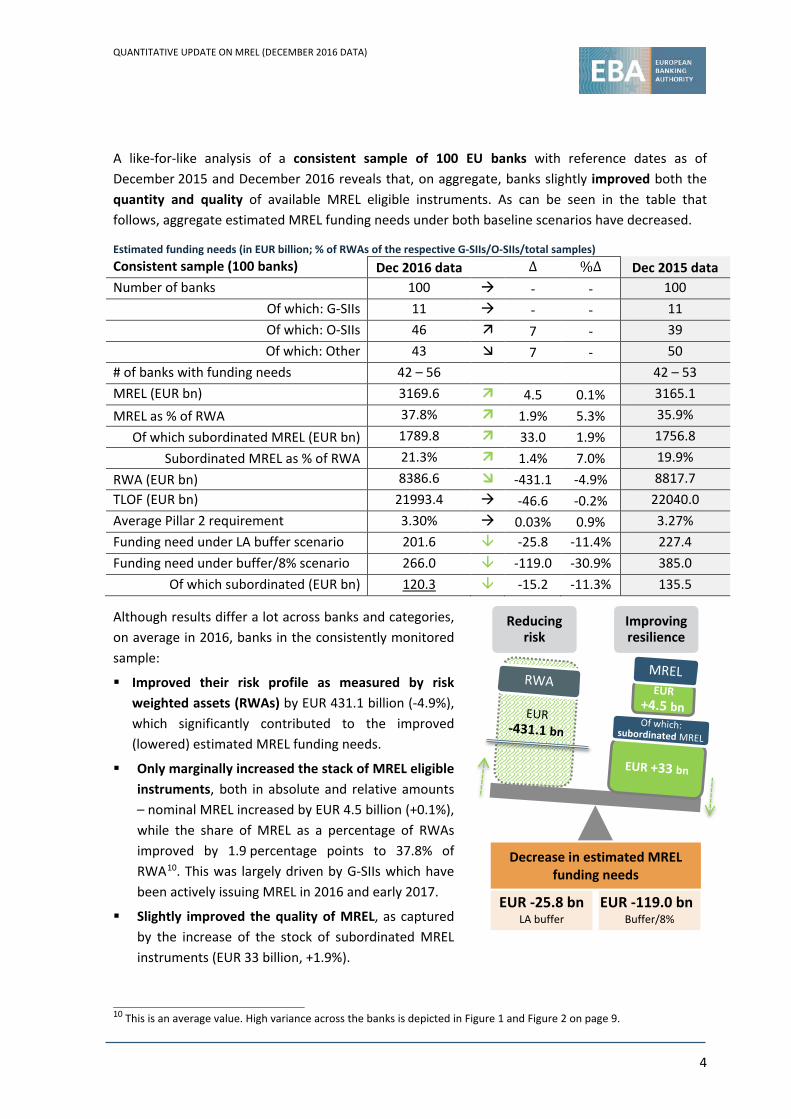
A like-for-like analysis of a consistent sample of 100 EU banks with reference dates as of December 2015 and December 2016 reveals that, on aggregate, banks slightly improved both the quantity and quality of available MREL eligible instruments. As can be seen in the table that follows, aggregate estimated MREL funding needs under both baseline scenarios have decreased.
Estimated funding needs (in EUR billion; % of RWAs of the respective G-SIIs/O-SIIs/total samples) Consistent sample (100 banks) Dec 2016 data ∆ %∆ Dec 2015 data Number of banks 100 - - 100
Of which: G-SIIs 11 - - 11 Of which: O-SIIs 46 7 - 39 Of which: Other 43 7 - 50
# of banks with funding needs 42 – 56 42 – 53 MREL (EUR bn) 3169.6 4.5 0.1% 3165.1 MREL as % of RWA 37.8% 1.9% 5.3% 35.9%
Of which subordinated MREL (EUR bn) 1789.8 33.0 1.9% 1756.8 Subordinated MREL as % of RWA 21.3% 1.4% 7.0% 19.9%
RWA (EUR bn) 8386.6 -431.1 -4.9% 8817.7 TLOF (EUR bn) 21993.4 -46.6 -0.2% 22040.0 Average Pillar 2 requirement 3.30% 0.03% 0.9% 3.27% Funding need under LA buffer scenario 201.6 -25.8 -11.4% 227.4 Funding need under buffer/8% scenario 266.0 -119.0 -30.9% 385.0
Of which subordinated (EUR bn) 120.3 -15.2 -11.3% 135.5
Although results differ a lot across banks and categories, on average in 2016, banks in the consistently monitored sample:
Improved their risk profile as measured by risk weighted assets (RWAs) by EUR 431.1 billion (-4.9%), which significantly contributed to the improved (lowered) estimated MREL funding needs.
Only marginally increased the stack of MREL eligible instruments, both in absolute and relative amounts – nominal MREL increased by EUR 4.5 billion (+0.1%), while the share of MREL as a percentage of RWAs improved by 1.9 percentage points to 37.8% of RWA10. This was largely driven by G-SIIs which have been actively issuing MREL in 2016 and early 2017.
Slightly improved the quality of MREL, as captured by the increase of the stock of subordinated MREL instruments (EUR 33 billion, +1.9%).
10 This is an average value. High variance across the banks is depicted in Figure 1 and Figure 2 on page 9.
Reducing risk
Improving resilience
Decrease in estimated MREL funding needs
EUR -25.8 bn LA buffer
EUR -119.0 bn Buffer/8%
QUANTITATIVE UPDATE ON MREL (DECEMBER 2016 DATA)
5
Mitigated total estimated MREL funding needs by EUR 25.8 billion (-11.4%) and EUR 119.0 billion (-30.9%) under LA buffer and buffer/8% baseline scenarios respectively. Aggregated subordinated estimated MREL funding needs have decreased by EUR 15.2 billion (-11.3%).
QUANTITATIVE UPDATE ON MREL (DECEMBER 2016 DATA)
6
QUANTITATIVE UPDATE OF THE EBA MREL REPORT (December 2016 data)
!
Import data analysis caveats
The results in this document have been produced in line with the methodology underpinning the original December 2016 Report and must be read in conjunction with the important data analysis caveats presented in further details in the Annex.
In particular, MREL decisions are to be determined and calibrated by resolution authorities for each and every institution according to the specific characteristics of the firm. However, given that to this date no MREL decision has yet been taken, assumptions had to be made as to resolution strategies, scope and calibration of MREL. These assumptions are in line with the EBA RTS on MREL11 but are, by definition, different from the actual levels of MREL that will ultimately be determined for each institution and group.
The methodology follows current broad MREL eligibility criteria, including senior debt and deposits. Hypothetical MREL funding needs are estimated on a consolidated basis. Own funds counting towards consolidated capital requirements, and liabilities issued at all levels in the group (excluding intragroup liabilities) are included towards meeting the consolidated MREL requirement.
The funding needs of institution in the sample are estimated against the following main assumptions:
An LA buffer scenario – Twice capital requirements + combined buffer requirement. No market confidence layer is considered for the recapitalisation amount.
A buffer/8% scenario – Higher of i) twice capital requirements including the combined buffer requirement (CBR), and ii) 8% of total liabilities and own funds (TLOF). When calculating the recapitalisation amount, the scenario assumes that the resolution authority includes the CBR and also assesses, for all banks, the potential impact of the requirement for burden sharing to be imposed on at least 8% of an institution’s TLOF in order to ensure access to resolution funding arrangements. This could be required to implement the resolution scheme. This scenario cannot be assumed to be a likely outcome for all banks in the sample.
A partial subordination requirement for G-SIIs (13.5% of RWA) and O-SIIs (12.5% of RWA).
A partial recapitalisation assumption for banks that are neither G-SIIs not O-SIIs – For those banks the resolution strategy is less likely to entail full recapitalisation and therefore funding needs have been assessed under a 50% recapitalisation assumption instead of the full recapitalisation tested for G-SIIs and O-SIIs.
While funding needs are expressed as average aggregates, high variance of MREL ratios is present across institutions.
11 Commission Delegated Regulation (EU) 2016/1450 of 23 May 2016, OJ L 237, 3.9.2016, p. 1–9 .
QUANTITATIVE UPDATE ON MREL (DECEMBER 2016 DATA)
7
1. The purpose
This note provides a quantitative update on the EBA MREL report with regards to the analysis of MREL ratios, MREL capacity, MREL quality and estimated MREL funding needs of the sample of EU banks as of end December 2016. It does not comprise any new macroeconomic impact assessment or MREL policy discussions.
The EBA has previously produced a quantitative analysis on MREL in the Final report on MREL12 published in December 2016 (using December 2015 data as a reference), and in the Interim report on MREL13 published in July 2016 (June 2015 data).
It is important to note that the estimated MREL funding needs presented in the said MREL reports provide comprehensive point-in-time overview, but cannot be directly compared across the different reference dates. Variations in the results are partly attributable to change in sample, assumed MREL calibration targets due to changing Pillar 2 requirement and combined buffer requirement, and MREL eligibility assumptions.
2. The context
Bail-in is a crucial element of the resolution reforms but its efficiency depends on whether banks have issued, at the point of failure, enough instruments that are eligible to be bailed-in and that can be bailed-in effectively and credibly without threatening financial stability. This is why the BRRD requires resolution authorities to determine a minimum requirement for own funds and liabilities eligible for bail-in, also known as MREL. In that sense, MREL is an essential complement to the bail-in tool.
The EBA analyses data on a wide sample of banks in order to assess the situation of banks operating in the EU in relation to the MREL requirement, depending on different options for the scope of MREL-eligible instruments and different hypothetical scenarios for the calibration of the MREL requirements.
3. Brief overview of the methodology applied
All analyses in this note are conducted using the same methodology as outlined in the Final Report on MREL and the Annex 1 of this document. As a result, interpretations of the findings are subject to the same limitations and caveats, including the absence of actual MREL decisions by resolution authorities and data quality considerations.
In the absence of MREL decisions, the calibration of MREL targets relies on two hypothetical scenarios that are sensitive to applicable capital requirements (Pilar 1, Pillar 2 and combined buffer
12 EBA-Op-2016-21 (14 December 2016). Report on the Implementation and design of the MREL Framework. https://www.eba.europa.eu/documents/10180/1695288/EBA+Final+MREL+Report+(EBA-Op-2016-21).pdf 13 EBA-Op-2016-12 (19 July 2016). Report on implementation and design of the MREL framework. https://www.eba.europa.eu/documents/10180/1360107/EBA+Interim+report+on+MREL
QUANTITATIVE UPDATE ON MREL (DECEMBER 2016 DATA)
8
requirement) and agnostic as far as the institution-specific preferred resolution strategy is concerned.
The detailed analysis of Pillar 2 requirements (at reporting date) as of December 2015 and December 2016 revealed a number of material differences and inconsistencies over time. At the beginning of September 2017, in order to improve data quality the EBA together with the Task Force on Impact Assessment has conducted an additional data validation exercise and requested all competent authorities to verify Pillar 2 data (‘at reporting date’) provided as of December 2015 and December 2016. As a result, it is assumed that the figures reported by competent authorities for Pillar 2 applicable at the reporting date as of December 2016 and December 2015 correctly reflect the bank-specific Pillar 2 requirement and excludes any Pillar 2 guidance component. No adjustments to Pillar 2 requirement are made14.
4. Quantitative update
The sample
This report draws on data on external MREL issuance and balance sheet information collected through the EBA’s regular CRD –CRR/Basel III monitoring exercise15 as of December 2016.
The sample comprises 112 banks16 from 18 EU Member States and covers approximately 60% of the total EU banking sector’s assets.17 The sample includes almost all EU G-SIIs18 and a fair proportion of EU O-SIIs. The sample also includes banks that are neither G-SIIs nor O-SIIs, referred to as ‘other’ banks. For the present analysis, the sample of O-SIIs excludes G-SIIs. The participation of banks in the monitoring exercise is voluntary.
Beyond the classification of banks into G-SIIs, O-SIIs and other (non G-SIIs and non O-SIIs banks), the respective subsamples are still heterogeneous. In terms of banks’ total risk weighted assets (RWAs), G-SIIs banks’ RWA range between EUR 131.9 billion and EUR 810.4 billion, O-SIIs range between EUR 1.8 billion and EUR 283.9 billion, while other banks’ RWAs range from as low as EUR 0.2 billion to EUR 59.5 billion.
The sample decomposition per different funding model reveals that 50 banks rely significantly on retail deposit funding, i.e. they have at least 40% of total liabilities and own funds (TLOF) composed of retail deposits.
14 In the Final Report on MREL (14 December 2016) the Pillar 2 component of the capital requirement applied was a bank-specific number reduced by 1 percentage point (100 basis points (bps)) in order to proxy the anticipated introduction of the distinction between Pillar 2 requirement (P2R) and the Pillar 2 guidance (P2G). 15 For more information on the EBA’s Basel II monitoring exercise, see https://www.eba.europa.eu/risk-analysis-and-data/quantitative-impact-study/basel-iii-monitoring-exercise. 16 This compares to 133 banks that voluntarily provided data as of December 2015. 17 Data source: ECB Consolidated Banking Data database. 18 The sample covers 12 out of 13 EU G-SIIs.
QUANTITATIVE UPDATE ON MREL (DECEMBER 2016 DATA)
9
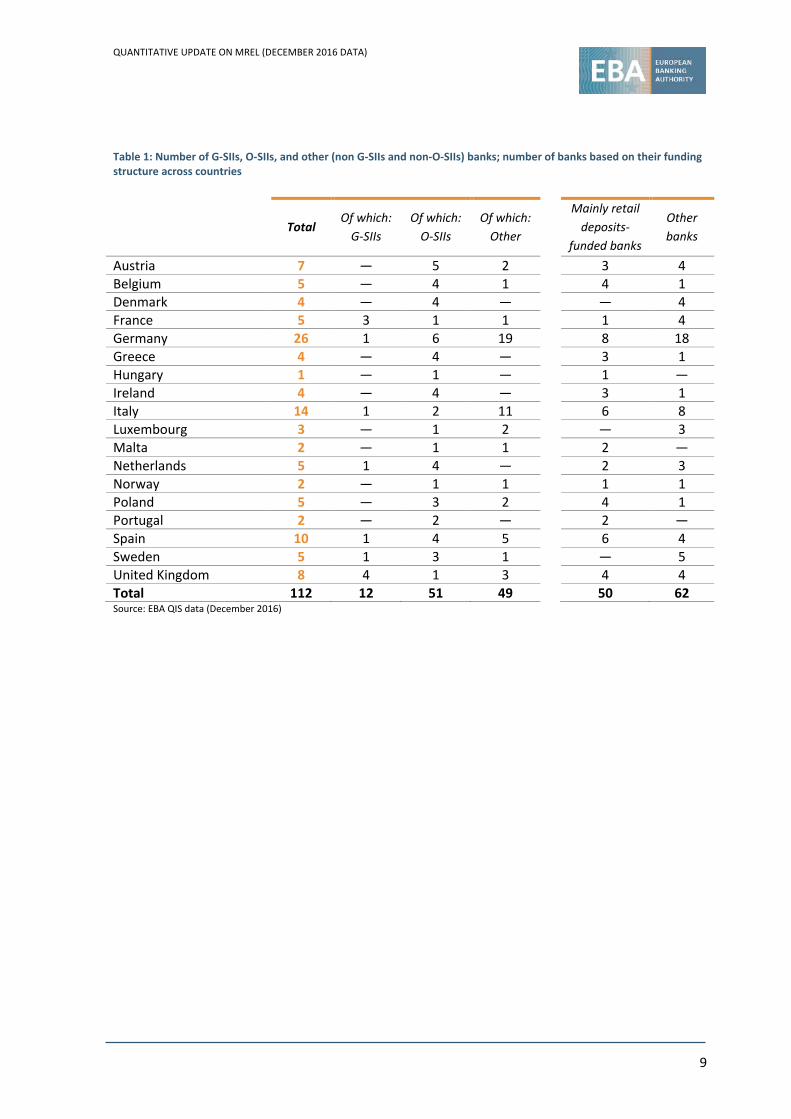
Table 1: Number of G-SIIs, O-SIIs, and other (non G-SIIs and non-O-SIIs) banks; number of banks based on their funding structure across countries
Total Of which:
G-SIIs Of which:
O-SIIs Of which:
Other Mainly retail
deposits-funded banks
Other banks
Austria 7 — 5 2 3 4 Belgium 5 — 4 1 4 1 Denmark 4 — 4 — — 4 France 5 3 1 1 1 4 Germany 26 1 6 19 8 18 Greece 4 — 4 — 3 1 Hungary 1 — 1 — 1 — Ireland 4 — 4 — 3 1 Italy 14 1 2 11 6 8 Luxembourg 3 — 1 2 — 3 Malta 2 — 1 1 2 — Netherlands 5 1 4 — 2 3 Norway 2 — 1 1 1 1 Poland 5 — 3 2 4 1 Portugal 2 — 2 — 2 — Spain 10 1 4 5 6 4 Sweden 5 1 3 1 — 5 United Kingdom 8 4 1 3 4 4 Total 112 12 51 49 50 62 Source: EBA QIS data (December 2016)
QUANTITATIVE UPDATE ON MREL (DECEMBER 2016 DATA)
10
MREL capacity
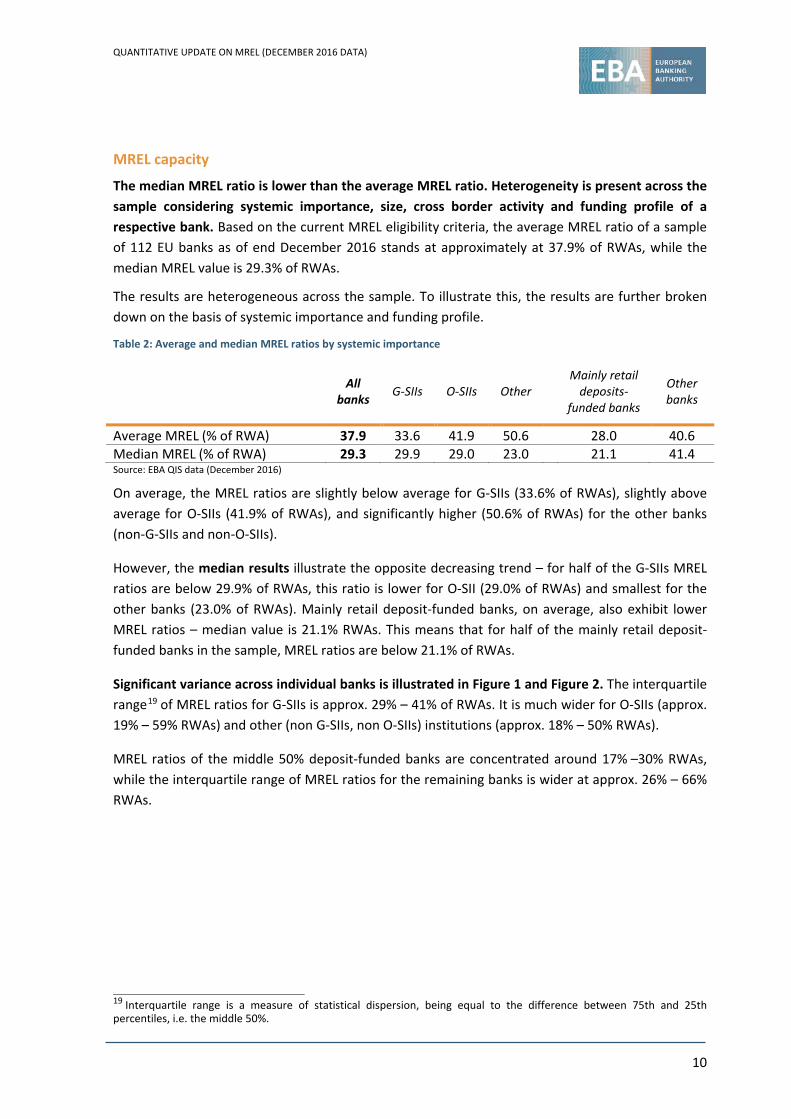
The median MREL ratio is lower than the average MREL ratio. Heterogeneity is present across the sample considering systemic importance, size, cross border activity and funding profile of a respective bank. Based on the current MREL eligibility criteria, the average MREL ratio of a sample of 112 EU banks as of end December 2016 stands at approximately at 37.9% of RWAs, while the median MREL value is 29.3% of RWAs.
The results are heterogeneous across the sample. To illustrate this, the results are further broken down on the basis of systemic importance and funding profile.
Table 2: Average and median MREL ratios by systemic importance
All banks G-SIIs O-SIIs Other
Mainly retail deposits-
funded banks
Other banks
Average MREL (% of RWA) 37.9 33.6 41.9 50.6 28.0 40.6 Median MREL (% of RWA) 29.3 29.9 29.0 23.0 21.1 41.4 Source: EBA QIS data (December 2016)
On average, the MREL ratios are slightly below average for G-SIIs (33.6% of RWAs), slightly above average for O-SIIs (41.9% of RWAs), and significantly higher (50.6% of RWAs) for the other banks (non-G-SIIs and non-O-SIIs).
However, the median results illustrate the opposite decreasing trend – for half of the G-SIIs MREL ratios are below 29.9% of RWAs, this ratio is lower for O-SII (29.0% of RWAs) and smallest for the other banks (23.0% of RWAs). Mainly retail deposit-funded banks, on average, also exhibit lower MREL ratios – median value is 21.1% RWAs. This means that for half of the mainly retail deposit-funded banks in the sample, MREL ratios are below 21.1% of RWAs.
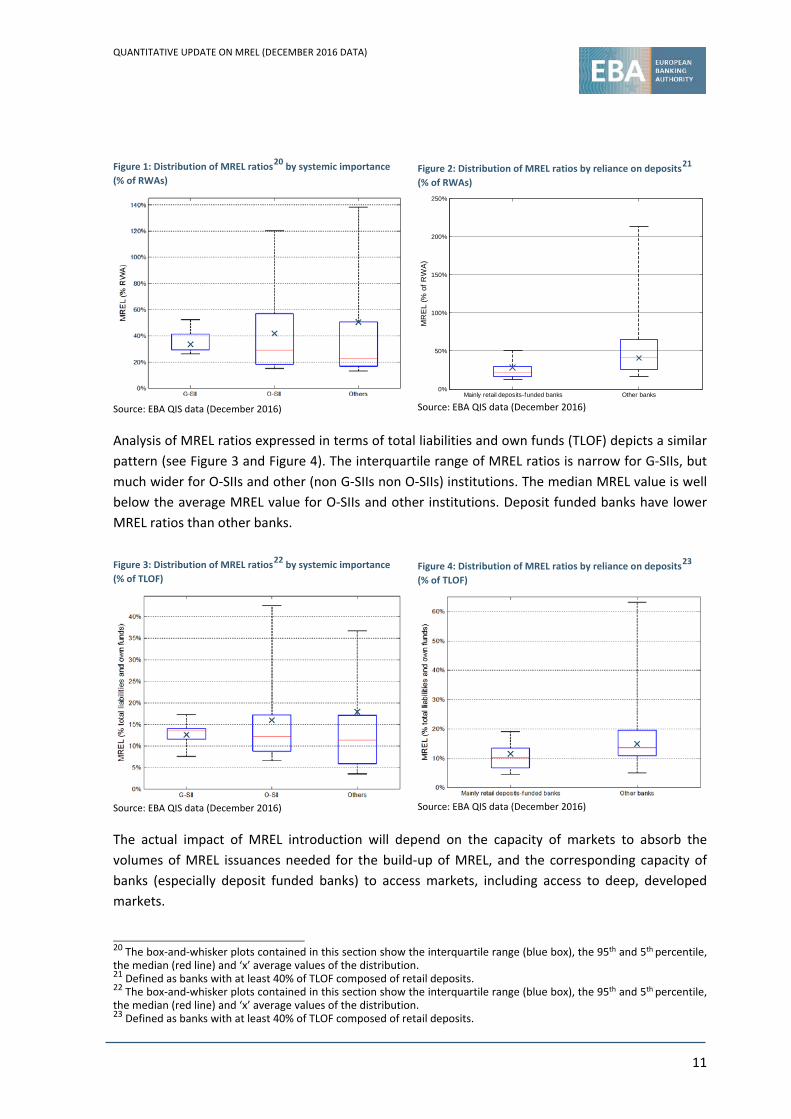
Significant variance across individual banks is illustrated in Figure 1 and Figure 2. The interquartile range19 of MREL ratios for G-SIIs is approx. 29% – 41% of RWAs. It is much wider for O-SIIs (approx. 19% – 59% RWAs) and other (non G-SIIs, non O-SIIs) institutions (approx. 18% – 50% RWAs).
MREL ratios of the middle 50% deposit-funded banks are concentrated around 17% –30% RWAs, while the interquartile range of MREL ratios for the remaining banks is wider at approx. 26% – 66% RWAs.
19 Interquartile range is a measure of statistical dispersion, being equal to the difference between 75th and 25th percentiles, i.e. the middle 50%.
QUANTITATIVE UPDATE ON MREL (DECEMBER 2016 DATA)
11
Analysis of MREL ratios expressed in terms of total liabilities and own funds (TLOF) depicts a similar pattern (see Figure 3 and Figure 4). The interquartile range of MREL ratios is narrow for G-SIIs, but much wider for O-SIIs and other (non G-SIIs non O-SIIs) institutions. The median MREL value is well below the average MREL value for O-SIIs and other institutions. Deposit funded banks have lower MREL ratios than other banks.
The actual impact of MREL introduction will depend on the capacity of markets to absorb the volumes of MREL issuances needed for the build-up of MREL, and the corresponding capacity of banks (especially deposit funded banks) to access markets, including access to deep, developed markets.
20 The box-and-whisker plots contained in this section show the interquartile range (blue box), the 95th and 5th percentile, the median (red line) and ‘x’ average values of the distribution. 21 Defined as banks with at least 40% of TLOF composed of retail deposits. 22 The box-and-whisker plots contained in this section show the interquartile range (blue box), the 95th and 5th percentile, the median (red line) and ‘x’ average values of the distribution. 23 Defined as banks with at least 40% of TLOF composed of retail deposits.
Figure 1: Distribution of MREL ratios20 by systemic importance (% of RWAs)
Source: EBA QIS data (December 2016)
Figure 2: Distribution of MREL ratios by reliance on deposits21 (% of RWAs)
Source: EBA QIS data (December 2016)
Figure 3: Distribution of MREL ratios22 by systemic importance (% of TLOF)
Source: EBA QIS data (December 2016)
Figure 4: Distribution of MREL ratios by reliance on deposits23 (% of TLOF)
Source: EBA QIS data (December 2016)
Mainly retail deposits-funded banks Other banks 0%
50%
100%
150%
200%
250%
MR
EL
(% o
f RW
A)
QUANTITATIVE UPDATE ON MREL (DECEMBER 2016 DATA)
12
MREL composition
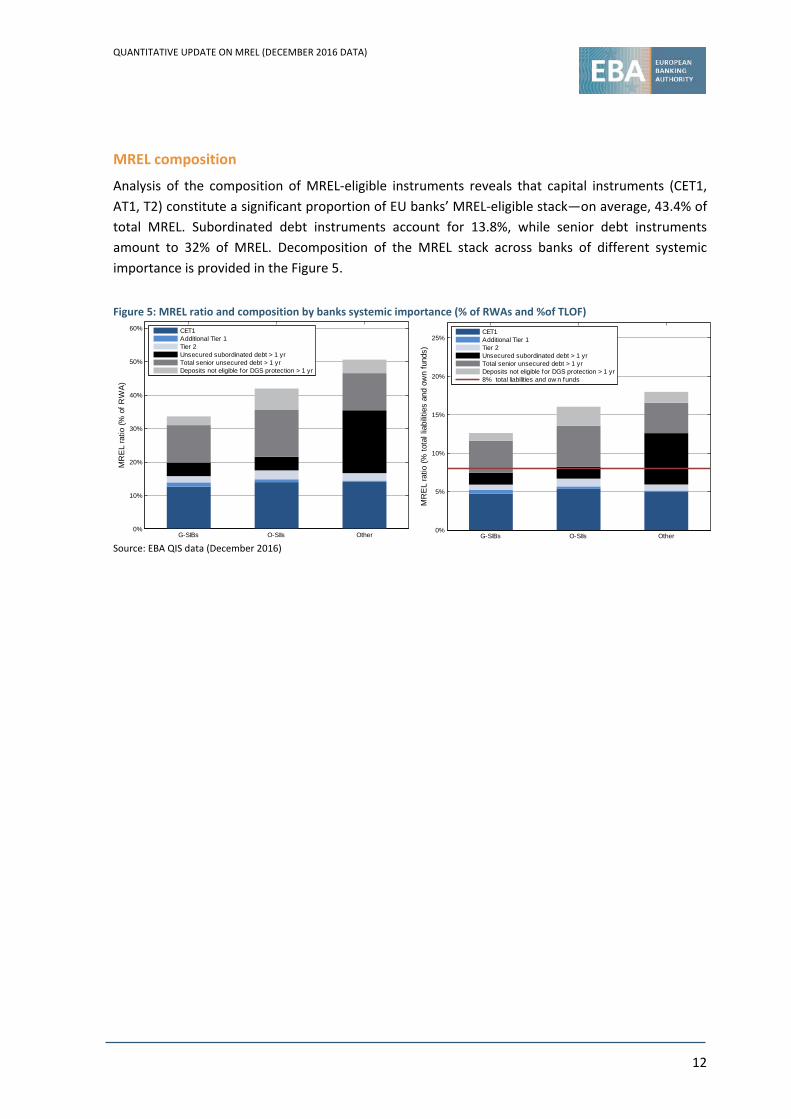
Analysis of the composition of MREL-eligible instruments reveals that capital instruments (CET1, AT1, T2) constitute a significant proportion of EU banks’ MREL-eligible stack—on average, 43.4% of total MREL. Subordinated debt instruments account for 13.8%, while senior debt instruments amount to 32% of MREL. Decomposition of the MREL stack across banks of different systemic importance is provided in the Figure 5.
Figure 5: MREL ratio and composition by banks systemic importance (% of RWAs and %of TLOF)
Source: EBA QIS data (December 2016)
G-SIBs O-SIIs Other 0%
10%
20%
30%
40%
50%
60%
MR
EL
ratio
(% o
f RW
A)
CET1Additional Tier 1Tier 2Unsecured subordinated debt > 1 yrTotal senior unsecured debt > 1 yrDeposits not eligible for DGS protection > 1 yr
G-SIBs O-SIIs Other 0%
5%
10%
15%
20%
25%
MR
EL
ratio
(% to
tal l
iabi
litie
s an
d ow
n fu
nds)
CET1Additional Tier 1Tier 2Unsecured subordinated debt > 1 yrTotal senior unsecured debt > 1 yrDeposits not eligible for DGS protection > 1 yr8% total liabilities and ow n funds
QUANTITATIVE UPDATE ON MREL (DECEMBER 2016 DATA)
13
Summary of estimated MREL funding needs
Overall funding needs and differences across banks
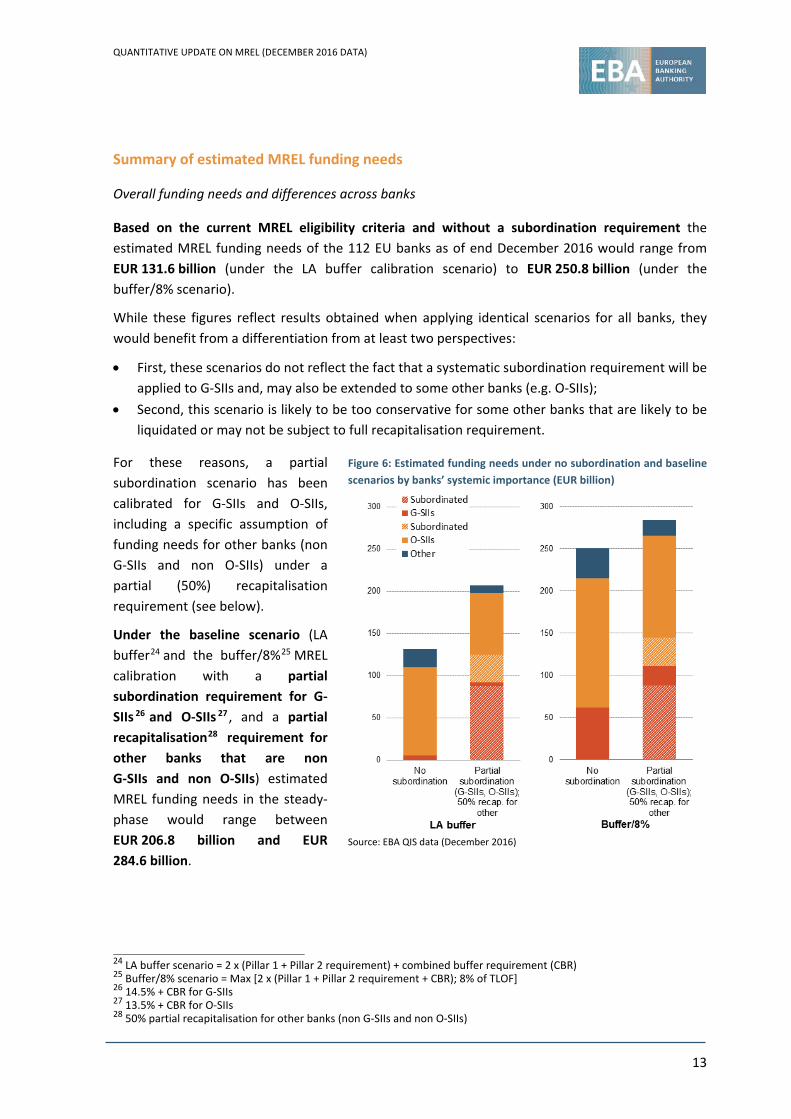
Based on the current MREL eligibility criteria and without a subordination requirement the estimated MREL funding needs of the 112 EU banks as of end December 2016 would range from EUR 131.6 billion (under the LA buffer calibration scenario) to EUR 250.8 billion (under the buffer/8% scenario).
While these figures reflect results obtained when applying identical scenarios for all banks, they would benefit from a differentiation from at least two perspectives:
• First, these scenarios do not reflect the fact that a systematic subordination requirement will be applied to G-SIIs and, may also be extended to some other banks (e.g. O-SIIs);
• Second, this scenario is likely to be too conservative for some other banks that are likely to be liquidated or may not be subject to full recapitalisation requirement.
For these reasons, a partial subordination scenario has been calibrated for G-SIIs and O-SIIs, including a specific assumption of funding needs for other banks (non G-SIIs and non O-SIIs) under a partial (50%) recapitalisation requirement (see below).
Under the baseline scenario (LA buffer24 and the buffer/8%25 MREL calibration with a partial subordination requirement for G-SIIs 26 and O-SIIs 27 , and a partial recapitalisation28 requirement for other banks that are non G-SIIs and non O-SIIs) estimated MREL funding needs in the steady-phase would range between EUR 206.8 billion and EUR 284.6 billion.
24 LA buffer scenario = 2 x (Pillar 1 + Pillar 2 requirement) + combined buffer requirement (CBR) 25 Buffer/8% scenario = Max [2 x (Pillar 1 + Pillar 2 requirement + CBR); 8% of TLOF] 26 14.5% + CBR for G-SIIs 27 13.5% + CBR for O-SIIs 28 50% partial recapitalisation for other banks (non G-SIIs and non O-SIIs)
Figure 6: Estimated funding needs under no subordination and baseline scenarios by banks’ systemic importance (EUR billion)
Source: EBA QIS data (December 2016)
QUANTITATIVE UPDATE ON MREL (DECEMBER 2016 DATA)
14
Impact on other banks (non-G-SIIs and non-O-SIIs) under the alternative scenario
Systemic importance and/or preferred resolution strategies will be the key drivers in determining MREL requirements. Indeed, there will be no ‘one size fits all’ MREL calibration and both the loss absorption amount and the recapitalisation amount will have to be tailor-made by resolution authorities for every bank based on the preferred institution-specific resolution strategy.
As a result, the full recapitalisation may not be applicable for all banks in the sample. To estimate this scenario, it is assumed that for other banks (non G-SIIs and non O-SIIs) a partial recapitalisation amount of 50% and no subordination requirement will be requested.
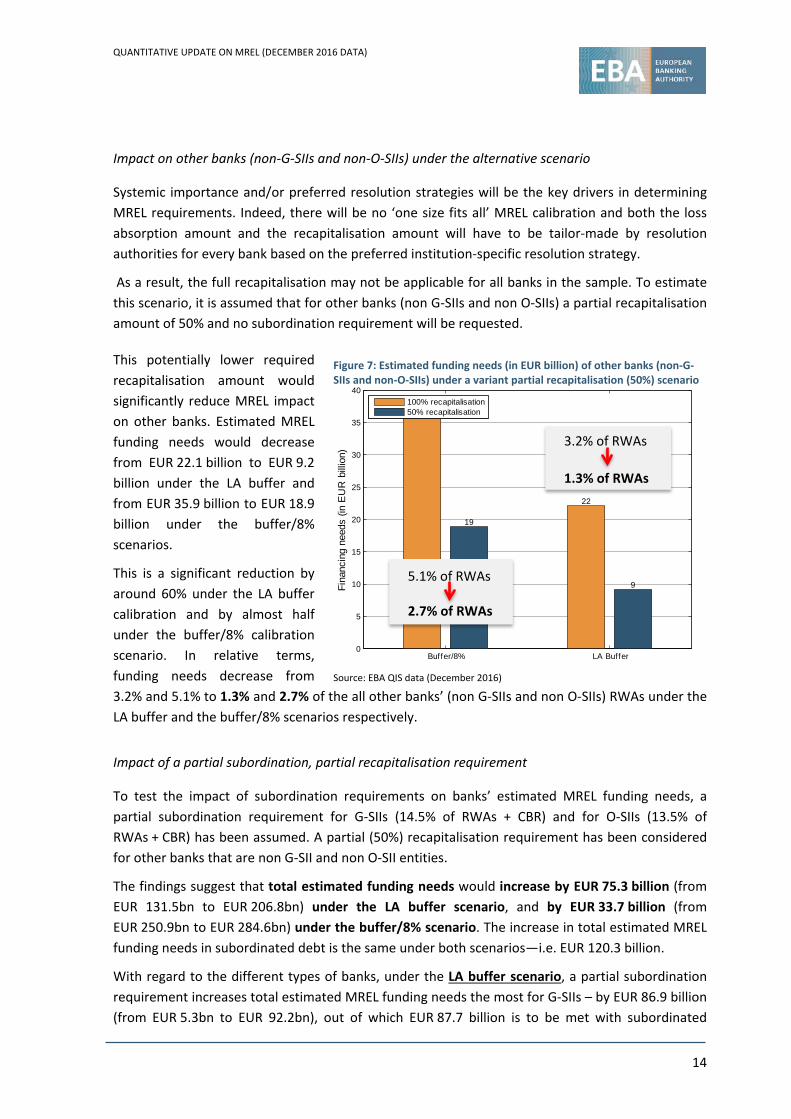
This potentially lower required recapitalisation amount would significantly reduce MREL impact on other banks. Estimated MREL funding needs would decrease from EUR 22.1 billion to EUR 9.2 billion under the LA buffer and from EUR 35.9 billion to EUR 18.9 billion under the buffer/8% scenarios.
This is a significant reduction by around 60% under the LA buffer calibration and by almost half under the buffer/8% calibration scenario. In relative terms, funding needs decrease from 3.2% and 5.1% to 1.3% and 2.7% of the all other banks’ (non G-SIIs and non O-SIIs) RWAs under the LA buffer and the buffer/8% scenarios respectively.
Impact of a partial subordination, partial recapitalisation requirement
To test the impact of subordination requirements on banks’ estimated MREL funding needs, a partial subordination requirement for G-SIIs (14.5% of RWAs + CBR) and for O-SIIs (13.5% of RWAs + CBR) has been assumed. A partial (50%) recapitalisation requirement has been considered for other banks that are non G-SII and non O-SII entities.
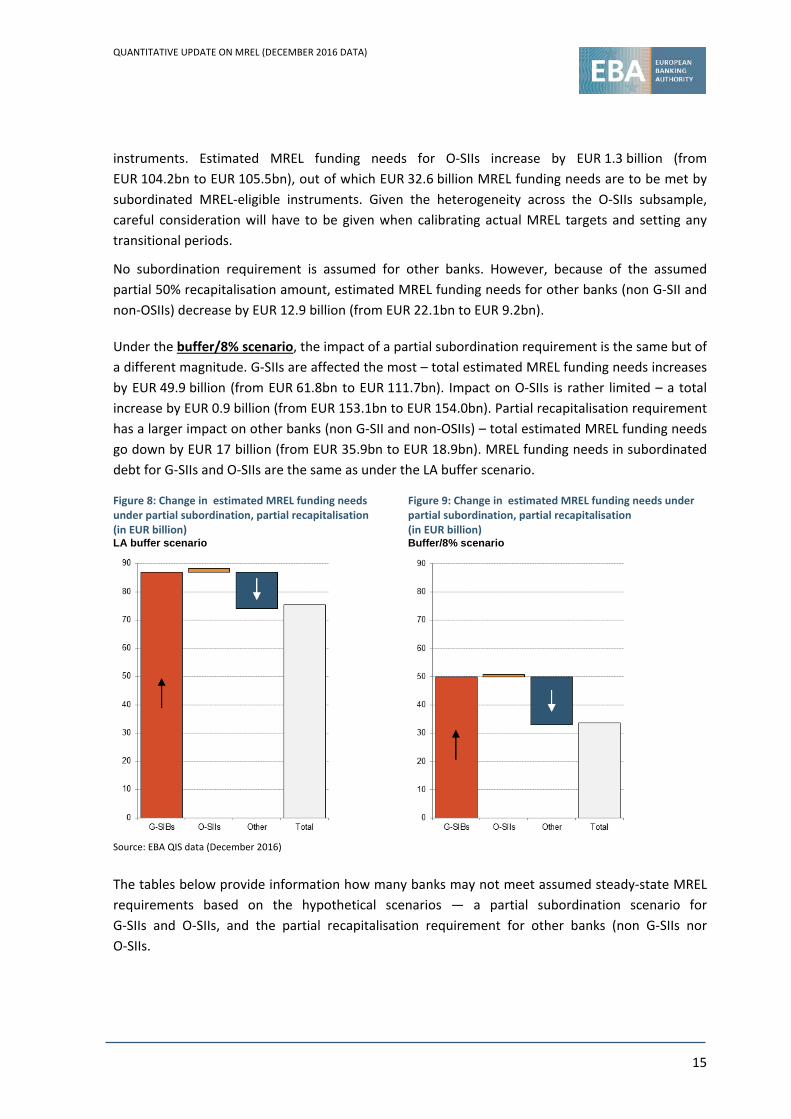
The findings suggest that total estimated funding needs would increase by EUR 75.3 billion (from EUR 131.5bn to EUR 206.8bn) under the LA buffer scenario, and by EUR 33.7 billion (from EUR 250.9bn to EUR 284.6bn) under the buffer/8% scenario. The increase in total estimated MREL funding needs in subordinated debt is the same under both scenarios—i.e. EUR 120.3 billion.
With regard to the different types of banks, under the LA buffer scenario, a partial subordination requirement increases total estimated MREL funding needs the most for G-SIIs – by EUR 86.9 billion (from EUR 5.3bn to EUR 92.2bn), out of which EUR 87.7 billion is to be met with subordinated
Figure 7: Estimated funding needs (in EUR billion) of other banks (non-G-SIIs and non-O-SIIs) under a variant partial recapitalisation (50%) scenario
Source: EBA QIS data (December 2016)
Buffer/8% LA Buffer0
5
10
15
20
25
30
35
40
Fina
ncin
g ne
eds
(in E
UR
bill
ion)
36
22
19
9
100% recapitalisation50% recapitalisation
5.1% of RWAs
2.7% of RWAs
3.2% of RWAs
1.3% of RWAs
QUANTITATIVE UPDATE ON MREL (DECEMBER 2016 DATA)
15
instruments. Estimated MREL funding needs for O-SIIs increase by EUR 1.3 billion (from EUR 104.2bn to EUR 105.5bn), out of which EUR 32.6 billion MREL funding needs are to be met by subordinated MREL-eligible instruments. Given the heterogeneity across the O-SIIs subsample, careful consideration will have to be given when calibrating actual MREL targets and setting any transitional periods.
No subordination requirement is assumed for other banks. However, because of the assumed partial 50% recapitalisation amount, estimated MREL funding needs for other banks (non G-SII and non-OSIIs) decrease by EUR 12.9 billion (from EUR 22.1bn to EUR 9.2bn).
Under the buffer/8% scenario, the impact of a partial subordination requirement is the same but of a different magnitude. G-SIIs are affected the most – total estimated MREL funding needs increases by EUR 49.9 billion (from EUR 61.8bn to EUR 111.7bn). Impact on O-SIIs is rather limited – a total increase by EUR 0.9 billion (from EUR 153.1bn to EUR 154.0bn). Partial recapitalisation requirement has a larger impact on other banks (non G-SII and non-OSIIs) – total estimated MREL funding needs go down by EUR 17 billion (from EUR 35.9bn to EUR 18.9bn). MREL funding needs in subordinated debt for G-SIIs and O-SIIs are the same as under the LA buffer scenario.
The tables below provide information how many banks may not meet assumed steady-state MREL requirements based on the hypothetical scenarios — a partial subordination scenario for G-SIIs and O-SIIs, and the partial recapitalisation requirement for other banks (non G-SIIs nor O-SIIs.
Figure 8: Change in estimated MREL funding needs under partial subordination, partial recapitalisation (in EUR billion) LA buffer scenario
Source: EBA QIS data (December 2016)
Figure 9: Change in estimated MREL funding needs under partial subordination, partial recapitalisation (in EUR billion) Buffer/8% scenario
QUANTITATIVE UPDATE ON MREL (DECEMBER 2016 DATA)
16
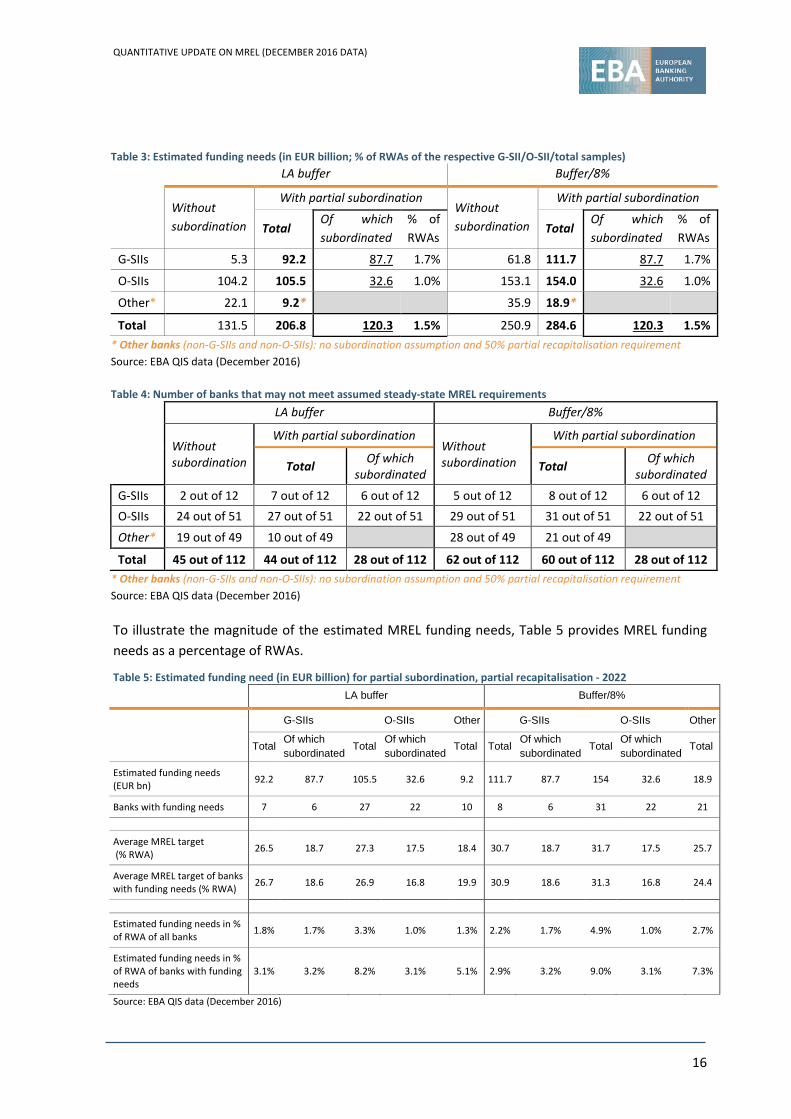
Table 3: Estimated funding needs (in EUR billion; % of RWAs of the respective G-SII/O-SII/total samples)
LA buffer Buffer/8%
Without subordination
With partial subordination Without subordination
With partial subordination
Total Of which subordinated
% of RWAs
Total Of which subordinated
% of RWAs
G-SIIs 5.3 92.2 87.7 1.7% 61.8 111.7 87.7 1.7%
O-SIIs 104.2 105.5 32.6 1.0% 153.1 154.0 32.6 1.0%
Other* 22.1 9.2* 35.9 18.9*
Total 131.5 206.8 120.3 1.5% 250.9 284.6 120.3 1.5% * Other banks (non-G-SIIs and non-O-SIIs): no subordination assumption and 50% partial recapitalisation requirement Source: EBA QIS data (December 2016)
Table 4: Number of banks that may not meet assumed steady-state MREL requirements
LA buffer Buffer/8%
Without subordination
With partial subordination Without subordination
With partial subordination
Total Of which subordinated Total Of which
subordinated
G-SIIs 2 out of 12 7 out of 12 6 out of 12 5 out of 12 8 out of 12 6 out of 12 O-SIIs 24 out of 51 27 out of 51 22 out of 51 29 out of 51 31 out of 51 22 out of 51
Other* 19 out of 49 10 out of 49 28 out of 49 21 out of 49 Total 45 out of 112 44 out of 112 28 out of 112 62 out of 112 60 out of 112 28 out of 112
* Other banks (non-G-SIIs and non-O-SIIs): no subordination assumption and 50% partial recapitalisation requirement Source: EBA QIS data (December 2016)
To illustrate the magnitude of the estimated MREL funding needs, Table 5 provides MREL funding needs as a percentage of RWAs.
Table 5: Estimated funding need (in EUR billion) for partial subordination, partial recapitalisation - 2022 LA buffer Buffer/8%
G-SIIs O-SIIs Other G-SIIs O-SIIs Other
Total Of which subordinated
Total Of which subordinated
Total Total Of which subordinated
Total Of which subordinated
Total
Estimated funding needs (EUR bn) 92.2 87.7 105.5 32.6 9.2 111.7 87.7 154 32.6 18.9
Banks with funding needs 7 6 27 22 10 8 6 31 22 21
Average MREL target (% RWA) 26.5 18.7 27.3 17.5 18.4 30.7 18.7 31.7 17.5 25.7
Average MREL target of banks with funding needs (% RWA) 26.7 18.6 26.9 16.8 19.9 30.9 18.6 31.3 16.8 24.4
Estimated funding needs in % of RWA of all banks 1.8% 1.7% 3.3% 1.0% 1.3% 2.2% 1.7% 4.9% 1.0% 2.7%
Estimated funding needs in % of RWA of banks with funding needs
3.1% 3.2% 8.2% 3.1% 5.1% 2.9% 3.2% 9.0% 3.1% 7.3%
Source: EBA QIS data (December 2016)
QUANTITATIVE UPDATE ON MREL (DECEMBER 2016 DATA)
17
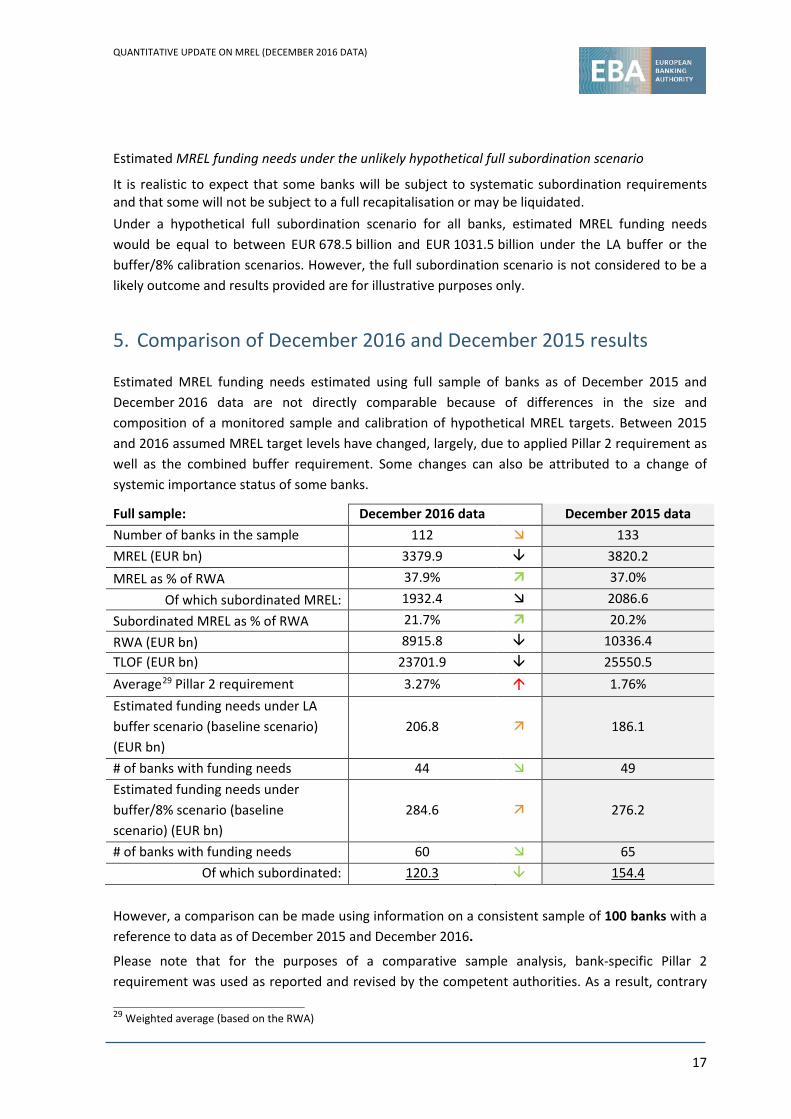
Estimated MREL funding needs under the unlikely hypothetical full subordination scenario
It is realistic to expect that some banks will be subject to systematic subordination requirements and that some will not be subject to a full recapitalisation or may be liquidated. Under a hypothetical full subordination scenario for all banks, estimated MREL funding needs would be equal to between EUR 678.5 billion and EUR 1031.5 billion under the LA buffer or the buffer/8% calibration scenarios. However, the full subordination scenario is not considered to be a likely outcome and results provided are for illustrative purposes only.
5. Comparison of December 2016 and December 2015 results
Estimated MREL funding needs estimated using full sample of banks as of December 2015 and December 2016 data are not directly comparable because of differences in the size and composition of a monitored sample and calibration of hypothetical MREL targets. Between 2015 and 2016 assumed MREL target levels have changed, largely, due to applied Pillar 2 requirement as well as the combined buffer requirement. Some changes can also be attributed to a change of systemic importance status of some banks.
Full sample: December 2016 data December 2015 data Number of banks in the sample 112 133 MREL (EUR bn) 3379.9 3820.2 MREL as % of RWA 37.9% 37.0%
Of which subordinated MREL: 1932.4 2086.6 Subordinated MREL as % of RWA 21.7% 20.2% RWA (EUR bn) 8915.8 10336.4 TLOF (EUR bn) 23701.9 25550.5 Average29 Pillar 2 requirement 3.27% 1.76% Estimated funding needs under LA buffer scenario (baseline scenario) (EUR bn)
206.8 186.1
# of banks with funding needs 44 49 Estimated funding needs under buffer/8% scenario (baseline scenario) (EUR bn)
284.6 276.2
# of banks with funding needs 60 65 Of which subordinated: 120.3 154.4
However, a comparison can be made using information on a consistent sample of 100 banks with a reference to data as of December 2015 and December 2016.
Please note that for the purposes of a comparative sample analysis, bank-specific Pillar 2 requirement was used as reported and revised by the competent authorities. As a result, contrary
29 Weighted average (based on the RWA)
QUANTITATIVE UPDATE ON MREL (DECEMBER 2016 DATA)
18
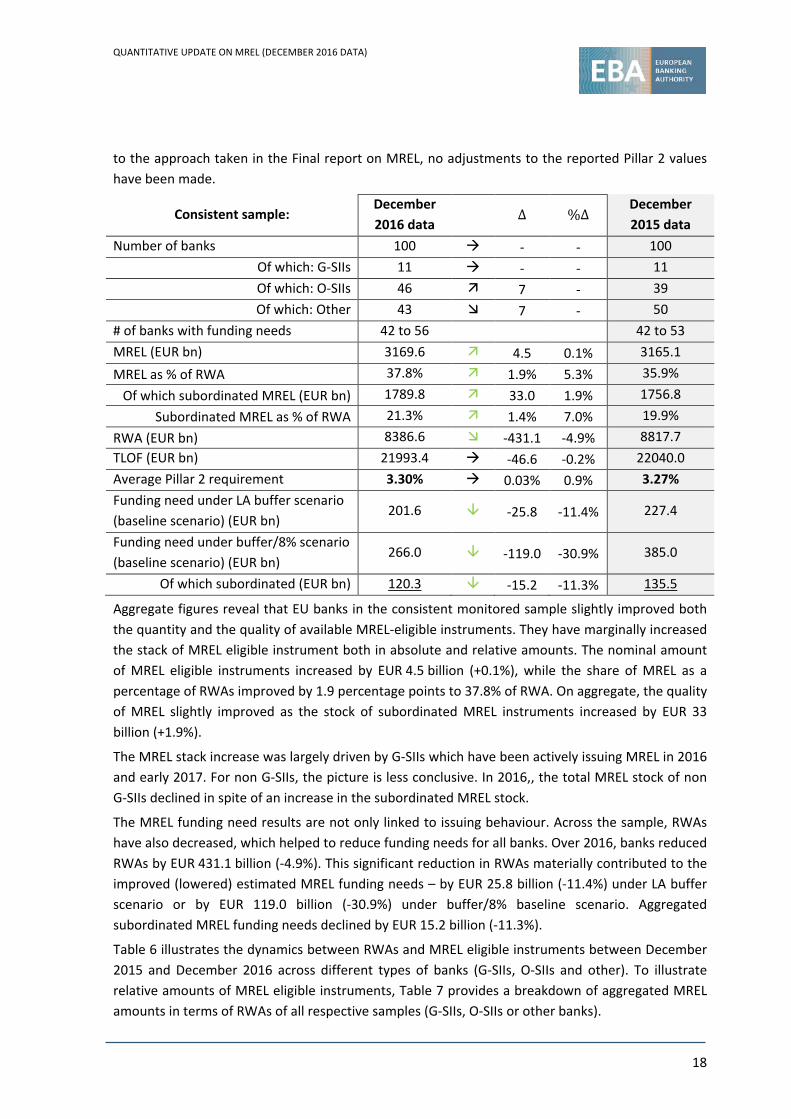
to the approach taken in the Final report on MREL, no adjustments to the reported Pillar 2 values have been made.
Consistent sample: December 2016 data
∆ %∆ December 2015 data
Number of banks 100 - - 100 Of which: G-SIIs 11 - - 11 Of which: O-SIIs 46 7 - 39 Of which: Other 43 7 - 50
# of banks with funding needs 42 to 56 42 to 53 MREL (EUR bn) 3169.6 4.5 0.1% 3165.1 MREL as % of RWA 37.8% 1.9% 5.3% 35.9%
Of which subordinated MREL (EUR bn) 1789.8 33.0 1.9% 1756.8 Subordinated MREL as % of RWA 21.3% 1.4% 7.0% 19.9%
RWA (EUR bn) 8386.6 -431.1 -4.9% 8817.7 TLOF (EUR bn) 21993.4 -46.6 -0.2% 22040.0 Average Pillar 2 requirement 3.30% 0.03% 0.9% 3.27% Funding need under LA buffer scenario (baseline scenario) (EUR bn)
201.6 -25.8 -11.4% 227.4
Funding need under buffer/8% scenario (baseline scenario) (EUR bn)
266.0 -119.0 -30.9% 385.0
Of which subordinated (EUR bn) 120.3 -15.2 -11.3% 135.5
Aggregate figures reveal that EU banks in the consistent monitored sample slightly improved both the quantity and the quality of available MREL-eligible instruments. They have marginally increased the stack of MREL eligible instrument both in absolute and relative amounts. The nominal amount of MREL eligible instruments increased by EUR 4.5 billion (+0.1%), while the share of MREL as a percentage of RWAs improved by 1.9 percentage points to 37.8% of RWA. On aggregate, the quality of MREL slightly improved as the stock of subordinated MREL instruments increased by EUR 33 billion (+1.9%).
The MREL stack increase was largely driven by G-SIIs which have been actively issuing MREL in 2016 and early 2017. For non G-SIIs, the picture is less conclusive. In 2016,, the total MREL stock of non G-SIIs declined in spite of an increase in the subordinated MREL stock.
The MREL funding need results are not only linked to issuing behaviour. Across the sample, RWAs have also decreased, which helped to reduce funding needs for all banks. Over 2016, banks reduced RWAs by EUR 431.1 billion (-4.9%). This significant reduction in RWAs materially contributed to the improved (lowered) estimated MREL funding needs – by EUR 25.8 billion (-11.4%) under LA buffer scenario or by EUR 119.0 billion (-30.9%) under buffer/8% baseline scenario. Aggregated subordinated MREL funding needs declined by EUR 15.2 billion (-11.3%).
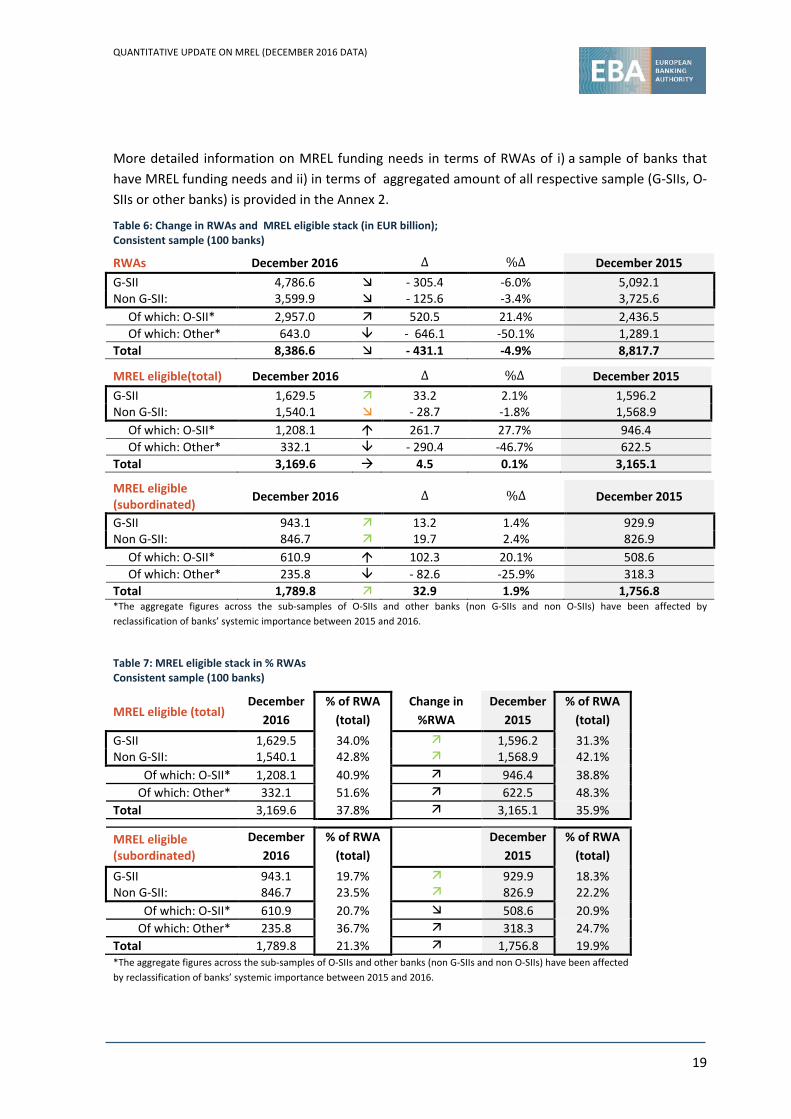
Table 6 illustrates the dynamics between RWAs and MREL eligible instruments between December 2015 and December 2016 across different types of banks (G-SIIs, O-SIIs and other). To illustrate relative amounts of MREL eligible instruments, Table 7 provides a breakdown of aggregated MREL amounts in terms of RWAs of all respective samples (G-SIIs, O-SIIs or other banks).
QUANTITATIVE UPDATE ON MREL (DECEMBER 2016 DATA)
19
More detailed information on MREL funding needs in terms of RWAs of i) a sample of banks that have MREL funding needs and ii) in terms of aggregated amount of all respective sample (G-SIIs, O-SIIs or other banks) is provided in the Annex 2.
Table 6: Change in RWAs and MREL eligible stack (in EUR billion); Consistent sample (100 banks)
RWAs December 2016 ∆ %∆ December 2015 G-SII 4,786.6 - 305.4 -6.0% 5,092.1 Non G-SII: 3,599.9 - 125.6 -3.4% 3,725.6 Of which: O-SII* 2,957.0 520.5 21.4% 2,436.5 Of which: Other* 643.0 - 646.1 -50.1% 1,289.1 Total 8,386.6 - 431.1 -4.9% 8,817.7
MREL eligible(total) December 2016 ∆ %∆ December 2015 G-SII 1,629.5 33.2 2.1% 1,596.2 Non G-SII: 1,540.1 - 28.7 -1.8% 1,568.9 Of which: O-SII* 1,208.1 261.7 27.7% 946.4 Of which: Other* 332.1 - 290.4 -46.7% 622.5 Total 3,169.6 4.5 0.1% 3,165.1
MREL eligible (subordinated) December 2016 ∆ %∆ December 2015
G-SII 943.1 13.2 1.4% 929.9 Non G-SII: 846.7 19.7 2.4% 826.9 Of which: O-SII* 610.9 102.3 20.1% 508.6 Of which: Other* 235.8 - 82.6 -25.9% 318.3 Total 1,789.8 32.9 1.9% 1,756.8 *The aggregate figures across the sub-samples of O-SIIs and other banks (non G-SIIs and non O-SIIs) have been affected by reclassification of banks’ systemic importance between 2015 and 2016.
Table 7: MREL eligible stack in % RWAs Consistent sample (100 banks)
MREL eligible (total) December
2016 % of RWA
(total) Change in
%RWA December
2015 % of RWA
(total) G-SII 1,629.5 34.0% 1,596.2 31.3% Non G-SII: 1,540.1 42.8% 1,568.9 42.1%
Of which: O-SII* 1,208.1 40.9% 946.4 38.8% Of which: Other* 332.1 51.6% 622.5 48.3%
Total 3,169.6 37.8% 3,165.1 35.9%
MREL eligible (subordinated)
December 2016
% of RWA (total)
December 2015
% of RWA (total)
G-SII 943.1 19.7% 929.9 18.3% Non G-SII: 846.7 23.5% 826.9 22.2%
Of which: O-SII* 610.9 20.7% 508.6 20.9% Of which: Other* 235.8 36.7% 318.3 24.7%
Total 1,789.8 21.3% 1,756.8 19.9% *The aggregate figures across the sub-samples of O-SIIs and other banks (non G-SIIs and non O-SIIs) have been affected by reclassification of banks’ systemic importance between 2015 and 2016.
QUANTITATIVE UPDATE ON MREL (DECEMBER 2016 DATA)
20
ANNEX 1
Methodology and estimates of MREL target ratios under different scenarios Methodology and limitations
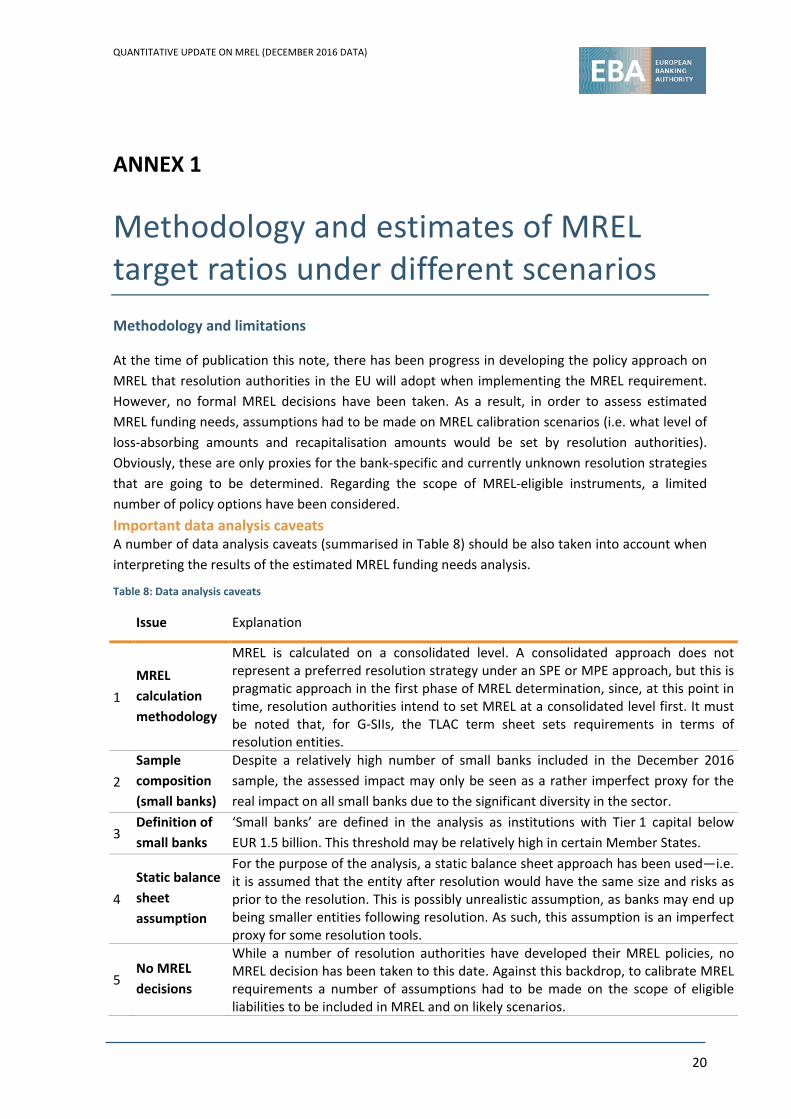
At the time of publication this note, there has been progress in developing the policy approach on MREL that resolution authorities in the EU will adopt when implementing the MREL requirement. However, no formal MREL decisions have been taken. As a result, in order to assess estimated MREL funding needs, assumptions had to be made on MREL calibration scenarios (i.e. what level of loss-absorbing amounts and recapitalisation amounts would be set by resolution authorities). Obviously, these are only proxies for the bank-specific and currently unknown resolution strategies that are going to be determined. Regarding the scope of MREL-eligible instruments, a limited number of policy options have been considered. Important data analysis caveats A number of data analysis caveats (summarised in Table 8) should be also taken into account when interpreting the results of the estimated MREL funding needs analysis.
Table 8: Data analysis caveats
Issue Explanation
1 MREL calculation methodology
MREL is calculated on a consolidated level. A consolidated approach does not represent a preferred resolution strategy under an SPE or MPE approach, but this is pragmatic approach in the first phase of MREL determination, since, at this point in time, resolution authorities intend to set MREL at a consolidated level first. It must be noted that, for G-SIIs, the TLAC term sheet sets requirements in terms of resolution entities.
2 Sample composition (small banks)
Despite a relatively high number of small banks included in the December 2016 sample, the assessed impact may only be seen as a rather imperfect proxy for the real impact on all small banks due to the significant diversity in the sector.
3 Definition of small banks
‘Small banks’ are defined in the analysis as institutions with Tier 1 capital below EUR 1.5 billion. This threshold may be relatively high in certain Member States.
4 Static balance sheet assumption
For the purpose of the analysis, a static balance sheet approach has been used—i.e. it is assumed that the entity after resolution would have the same size and risks as prior to the resolution. This is possibly unrealistic assumption, as banks may end up being smaller entities following resolution. As such, this assumption is an imperfect proxy for some resolution tools.
5 No MREL decisions
While a number of resolution authorities have developed their MREL policies, no MREL decision has been taken to this date. Against this backdrop, to calibrate MREL requirements a number of assumptions had to be made on the scope of eligible liabilities to be included in MREL and on likely scenarios.
QUANTITATIVE UPDATE ON MREL (DECEMBER 2016 DATA)
21
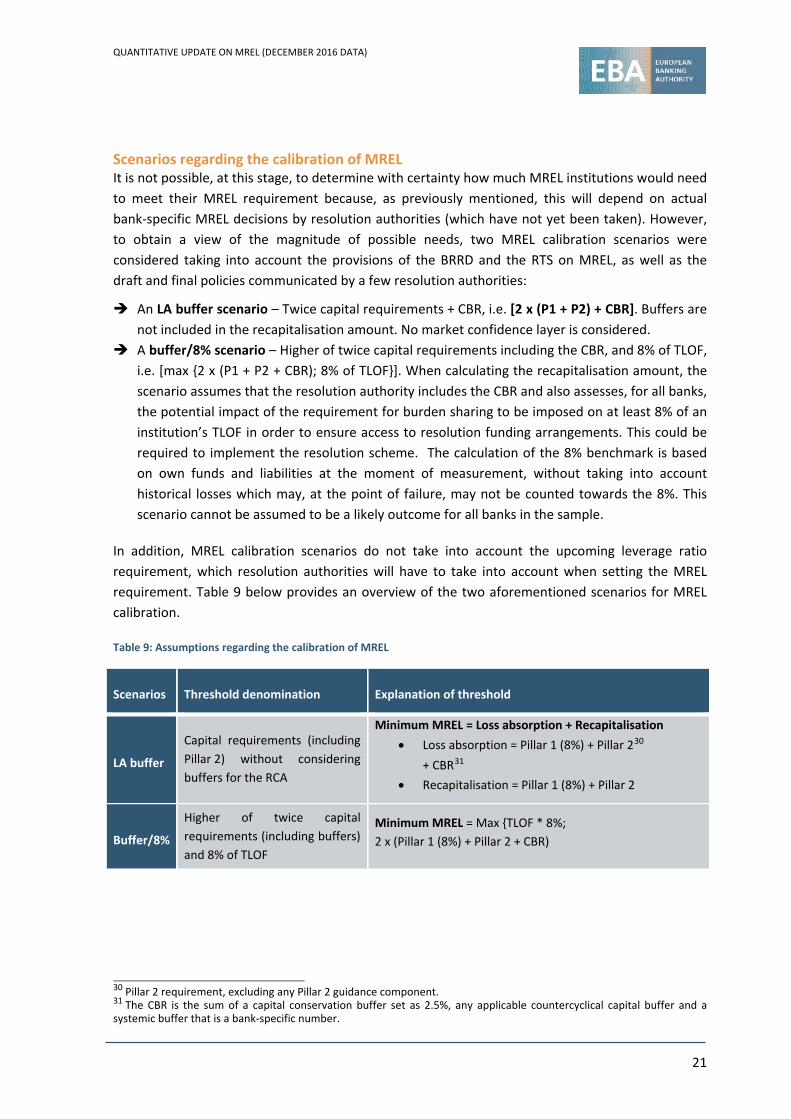
Scenarios regarding the calibration of MREL It is not possible, at this stage, to determine with certainty how much MREL institutions would need to meet their MREL requirement because, as previously mentioned, this will depend on actual bank-specific MREL decisions by resolution authorities (which have not yet been taken). However, to obtain a view of the magnitude of possible needs, two MREL calibration scenarios were considered taking into account the provisions of the BRRD and the RTS on MREL, as well as the draft and final policies communicated by a few resolution authorities:
An LA buffer scenario – Twice capital requirements + CBR, i.e. [2 x (P1 + P2) + CBR]. Buffers are not included in the recapitalisation amount. No market confidence layer is considered.
A buffer/8% scenario – Higher of twice capital requirements including the CBR, and 8% of TLOF, i.e. [max {2 x (P1 + P2 + CBR); 8% of TLOF}]. When calculating the recapitalisation amount, the scenario assumes that the resolution authority includes the CBR and also assesses, for all banks, the potential impact of the requirement for burden sharing to be imposed on at least 8% of an institution’s TLOF in order to ensure access to resolution funding arrangements. This could be required to implement the resolution scheme. The calculation of the 8% benchmark is based on own funds and liabilities at the moment of measurement, without taking into account historical losses which may, at the point of failure, may not be counted towards the 8%. This scenario cannot be assumed to be a likely outcome for all banks in the sample.
In addition, MREL calibration scenarios do not take into account the upcoming leverage ratio requirement, which resolution authorities will have to take into account when setting the MREL requirement. Table 9 below provides an overview of the two aforementioned scenarios for MREL calibration.
Table 9: Assumptions regarding the calibration of MREL
Scenarios Threshold denomination Explanation of threshold
LA buffer
Capital requirements (including Pillar 2) without considering buffers for the RCA
Minimum MREL = Loss absorption + Recapitalisation • Loss absorption = Pillar 1 (8%) + Pillar 230
+ CBR31 • Recapitalisation = Pillar 1 (8%) + Pillar 2
Buffer/8%
Higher of twice capital requirements (including buffers) and 8% of TLOF
Minimum MREL = Max {TLOF * 8%; 2 x (Pillar 1 (8%) + Pillar 2 + CBR)
30 Pillar 2 requirement, excluding any Pillar 2 guidance component. 31 The CBR is the sum of a capital conservation buffer set as 2.5%, any applicable countercyclical capital buffer and a systemic buffer that is a bank-specific number.
QUANTITATIVE UPDATE ON MREL (DECEMBER 2016 DATA)
22
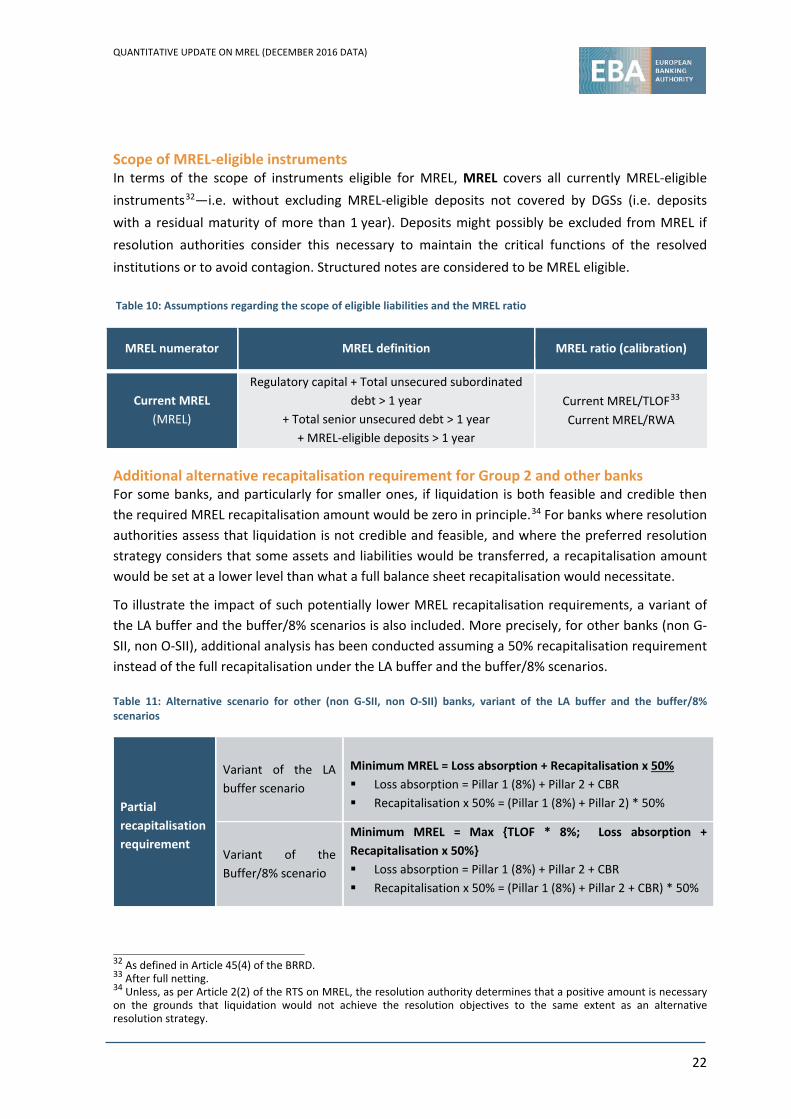
Scope of MREL-eligible instruments In terms of the scope of instruments eligible for MREL, MREL covers all currently MREL-eligible instruments32—i.e. without excluding MREL-eligible deposits not covered by DGSs (i.e. deposits with a residual maturity of more than 1 year). Deposits might possibly be excluded from MREL if resolution authorities consider this necessary to maintain the critical functions of the resolved institutions or to avoid contagion. Structured notes are considered to be MREL eligible. Table 10: Assumptions regarding the scope of eligible liabilities and the MREL ratio
Additional alternative recapitalisation requirement for Group 2 and other banks For some banks, and particularly for smaller ones, if liquidation is both feasible and credible then the required MREL recapitalisation amount would be zero in principle.34 For banks where resolution authorities assess that liquidation is not credible and feasible, and where the preferred resolution strategy considers that some assets and liabilities would be transferred, a recapitalisation amount would be set at a lower level than what a full balance sheet recapitalisation would necessitate.
To illustrate the impact of such potentially lower MREL recapitalisation requirements, a variant of the LA buffer and the buffer/8% scenarios is also included. More precisely, for other banks (non G-SII, non O-SII), additional analysis has been conducted assuming a 50% recapitalisation requirement instead of the full recapitalisation under the LA buffer and the buffer/8% scenarios.
Table 11: Alternative scenario for other (non G-SII, non O-SII) banks, variant of the LA buffer and the buffer/8% scenarios
Partial recapitalisation requirement
Variant of the LA buffer scenario
Minimum MREL = Loss absorption + Recapitalisation x 50% Loss absorption = Pillar 1 (8%) + Pillar 2 + CBR Recapitalisation x 50% = (Pillar 1 (8%) + Pillar 2) * 50%
Variant of the Buffer/8% scenario
Minimum MREL = Max {TLOF * 8%; Loss absorption + Recapitalisation x 50%} Loss absorption = Pillar 1 (8%) + Pillar 2 + CBR Recapitalisation x 50% = (Pillar 1 (8%) + Pillar 2 + CBR) * 50%
32 As defined in Article 45(4) of the BRRD. 33 After full netting. 34 Unless, as per Article 2(2) of the RTS on MREL, the resolution authority determines that a positive amount is necessary on the grounds that liquidation would not achieve the resolution objectives to the same extent as an alternative resolution strategy.
MREL numerator MREL definition MREL ratio (calibration)
Current MREL (MREL)
Regulatory capital + Total unsecured subordinated debt > 1 year
+ Total senior unsecured debt > 1 year + MREL-eligible deposits > 1 year
Current MREL/TLOF33 Current MREL/RWA
QUANTITATIVE UPDATE ON MREL (DECEMBER 2016 DATA)
23
Partial subordination requirement
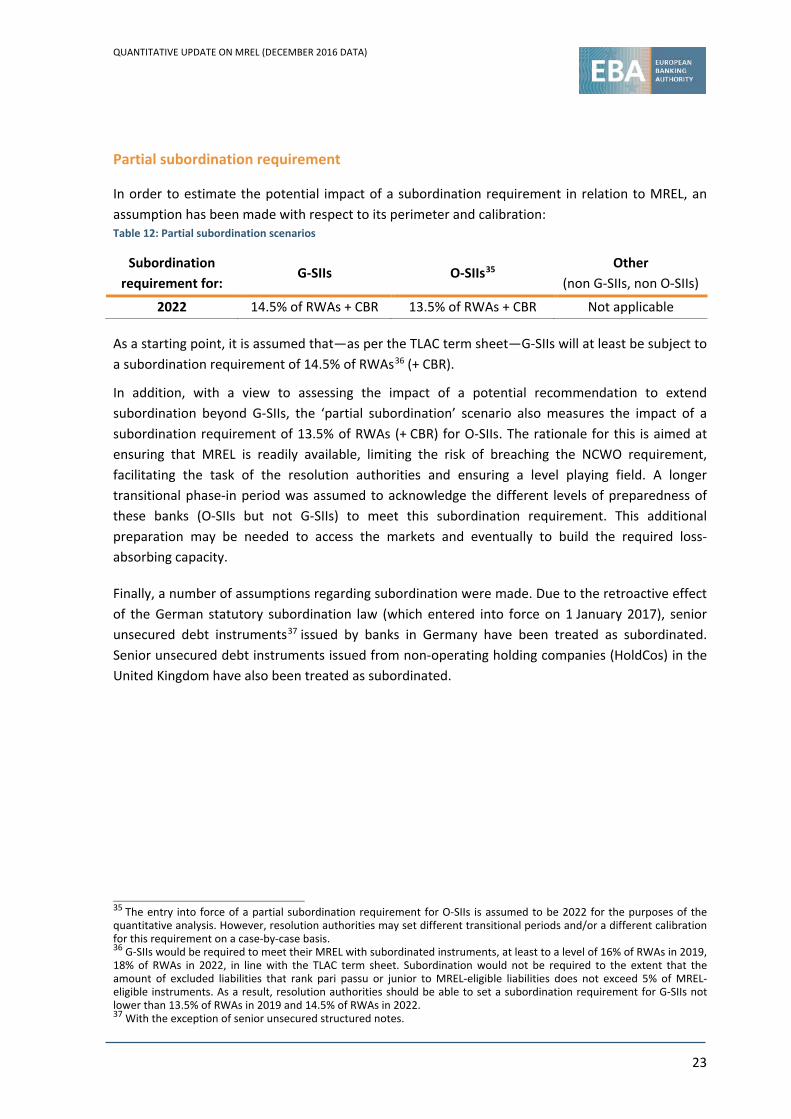
In order to estimate the potential impact of a subordination requirement in relation to MREL, an assumption has been made with respect to its perimeter and calibration: Table 12: Partial subordination scenarios
Subordination requirement for:
G-SIIs O-SIIs35 Other
(non G-SIIs, non O-SIIs)
2022 14.5% of RWAs + CBR 13.5% of RWAs + CBR Not applicable
As a starting point, it is assumed that—as per the TLAC term sheet—G-SIIs will at least be subject to a subordination requirement of 14.5% of RWAs36 (+ CBR).
In addition, with a view to assessing the impact of a potential recommendation to extend subordination beyond G-SIIs, the ‘partial subordination’ scenario also measures the impact of a subordination requirement of 13.5% of RWAs (+ CBR) for O-SIIs. The rationale for this is aimed at ensuring that MREL is readily available, limiting the risk of breaching the NCWO requirement, facilitating the task of the resolution authorities and ensuring a level playing field. A longer transitional phase-in period was assumed to acknowledge the different levels of preparedness of these banks (O-SIIs but not G-SIIs) to meet this subordination requirement. This additional preparation may be needed to access the markets and eventually to build the required loss-absorbing capacity.
Finally, a number of assumptions regarding subordination were made. Due to the retroactive effect of the German statutory subordination law (which entered into force on 1 January 2017), senior unsecured debt instruments37 issued by banks in Germany have been treated as subordinated. Senior unsecured debt instruments issued from non-operating holding companies (HoldCos) in the United Kingdom have also been treated as subordinated.
35 The entry into force of a partial subordination requirement for O-SIIs is assumed to be 2022 for the purposes of the quantitative analysis. However, resolution authorities may set different transitional periods and/or a different calibration for this requirement on a case-by-case basis. 36 G-SIIs would be required to meet their MREL with subordinated instruments, at least to a level of 16% of RWAs in 2019, 18% of RWAs in 2022, in line with the TLAC term sheet. Subordination would not be required to the extent that the amount of excluded liabilities that rank pari passu or junior to MREL-eligible liabilities does not exceed 5% of MREL-eligible instruments. As a result, resolution authorities should be able to set a subordination requirement for G-SIIs not lower than 13.5% of RWAs in 2019 and 14.5% of RWAs in 2022. 37 With the exception of senior unsecured structured notes.
QUANTITATIVE UPDATE ON MREL (DECEMBER 2016 DATA)
24
ANNEX 2
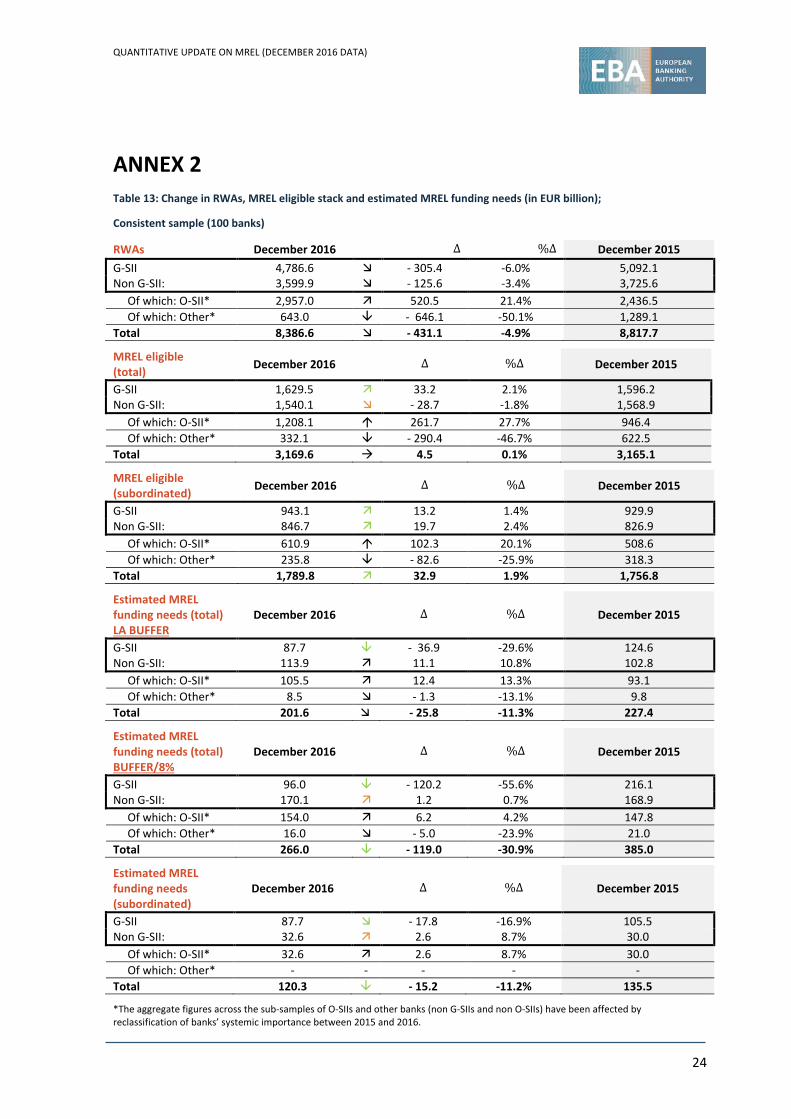
Table 13: Change in RWAs, MREL eligible stack and estimated MREL funding needs (in EUR billion);
Consistent sample (100 banks)
RWAs December 2016 ∆ %∆ December 2015 G-SII 4,786.6 - 305.4 -6.0% 5,092.1 Non G-SII: 3,599.9 - 125.6 -3.4% 3,725.6 Of which: O-SII* 2,957.0 520.5 21.4% 2,436.5 Of which: Other* 643.0 - 646.1 -50.1% 1,289.1 Total 8,386.6 - 431.1 -4.9% 8,817.7
MREL eligible (total) December 2016 ∆ %∆ December 2015
G-SII 1,629.5 33.2 2.1% 1,596.2 Non G-SII: 1,540.1 - 28.7 -1.8% 1,568.9 Of which: O-SII* 1,208.1 261.7 27.7% 946.4 Of which: Other* 332.1 - 290.4 -46.7% 622.5 Total 3,169.6 4.5 0.1% 3,165.1
MREL eligible (subordinated) December 2016 ∆ %∆ December 2015
G-SII 943.1 13.2 1.4% 929.9 Non G-SII: 846.7 19.7 2.4% 826.9 Of which: O-SII* 610.9 102.3 20.1% 508.6 Of which: Other* 235.8 - 82.6 -25.9% 318.3 Total 1,789.8 32.9 1.9% 1,756.8
Estimated MREL funding needs (total) LA BUFFER
December 2016 ∆ %∆ December 2015
G-SII 87.7 - 36.9 -29.6% 124.6 Non G-SII: 113.9 11.1 10.8% 102.8 Of which: O-SII* 105.5 12.4 13.3% 93.1 Of which: Other* 8.5 - 1.3 -13.1% 9.8 Total 201.6 - 25.8 -11.3% 227.4
Estimated MREL funding needs (total) BUFFER/8%
December 2016 ∆ %∆ December 2015
G-SII 96.0 - 120.2 -55.6% 216.1 Non G-SII: 170.1 1.2 0.7% 168.9 Of which: O-SII* 154.0 6.2 4.2% 147.8 Of which: Other* 16.0 - 5.0 -23.9% 21.0 Total 266.0 - 119.0 -30.9% 385.0
Estimated MREL funding needs (subordinated)
December 2016 ∆ %∆ December 2015
G-SII 87.7 - 17.8 -16.9% 105.5 Non G-SII: 32.6 2.6 8.7% 30.0 Of which: O-SII* 32.6 2.6 8.7% 30.0 Of which: Other* - - - - - Total 120.3 - 15.2 -11.2% 135.5
*The aggregate figures across the sub-samples of O-SIIs and other banks (non G-SIIs and non O-SIIs) have been affected by reclassification of banks’ systemic importance between 2015 and 2016.
QUANTITATIVE UPDATE ON MREL (DECEMBER 2016 DATA)
25
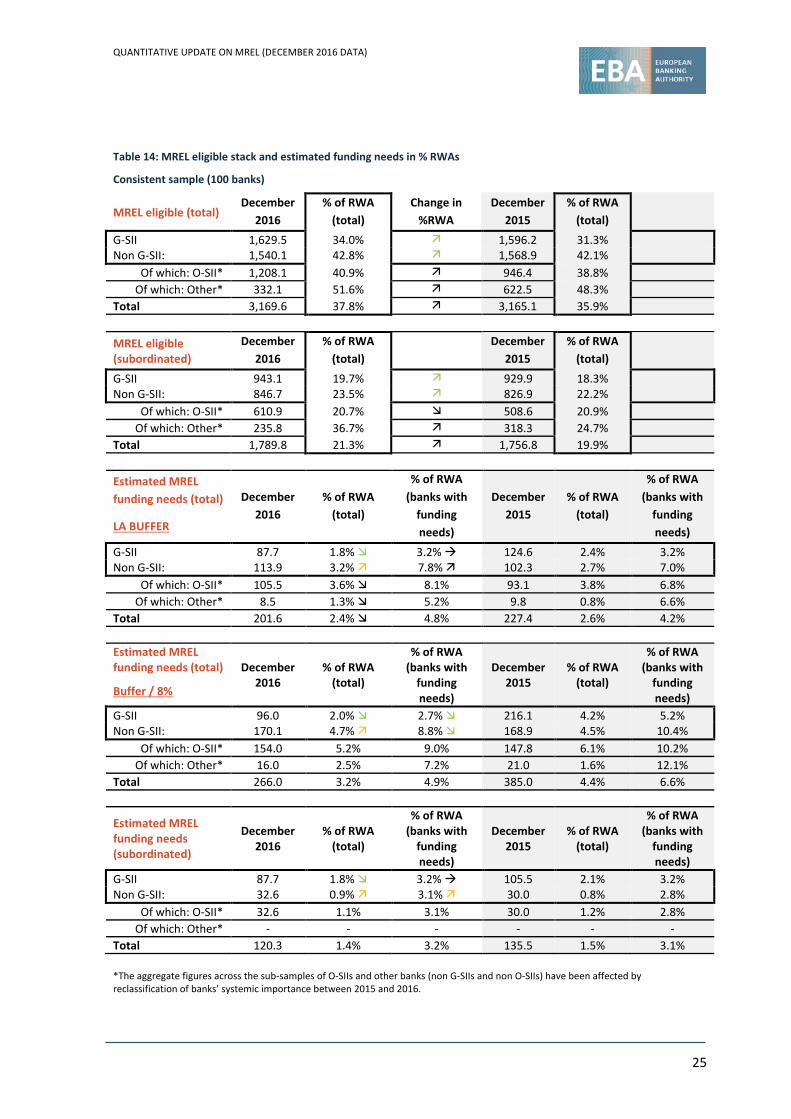
Table 14: MREL eligible stack and estimated funding needs in % RWAs
Consistent sample (100 banks)
MREL eligible (total) December
2016 % of RWA
(total) Change in
%RWA December
2015 % of RWA
(total) G-SII 1,629.5 34.0% 1,596.2 31.3% Non G-SII: 1,540.1 42.8% 1,568.9 42.1%
Of which: O-SII* 1,208.1 40.9% 946.4 38.8% Of which: Other* 332.1 51.6% 622.5 48.3%
Total 3,169.6 37.8% 3,165.1 35.9%
MREL eligible (subordinated)
December 2016
% of RWA (total)
December 2015
% of RWA (total)
G-SII 943.1 19.7% 929.9 18.3% Non G-SII: 846.7 23.5% 826.9 22.2%
Of which: O-SII* 610.9 20.7% 508.6 20.9% Of which: Other* 235.8 36.7% 318.3 24.7%
Total 1,789.8 21.3% 1,756.8 19.9%
Estimated MREL funding needs (total) December
2016 % of RWA
(total)
% of RWA (banks with
funding needs)
December 2015
% of RWA (total)
% of RWA (banks with
funding needs) LA BUFFER
G-SII 87.7 1.8% 3.2% 124.6 2.4% 3.2% Non G-SII: 113.9 3.2% 7.8% 102.3 2.7% 7.0%
Of which: O-SII* 105.5 3.6% 8.1% 93.1 3.8% 6.8% Of which: Other* 8.5 1.3% 5.2% 9.8 0.8% 6.6%
Total 201.6 2.4% 4.8% 227.4 2.6% 4.2%
Estimated MREL funding needs (total) December
2016 % of RWA
(total)
% of RWA (banks with
funding needs)
December 2015
% of RWA (total)
% of RWA (banks with
funding needs) Buffer / 8%
G-SII 96.0 2.0% 2.7% 216.1 4.2% 5.2% Non G-SII: 170.1 4.7% 8.8% 168.9 4.5% 10.4%
Of which: O-SII* 154.0 5.2% 9.0% 147.8 6.1% 10.2% Of which: Other* 16.0 2.5% 7.2% 21.0 1.6% 12.1%
Total 266.0 3.2% 4.9% 385.0 4.4% 6.6%
Estimated MREL funding needs (subordinated)
December 2016
% of RWA (total)
% of RWA (banks with
funding needs)
December 2015
% of RWA (total)
% of RWA (banks with
funding needs)
G-SII 87.7 1.8% 3.2% 105.5 2.1% 3.2% Non G-SII: 32.6 0.9% 3.1% 30.0 0.8% 2.8%
Of which: O-SII* 32.6 1.1% 3.1% 30.0 1.2% 2.8% Of which: Other* - - - - - -
Total 120.3 1.4% 3.2% 135.5 1.5% 3.1% *The aggregate figures across the sub-samples of O-SIIs and other banks (non G-SIIs and non O-SIIs) have been affected by reclassification of banks’ systemic importance between 2015 and 2016.