Embed Size (px)
Citation preview

Department of Physics, Chemistry and Biology
Bachelor's Thesis
Quantum Chemical Feasibility Study of Methylamines as
Nitrogen Precursors in Chemical Vapor Deposition
Karl Rönnby
2015-06-23
LITH-IFM-x-EX--15/3046--SE
Linköping University Department of Physics, Chemistry and Biology
581 83 Linköping

Department of Physics, Chemistry and Biology
Quantum Chemical Feasibility Study of Methylamines as
Nitrogen Precursors in Chemical Vapor Deposition
Karl Rönnby
Thesis work done at IFM,
Linköping University Institute of Technology
2015-06-23
Supervisor
Henrik Pedersen
Examiner
Lars Ojamäe
Linköping University Department of Physics, Chemistry and Biology
581 83 Linköping

Datum
Date
2015-06-23
Avdelning, institution Division, Department
Chemistry
Department of Physics, Chemistry and Biology
Linköping University
URL för elektronisk version
http://urn.kb.se/resolve?urn=urn:nbn:se:liu:diva-132811
ISBN
ISRN: LITH-IFM-x-EX--15/3046--SE _________________________________________________________________
Serietitel och serienummer ISSN
Title of series, numbering ______________________________
Språk Language
Svenska/Swedish Engelska/English
________________
Rapporttyp Report category
Licentiatavhandling Examensarbete
C-uppsats
D-uppsats Övrig rapport
_____________
Titel
Title
Quantum Chemical Feasibility Study of Methylamines as Nitrogen Precursors in Chemical Vapor Deposition
Författare Author
Karl Rönnby
Nyckelord Keyword
Quantum Chemistry, Computational Chemistry, Density Functional Theory (DFT), B3LYP, Gaussian 4 (G4), Chemical Vapor Deposition (CVD),
Gallium Nitride (GaN), Aluminum Nitride (AlN), Ammonia (NH3), Methylamine (NH2CH3), Dimethylamine (NH(CH3)2), Trimethylamine
(NH(CH3)3), Trimethylaluminum (TMA), Trimethylgallium (TMG), Decomposition, Adsorption
Sammanfattning Abstract
The possibility of using methylamines instead of ammonia as a nitrogen precursor for the CVD of nitrides is studied using quantum chemical
computations of reaction energies: reaction electronic energy (Δ𝑟𝐸𝑒𝑙𝑒𝑐) reaction enthalpy (Δ𝑟𝐻) and reaction free energy (Δ𝑟𝐺). The reaction energies were calculated for three types of reactions: Uni- and bimolecular decomposition to more reactive nitrogen species, adduct forming with
trimethylgallium (TMG) and trimethylaluminum (TMA) followed by a release of methane or ethane and surface adsorption to gallium nitride for both the unreacted ammonia or methylamines or the decomposition products. The calculations for the reaction entropy and free energy were made at
both STP and CVD conditions (300°C-1300°C and 50 mbar). The ab inito Gaussian 4 (G4) theory were used for the calculations of the
decomposition and adduct reactions while the surface adsorptions were calculated using the Density Functional Theory method B3LYP. From the reactions energies it can be concluded that the decomposition was facilitated by the increasing number of methyl groups on the nitrogen. The
adducts with mono- and dimethylamine were more favorable than ammonia and trimethylamine. 𝑁𝐻2 was found to be most readily to adsorb to
𝐺𝑎𝑁 while the undecomposed ammonia and methylamines was not willingly to adsorb.

7
Abstract The possibility of using methylamines instead of ammonia as a nitrogen precursor for the CVD of
nitrides is studied using quantum chemical computations of reaction energies: reaction electronic
energy (Δ𝑟𝐸𝑒𝑙𝑒𝑐) reaction enthalpy (Δ𝑟𝐻) and reaction free energy (Δ𝑟𝐺). The reaction energies were
calculated for three types of reactions: Uni- and bimolecular decomposition to more reactive nitrogen
species, adduct forming with trimethylgallium (TMG) and trimethylaluminum (TMA) followed by a
release of methane or ethane and surface adsorption to gallium nitride for both the unreacted ammonia
or methylamines or the decomposition products. The calculations for the reaction entropy and free
energy were made at both STP and CVD conditions (300°C-1300°C and 50 mbar). The ab inito
Gaussian 4 (G4) theory were used for the calculations of the decomposition and adduct reactions while
the surface adsorptions were calculated using the Density Functional Theory method B3LYP. From
the reactions energies it can be concluded that the decomposition was facilitated by the increasing
number of methyl groups on the nitrogen. The adducts with mono- and dimethylamine were more
favorable than ammonia and trimethylamine. 𝑁𝐻2 was found to be most readily to adsorb to 𝐺𝑎𝑁
while the undecomposed ammonia and methylamines was not willingly to adsorb.

8
Table of contents Abstract ................................................................................................................................................... 7
Table of contents ..................................................................................................................................... 8
1 Introduction .......................................................................................................................................... 9
1.1 Aim ................................................................................................................................................ 9
1.2 Background ................................................................................................................................... 9
1.3 Quantum Chemistry .................................................................................................................... 10
2 Computational methods ...................................................................................................................... 10
3 Results and discussion ........................................................................................................................ 11
3.1 Method and basis sets .................................................................................................................. 11
3.2 Gas phase decomposition ............................................................................................................ 12
3.3 Adduct formation with TMG ...................................................................................................... 15
3.4 Adduct formation with TMA ...................................................................................................... 17
3.5 Surface interactions with gallium nitride .................................................................................... 19
3.7 End discussion ............................................................................................................................. 22
4 Conclusions ........................................................................................................................................ 26
5 Acknowledgements ............................................................................................................................ 26
6 References .......................................................................................................................................... 27
9
1 Introduction
1.1 Aim The aim of this thesis was to investigate the possibility of replacing ammonia with mono-, di- or
trimethylamine as a nitrogen precursor in the CVD synthesis of nitrides with focus on gallium and
aluminum nitride. The method used was a quantum chemical approach using density functional theory
and ab initio studies to look at reaction energies for three main groups of reactions: Uni- and
bimolecular decomposition, Lewis-acid adduct formation with TMG and TMA and surface
interactions with gallium nitride. The methods used were compared with experimental values for the
formation of ammonia from hydrogen and nitrogen.
1.2 Background Semi-conductors of III-V nitrides (III-N) have been under intense research during the last 20-30 years.
The first research in gallium nitride (𝐺𝑎𝑁) began as early as the 1960s. The III-N and their alloys have
now very broad uses in many applications, light emitting diodes (LED), laser diodes and rf and power
transistors and have a bandgap over almost the whole spectrum from ultra-violet to red.
𝐺𝑎𝑁, as well as the two other III-V nitrides aluminum nitride (𝐴𝑙𝑁) and indium nitride (𝐼𝑛𝑁) has a
wurtzite crystal structure, with a hexagonal unit cell and crystal cleavage of c < 0001 > and a <
112̅0 >. The atoms are arranged in a tetrahedral structure with ether a central nitrogen or metal
surrounded by four of the other atom (𝑀𝑁4 or 𝑁𝑀4). The space group is 𝑃63𝑚𝑐.
The method in which 𝐺𝑎𝑁, as well as 𝐴𝑙𝑁 and 𝐼𝑛𝑁, thin films are synthesized is chemical-vapor
deposition (CVD) sometimes also called metalorganic vapor phase epitaxy (MOVPE). In CVD the
atoms that will be used to make the film is carried as part of precursor molecules, often organometallic
volatile compounds, diluted in carrier gas. For synthesis of III-V nitrides a trimethyl- or triethylmetal
complex is often used. In the gallium nitride case the most used gallium precursors are
trimethylgallium (TMG) or triethylgallium (TEG). [1] Since TMG has a higher decomposition rate
than TEG, a small risk for carbon incopreration in the thin films exists due to TMG easily being able
to form reactive carbon species in the form of methyl radicals. [2]
Nitrogen gas (𝑁2) is seldom used as a nitrogen precursor, mainly due to the high strength of the 𝑁 − 𝑁
bond (945 kJ/mol) and could only be used at very high temperatures (>1600°C) to make 𝐴𝑙𝑁. Instead
ammonia (𝑁𝐻3) is commonly used at a temperature range about 600-1100°C. A problem when using
𝑁𝐻3 is that instead of decomposing into the reactive species 𝑁𝐻2 or 𝑁𝐻 the much more stable
hydrogen gas (𝐻2) and nitrogen gas (𝑁2) are formed. Due to this the ratio between the nitrogen and
gallium need to be large, up to 16000, for sufficient growth of 𝐺𝑎𝑁 to occur. [3]
The high concentration of 𝑁𝐻3 in the gas stream increases the likelihood of gas phase reactions
between itself and other precursors. The 𝐴𝑙. 𝐺𝑎. 𝐼𝑛 precursors are electron acceptors with their empty
orbital, making them Lewis acids, while ammonia with a filled electron pair can act as an electron
donor, i.e. Lewis base. In the gas phase an adduct compound between 𝑁𝐻3 and 𝑇𝑀𝑀𝑙 (𝑀𝑙 =
𝐴𝑙. 𝐺𝑎. 𝐼𝑛) can be formed. This adduct formation is then believed to be followed by the release of
methane (𝐶𝐻4) and the formation of a covalent bond between the nitrogen and the metal. [4,5]
Other nitrogen precursors have been suggested, like hydrazine (𝑁2𝐻4) or triethylamine (𝑁(𝐶2𝐻6)3).
But they have been shown to have little impact on the amount of growth, [3] although the growth of
𝐼𝑛𝑁 seems to increases by using dimethyl- or t-butylhydrazine instead of ammonia. [6]

10
This study investigates the effects of substituting one, two or all hydrogens in 𝑁𝐻3 with methyl
groups. The study was carried out using quantum chemical calculations on relevant reactions. The
study focuses on 𝐺𝑎𝑁 but the adduct forming with trimethylaluminum (TMA) is also studied to see
periodic trends.
1.3 Quantum Chemistry
Quantum chemistry is a field of physical chemistry where quantum mechanics are applied to chemical
system, such as molecules and reactions. In quantum chemistry advanced computer software is used to
solve the quantum-mechanical many body problems that occur when applying the Schrödinger
equation on all molecules or chemical systems that contain more than one electron. This makes the
problems impossible to solve by analytical methods and numerical methods has to be used. A
commonly used approximation is to view the molecular orbitals as a linear combination of atomic-like
orbitals (LCAO).
ϕ𝑀𝑂 = ∑ 𝑐𝑟𝜙𝑟
𝑟
To ease the calculations basis functions are implemented. Instead of calculating the wave-function
over a three-dimensional grid around the nuclei a set of atom orbital-like functions, the basis set, are
used to represent the molecular orbital, as in the LCAO case, and the wave function can then be
viewed as a vector in the space spanned by the basis set.
2 Computational methods The quantum-chemical electron structure methods used were HF, B3LYP, MP2 and CCSD(T)
together with the basis sets STO-3G, 6-31G(d.p), 6-31G(2df.p), 6-311++G(2df.2pd) and
aug-cc-pVQZ, CCSD(T)-calculations whit the STO-3G basis set could not be achieved for 𝐻2, and
thus are the results from CCSD(T)/STO-3G omitted. Gaussian 4 (G4) theory was also used. For
calculations of the thermochemical data for the decomposition and adducts reactions G4 theory was
used and for the surface interactions B3LYP/6-31G(2df.p) with and without GD3 empirical dispersion
[7].
The Hartree-Fock (HF) method is a way to approximatively solve the time-independent Schrödinger
equation for multiple-electron systems. The main simplifications the method uses is the Born-
Oppenheimer approximation and the Hartree-Fock approximation. The Born-Oppenheimer
approximation regards the atom nuclei as infinitely heavier than the electrons and thus they will be
stationary in the system. The Hartree-Fock approximation states that the electrons moves
independently from each other, reducing the complexity of the system. [8-10]
The MP2 method is an example of perturbation theory methods, where the problem is viewed as only
a small difference from an already solved problem. This is achieved by separating the Hamiltonian
operator in two parts, the reference �̂�0 and the perturbation �̂�′. Møller-Plesset (MP) perturbation
theory takes the HF energies and applies a MP correction. At MP2 this correction is truncated to the
second-order. [11] Coupled cluster (CC) is a method where all corrections of a type is taken to an
infinite order up to a class compared with the MP infinite classes are used up to a selected order. In
CCSD(T) corrections of single, double and triple class is included.[12,13]
Becke, three-parameter, Lee-Yang-Parr (B3LYP) is a hybrid density functional. Density functional
theory does, in contrast to the HF type methods, use the electron density to describe the system’s
energy. In the Kohn-Sham theory, the kinetic energy is separated in two terms, one with and one

11
without exchange and correlation. The problem is then to find the exchange and correlation energies
(𝐸𝑥𝑐). In B3LYP the exchange is taken both from exact exchange from HF and exchange and
correlation from other sources. This makes gives 𝐸𝑥𝑐 the equation:
𝐸𝑥𝑐𝐵3𝐿𝑌𝑃 = (1 − 𝑎)𝐸𝑥
𝐿𝑆𝐷𝐴 + 𝑎𝐸𝑥𝑒𝑥𝑎𝑐𝑡 + 𝑏Δ𝐸𝑥
𝐵88 + (1 − 𝑐)𝐸𝑐𝐿𝑆𝐷𝐴 + 𝑐𝐸𝑐
𝐿𝑌𝑃
with 𝑎 = 0.20, 𝑏 = 0.72 and 𝑐 = 0.81.[14-17]
In G4 a structure optimization and harmonic frequencies are calculated at the B3LYP/6-31G(2df.p)
level of theory, with a scaling factor of 0.9854 for the frequencies. The electronic energy is then
calculated from:
𝐸𝑒𝑙𝑒𝑐𝐺4 = 𝐻𝐹𝑒𝑥𝑡 + 𝐸𝑐𝑜𝑟𝑟 + 𝑆𝑂 + 𝐻𝐿𝐶
Where 𝐻𝐹𝑒𝑥𝑡 is an extrapolation of the Hartree-Fock energy to the basis set limit, 𝐸𝑐𝑜𝑟𝑟 is electronic
correlation calculated by a series of single-point energy at different level of theory, 𝑆𝑂 is the atomic
species spin-orbit correction and 𝐻𝐿𝐶 is higher level empirical corrections.[18]
All quantum chemical calculations were carried out with the Gaussian09 program.[19] Most of the
calculations of the adsorption were performed using the computer clusters Kappa and Gamma at the
National Supercomputer Centre (NSC) at Linköping University.
3 Results and discussion
3.1 Method and basis sets
The results from the computation of the enthalpy and free energy of formation of 𝑁𝐻3 are summarized
in table 3.1 and 3.2. They can be compared with the experimental values of -45.9 kJ/mol for the
enthalpy of formation and -16.4 kJ/mol for the free energy of formation. Experimental values where
received form the NIST-JANAF database.[20]
Table 3.1 – Computed enthalpy of formation for 𝑁𝐻3 using different methods and basis sets. The
experimental value was -45.9 kJ/mol. All values are given in kJ/mol.
HF B3LYP
B3LYP +
GD3 MP2 CCSD(T) G4
STO-3G -34.9 -4.2 -4.3 118.9 N/A
6-31G(d.p) -30.4 -37.6 -37.7 -12.2 -15.4
6-31G(2df.p) -25.4 -37.6 -37.8 -25.9 -29.8
6-311++G(2df.2pd) -33.8 -53.7 -53.8 -44.5 -45.3
aug-cc-pVQZ -31.3 -52.0 -52.2 -44.4 -45.8
G4 bases -39.7
Table 3.2 – Computed reaction free energy of formation for 𝑁𝐻3 using different methods and basis
sets. The experimental value was -16.4 kJ/mol. All values are given in kJ/mol.
HF B3LYP
B3LYP +
GD3 MP2 CCSD(T) G4
STO-3G -5.8 25.0 24.9 148.3 N/A
6-31G(d.p) -0.9 -8.1 -8.3 17.2 14.1
6-31G(2df.p) 4.0 -8.2 -8.3 3.5 -0.4
6-311++G(2df.2pd) -4.3 -24.2 -24.3 -15.0 -15.8
aug-cc-pVQZ -1.9 -22.6 -22.7 -14.9 -16.3
G4 bases -13.0
12
The results show that the energies from the MP2 and CCSD(T) calculations were closest to the
experimental values. G4 calculations were used for the rest of the computations for convenience. The
deviation from the experimental values was around 1 kcal/mol, which is within the chemical accuracy.
[18]
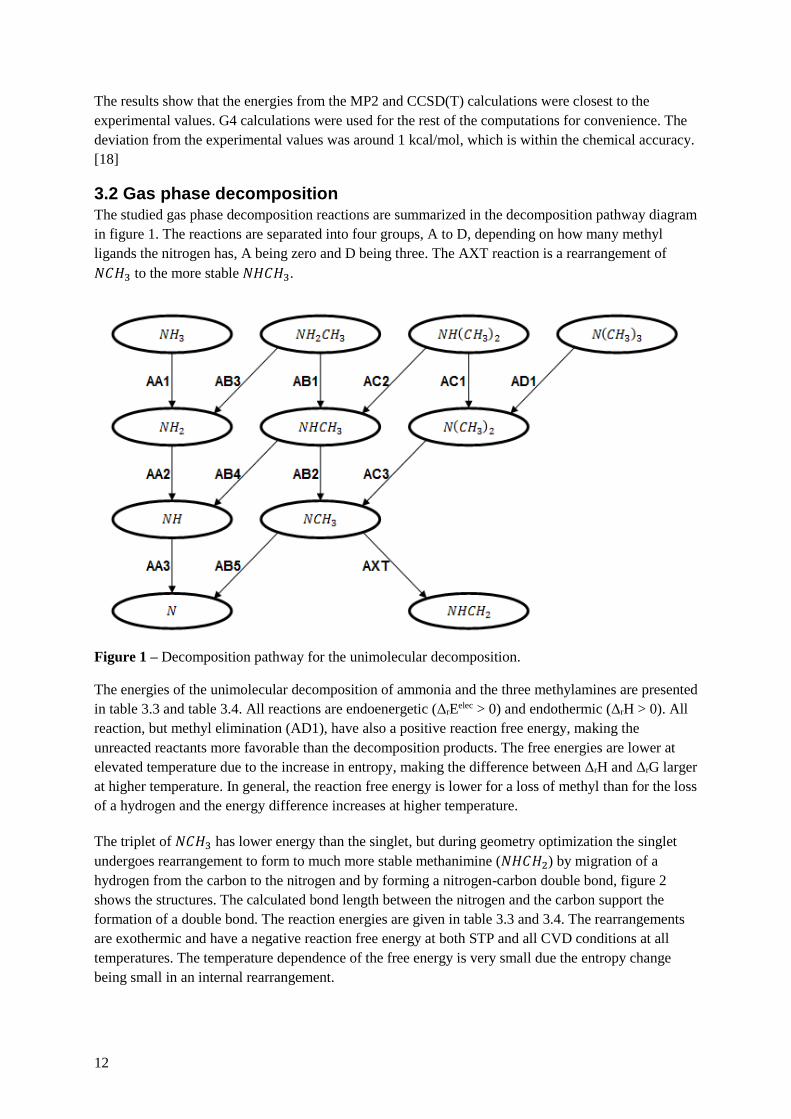
3.2 Gas phase decomposition The studied gas phase decomposition reactions are summarized in the decomposition pathway diagram
in figure 1. The reactions are separated into four groups, A to D, depending on how many methyl
ligands the nitrogen has, A being zero and D being three. The AXT reaction is a rearrangement of
𝑁𝐶𝐻3 to the more stable 𝑁𝐻𝐶𝐻3.
Figure 1 – Decomposition pathway for the unimolecular decomposition.
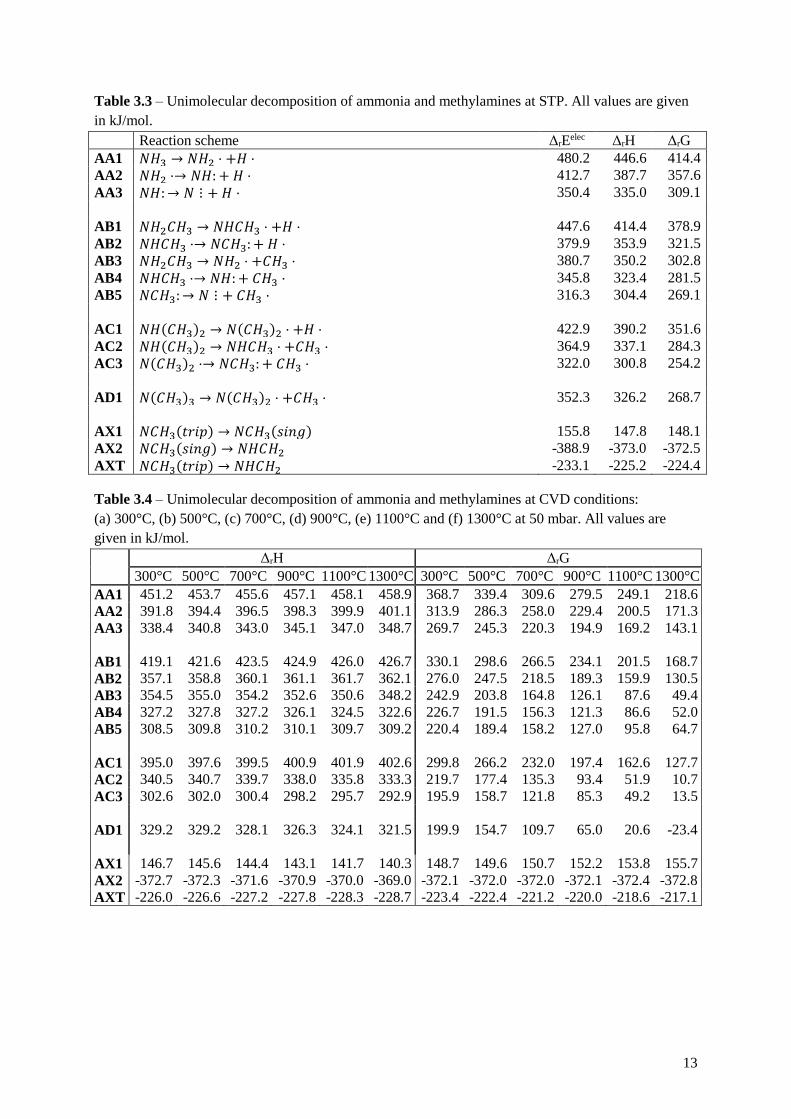
The energies of the unimolecular decomposition of ammonia and the three methylamines are presented
in table 3.3 and table 3.4. All reactions are endoenergetic (ΔrEelec > 0) and endothermic (ΔrH > 0). All
reaction, but methyl elimination (AD1), have also a positive reaction free energy, making the
unreacted reactants more favorable than the decomposition products. The free energies are lower at
elevated temperature due to the increase in entropy, making the difference between ΔrH and ΔrG larger
at higher temperature. In general, the reaction free energy is lower for a loss of methyl than for the loss
of a hydrogen and the energy difference increases at higher temperature.
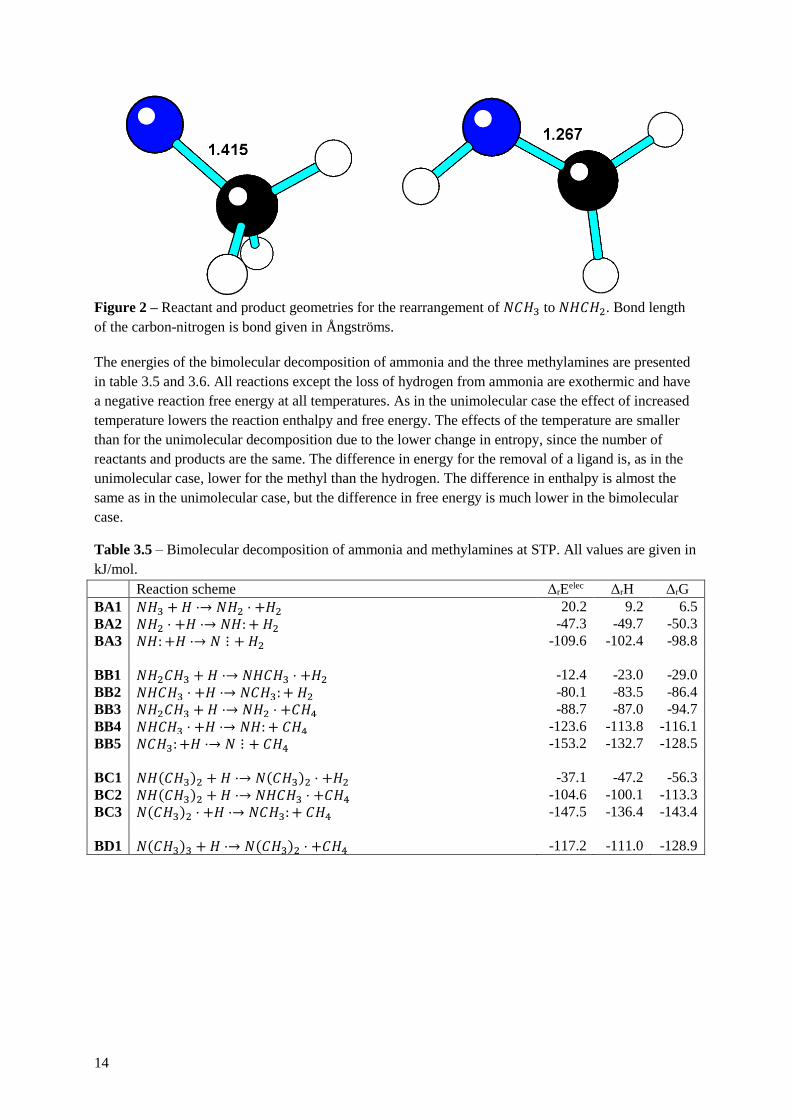
The triplet of 𝑁𝐶𝐻3 has lower energy than the singlet, but during geometry optimization the singlet
undergoes rearrangement to form to much more stable methanimine (𝑁𝐻𝐶𝐻2) by migration of a
hydrogen from the carbon to the nitrogen and by forming a nitrogen-carbon double bond, figure 2
shows the structures. The calculated bond length between the nitrogen and the carbon support the
formation of a double bond. The reaction energies are given in table 3.3 and 3.4. The rearrangements
are exothermic and have a negative reaction free energy at both STP and all CVD conditions at all
temperatures. The temperature dependence of the free energy is very small due the entropy change
being small in an internal rearrangement.
13
Table 3.3 – Unimolecular decomposition of ammonia and methylamines at STP. All values are given
in kJ/mol.
Reaction scheme ΔrEelec ΔrH ΔrG
AA1 𝑁𝐻3 → 𝑁𝐻2 ⋅ +𝐻 ⋅ 480.2 446.6 414.4
AA2 𝑁𝐻2 ⋅→ 𝑁𝐻: + 𝐻 ⋅ 412.7 387.7 357.6
AA3 𝑁𝐻: → 𝑁 ⋮ + 𝐻 ⋅ 350.4 335.0 309.1
AB1 𝑁𝐻2𝐶𝐻3 → 𝑁𝐻𝐶𝐻3 ⋅ +𝐻 ⋅ 447.6 414.4 378.9
AB2 𝑁𝐻𝐶𝐻3 ⋅→ 𝑁𝐶𝐻3: + 𝐻 ⋅ 379.9 353.9 321.5
AB3 𝑁𝐻2𝐶𝐻3 → 𝑁𝐻2 ⋅ +𝐶𝐻3 ⋅ 380.7 350.2 302.8
AB4 𝑁𝐻𝐶𝐻3 ⋅→ 𝑁𝐻: + 𝐶𝐻3 ⋅ 345.8 323.4 281.5
AB5 𝑁𝐶𝐻3: → 𝑁 ⋮ + 𝐶𝐻3 ⋅ 316.3 304.4 269.1
AC1 𝑁𝐻(𝐶𝐻3)2 → 𝑁(𝐶𝐻3)2 ⋅ +𝐻 ⋅ 422.9 390.2 351.6
AC2 𝑁𝐻(𝐶𝐻3)2 → 𝑁𝐻𝐶𝐻3 ⋅ +𝐶𝐻3 ⋅ 364.9 337.1 284.3
AC3 𝑁(𝐶𝐻3)2 ⋅→ 𝑁𝐶𝐻3: + 𝐶𝐻3 ⋅ 322.0 300.8 254.2
AD1 𝑁(𝐶𝐻3)3 → 𝑁(𝐶𝐻3)2 ⋅ +𝐶𝐻3 ⋅ 352.3 326.2 268.7
AX1 𝑁𝐶𝐻3(𝑡𝑟𝑖𝑝) → 𝑁𝐶𝐻3(𝑠𝑖𝑛𝑔) 155.8 147.8 148.1
AX2 𝑁𝐶𝐻3(𝑠𝑖𝑛𝑔) → 𝑁𝐻𝐶𝐻2 -388.9 -373.0 -372.5
AXT 𝑁𝐶𝐻3(𝑡𝑟𝑖𝑝) → 𝑁𝐻𝐶𝐻2 -233.1 -225.2 -224.4
Table 3.4 – Unimolecular decomposition of ammonia and methylamines at CVD conditions:
(a) 300°C, (b) 500°C, (c) 700°C, (d) 900°C, (e) 1100°C and (f) 1300°C at 50 mbar. All values are
given in kJ/mol.
ΔrH ΔrG
300°C 500°C 700°C 900°C 1100°C 1300°C 300°C 500°C 700°C 900°C 1100°C 1300°C
AA1 451.2 453.7 455.6 457.1 458.1 458.9 368.7 339.4 309.6 279.5 249.1 218.6
AA2 391.8 394.4 396.5 398.3 399.9 401.1 313.9 286.3 258.0 229.4 200.5 171.3
AA3 338.4 340.8 343.0 345.1 347.0 348.7 269.7 245.3 220.3 194.9 169.2 143.1
AB1 419.1 421.6 423.5 424.9 426.0 426.7 330.1 298.6 266.5 234.1 201.5 168.7
AB2 357.1 358.8 360.1 361.1 361.7 362.1 276.0 247.5 218.5 189.3 159.9 130.5
AB3 354.5 355.0 354.2 352.6 350.6 348.2 242.9 203.8 164.8 126.1 87.6 49.4
AB4 327.2 327.8 327.2 326.1 324.5 322.6 226.7 191.5 156.3 121.3 86.6 52.0
AB5 308.5 309.8 310.2 310.1 309.7 309.2 220.4 189.4 158.2 127.0 95.8 64.7
AC1 395.0 397.6 399.5 400.9 401.9 402.6 299.8 266.2 232.0 197.4 162.6 127.7
AC2 340.5 340.7 339.7 338.0 335.8 333.3 219.7 177.4 135.3 93.4 51.9 10.7
AC3 302.6 302.0 300.4 298.2 295.7 292.9 195.9 158.7 121.8 85.3 49.2 13.5
AD1 329.2 329.2 328.1 326.3 324.1 321.5 199.9 154.7 109.7 65.0 20.6 -23.4
AX1 146.7 145.6 144.4 143.1 141.7 140.3 148.7 149.6 150.7 152.2 153.8 155.7
AX2 -372.7 -372.3 -371.6 -370.9 -370.0 -369.0 -372.1 -372.0 -372.0 -372.1 -372.4 -372.8
AXT -226.0 -226.6 -227.2 -227.8 -228.3 -228.7 -223.4 -222.4 -221.2 -220.0 -218.6 -217.1
14
Figure 2 – Reactant and product geometries for the rearrangement of 𝑁𝐶𝐻3 to 𝑁𝐻𝐶𝐻2. Bond length
of the carbon-nitrogen is bond given in Ångströms.
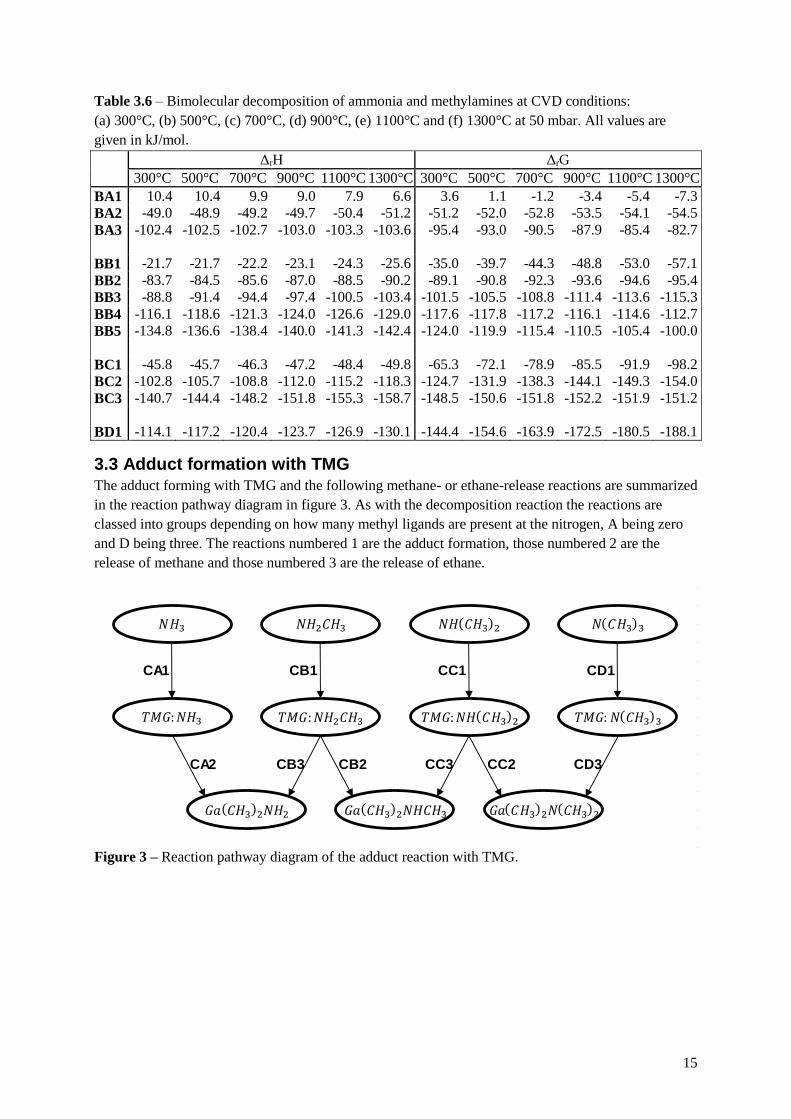
The energies of the bimolecular decomposition of ammonia and the three methylamines are presented
in table 3.5 and 3.6. All reactions except the loss of hydrogen from ammonia are exothermic and have
a negative reaction free energy at all temperatures. As in the unimolecular case the effect of increased
temperature lowers the reaction enthalpy and free energy. The effects of the temperature are smaller
than for the unimolecular decomposition due to the lower change in entropy, since the number of
reactants and products are the same. The difference in energy for the removal of a ligand is, as in the
unimolecular case, lower for the methyl than the hydrogen. The difference in enthalpy is almost the
same as in the unimolecular case, but the difference in free energy is much lower in the bimolecular
case.
Table 3.5 – Bimolecular decomposition of ammonia and methylamines at STP. All values are given in
kJ/mol.
Reaction scheme ΔrEelec ΔrH ΔrG
BA1 𝑁𝐻3 + 𝐻 ⋅→ 𝑁𝐻2 ⋅ +𝐻2 20.2 9.2 6.5
BA2 𝑁𝐻2 ⋅ +𝐻 ⋅→ 𝑁𝐻: + 𝐻2 -47.3 -49.7 -50.3
BA3 𝑁𝐻: +𝐻 ⋅→ 𝑁 ⋮ + 𝐻2 -109.6 -102.4 -98.8
BB1 𝑁𝐻2𝐶𝐻3 + 𝐻 ⋅→ 𝑁𝐻𝐶𝐻3 ⋅ +𝐻2 -12.4 -23.0 -29.0
BB2 𝑁𝐻𝐶𝐻3 ⋅ +𝐻 ⋅→ 𝑁𝐶𝐻3: + 𝐻2 -80.1 -83.5 -86.4
BB3 𝑁𝐻2𝐶𝐻3 + 𝐻 ⋅→ 𝑁𝐻2 ⋅ +𝐶𝐻4 -88.7 -87.0 -94.7
BB4 𝑁𝐻𝐶𝐻3 ⋅ +𝐻 ⋅→ 𝑁𝐻: + 𝐶𝐻4 -123.6 -113.8 -116.1
BB5 𝑁𝐶𝐻3: +𝐻 ⋅→ 𝑁 ⋮ + 𝐶𝐻4 -153.2 -132.7 -128.5
BC1 𝑁𝐻(𝐶𝐻3)2 + 𝐻 ⋅→ 𝑁(𝐶𝐻3)2 ⋅ +𝐻2 -37.1 -47.2 -56.3
BC2 𝑁𝐻(𝐶𝐻3)2 + 𝐻 ⋅→ 𝑁𝐻𝐶𝐻3 ⋅ +𝐶𝐻4 -104.6 -100.1 -113.3
BC3 𝑁(𝐶𝐻3)2 ⋅ +𝐻 ⋅→ 𝑁𝐶𝐻3: + 𝐶𝐻4 -147.5 -136.4 -143.4
BD1 𝑁(𝐶𝐻3)3 + 𝐻 ⋅→ 𝑁(𝐶𝐻3)2 ⋅ +𝐶𝐻4 -117.2 -111.0 -128.9
15
Table 3.6 – Bimolecular decomposition of ammonia and methylamines at CVD conditions:
(a) 300°C, (b) 500°C, (c) 700°C, (d) 900°C, (e) 1100°C and (f) 1300°C at 50 mbar. All values are
given in kJ/mol.
ΔrH ΔrG
300°C 500°C 700°C 900°C 1100°C 1300°C 300°C 500°C 700°C 900°C 1100°C 1300°C
BA1 10.4 10.4 9.9 9.0 7.9 6.6 3.6 1.1 -1.2 -3.4 -5.4 -7.3
BA2 -49.0 -48.9 -49.2 -49.7 -50.4 -51.2 -51.2 -52.0 -52.8 -53.5 -54.1 -54.5
BA3 -102.4 -102.5 -102.7 -103.0 -103.3 -103.6 -95.4 -93.0 -90.5 -87.9 -85.4 -82.7
BB1 -21.7 -21.7 -22.2 -23.1 -24.3 -25.6 -35.0 -39.7 -44.3 -48.8 -53.0 -57.1
BB2 -83.7 -84.5 -85.6 -87.0 -88.5 -90.2 -89.1 -90.8 -92.3 -93.6 -94.6 -95.4
BB3 -88.8 -91.4 -94.4 -97.4 -100.5 -103.4 -101.5 -105.5 -108.8 -111.4 -113.6 -115.3
BB4 -116.1 -118.6 -121.3 -124.0 -126.6 -129.0 -117.6 -117.8 -117.2 -116.1 -114.6 -112.7
BB5 -134.8 -136.6 -138.4 -140.0 -141.3 -142.4 -124.0 -119.9 -115.4 -110.5 -105.4 -100.0
BC1 -45.8 -45.7 -46.3 -47.2 -48.4 -49.8 -65.3 -72.1 -78.9 -85.5 -91.9 -98.2
BC2 -102.8 -105.7 -108.8 -112.0 -115.2 -118.3 -124.7 -131.9 -138.3 -144.1 -149.3 -154.0
BC3 -140.7 -144.4 -148.2 -151.8 -155.3 -158.7 -148.5 -150.6 -151.8 -152.2 -151.9 -151.2
BD1 -114.1 -117.2 -120.4 -123.7 -126.9 -130.1 -144.4 -154.6 -163.9 -172.5 -180.5 -188.1
3.3 Adduct formation with TMG
The adduct forming with TMG and the following methane- or ethane-release reactions are summarized
in the reaction pathway diagram in figure 3. As with the decomposition reaction the reactions are
classed into groups depending on how many methyl ligands are present at the nitrogen, A being zero
and D being three. The reactions numbered 1 are the adduct formation, those numbered 2 are the
release of methane and those numbered 3 are the release of ethane.
Figure 3 – Reaction pathway diagram of the adduct reaction with TMG.
CA2 CB3 CB2 CC3 CC2 CD3
𝑁𝐻3 𝑁𝐻2𝐶𝐻3 𝑁𝐻 𝐶𝐻3 2 𝑁 𝐶𝐻3 3
𝑇𝑀𝐺: 𝑁𝐻3 𝑇𝑀𝐺: 𝑁𝐻2𝐶𝐻3 𝑇𝑀𝐺: 𝑁𝐻 𝐶𝐻3 2 𝑇𝑀𝐺: 𝑁 𝐶𝐻3 3
𝐺𝑎 𝐶𝐻3 2𝑁𝐻2 𝐺𝑎 𝐶𝐻3 2𝑁𝐻𝐶𝐻3 𝐺𝑎 𝐶𝐻3 2𝑁 𝐶𝐻3 2
CA1 CB1 CC1 CD1

16
Figure 4 – Geometry optimized adducts with TMG. Distance between 𝐺𝑎 − 𝑁 is given in Ångströms.
In table 3.7 and 3.8 the reaction energies the adduct formation and the removal of methane and ethane
from the formed adducts are shown. The adduct formations, reaction CA1, CB1, CC1 and CD1, are all
exothermic and the reaction free energy are negative for at STP but positive for all reactions at CVD
temperature and pressure. The reaction free energy increases as the temperature is increased due to the
decrease in entropy in the formed adducts. The reaction free energy for the three first reactions (CA1,
CB1 and CC1) decreases as the nitrogen gets more methyl ligands, possible due to a stabilizing effect
of the positive charge at the nitrogen by the methyl groups. For the last adduct reaction CD1 the
reaction free energy increases, this could be an effect of steric factors. The difference between lowest
and highest reaction free energy increases as the temperature is increased. Figure 4 shows the
optimized geometries and the distance between the 𝐺𝑎 and 𝑁.
The removal of ligands from the adducts are categorized in two groups, CA2, CB2 and CC2 are the
removal of a methane and CB3, CC3 and CD3 are the removal of an ethane. At STP and lower CVD-
temperatures the removal of both methane and ethane are endothermic and at higher they are
exothermic, except for CB3 witch is exothermic at all temperatures. The temperature at which the
enthalpy changes sign increases as the nitrogen gets more methyl ligands. The reaction free energy is
negative for all the removal reactions, and due to the increase in entropy the reaction is more favorable
at higher temperatures. As with the reaction entropy the reaction free energy is lower for the removal
of ethane than for the removal of methane for the di- and trimethylamine adducts.
17
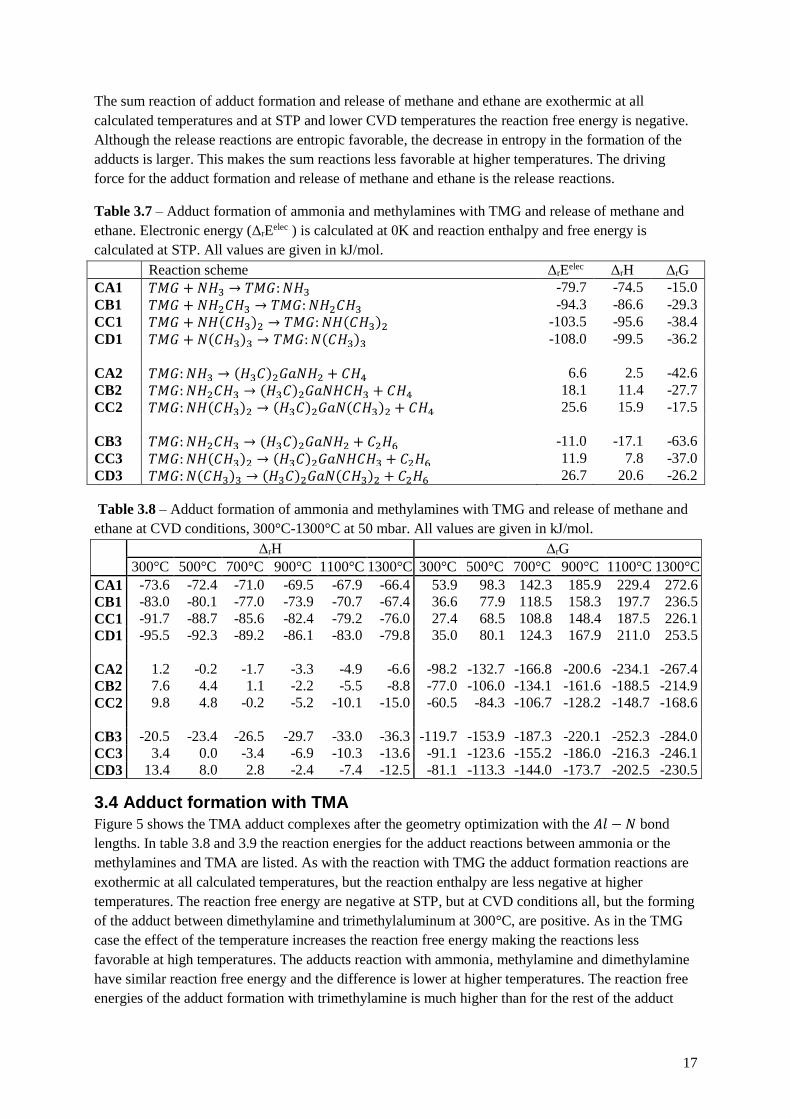
The sum reaction of adduct formation and release of methane and ethane are exothermic at all
calculated temperatures and at STP and lower CVD temperatures the reaction free energy is negative.
Although the release reactions are entropic favorable, the decrease in entropy in the formation of the
adducts is larger. This makes the sum reactions less favorable at higher temperatures. The driving
force for the adduct formation and release of methane and ethane is the release reactions.
Table 3.7 – Adduct formation of ammonia and methylamines with TMG and release of methane and
ethane. Electronic energy (ΔrEelec ) is calculated at 0K and reaction enthalpy and free energy is
calculated at STP. All values are given in kJ/mol.
Reaction scheme ΔrEelec ΔrH ΔrG
CA1 𝑇𝑀𝐺 + 𝑁𝐻3 → 𝑇𝑀𝐺: 𝑁𝐻3 -79.7 -74.5 -15.0
CB1 𝑇𝑀𝐺 + 𝑁𝐻2𝐶𝐻3 → 𝑇𝑀𝐺: 𝑁𝐻2𝐶𝐻3 -94.3 -86.6 -29.3
CC1 𝑇𝑀𝐺 + 𝑁𝐻(𝐶𝐻3)2 → 𝑇𝑀𝐺: 𝑁𝐻(𝐶𝐻3)2 -103.5 -95.6 -38.4
CD1 𝑇𝑀𝐺 + 𝑁(𝐶𝐻3)3 → 𝑇𝑀𝐺: 𝑁(𝐶𝐻3)3 -108.0 -99.5 -36.2
CA2 𝑇𝑀𝐺: 𝑁𝐻3 → (𝐻3𝐶)2𝐺𝑎𝑁𝐻2 + 𝐶𝐻4 6.6 2.5 -42.6
CB2 𝑇𝑀𝐺: 𝑁𝐻2𝐶𝐻3 → (𝐻3𝐶)2𝐺𝑎𝑁𝐻𝐶𝐻3 + 𝐶𝐻4 18.1 11.4 -27.7
CC2 𝑇𝑀𝐺: 𝑁𝐻(𝐶𝐻3)2 → (𝐻3𝐶)2𝐺𝑎𝑁(𝐶𝐻3)2 + 𝐶𝐻4 25.6 15.9 -17.5
CB3 𝑇𝑀𝐺: 𝑁𝐻2𝐶𝐻3 → (𝐻3𝐶)2𝐺𝑎𝑁𝐻2 + 𝐶2𝐻6 -11.0 -17.1 -63.6
CC3 𝑇𝑀𝐺: 𝑁𝐻(𝐶𝐻3)2 → (𝐻3𝐶)2𝐺𝑎𝑁𝐻𝐶𝐻3 + 𝐶2𝐻6 11.9 7.8 -37.0
CD3 𝑇𝑀𝐺: 𝑁(𝐶𝐻3)3 → (𝐻3𝐶)2𝐺𝑎𝑁(𝐶𝐻3)2 + 𝐶2𝐻6 26.7 20.6 -26.2
Table 3.8 – Adduct formation of ammonia and methylamines with TMG and release of methane and
ethane at CVD conditions, 300°C-1300°C at 50 mbar. All values are given in kJ/mol.
ΔrH ΔrG
300°C 500°C 700°C 900°C 1100°C 1300°C 300°C 500°C 700°C 900°C 1100°C 1300°C
CA1 -73.6 -72.4 -71.0 -69.5 -67.9 -66.4 53.9 98.3 142.3 185.9 229.4 272.6
CB1 -83.0 -80.1 -77.0 -73.9 -70.7 -67.4 36.6 77.9 118.5 158.3 197.7 236.5
CC1 -91.7 -88.7 -85.6 -82.4 -79.2 -76.0 27.4 68.5 108.8 148.4 187.5 226.1
CD1 -95.5 -92.3 -89.2 -86.1 -83.0 -79.8 35.0 80.1 124.3 167.9 211.0 253.5
CA2 1.2 -0.2 -1.7 -3.3 -4.9 -6.6 -98.2 -132.7 -166.8 -200.6 -234.1 -267.4
CB2 7.6 4.4 1.1 -2.2 -5.5 -8.8 -77.0 -106.0 -134.1 -161.6 -188.5 -214.9
CC2 9.8 4.8 -0.2 -5.2 -10.1 -15.0 -60.5 -84.3 -106.7 -128.2 -148.7 -168.6
CB3 -20.5 -23.4 -26.5 -29.7 -33.0 -36.3 -119.7 -153.9 -187.3 -220.1 -252.3 -284.0
CC3 3.4 0.0 -3.4 -6.9 -10.3 -13.6 -91.1 -123.6 -155.2 -186.0 -216.3 -246.1
CD3 13.4 8.0 2.8 -2.4 -7.4 -12.5 -81.1 -113.3 -144.0 -173.7 -202.5 -230.5
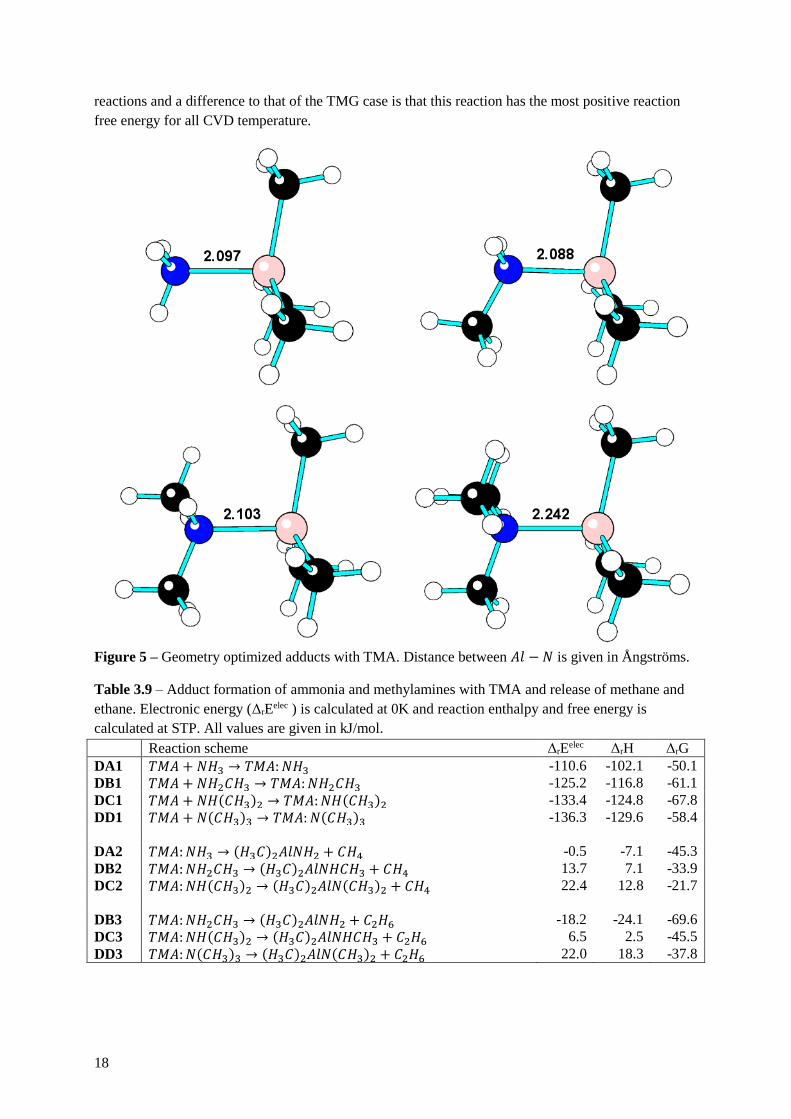
3.4 Adduct formation with TMA
Figure 5 shows the TMA adduct complexes after the geometry optimization with the 𝐴𝑙 − 𝑁 bond
lengths. In table 3.8 and 3.9 the reaction energies for the adduct reactions between ammonia or the
methylamines and TMA are listed. As with the reaction with TMG the adduct formation reactions are
exothermic at all calculated temperatures, but the reaction enthalpy are less negative at higher
temperatures. The reaction free energy are negative at STP, but at CVD conditions all, but the forming
of the adduct between dimethylamine and trimethylaluminum at 300°C, are positive. As in the TMG
case the effect of the temperature increases the reaction free energy making the reactions less
favorable at high temperatures. The adducts reaction with ammonia, methylamine and dimethylamine
have similar reaction free energy and the difference is lower at higher temperatures. The reaction free
energies of the adduct formation with trimethylamine is much higher than for the rest of the adduct
18
reactions and a difference to that of the TMG case is that this reaction has the most positive reaction
free energy for all CVD temperature.
Figure 5 – Geometry optimized adducts with TMA. Distance between 𝐴𝑙 − 𝑁 is given in Ångströms.
Table 3.9 – Adduct formation of ammonia and methylamines with TMA and release of methane and
ethane. Electronic energy (ΔrEelec ) is calculated at 0K and reaction enthalpy and free energy is
calculated at STP. All values are given in kJ/mol.
Reaction scheme ΔrEelec ΔrH ΔrG
DA1 𝑇𝑀𝐴 + 𝑁𝐻3 → 𝑇𝑀𝐴: 𝑁𝐻3 -110.6 -102.1 -50.1
DB1 𝑇𝑀𝐴 + 𝑁𝐻2𝐶𝐻3 → 𝑇𝑀𝐴: 𝑁𝐻2𝐶𝐻3 -125.2 -116.8 -61.1
DC1 𝑇𝑀𝐴 + 𝑁𝐻(𝐶𝐻3)2 → 𝑇𝑀𝐴: 𝑁𝐻(𝐶𝐻3)2 -133.4 -124.8 -67.8
DD1 𝑇𝑀𝐴 + 𝑁(𝐶𝐻3)3 → 𝑇𝑀𝐴: 𝑁(𝐶𝐻3)3 -136.3 -129.6 -58.4
DA2 𝑇𝑀𝐴: 𝑁𝐻3 → (𝐻3𝐶)2𝐴𝑙𝑁𝐻2 + 𝐶𝐻4 -0.5 -7.1 -45.3
DB2 𝑇𝑀𝐴: 𝑁𝐻2𝐶𝐻3 → (𝐻3𝐶)2𝐴𝑙𝑁𝐻𝐶𝐻3 + 𝐶𝐻4 13.7 7.1 -33.9
DC2 𝑇𝑀𝐴: 𝑁𝐻(𝐶𝐻3)2 → (𝐻3𝐶)2𝐴𝑙𝑁(𝐶𝐻3)2 + 𝐶𝐻4 22.4 12.8 -21.7
DB3 𝑇𝑀𝐴: 𝑁𝐻2𝐶𝐻3 → (𝐻3𝐶)2𝐴𝑙𝑁𝐻2 + 𝐶2𝐻6 -18.2 -24.1 -69.6
DC3 𝑇𝑀𝐴: 𝑁𝐻(𝐶𝐻3)2 → (𝐻3𝐶)2𝐴𝑙𝑁𝐻𝐶𝐻3 + 𝐶2𝐻6 6.5 2.5 -45.5
DD3 𝑇𝑀𝐴: 𝑁(𝐶𝐻3)3 → (𝐻3𝐶)2𝐴𝑙𝑁(𝐶𝐻3)2 + 𝐶2𝐻6 22.0 18.3 -37.8

19
Table 3.10 – Adduct formation of ammonia and methylamines with TMA and release of methane and
ethane at CVD conditions, 300°C-1300°C at 50 mbar. All values are given in kJ/mol.
ΔrH ΔrG
300°C 500°C 700°C 900°C 1100°C 1300°C 300°C 500°C 700°C 900°C 1100°C 1300°C
DA1 -99.4 -96.6 -93.7 -90.5 -87.3 -84.1 11.3 49.5 87.0 123.8 160.1 195.9
DB1 -113.5 -110.7 -107.7 -104.6 -101.4 -98.2 3.5 43.9 83.6 122.6 161.1 199.1
DC1 -121.1 -118.2 -115.1 -112.0 -108.9 -105.7 -2.2 38.8 79.0 118.7 157.7 196.3
DD1 -128.0 -126.6 -125.2 -123.8 -122.3 -120.9 21.2 73.1 124.5 175.7 226.7 277.4
DA2 -10.6 -13.6 -16.7 -20.0 -23.3 -26.6 -93.7 -122.3 -150.0 -177.1 -203.6 -229.6
DB2 3.4 0.2 -3.1 -6.4 -9.7 -13.0 -84.9 -115.3 -144.7 -173.5 -201.8 -229.5
DC2 6.7 1.7 -3.3 -8.3 -13.2 -18.2 -65.8 -90.3 -113.5 -135.7 -157.0 -177.6
DB3 -27.5 -30.4 -33.5 -36.7 -40.0 -43.4 -124.7 -158.2 -190.9 -222.9 -254.4 -285.4
DC3 -1.9 -5.3 -8.7 -12.2 -15.6 -19.0 -102.6 -137.2 -170.9 -203.9 -236.4 -268.3
DD3 13.4 9.7 6.1 2.6 -0.8 -4.2 -102.2 -142.0 -180.8 -218.8 -256.3 -293.3
The release of methane and ethane from the TMA adducts are more exothermic than the release from
the TMG adducts. The reaction free energy is negative for all reaction due to them being entropic
favorable. As with the TMG case the releases have higher entropy as the nitrogen gets more methyl
groups and that the release of ethane is more favorable than the release of methane when both could be
released.
The sum reactions for the adduct formation and release of methane and ethane are exothermic at all
temperatures. All reactions but the formation of the adduct of TMA and dimethylamine and release of
methane, which have a positive reaction free energy at higher temperatures, have negative reaction
free energy at all temperatures.
3.5 Surface interactions with gallium nitride For the surface interactions a hydrogen terminated model surface was used, see figure 6. Two different
clusters were investigated, a smaller (𝐺𝑎𝑁)4𝐻14 and a larger (𝐺𝑎𝑁)13𝐻32 cluster. The reaction
electronic energies and 𝐺𝑎 − 𝑁 adsorption distance are given in table 3.11 for the adsorption of 𝑁𝐻𝑥
1 ≤ 𝑥 ≤ 3. The reaction electronic energy and bond length of both the adsorption of 𝑁𝐻2 and 𝑁𝐻 are
approximately the same using both clusters, indicating that the clusters are equally good
approximations of the surface of these species. The energy and bond length for 𝑁𝐻3 has a large
difference between the models, possible due to a better spreading of the unpaired electron in the larger
cluster. Another problem that occurred using the smaller cluster was that 𝑁𝐻2𝐶𝐻3 and 𝑁𝐻(𝐶𝐻3)2
moved from the adsorption site at the 𝐺𝑎 during the geometry optimization to instead form hydrogen
bonds to a nearby 𝑁𝐻 group in the cluster. Those 𝑁𝐻 are much further from the adsorption site in the
larger cluster and not present at all in a real pure 𝐺𝑎𝑁 film. Due to these complications the larger
cluster was the used in the following adsorption investigations.
Table 3.11 – Comparison between the larger and smaller cluster. The electronic energy is given in
kJ/mol and the atomic distance is given in Ångströms.
Smaller cluster Larger cluster
Reaction scheme ΔrEelec rGa-N ΔrEelec rGa-N
EA1 𝐻(𝑎𝑑𝑠) + 𝑁𝐻3(𝑔) → 𝑁𝐻3(𝑎𝑑𝑠) + 1 2⁄ 𝐻2(𝑔) 121.5 3.850 13.9 2.037
EA2 𝐻(𝑎𝑑𝑠) + 𝑁𝐻2(𝑔) → 𝑁𝐻2(𝑎𝑑𝑠) + 1 2⁄ 𝐻2(𝑔) -251.7 1.863 -252.7 1.859
EA3 𝐻(𝑎𝑑𝑠) + 𝑁𝐻(𝑔) → 𝑁𝐻(𝑎𝑑𝑠) + 1 2⁄ 𝐻2(𝑔) -192.2 1.898 -192.2 1.901

20
Figure 6 – Hydrogen terminated gallium nitride cluster used in the modeling of surface interactions.
Top the smaller (𝐺𝑎𝑁)4𝐻14 cluster and bottom the larger (𝐺𝑎𝑁)13𝐻32. Both clusters are viewed
along the symmetry axis on the left and from the side at the right.
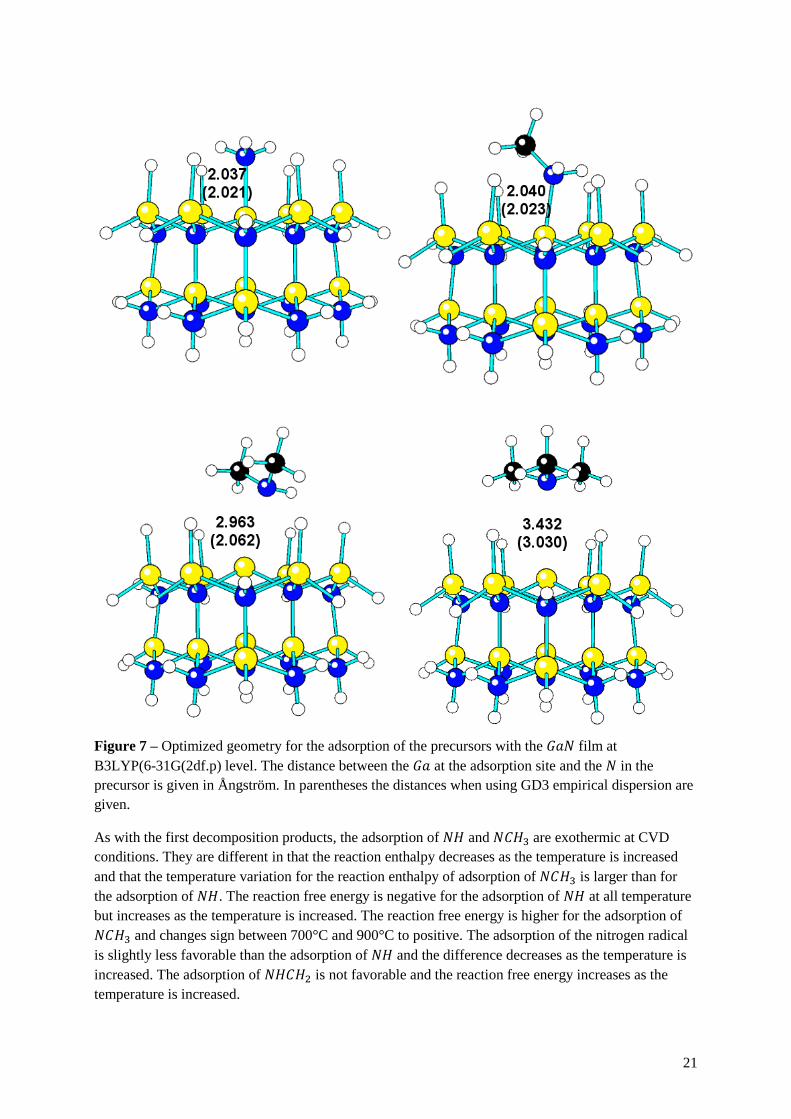
The reaction energies for the adsorption are presented in table 3.12 and 3.13 and figure 7 shows the
geometries for the adsorption of the undecomposed precursors. The adsorption of the undecomposed
ammonia and trimethylamines has positive reaction free energy, at all CVD temperatures and thus
they are not likely to adsorb to the 𝐺𝑎𝑁 film. The reaction free energy increases as the temperature is
increased. The bond length and geometries indicate that the adsorption is hindered by steric factors
from the methyl groups. For the first decomposition products the adsorptions at CVD conditions are
exothermic and the less methyl groups the nitrogen has the more exothermic they are. At higher
temperatures the reactions have higher reaction enthalpy, but the effect of temperature is smaller as the
number of methyl groups is increased. The reaction free energy is smallest for the adsorption of 𝑁𝐻2
at lower CVD temperatures and increases as the temperature goes up and with more methyl ligands.
For the adsorption of 𝑁(𝐶𝐻3)2 the reaction free energy changes sign from negative to positive at
around 700°C. All other reaction free energies are negative indicating favorable reactions.
21
Figure 7 – Optimized geometry for the adsorption of the precursors with the 𝐺𝑎𝑁 film at
B3LYP(6-31G(2df.p) level. The distance between the 𝐺𝑎 at the adsorption site and the 𝑁 in the
precursor is given in Ångström. In parentheses the distances when using GD3 empirical dispersion are
given.
As with the first decomposition products, the adsorption of 𝑁𝐻 and 𝑁𝐶𝐻3 are exothermic at CVD
conditions. They are different in that the reaction enthalpy decreases as the temperature is increased
and that the temperature variation for the reaction enthalpy of adsorption of 𝑁𝐶𝐻3 is larger than for
the adsorption of 𝑁𝐻. The reaction free energy is negative for the adsorption of 𝑁𝐻 at all temperature
but increases as the temperature is increased. The reaction free energy is higher for the adsorption of
𝑁𝐶𝐻3 and changes sign between 700°C and 900°C to positive. The adsorption of the nitrogen radical
is slightly less favorable than the adsorption of 𝑁𝐻 and the difference decreases as the temperature is
increased. The adsorption of 𝑁𝐻𝐶𝐻2 is not favorable and the reaction free energy increases as the
temperature is increased.
22
Table 3.12 – Surface interaction of ammonia and methylamines with 𝐺𝑎𝑁 at STP. All values are
given in kJ/mol.
Reaction scheme ΔrEelec ΔrH ΔrG
EA1 𝐻(𝑎𝑑𝑠) + 𝑁𝐻3(𝑔) → 𝑁𝐻3(𝑎𝑑𝑠) + 1 2⁄ 𝐻2(𝑔) 13.9 12.2 36.8
EB1 𝐻(𝑎𝑑𝑠) + 𝑁𝐻2𝐶𝐻3(𝑔) → 𝑁𝐻2𝐶𝐻3(𝑎𝑑𝑠) + 1 2⁄ 𝐻2(𝑔) 15.8 14.1 48.4
EC1 𝐻(𝑎𝑑𝑠) + 𝑁𝐻(𝐶𝐻3)2(𝑔) → 𝑁𝐻(𝐶𝐻3)2(𝑎𝑑𝑠) + 1 2⁄ 𝐻2(𝑔) 109.3 109.5 128.4
ED1 𝐻(𝑎𝑑𝑠) + 𝑁(𝐶𝐻3)3(𝑔) → 𝑁(𝐶𝐻3)3(𝑎𝑑𝑠) + 1 2⁄ 𝐻2(𝑔) 114.3 110.9 140.9
EA2 𝐻(𝑎𝑑𝑠) + 𝑁𝐻2(𝑔) → 𝑁𝐻2(𝑎𝑑𝑠) + 1 2⁄ 𝐻2(𝑔) -252.7 -242.5 -215.8
EB2 𝐻(𝑎𝑑𝑠) + 𝑁𝐻𝐶𝐻3(𝑔) → 𝑁𝐻𝐶𝐻3(𝑎𝑑𝑠) + 1 2⁄ 𝐻2(𝑔) -212.1 -200.5 -164.7
EC2 𝐻(𝑎𝑑𝑠) + 𝑁(𝐶𝐻3)2(𝑔) → 𝑁(𝐶𝐻3)2(𝑎𝑑𝑠) + 1 2⁄ 𝐻2(𝑔) -159.0 -152.0 -108.1
EA3 𝐻(𝑎𝑑𝑠) + 𝑁𝐻(𝑔) → 𝑁𝐻(𝑎𝑑𝑠) + 1 2⁄ 𝐻2(𝑔) -192.2 -188.0 -162.3
EB3 𝐻(𝑎𝑑𝑠) + 𝑁𝐶𝐻3(𝑔) → 𝑁𝐶𝐻3(𝑎𝑑𝑠) + 1 2⁄ 𝐻2(𝑔) -144.2 -143.7 -107.7
EBX 𝐻(𝑎𝑑𝑠) + 𝑁𝐻𝐶𝐻2(𝑔) → 𝑁𝐻𝐶𝐻2(𝑎𝑑𝑠) + 1 2⁄ 𝐻2(𝑔) 19.6 19.7 48.9
EA4 𝐻(𝑎𝑑𝑠) + 𝑁(𝑔) → 𝑁(𝑎𝑑𝑠) + 1 2⁄ 𝐻2(𝑔) -138.0 -137.5 -120.0
Table 3.13 – Surface interaction of ammonia and methylamines with 𝐺𝑎𝑁 at CVD conditions, 300°C-
1300°C at 50 mbar. All values are given in kJ/mol.
ΔrH ΔrG
300°C 500°C 700°C 900°C 1100°C 1300°C 300°C 500°C 700°C 900°C 1100°C 1300°C
EA1 13.7 14.6 15.3 15.9 16.5 17.0 66.1 84.2 102.2 119.9 137.6 155.2
EB1 16.1 17.1 17.8 18.4 18.9 19.4 86.5 110.9 135.1 159.2 183.2 207.0
EC1 115.4 118.7 121.4 123.9 126.1 128.2 150.7 162.5 173.5 184.0 194.1 203.8
ED1 111.9 111.7 111.0 110.0 108.8 107.5 175.2 197.3 219.5 241.9 264.5 287.2
EA2 -239.8 -237.6 -235.7 -233.8 -232.1 -230.4 -185.0 -166.2 -147.9 -130.1 -112.5 -95.2
EB2 -197.8 -196.0 -194.3 -192.7 -191.1 -189.4 -125.5 -100.6 -76.1 -51.9 -28.1 -4.4
EC2 -151.0 -150.7 -150.5 -150.4 -150.4 -150.3 -60.9 -29.5 1.8 33.1 64.4 95.7
EA3 -188.1 -188.3 -188.7 -189.3 -190.0 -190.6 -131.5 -111.7 -91.9 -71.9 -51.9 -31.7
EB3 -144.2 -145.0 -146.1 -147.4 -148.8 -150.2 -67.3 -40.3 -13.1 14.4 42.1 70.0
EBX 25.6 29.2 32.1 34.6 36.9 39.0 80.8 99.5 117.3 134.6 151.4 168.0
EA4 -136.4 -136.2 -136.3 -136.7 -137.2 -137.7 -97.1 -83.4 -69.7 -56.0 -42.2 -28.3
In table 3.14 and 3.15 are the reaction energies using B3LYP with empirical dispersion listed. For the
most reactions the difference between the two calculations with and without the dispersion is less than
50 kJ/mol and the difference increases as the temperature is increased. The energies for the adsorption
of dimethylamine are much lower for the GD3 case. This can be explained with the adsorption
distance given in figure 7 which shows a much closer distance between the nitrogen and the gallium in
the GD3 case.
23
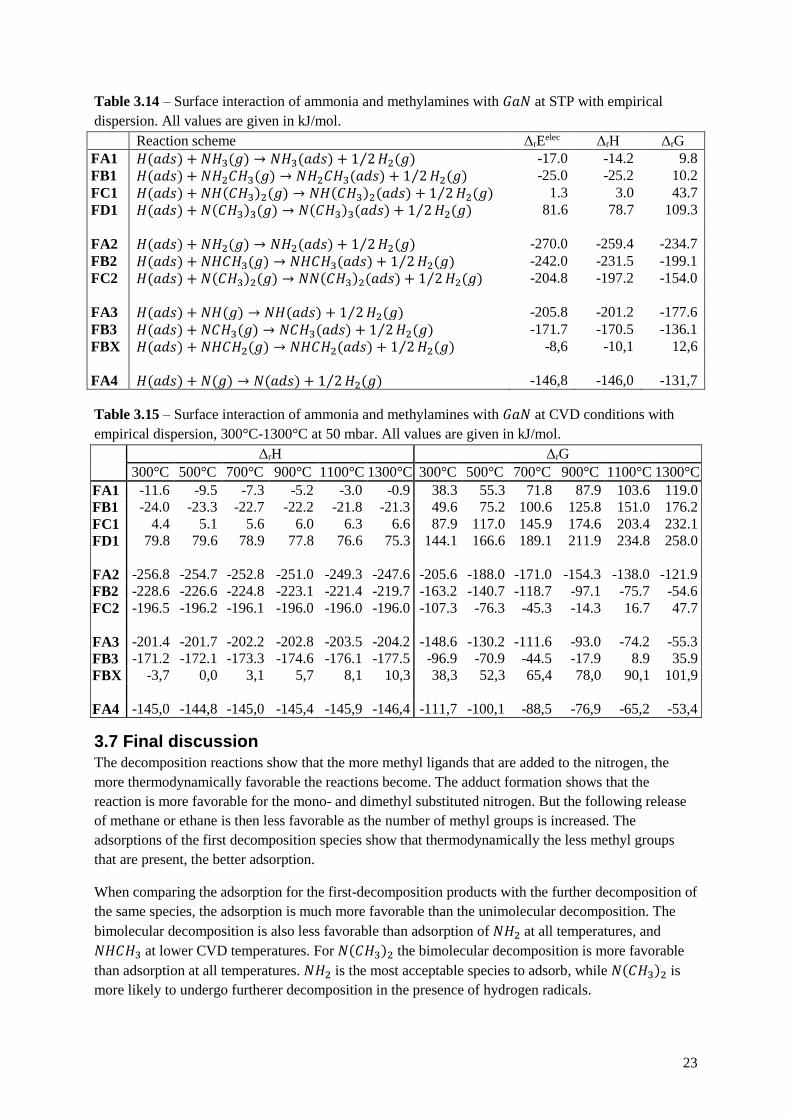
Table 3.14 – Surface interaction of ammonia and methylamines with 𝐺𝑎𝑁 at STP with empirical
dispersion. All values are given in kJ/mol.
Reaction scheme ΔrEelec ΔrH ΔrG
FA1 𝐻(𝑎𝑑𝑠) + 𝑁𝐻3(𝑔) → 𝑁𝐻3(𝑎𝑑𝑠) + 1 2⁄ 𝐻2(𝑔) -17.0 -14.2 9.8
FB1 𝐻(𝑎𝑑𝑠) + 𝑁𝐻2𝐶𝐻3(𝑔) → 𝑁𝐻2𝐶𝐻3(𝑎𝑑𝑠) + 1 2⁄ 𝐻2(𝑔) -25.0 -25.2 10.2
FC1 𝐻(𝑎𝑑𝑠) + 𝑁𝐻(𝐶𝐻3)2(𝑔) → 𝑁𝐻(𝐶𝐻3)2(𝑎𝑑𝑠) + 1 2⁄ 𝐻2(𝑔) 1.3 3.0 43.7
FD1 𝐻(𝑎𝑑𝑠) + 𝑁(𝐶𝐻3)3(𝑔) → 𝑁(𝐶𝐻3)3(𝑎𝑑𝑠) + 1 2⁄ 𝐻2(𝑔) 81.6 78.7 109.3
FA2 𝐻(𝑎𝑑𝑠) + 𝑁𝐻2(𝑔) → 𝑁𝐻2(𝑎𝑑𝑠) + 1 2⁄ 𝐻2(𝑔) -270.0 -259.4 -234.7
FB2 𝐻(𝑎𝑑𝑠) + 𝑁𝐻𝐶𝐻3(𝑔) → 𝑁𝐻𝐶𝐻3(𝑎𝑑𝑠) + 1 2⁄ 𝐻2(𝑔) -242.0 -231.5 -199.1
FC2 𝐻(𝑎𝑑𝑠) + 𝑁(𝐶𝐻3)2(𝑔) → 𝑁𝑁(𝐶𝐻3)2(𝑎𝑑𝑠) + 1 2⁄ 𝐻2(𝑔) -204.8 -197.2 -154.0
FA3 𝐻(𝑎𝑑𝑠) + 𝑁𝐻(𝑔) → 𝑁𝐻(𝑎𝑑𝑠) + 1 2⁄ 𝐻2(𝑔) -205.8 -201.2 -177.6
FB3 𝐻(𝑎𝑑𝑠) + 𝑁𝐶𝐻3(𝑔) → 𝑁𝐶𝐻3(𝑎𝑑𝑠) + 1 2⁄ 𝐻2(𝑔) -171.7 -170.5 -136.1
FBX 𝐻(𝑎𝑑𝑠) + 𝑁𝐻𝐶𝐻2(𝑔) → 𝑁𝐻𝐶𝐻2(𝑎𝑑𝑠) + 1 2⁄ 𝐻2(𝑔) -8,6 -10,1 12,6
FA4 𝐻(𝑎𝑑𝑠) + 𝑁(𝑔) → 𝑁(𝑎𝑑𝑠) + 1 2⁄ 𝐻2(𝑔) -146,8 -146,0 -131,7
Table 3.15 – Surface interaction of ammonia and methylamines with 𝐺𝑎𝑁 at CVD conditions with
empirical dispersion, 300°C-1300°C at 50 mbar. All values are given in kJ/mol.
ΔrH ΔrG
300°C 500°C 700°C 900°C 1100°C 1300°C 300°C 500°C 700°C 900°C 1100°C 1300°C
FA1 -11.6 -9.5 -7.3 -5.2 -3.0 -0.9 38.3 55.3 71.8 87.9 103.6 119.0
FB1 -24.0 -23.3 -22.7 -22.2 -21.8 -21.3 49.6 75.2 100.6 125.8 151.0 176.2
FC1 4.4 5.1 5.6 6.0 6.3 6.6 87.9 117.0 145.9 174.6 203.4 232.1
FD1 79.8 79.6 78.9 77.8 76.6 75.3 144.1 166.6 189.1 211.9 234.8 258.0
FA2 -256.8 -254.7 -252.8 -251.0 -249.3 -247.6 -205.6 -188.0 -171.0 -154.3 -138.0 -121.9
FB2 -228.6 -226.6 -224.8 -223.1 -221.4 -219.7 -163.2 -140.7 -118.7 -97.1 -75.7 -54.6
FC2 -196.5 -196.2 -196.1 -196.0 -196.0 -196.0 -107.3 -76.3 -45.3 -14.3 16.7 47.7
FA3 -201.4 -201.7 -202.2 -202.8 -203.5 -204.2 -148.6 -130.2 -111.6 -93.0 -74.2 -55.3
FB3 -171.2 -172.1 -173.3 -174.6 -176.1 -177.5 -96.9 -70.9 -44.5 -17.9 8.9 35.9
FBX -3,7 0,0 3,1 5,7 8,1 10,3 38,3 52,3 65,4 78,0 90,1 101,9
FA4 -145,0 -144,8 -145,0 -145,4 -145,9 -146,4 -111,7 -100,1 -88,5 -76,9 -65,2 -53,4
3.7 Final discussion The decomposition reactions show that the more methyl ligands that are added to the nitrogen, the
more thermodynamically favorable the reactions become. The adduct formation shows that the
reaction is more favorable for the mono- and dimethyl substituted nitrogen. But the following release
of methane or ethane is then less favorable as the number of methyl groups is increased. The
adsorptions of the first decomposition species show that thermodynamically the less methyl groups
that are present, the better adsorption.
When comparing the adsorption for the first-decomposition products with the further decomposition of
the same species, the adsorption is much more favorable than the unimolecular decomposition. The
bimolecular decomposition is also less favorable than adsorption of 𝑁𝐻2 at all temperatures, and
𝑁𝐻𝐶𝐻3 at lower CVD temperatures. For 𝑁(𝐶𝐻3)2 the bimolecular decomposition is more favorable
than adsorption at all temperatures. 𝑁𝐻2 is the most acceptable species to adsorb, while 𝑁(𝐶𝐻3)2 is
more likely to undergo furtherer decomposition in the presence of hydrogen radicals.
24
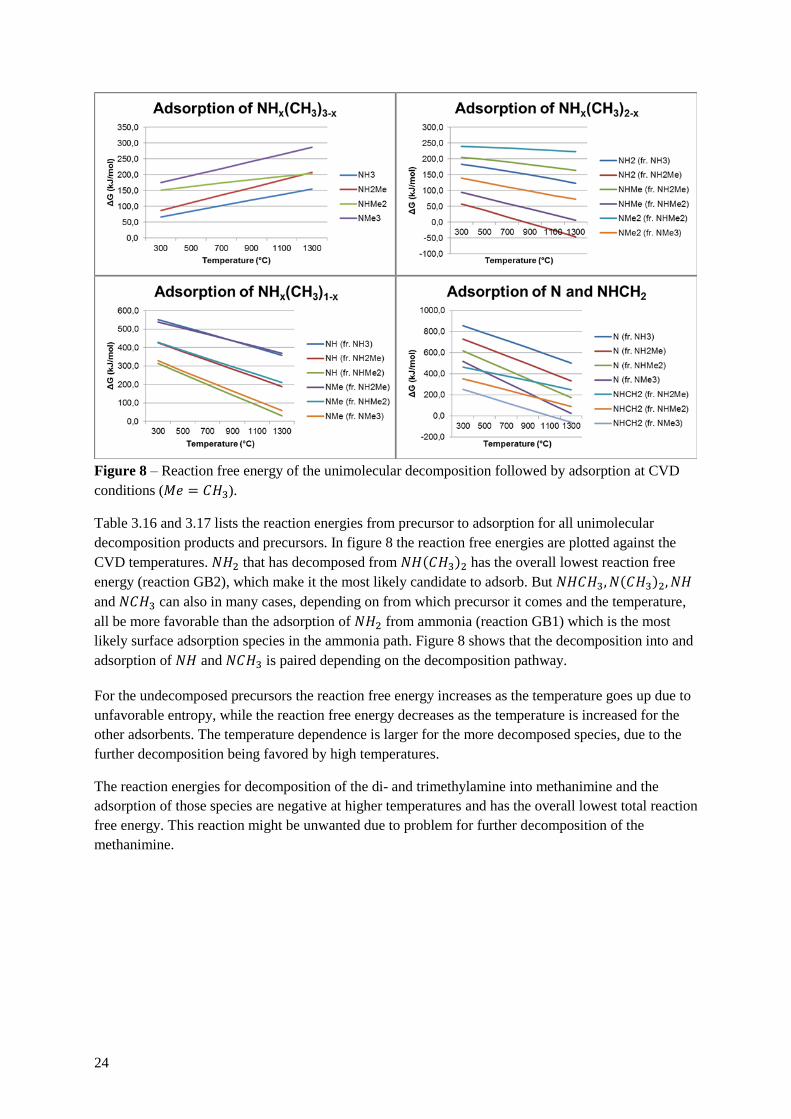
Figure 8 – Reaction free energy of the unimolecular decomposition followed by adsorption at CVD
conditions (𝑀𝑒 = 𝐶𝐻3).
Table 3.16 and 3.17 lists the reaction energies from precursor to adsorption for all unimolecular
decomposition products and precursors. In figure 8 the reaction free energies are plotted against the
CVD temperatures. 𝑁𝐻2 that has decomposed from 𝑁𝐻(𝐶𝐻3)2 has the overall lowest reaction free
energy (reaction GB2), which make it the most likely candidate to adsorb. But 𝑁𝐻𝐶𝐻3, 𝑁(𝐶𝐻3)2, 𝑁𝐻
and 𝑁𝐶𝐻3 can also in many cases, depending on from which precursor it comes and the temperature,
all be more favorable than the adsorption of 𝑁𝐻2 from ammonia (reaction GB1) which is the most
likely surface adsorption species in the ammonia path. Figure 8 shows that the decomposition into and
adsorption of 𝑁𝐻 and 𝑁𝐶𝐻3 is paired depending on the decomposition pathway.
For the undecomposed precursors the reaction free energy increases as the temperature goes up due to
unfavorable entropy, while the reaction free energy decreases as the temperature is increased for the
other adsorbents. The temperature dependence is larger for the more decomposed species, due to the
further decomposition being favored by high temperatures.
The reaction energies for decomposition of the di- and trimethylamine into methanimine and the
adsorption of those species are negative at higher temperatures and has the overall lowest total reaction
free energy. This reaction might be unwanted due to problem for further decomposition of the
methanimine.
25
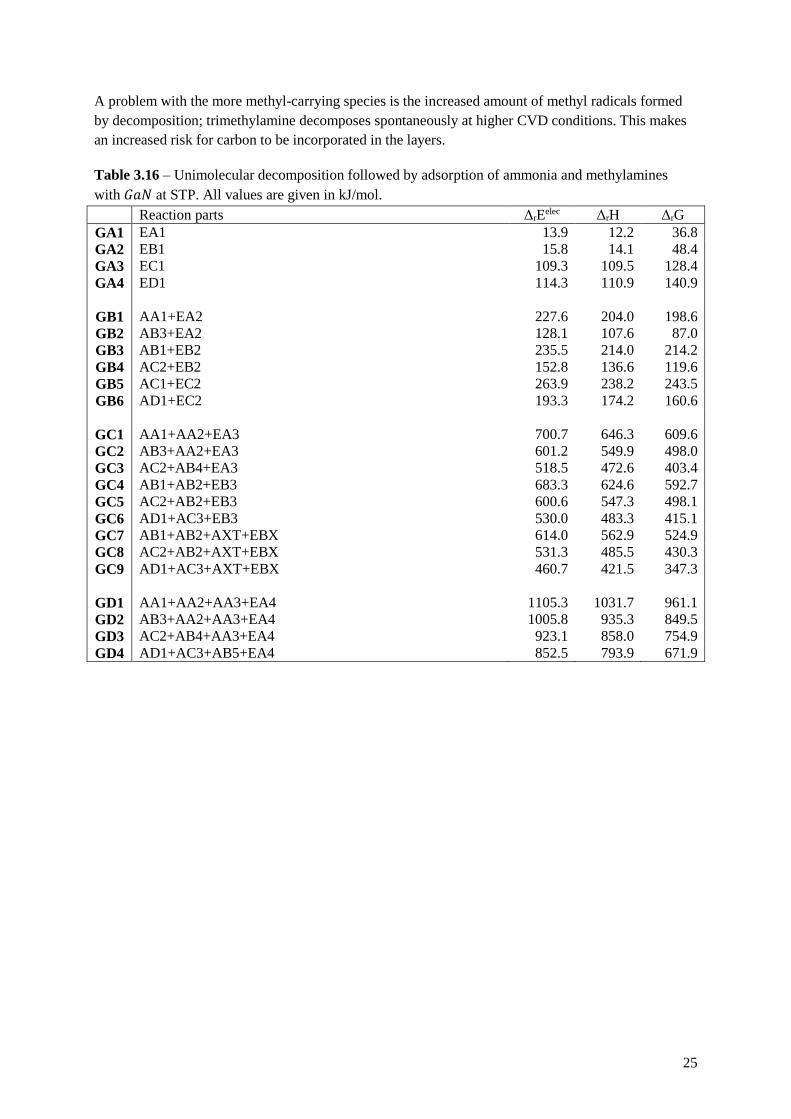
A problem with the more methyl-carrying species is the increased amount of methyl radicals formed
by decomposition; trimethylamine decomposes spontaneously at higher CVD conditions. This makes
an increased risk for carbon to be incorporated in the layers.
Table 3.16 – Unimolecular decomposition followed by adsorption of ammonia and methylamines
with 𝐺𝑎𝑁 at STP. All values are given in kJ/mol.
Reaction parts ΔrEelec ΔrH ΔrG
GA1 EA1 13.9 12.2 36.8
GA2 EB1 15.8 14.1 48.4
GA3 EC1 109.3 109.5 128.4
GA4 ED1 114.3 110.9 140.9
GB1 AA1+EA2 227.6 204.0 198.6
GB2 AB3+EA2 128.1 107.6 87.0
GB3 AB1+EB2 235.5 214.0 214.2
GB4 AC2+EB2 152.8 136.6 119.6
GB5 AC1+EC2 263.9 238.2 243.5
GB6 AD1+EC2 193.3 174.2 160.6
GC1 AA1+AA2+EA3 700.7 646.3 609.6
GC2 AB3+AA2+EA3 601.2 549.9 498.0
GC3 AC2+AB4+EA3 518.5 472.6 403.4
GC4 AB1+AB2+EB3 683.3 624.6 592.7
GC5 AC2+AB2+EB3 600.6 547.3 498.1
GC6 AD1+AC3+EB3 530.0 483.3 415.1
GC7 AB1+AB2+AXT+EBX 614.0 562.9 524.9
GC8 AC2+AB2+AXT+EBX 531.3 485.5 430.3
GC9 AD1+AC3+AXT+EBX 460.7 421.5 347.3
GD1 AA1+AA2+AA3+EA4 1105.3 1031.7 961.1
GD2 AB3+AA2+AA3+EA4 1005.8 935.3 849.5
GD3 AC2+AB4+AA3+EA4 923.1 858.0 754.9
GD4 AD1+AC3+AB5+EA4 852.5 793.9 671.9
26
Table 3.17 – Unimolecular decomposition followed by adsorption of ammonia and methylamines
with 𝐺𝑎𝑁 at CVD conditions, 300°C-1300°C at 50 mbar. All values are given in kJ/mol.
ΔrH ΔrG
300°C 500°C 700°C 900°C 1100°C 1300°C 300°C 500°C 700°C 900°C 1100°C 1300°C
GA1 13.7 14.6 15.3 15.9 16.5 17.0 66.1 84.2 102.2 119.9 137.6 155.2
GA2 16.1 17.1 17.8 18.4 18.9 19.4 86.5 110.9 135.1 159.2 183.2 207.0
GA3 115.4 118.7 121.4 123.9 126.1 128.2 150.7 162.5 173.5 184.0 194.1 203.8
GA4 111.9 111.7 111.0 110.0 108.8 107.5 175.2 197.3 219.5 241.9 264.5 287.2
GB1 211.5 216.1 220.0 223.2 226.1 228.5 183.7 173.3 161.7 149.4 136.6 123.4
GB2 114.7 117.3 118.5 118.8 118.5 117.8 57.9 37.7 16.9 -4.0 -24.9 -45.8
GB3 221.2 225.6 229.2 232.2 234.9 237.3 204.5 198.0 190.4 182.2 173.4 164.3
GB4 142.7 144.7 145.4 145.3 144.8 143.9 94.2 76.9 59.2 41.5 23.8 6.3
GB5 244.0 246.9 249.0 250.4 251.5 252.2 238.9 236.7 233.8 230.5 227.0 223.4
GB6 178.2 178.6 177.6 175.9 173.7 171.2 139.0 125.3 111.6 98.1 85.0 72.3
GC1 655.0 659.8 663.5 666.1 668.0 669.4 551.0 514.0 475.8 436.9 397.7 358.2
GC2 558.2 561.1 562.0 561.7 560.5 558.6 425.3 378.4 331.0 283.5 236.2 189.1
GC3 479.6 480.2 478.3 474.8 470.3 465.3 314.9 257.2 199.7 142.8 86.6 31.0
GC4 632.0 635.4 637.5 638.6 638.9 638.6 538.8 505.7 471.9 437.8 403.5 369.2
GC5 553.4 554.5 553.8 551.7 548.8 545.3 428.4 384.6 340.7 297.1 253.9 211.2
GC6 487.6 486.2 482.4 477.1 471.0 464.2 328.5 273.1 218.4 164.7 111.9 60.1
GC7 575.8 583.0 588.5 592.8 596.3 599.1 463.5 423.1 381.1 338.0 294.3 250.1
GC8 497.2 502.1 504.7 505.9 506.2 505.8 353.1 302.0 249.8 197.3 144.7 92.1
GC9 431.4 433.8 433.4 431.4 428.4 424.7 253.2 190.5 127.6 64.9 2.7 -59.1
GD1 1045.0 1052.7 1058.9 1063.8 1067.8 1071.0 855.1 787.6 718.3 647.8 576.5 504.7
GD2 948.3 954.0 957.4 959.4 960.2 960.2 729.4 652.0 573.5 494.4 415.0 335.6
GD3 869.7 873.1 873.7 872.5 870.1 866.9 619.0 530.9 442.2 353.7 265.4 177.5
GD4 803.8 804.8 802.4 797.9 792.3 785.9 519.1 419.5 320.0 221.3 123.4 26.4
4 Conclusions The conclusion for this study is that there is some difference between the different possible nitrogen
precursors from a thermodynamically point of view and that in many cases some of the methylamines
are more suited as nitrogen precursors, mainly due to the easier decomposition to more reactive
nitrogen species.
To obtain a more complete picture, the kinetics (e.g. transition states) needs to be studied before a
definite conclusion about the feasibility of methylamines as nitrogen precursors can be drawn.
5 Acknowledgements I want to thank my examiner Lars Ojamäe for all the help he has given me with the quantum chemistry
and computational methods during the course of this thesis. I also want to thank my supervisor Henrik
Pedersen for the idea for the thesis and the help he has given with the CVD-chemistry. Also thanks to
Per-Olof Kjell and Uno Carsson for allowing me to work in their office. My last thanks go to the
National Supercomputer Center (NSC) for the ability to use their computers for the computations of
the large cluster which would not have been possible to carry out in the timeframe otherwise.
27
6 References (1) Davis RF. Comprehensive Semiconductor Science and Technology; Organometallic Vapor Phase
Epitaxial Growth of Group III Nitrides. 2011:339-367.
(2) Stegmuller A, Rosenow P, Tonner R. A quantum chemical study on gas phase decomposition
pathways of triethylgallane (TEG, Ga(C2H5)3) and tert-butylphosphine (TBP, PH2(t-C4H9)) under
MOVPE conditions. Phys Chem Chem Phys 2014 Aug 28;16(32):17018-17029.
(3) Beaumont B, Gibart P, Faurie JP. Nitrogen precursors in metalorganic vapor phase epitaxy of
(Al,Ga)N. J Cryst Growth 1995;156(3):140-146.
(4) Kakanakova-Georgieva A, Gueorguiev GK, Stafström S, Hultman L, Janzén E. AlGaInN metal-
organic-chemical-vapor-deposition gas-phase chemistry in hydrogen and nitrogen diluents: First-
principles calculations. Chemical Physics Letters 2006;431(4-6):346-351.
(5) Sengupta D, Mazumder S, Kuykendall W, Lowry SA. Combined ab initio quantum chemistry and
computational fluid dynamics calculations for prediction of gallium nitride growth. J Cryst Growth
2005;279(3-4):369-382.
(6) Ruffenach S, Moret M, Briot O, Gil B. Recent advances in the MOVPE growth of indium nitride.
physica status solidi (a) 2010;207(1):9-18.
(7) Grimme S, Antony J, Ehrlich S, Krieg H. A consistent and accurate ab initio parametrization of
density functional dispersion correction (DFT-D) for the 94 elements H-Pu. J Chem Phys 2010 Apr
21;132(15):154104.
(8) Roothaan CCJ. New Developments in Molecular Orbital Theory. Reviews of Modern Physics
1951;23(2):69-89.
(9) Handy NC, Lee AM. The adiabatic approximation. Chemical Physics Letters 1996;252(5-6):425-
430.
(10) V. Fock. Näherungsmethode zur Lösung des quantenmechanischen Mehrkörperproblems. Z
Physik 1930;61(1-2):126-148.
(11) Møller C, Plesset MS. Note on an Approximation Treatment for Many-Electron Systems.
Physical Review 1934;46(7):618-622.
(12) Pople JA, Head-Gordon M, Raghavachari K. Quadratic configuration interaction. A general
technique for determining electron correlation energies. J Chem Phys 1987;87(10):5968-5975.
(13) Bartlett RJ, Purvis GD. Many-body perturbation theory, coupled-pair many-electron theory, and
the importance of quadruple excitations for the correlation problem. International Journal of Quantum
Chemistry 1978;14(5):561-581.
(14) Becke AD. A new mixing of Hartree–Fock and local density-functional theories. J Chem Phys
1993;98(2):1372.
(15) Becke AD. Density-functional exchange-energy approximation with correct asymptotic behavior.
Physical Review A 1988;38(6):3098-3100.
(16) Lee C, Yang W, Parr RG. Development of the Colle-Salvetti correlation-energy formula into a
functional of the electron density. Physical Review B 1988;37(2):785-789.
28
(17) Vosko SH, Wilk L, Nusair M. Accurate spin-dependent electron liquid correlation energies for
local spin density calculations: a critical analysis. Can J Phys 1980;58(8):1200-1211.
(18) Curtiss LA, Redfern PC, Raghavachari K. Gaussian-4 theory. J Chem Phys 2007 Feb
28;126(8):84-108.
(19) Gaussian 09, Revision D.01, M. J. Frisch, G. W. Trucks, H. B. Schlegel, G. E. Scuseria, M. A.
Robb, J. R. Cheeseman, G. Scalmani, V. Barone, B. Mennucci, G. A. Petersson, H. Nakatsuji, M.
Caricato, X. Li, H. P. Hratchian, A. F. Izmaylov, J. Bloino, G. Zheng, J. L. Sonnenberg, M. Hada, M.
Ehara, K. Toyota, R. Fukuda, J. Hasegawa, M. Ishida, T. Nakajima, Y. Honda, O. Kitao, H. Nakai, T.
Vreven, J. A. Montgomery, Jr., J. E. Peralta, F. Ogliaro, M. Bearpark, J. J. Heyd, E. Brothers, K. N.
Kudin, V. N. Staroverov, R. Kobayashi, J. Normand, K. Raghavachari, A. Rendell, J. C. Burant, S. S.
Iyengar, J. Tomasi, M. Cossi, N. Rega, J. M. Millam, M. Klene, J. E. Knox, J. B. Cross, V. Bakken, C.
Adamo, J. Jaramillo, R. Gomperts, R. E. Stratmann, O. Yazyev, A. J. Austin, R. Cammi, C. Pomelli, J.
W. Ochterski, R. L. Martin, K. Morokuma, V. G. Zakrzewski, G. A. Voth, P. Salvador, J. J.
Dannenberg, S. Dapprich, A. D. Daniels, Ö. Farkas, J. B. Foresman, J. V. Ortiz, J. Cioslowski, and D.
J. Fox, Gaussian, Inc., Wallingford CT, 2009.
(20) Chase MW,Jr. NIST-JANAF Themochemical Tables, Fourth Edition. J Phys Chem Ref Data,
Monograph 9 1998:1-1951.


![HOLOGRAPHY, QUANTUM GEOMETRY, AND QUANTUM INFORMATION THEORY · The emerging fields of quantum computation [22], quantum communication and quantum cryptography [23], quantum dense](https://img.pdfslide.net/doc/110x75/5ec76f6b603b2e345706bd5a/holography-quantum-geometry-and-quantum-information-theory-the-emerging-fields.jpg)