Embed Size (px)
Citation preview
Mem. S.A.It. Suppl. Vol. 9, 433c© SAIt 2006
Memorie della
Supplementi
Quantum Efficiency of Single Photon AvalancheDiode (SPAD)
S. Billotta, M. Belluso, G. Bonanno, P. Bruno, A. Cali, S. Scuderi, and M.C. Timpanaro
Istituto Nazionale di Astrofisica – Osservatorio Astrofisico di Catania, Via Santa Sofia 78,I-95123 Catania, Italy
Abstract. Observation of faint sources is affected by the chronic problem of photon lack.This problem becomes crucial when very short integration times are required (from microto milliseconds), as for example in observations of transient phenomena and adaptive opticsto correct in real time the atmospheric turbulence. To detect weak and fast transients, CCDsare inadequate because of the readout noise and the readout technique, while SPADs detec-tors benefiting from the photon counting operating mode, can perform much better. SPADdetectors are very innovative and will offer further opportunities in astrophysical observa-tions. The electro-optical characteristics of these devices are important to prove the appli-cability of the above cited scientific programs. At COLD laboratory of INAF OsservatorioAstrofisico of Catania several SPAD characterization campaigns have been carried-out. Tomeasure the SPAD QE two different methodologies have been used, one classic and one byusing a different approach. We will discuss both methodologies, the related equipment andthe obtained results.
Key words. Singol Photon Avalanche Diode, Photon counting, Device’s characterization.
1. Introduction
At COLD laboratory of INAF OsservatorioAstrofisico of Catania we have analyzed twomethods to measure the QE of SPAD devices:
1. using an integrating sphere that illuminatesuniformly the reference detector and theSPAD device;
2. using a reflection objective that focusesa beam of about 10 µm diameter on theSPAD.
The first method, that we will refer to as the”classic method”, relies on the accurate knowl-
Send offprint requests to: S. Billottae-mail: [email protected]
edge of the sensitive areas of both the referencedetector and the SPAD device. The secondmethod, using a spot smaller than the typicaldimension of a SPAD pixel should be largelyinsensitive to this problem.
2. Classic method
For QE measurements we realized an appro-priate mechanical structure where the detectorsare housed, in such way we are able to positionthe reference photodiode and the SPAD detec-tor at the same distance from the center of thesphere. To calculate the QE, we have used acalibrated (NIST traced) photodiode as refer-ence detector (to measure the flux of the in-

434 Billotta et al: QE of SPAD
Fig. 1. Image of the measurament apparatus
cident radiation on the SPAD), an integratingsphere to obtain a uniform illumination on thedetectors surfaces, an halogen lamp, and a setof interference filters to select the wavelength.We have measured the QE in the 350 - 1050 nmrange. Furthermore we investigated the QE de-pendency on the Over Voltages by measuringthe SPADs QE at two different values of OverVolatge that are 4V and 5V. Knowing the pho-todiode QE at different wavelength, the photo-diode area (1 cm2) and the SPAD area (3 x 10⁻⁴
mm2), the spad QE comes directly from theratio between the diode photocurrent and thecounts measured by the SPAD. Applying thepropagation error method we have also evalu-ated the QE standard deviation. In figure 2 theQE plot with the relative error bar of one of theSPAD devices at two different breakdown volt-ages is shown. The shape of the QE curve, that
Fig. 2. QE of a SPAD in the 350 - 1050 nm rangeat two different Over Voltages. Note the increase ofthe QE with the Vclamp.
Fig. 3. Box containing the motorized reflection ob-jective, fed by an fiber optic and with the mechanicalflange that can support the detectors for characteri-zation and the SPAD.
peaks at 550 nm, is typical for Silicon devices.It is also evident the QE increase respect to theOver Voltage (Vclamp).
3. Motorized reflection objectivemethod
The motorized reflection objective is essen-tially made by the objective itself, by a fiberoptic, and three motorized tables. The objec-tive is able to focus a beam with a FWHMof about 10-15 µm, depending on the pinholeand on the focus condition. The fiber optic isconnected to the COLD detector characteriza-tion system (Bonanno et al. 1996,for a detaileddescription) and feeds the objective. The three
Fig. 4. Image of the measurament apparatus
Billotta et al: QE of SPAD 435
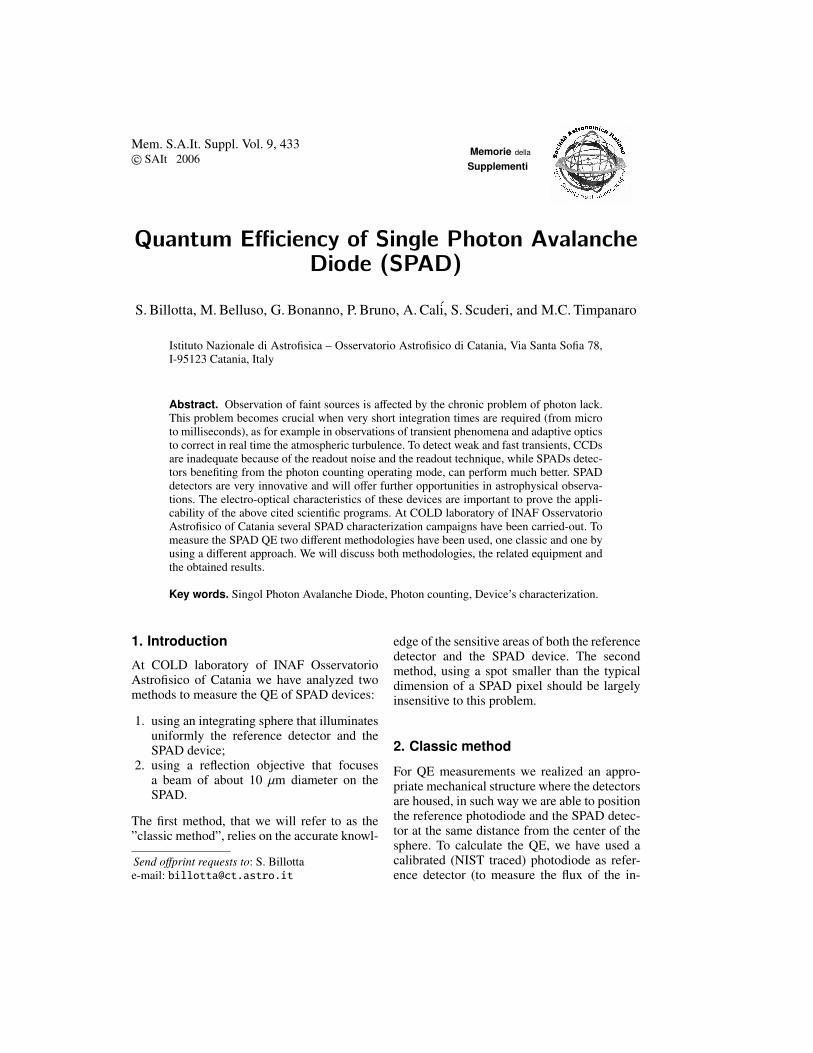
Fig. 5. Motorized reflection objective draft. Theoptic fiber is connected to one of the two camerasof the characterization system.
Fig. 6. Procedure to find the beam focus on theSPAD.
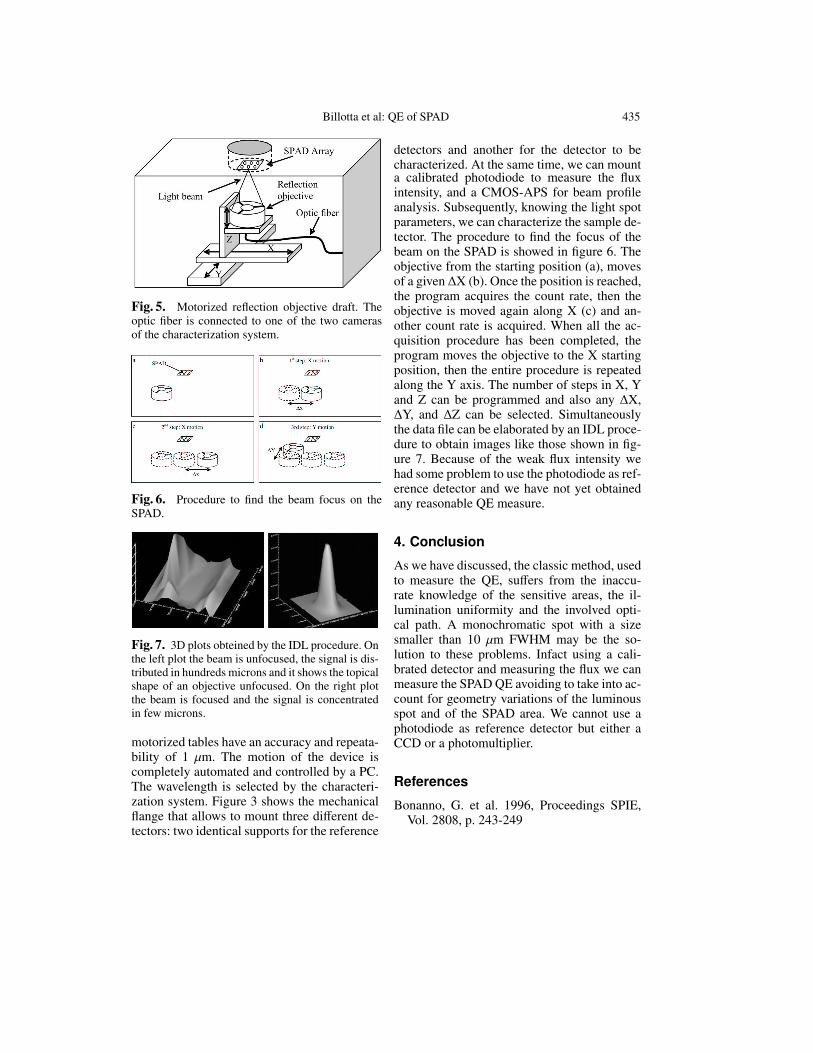
Fig. 7. 3D plots obteined by the IDL procedure. Onthe left plot the beam is unfocused, the signal is dis-tributed in hundreds microns and it shows the topicalshape of an objective unfocused. On the right plotthe beam is focused and the signal is concentratedin few microns.
motorized tables have an accuracy and repeata-bility of 1 µm. The motion of the device iscompletely automated and controlled by a PC.The wavelength is selected by the characteri-zation system. Figure 3 shows the mechanicalflange that allows to mount three different de-tectors: two identical supports for the reference
detectors and another for the detector to becharacterized. At the same time, we can mounta calibrated photodiode to measure the fluxintensity, and a CMOS-APS for beam profileanalysis. Subsequently, knowing the light spotparameters, we can characterize the sample de-tector. The procedure to find the focus of thebeam on the SPAD is showed in figure 6. Theobjective from the starting position (a), movesof a given ∆X (b). Once the position is reached,the program acquires the count rate, then theobjective is moved again along X (c) and an-other count rate is acquired. When all the ac-quisition procedure has been completed, theprogram moves the objective to the X startingposition, then the entire procedure is repeatedalong the Y axis. The number of steps in X, Yand Z can be programmed and also any ∆X,∆Y, and ∆Z can be selected. Simultaneouslythe data file can be elaborated by an IDL proce-dure to obtain images like those shown in fig-ure 7. Because of the weak flux intensity wehad some problem to use the photodiode as ref-erence detector and we have not yet obtainedany reasonable QE measure.
4. Conclusion
As we have discussed, the classic method, usedto measure the QE, suffers from the inaccu-rate knowledge of the sensitive areas, the il-lumination uniformity and the involved opti-cal path. A monochromatic spot with a sizesmaller than 10 µm FWHM may be the so-lution to these problems. Infact using a cali-brated detector and measuring the flux we canmeasure the SPAD QE avoiding to take into ac-count for geometry variations of the luminousspot and of the SPAD area. We cannot use aphotodiode as reference detector but either aCCD or a photomultiplier.
References
Bonanno, G. et al. 1996, Proceedings SPIE,Vol. 2808, p. 243-249