Embed Size (px)
Citation preview

Quantum super-oscillation of a single photon
Guanghui Yuan,1 Stefano Vezzoli,
1 Charles Altuzarra,
1,2 Edward T. F. Rogers,
3,4 Christophe
Couteau,1,2,5
Cesare Soci,1 and Nikolay I. Zheludev
1,3*
1TPI &
Centre for Disruptive Photonic Technologies, Nanyang Technological University,
637371, Singapore 2CINTRA, CNRS-NTU-Thales, CNRS UMI 3288, Singapore
3Optoelectronics Research Centre and Centre for Photonic Metamaterials, University of
Southampton, Southampton, UK 4Institute for Life Sciences, University of Southampton, Southampton, UK
5Laboratory for Nanotechnology, Instrumentation and Optics, ICD CNRS UMR 6281,
University of Technology of Troyes, Troyes, France
*Corresponding author: [email protected]
ABSTRACT: Super-oscillation is a counter-intuitive phenomenon describing localized fast
variations of functions and fields that happen at frequencies higher than the highest Fourier
component of their spectra. The physical implications of the effect have been studied in
information theory and optics of classical fields, and have been used in super-resolution
imaging. As a general phenomenon of wave dynamics, super-oscillations have also been
predicted to exist in quantum wavefunctions. Here we report the first experimental
demonstration of super-oscillatory behavior of a single quantum object, a photon. The super-
oscillatory behavior is demonstrated by tight localization of the photon wavefunction after
focusing with a dedicated slit mask designed to create an interference pattern with a sub-
wavelength hotspot. The observed hotspot of the single-photon wavefunction is demonstrably
smaller than the smallest hotspots that could have been created by the highest-frequency free-
space wavevectors available as the result of scattering from the mask.
I. INTRODUCTION
Super-oscillation, in its general form, is a mathematical phenomenon where a band-limited
function can oscillate much faster than its highest Fourier component over arbitrarily large
intervals [1-5]. The super-oscillation idea seems counterintuitive since it gives the illusion
that the Fourier components of the function exist outside the spectrum of the function [6].
The physical origins of super-oscillations were explained in different ways. For example Y.
Aharonov related super-oscillatory behavior in quantum systems to the pointer shifts in a
weak measurement where the final pointer wavefunction is a superposition of copies of initial
pointer state with shifted eigenvalues [7]. M. V. Berry argued that in the Wigner
representations of the local Fourier transform in the ‘phase space’, the Wigner function can
have both positive and negative values, which causes subtle cancellations in the Fourier
integration over all of the function [8].
The physical implications of super-oscillations have been studied extensively in various
fields of research including signal processing, optics, and quantum physics. In signal
processing, a super-oscillatory function emerging from a low-pass filter could generate
rapidly varying signals with frequency beyond the original bandwidth [9]. In optics, super-
oscillations result from a delicate near-destructive interference and exhibit rapid phase

variations (or singularities) and high local momenta in relatively low-intensity regions.
Moreover, the sub-wavelength structures in the optical field can propagate much longer than
the evanescent waves which are commonly regarded as the prerequisites for the sub-
wavelength details associated with high spatial frequencies [2,4,10]. This has been used to
beat the conventional diffraction limit and inspire far-field super-resolution [11-17].
Historically, a relevant concept of super-directive antenna arrays has been recognized as
early as the 1950s where the amplitude and phase of sources can be chosen to deliver the
electromagnetic energy into an arbitrarily narrow angle [18]. A Bessel beam with an optical
vortex of form expmE J kr imr , where m is the photon orbital angular momentum,
is another well-known example of super-oscillation. It can be decomposed into a set of plane
waves exp i k r with band-limited wavevector 0 2 /k k in free space, but the local
wavevector m
er
k r can exceed 0k [19]. The existence of super-oscillations in random
waves and speckle patterns has also been numerically studied [20,21]. Experimentally, optical
super-oscillations were first observed by interference from quasi-crystal arrays of nano-holes
[22] and since then have been produced deliberately through specific amplitude and phase
modulations using spatial light modulators [10,16], optical eigenmode methods [23,24],
optical pupil filters [25], binary amplitude masks [14, 26-29], and planar metamaterials [30].
In quantum physics, phenomena relevant to super-oscillations have also been intensely
discussed theoretically. For instance, Aharonov found that, although the initial boundary
conditions of a quantum mechanical system can be selected independently of the final
boundary conditions, it turns out that the weak measurement of a quantum system can have
expectation values much higher than the spectrum of the operator [31, 32]. To name a few
examples that can be derived from this observation, superluminal local velocities of photons
were identified in evanescent optical fields [33] and Klein–Gordon and Dirac waves [34];
spin-hall effect of photons can cause significant spatial beam displacement even if a slight
change of preselected polarization state is made [35]. However, no experimental
demonstration of super-oscillatory quantum behavior of photons has yet been performed.
In this work, we report the first experimental demonstration of a photon state where local
wavevectors of the photon’s wavefunction exceed its eigenvalues, while the wavefunction
itself is confined into a length scale smaller than that can be constructed with the allowable
wavevector eigenvalues. Generation of a super-oscillatory pattern by a binary mask is in
some ways analogous to Young’s classical experiment on diffraction from two parallel slits,
but with one important difference. Young’s diffraction pattern is observable with a single
photon as diffraction of the single photon wavefunction, thus brilliantly illustrating Dirac’s
observation that: “each photon interferes only with itself…[36]”. It is also a good illustration
of Bohr’s principle of complementarity as it often applied to optics: the observation of an
interference pattern and acquisition of which-way information are mutually exclusive.
However, in the double slit experiment the beams (of equal intensity and phase) forming the
intensity maximum at the diffraction pattern are indistinguishable to the detectors placed at
the centre of the diffraction pattern so we cannot know which way the photon came, even if
we block one of the slits. In contrast, the super-oscillatory pattern is formed by a precisely
tailored interference of multiple beams of different intensities and phases, breaking the
symmetry of the classical experiment. In our experiment, if we cover all but one of the slits at
the mask, in most cases the detector can distinguish whether light comes from a narrow or
wide slit, for instance. Therefore, a positive observation of super-oscillation with a single
photon would be a further proof of Bohr’s principle for multiple beam interference with non-

equal beams. Here Bohr’s wave-particle duality (complementarity) makes it impossible to
observe both the wave (interference) effects and to know which path (slit) the photon particle
actually took, even if this path can be easily distinguished in a separate experiment with the
same detector.
II. DESIGN AND EXPERIMENTAL ARRANGEMENT FOR CLASSICAL AND
QUANTUM SUPER-OSCILLATIONS
To achieve this, we perform an experiment similar to the classical Young’s double-slit
experiment shown in Fig. 1(a). However, instead of the double-slit mask we use a one-
dimensional binary super-oscillatory lens (SOL) consisting of multiple parallel slits designed
to construct classical super-oscillation interference pattern, as sketched in Fig. 1(b). We argue
that such lens is not the simple improvement over Young’s double-slit experiment, but
provide the availability for generation of a super-oscillatory state of a single photon. Indeed,
if Young’s experiment were performed with single photons, the wavefunction of a single
photon passing through the slit array is a superposition of all possible paths and generates
interference fringes. We expect that using the SOL, we also generate a super-oscillatory
interference pattern with a single photon. We investigate the properties of the field created by
the SOL in terms of spatial confinement, local momentum and energy flow distribution.
FIG. 1. Single photon regime of quantum interference. (a) Observation of quantum interference in the Young
double-slit experiment, (b) quantum super-oscillations with one-dimensional binary slit arrays (super-oscillatory
lens). (c) Electron micrograph of the mask.
Our experiments were performed both with a continuous laser and a source of heralded
photons at the wavelength of 810 nm. Figure 1(c) shows a scanning electron micrograph of
the SOL used to generate super-oscillations. It consists of 24 pairs of slits with different
widths milled in a 100 nm-thick gold film with a focused ion beam. The slit pattern is
designed to create a classical super-oscillatory hotspot by using the binary particle-swarm
optimization algorithm previously used in Refs. [13,14] (see Supplementary Material for the
design procedure of the SOL [37]). As the super-oscillatory patterns are created by
interference of propagating waves, they can be imaged and magnified by conventional high-
numerical aperture ( NA) optics. This substantially simplifies the experimental procedures: in
the classical regime the field patterns were imaged by a high-resolution sCMOS camera after
magnification. In the regime of single photon measurements the photon flux was insufficient
to use the camera, so the field distributions created by the SOL were characterized by point-
to-point scanning with an optical fiber, the other end of which was connected to a single
photon detector, as presented in Fig. 2. (See section VII for more details on the experimental
setup).

FIG. 2. Experimental arrangements for observing single photon quantum super-oscillations. The super-
oscillatory lens (SOL) is illuminated by a heralded single photon source based on spontaneous parametric down-
conversion in a beta-barium-borate crystal (BBO) that is pumped by a 405 nm laser and produces correlated
pairs of photons. One of the photons in the pair enters the SOL, while the other one is used as a trigger. The
magnified field pattern created by the SOL is registered by scanning an optical fiber probe attached to a single
photon detector. To ensure single photon regime of operation, the coincidence counts between the signal and
reference channels are recorded. The same experiment arrangement is used for classical diffraction experiment
with an external continuous laser operating at a wavelength of 810nm, while diffraction pattern is recorded by a
high-resolution sCMOS camera.
III. THEORETICALLY PREDICTED AND CLASSICALLY MEASURED
DIFFRACTION PATTERNS
We first compare our experimental results from classical laser interference with the
theoretical diffraction patterns calculated by the vectorial angular spectrum method (Fig. 3(a),
see section VII and Supplementary Material for details [37]) and rigorous full-wave Maxwell
simulation using finite-difference time-domain (FDTD) technique (Fig. 3(b)). Here only the
transverse electric fields are presented since the longitudinal component merely contributes to
the transverse energy flow and is not registered in the experiment [38]. The two simulations
agree very well, predicting a classical super-oscillatory hotspot with full width at half
maximum (FWHM) of 0.4 at the distance z =10 µm away from the SOL, which is
undeniably smaller than what an ideal cylindrical lens of the same size can achieve (see
discussion below). For the polarization orthogonal to the slits the analytical model gives
slightly more intense sidebands than numerical modelling, which should be attributed to the
neglect of the multiple scattering by the former. The energy concentration ratio inside the
central hotspot is found to be 7.5% and 9% for the parallel and perpendicular polarization
respectively (see Supplementary Material for the calculation details [37]).
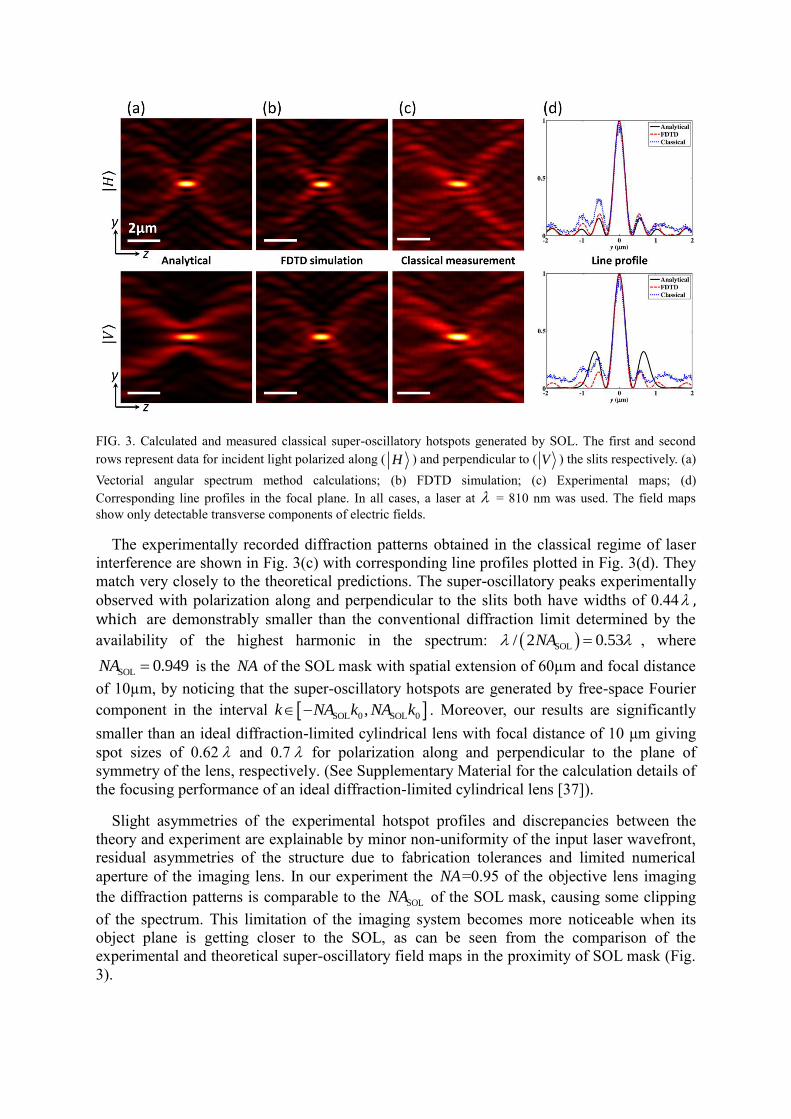
FIG. 3. Calculated and measured classical super-oscillatory hotspots generated by SOL. The first and second
rows represent data for incident light polarized along ( H ) and perpendicular to ( V ) the slits respectively. (a)
Vectorial angular spectrum method calculations; (b) FDTD simulation; (c) Experimental maps; (d)
Corresponding line profiles in the focal plane. In all cases, a laser at = 810 nm was used. The field maps
show only detectable transverse components of electric fields.
The experimentally recorded diffraction patterns obtained in the classical regime of laser
interference are shown in Fig. 3(c) with corresponding line profiles plotted in Fig. 3(d). They
match very closely to the theoretical predictions. The super-oscillatory peaks experimentally
observed with polarization along and perpendicular to the slits both have widths of 0.44 , which are demonstrably smaller than the conventional diffraction limit determined by the
availability of the highest harmonic in the spectrum: SOL/ 2 0.53NA , where
SOL 0.949NA is the NA of the SOL mask with spatial extension of 60µm and focal distance
of 10µm, by noticing that the super-oscillatory hotspots are generated by free-space Fourier
component in the interval SOL 0 SOL 0,k NA k NA k . Moreover, our results are significantly
smaller than an ideal diffraction-limited cylindrical lens with focal distance of 10 μm giving
spot sizes of 0.62 and 0.7 for polarization along and perpendicular to the plane of
symmetry of the lens, respectively. (See Supplementary Material for the calculation details of
the focusing performance of an ideal diffraction-limited cylindrical lens [37]).
Slight asymmetries of the experimental hotspot profiles and discrepancies between the
theory and experiment are explainable by minor non-uniformity of the input laser wavefront,
residual asymmetries of the structure due to fabrication tolerances and limited numerical
aperture of the imaging lens. In our experiment the NA=0.95 of the objective lens imaging
the diffraction patterns is comparable to the SOLNA of the SOL mask, causing some clipping
of the spectrum. This limitation of the imaging system becomes more noticeable when its
object plane is getting closer to the SOL, as can be seen from the comparison of the
experimental and theoretical super-oscillatory field maps in the proximity of SOL mask (Fig.
3).

IV. OBSERVATION OF SINGLE-PHOTON SUPER-OSCILLATIONS
The same optical experiment is then repeated with a source of heralded single photons.
Pairs of correlated single photons at 810 nm are generated by type-II spontaneous parametric
down-conversion (SPDC) in a BBO nonlinear crystal, pumped by a CW 405 nm laser [39].
Coincidence counts between the photons detected after the SOL and the ones collected in the
second channel of the SPDC are used in order to ensure the presence of one and only one
photon in the experimental setup at a time. To confirm the single photon character of the
heralded source, we used a Hanbury Brown-Twiss setup to measure the second-order
correlation function of the source. It was found to be (2) 0 0.088 0.029g , i.e. much
smaller than 0.5, and thus is sufficient to claim essentially single-photon measurement regime
[40]. (See Supplementary Material for measurement details of (2) 0g [37]).
FIG. 4. Super-oscillatory hotspot of a single photon. (a) H and (b) V polarizations. The error bars are
defined as the square root of the observed coincidence counts. Classical measurement data show slightly smaller
FWHM of the hotspot than that of single-photon measurement. The diffraction-limited hotspots given by an
ideal cylindrical lens with the same focal length (10 μm) are also shown for intuitive comparison with the super-
oscillatory focusing.
When measuring the super-oscillatory localization of the photon wavefunction we scanned
across the hotspot a number of times using a multi-mode optical fiber. In order to improve the
signal-to-noise ratio, we averaged the data from 19 measurements. Figure 4 gives detailed
measurement results. According to this, the super-oscillatory wavefunction of the single
photon is confined in the hotspot measured (0.49±0.02) and (0.48±0.03) respectively for
polarizations along and perpendicular to the slits. This is slightly bigger than the calculated
size of the hotspot (0.4 ) and its measured value in the classical regime with laser source
(0.44 ). This raw result needs to be corrected by taking into account the instrumental
limitations of the scanning set-up using fiber probe of finite aperture with core size of 62.5
μm. Thus, the profile recorded by the detector is a convolution of the hotspot and the fiber
aperture function, which increases the spot size by 6.8% (with account of magnification
provided by the objective lens, see Supplementary Material for the details on the effect of
finite fiber aperture to the hotspot size [37]). Taking this into account, the super-oscillatory
wavefunction of the single photon at the focus of SOL is measured to have a FWHM of
(0.46±0.02) and (0.45±0.03) for polarizations along and perpendicular to the slits
respectively.
It is noted that, in principle, the size of the hotspot can be squeezed into arbitrarily small,
but the detectable feature size is limited by realistic experimental conditions. As reducing the
hotspot size, the energy confined in the hotspot region decreases exponentially, and the weak-

signal detection will be significantly constrained by the noise characteristic of the
instruments, for example the dark current in a CCD camera and the dark counts in a single-
photon detector. Moreover, the limited pixel size of the detector also sets a trade-off between
the achievable resolution and signal level: as magnifying the image of a super-oscillatory
field or shrinking the aperture size of a detector (for example fiber aperture of a single-photon
detector), the collection efficiency will be decreased accordingly which requires longer
integration time to achieve a reasonable signal level, especially for the single photon
experiment.
Summarizing the experiment we can conclude that we have observed super-oscillatory
behavior of a single photon based on the following facts:
a) within the experimental accuracy, the SOL generates hotspots of the same size in both
a classical interference experiment with coherent laser illumination and in the single
photon regime;
b) the hotspots generated by the SOL are demonstrably smaller than hotspot that could
have been created by ideal cylindrical lens of the same size and focal distance;
c) the hotspots generated by the SOL are demonstrably smaller than the smallest
hotspots that could have been created by highest values of the free-space wavevectors
available as the result of scattering on the mask.
V. LOCAL WAVEVECTOR AND ENERGY BACKFLOW NEAR SUPER-
OSILLATORY HOTSPOTS
Super-oscillation can be predicted either by observation of sub-diffraction localization or
by the presence of high values of local wavevectors in the field distribution. To show that the
SOL mask used in our experiments indeed generates anomalies of the wavevector behavior,
in Fig. 5(a) we plot the phase distributions near the hotspots, where the phase of vector
fields is presented accordingly to the original definition from Pancharatnam and Berry [41].
Here the local wavevectors are evaluated as the phase gradient localk . Lineouts at z=10
µm are shown in Fig. 5(b): there are several super-oscillatory regions where 0localk k , as
marked with grey shading. There the phase oscillates up to 20 times faster than allowed by
the maximum free-space Fourier component. The super-oscillation yield and maximized
energy concentration ratio might be able to be optimized in a given spatial range of interest
using the methods given in [42,43]. A detailed evaluation of localk along propagation direction
can be found in Supplementary Material [37]. In the phase map we also observe several
singular points of undefined local phase. The phase along a line encircling these points
contains a complete phase cycle from to . Such phase singularities often accompany
super-oscillations, and squeeze the optical fields into a sub-wavelength scale [44] (see Fig.
5(c)).
We also observed retro-propagation of the energy flow near super-oscillatory regions, as
inferred from Fig. 5(d) that correspond to the enlarged area of highlighted purple and green
circles in Figs. 5(a) and 5(c). For instance, the enlarged areas embraced by the purple and
green circles contains center-type ‘C’ and saddle-type ‘S’ singular points. At these points, the
magnetic field and electric field of the wave vanish, respectively, and in between them energy
flows in the opposite direction to the incident wave. Such ‘backflow’ of the Poynting vector
has been previously observed in the proximity of plasmonic nanoparticles [45] and is an
important feature for producing super-oscillation where negative eigenvalues of the local
momentum quantum operator are required [46].

FIG. 5. Phase, local wavevector and Poynting vectors near the super-oscillatory hotspots. The first and second
rows represent data for incident light polarized along and perpendicular to the slits respectively. (a) Phase
profiles where the area with singular points are highlighted by purple and green circles, (b) localk at z=10 μm
where the super-oscillatory regions are shaded in grey and the red-dashed lines define 0localk k , (c)
amplitude of Poynting vectors S . (d) Normalized Poynting vectors in the purple and green circles clearly show
the existence of center-type (‘C’) and saddle-type (‘S’) singular points and backward energy flow (negative
zS ).
VI. DISCUSSION
In summary, we have provided the first experimental demonstration of quantum super-
oscillations in the single photon regime by using a specifically designed slit mask. High
localization of the photon wavefunction with sub-diffraction hotspots of FWHM ~0.45
have been seen for both orthogonal polarization eigenstates better than the conventional
diffraction limit of 0.53 . Meanwhile, the local momentum of the photon surpasses the
expectation values restricted by the highest Fourier component of its band-limited spectrum.
This counter-intuitive phenomenon has been demonstrated for the first time with a single
photon. It illustrates that super-oscillations indeed result from the interference of a single
photon wavefunction with itself, rather than from multi-photon interference. We anticipate
our work to experimentally stimulate more fundamental studies in quantum physics, such as
compression of photon’s wavefunction and energy ‘black-flow’ for quantum particles, and
find various applications in quantum information, such as the generation of high transverse
momentum states of light, quantum super-resolution imaging and quantum lithography [47].
VII. METHODS
A. Vectorial angular spectrum calculations of diffraction patterns and Poynting vectors
For polarization along the slit ( H ), the electric field at a propagation distance of z behind
the SOL (assume to be at z=0) can be expressed as (see Supplementary Material for
derivation details [37])

2
1 2 2
0, 2, , , ,0 exp
y
x y tx H
t
kE x y z FT E k k i k k z
k
(1)
where 0 , ,0x yE k k denotes the angular spectrum of the binary SOL at z=0, 2 2
t x yk k k
denotes the transverse wavevector and is a real number since we only consider the
propagating components, 1 ,FT f denotes the 2D inverse Fourier transform of the
function ,f . For polarization perpendicular to the slit ( V ), the electric fields are
calculated as
22
1 2 2
0, 2 2, , , ,0 1 exp
ytx y ty V
t
kkE x y z FT E k k i k k z
k k
(2)
2
1 2 2
0, 2, , , ,0 1 exp
ytx y tz V
kkE x y z FT E k k i k k z
k k
(3)
The Poynting vectors can thus be derived using the following expression
* *
*
* *
1Re 0, , ,
1 2Re
12Re 0, , ,
2
x z x y
z x y x
E H E H for H
S E H
E H E H for V
(4)
where the asterisk denotes the complex conjugation.
B. Fabrication of the SOL
The SOL is fabricated by focused ion beam (Helios 650, 30kV, 24pA) milling through a
100 nm-thick gold film on an ITO glass substrate using a thermal evaporator (Oerlikon
Univex 250) with a deposition rate of 0.2Å/s. A 5 nm-thick chromium film was deposited in-
between as an adhesion layer. The width deviation of the fabricated sample from the original
design (integer multiples of unit size ∆r=400 nm) for each slit is less than 20 nm (~ /40),
which is confirmed by SEM imaging at high magnification.
C. Experimental setup for classical and single-photon measurements
For classical measurement, a linearly polarized continuous fiber laser source (Thorlabs
MCLS1, 4-channel laser source) at wavelength of 810 nm is collimated and then illuminates
the SOL from the substrate side. We used a high-magnification high-NA objective (Nikon
CFI LU Plan APO EPI 150X, NA=0.95) to collect the diffracted electric fields which are
subsequently imaged by a high-resolution sCMOS camera (Andor Neo, 2560*2160, pixel
size 6.5 μm). Such magnification is essential due to the limited pixel size of the camera, but it
will not undermine the super-oscillatory fields which are actually formed by interference of
propagating waves and thus can be mapped into the far-field and directly imaged by a
conventional optical imaging system.
For the single-photon experiment, a 405 nm laser (LuxX® 405-300 diode laser) is used as
the pump for producing a heralded single photon source. After passing through the beta-
barium-borate (BBO) crystal at phase matching angles, correlated photon pairs are generated

via spontaneous parametric down-conversion (SPDC) process and then split into two arms by
using a prism mirror: one arm is directed onto the SOL with a beam size of ~70 μm
(FWHM), the other arm is coupled into an optical fiber and a delay line is used to count the
coincidence of single photon. A cylindrical lens is used to focus the field in the x direction,
and its long axis is precisely aligned to be perpendicular to the slit orientations so as to
increase the intensity but not change the field profiles in the parallel direction and thus not
distort the super-oscillatory fields. This is achieved by using a motorized precision rotation
stage with angular resolution of 25arcsec. In order to capture the field distributions in the
propagation cross-section (yz plane), we use a single-axis piezo stage (Nanoflex/Thorlabs) for
z-scanning of the SOL and for y scanning by a multi-mode fiber (MMF, aperture size~62.5
μm) mounted on a long-range single-axis motorized translation stage (PT1/M-Z8/Thorlabs)
and connected to a single-photon detector (Excelitas, dark count rate <250cps). The scanning
step sizes along y and z directions are 30 μm and 10 nm respectively. The raster scanning is
controlled by Labview programming and the integration time at each pixel is 3 s. The actual
magnification factor in the y dimension is calibrated to be 306, which corresponds to an
effective scanning step size of 98 nm.
Before doing the real single-photon experiment, we first attenuate the 810 nm CW laser,
used in the previous classical measurements, down to the few photon regime using neutral
density filters. This was done in order to precisely align the cylindrical lens and single-photon
detector, and thus to maximize the transmission and collection efficiency of each optical
element in the setup (see Supplementary Material for the estimation of overall efficiency
[37]). After the location of the hotspot is confirmed, we simply switch to the heralded single-
photon source to scan along the y direction which is done by removing the flipping mirror in
the optical path.
1. Y. Aharonov, J. Anandan, S. Popescu, and L. Vaidman, Superpositions of time evolutions of a quantum
system and a quantum time-translation machine, Phys. Rev. Lett. 64, 2965 (1990).
2. M. V. Berry, ‘Faster than Fourier’ in ‘Quantum coherence and reality: in celebration of the 60th
birthday of
Yakir Aharonov’, World Scientific, Singapore, 55 (1994).
3. A. Kempf, and P. J. S. G. Ferreira, Unusual properties of superoscillating particles, J. Phys. A: Math. Gen.
37, 12067 (2004).
4. M. V. Berry, and S. Popescu, Evolution of quantum superoscillations and optical superresolution without
evanescent waves, J. Phys. A: Math. Gen. 39, 6965 (2006).
5. P. J. S. G. Ferreira, A. Kempf, and M. J. C. S. Reis, Construction of Aharonov-Berry’s super-oscillations, J.
Phy. A: Math. Theor. 40, 5141 (2007).
6. M. V. Berry, and P. Shukla, Pointer supershifts and superoscillations in weak measurements, J. Phy. A:
Math. Theor. 45, 015301 (2012).
7. Y. Aharonov, F. Colombo, I. Sabadini, D. C. Struppa, and J. Tollaksen, Some mathematical properties of
superoscillations, J. Phy. A: Math. Theor. 44, 365304 (2011).
8. M. V. Berry, and N. Moiseyev, Superoscillations and supershifts in phase space: Wigner and Husimi
function interpretations, J. Phy. A: Math. Theor. 47, 315203 (2014).
9. P. J. S. G. Ferreira, and A. Kempf, Superoscillations: faster than the Nyquist rate, IEEE Trans. Signal
Processing 54, 3732 (2006).
10. F. M. Huang, and N. I. Zheludev, Super-resolution without evanescent waves, Nano Lett. 9, 1249 (2009).
11. N. I. Zheludev, What diffraction limit? Nat. Mater. 7, 420 (2008).
12. E. T. F. Rogers, and N. I. Zheludev, Optical super-oscillations: sub-wavelength light focusing and super-
resolution imaging, J. Opt. 15, 094008 (2013).
13. E. T. F. Rogers, J. Lindberg, T. Roy, S. Savo, J. E. Chad, M. R. Dennis, and N. I. Zheludev, A super-
oscillatory lens optical microscope for subwavelength imaging, Nat. Mater. 11, 432 (2013).
14. G. H. Yuan, E. T. F. Rogers, T. Roy, G. Adamo, Z. X. Shen, and N. I. Zheludev, Planar super-oscillatory
lens for sub-diffraction circular polarization optical needles at violet wavelengths, Sci. Rep. 4, 6333 (2014).
15. J. Lindberg, Mathematical concepts of optical superresolution, J. Opt. 14, 083001 (2012).

16. A. M. H. Wong, and G. V. Eleftheriades, An optical super-microscope for far-field, real-time imaging
beyond the diffraction limit, Sci. Rep. 3, 1715 (2013).
17. A. M. H. Wong, and G. V. Eleftheriades, Advances in imaging beyond the diffraction limit, IEEE Photon. J.
4, 586 (2012).
18. di F. G. Torraldo, Super-gain antennas and optical resolving power, Nuovo Cimento Suppl. 9, 426 (1952).
19. M. V. Berry, A note on superoscillations associated with Bessel beams, J. Opt. 15, 044006 (2013).
20. M. V. Berry, and M. R. Dennis, Natural superoscillations in monochromatic waves in D dimensions, J. Phy.
A: Math. Theor. 42, 022003 (2009).
21. M. R. Dennis, A. C. Hamilton, and J. Courtial, Superoscillations in speckle patterns, Opt. Lett. 33, 2976
(2008).
22. F. M. Huang, N. I., Zheludev, Y. Chen, F. de Abajo, Focusing of light by a nanohole array, Appl. Phys. Lett.
90, 091119 (2007).
23. J. Baumgartl, S. Kosmeier, M. Mazilu, E. T. F. Rogers, N. I. Zheludev, and K. Dholakia, Far field
subwavelength focusing using optical eigenmodes, Appl. Phys. Lett. 98, 181109 (2011).
24. K. Piché, J. Leach, A. S. Johnson, J. Z. Salvail, M. I. Kobobov, and R. W. Boyd, Experimental realization of
optical eigenmode super-resolution, Opt. Express 20, 26424 (2012).
25. R. K. Amineh, and G. V. Eleftheriades, 2D and 3D sub-diffraction source imaging with a super-oscillatory
filter, Opt. Express 21, 8142 (2013).
26. F. M. Huang, Y. F. Chen, F. J. G. de Abajo, and N. I. Zheludev, Optical super-resolution through super-
oscillations, J. Opt. A: Pure Appl. Opt. 9, S285 (2007).
27. F. M. Huang, T. S. Kao, V. A. Fedotov, Y. Chen, and N. I. Zheludev, Nanohole array as a lens, Nano. Lett.
8, 2469 (2008).
28. E. T. F. Rogers, S. Savo, J. Lindberg, T. Roy, M. R. Dennis, and N. I. Zheludev, Super-oscillatory lens
optical needles, Appl. Phys. Lett. 102, 031108 (2013).
29. T. Roy, E. T. F. Rogers, G. H. Yuan, and N. I. Zheludev, Point spread function of the optical needle super-
oscillatory lens, Appl. Phys. Lett. 104, 231109 (2014).
30. T. Roy, E. T. F. Rogers, and N. I. Zheludev, Sub-wavelength focusing meta-lens, Opt. Express 21, 7577
(2013).
31. Y. Aharonov, D. Z. Albert, and L. Vaidman, How the result of a measurement of a component of the spin of
a spin-1/2 particle can turn out to be 100, Phys. Rev. Lett. 60, 1351 (1988).
32. M. V. Berry, and P. Shukla, Typical weak and superweak values, J. Phys. A: Math. Theor. 43, 354024
(2010).
33. J. M. Vigoureux, L. D’Hooge, and D. Van Labeke, Quantization of evanescent electromagnetic waves:
Momentum of the electromagnetic field very close to a dielectric medium, Phys. Rev. A 21, 347 (1980).
34. M. V. Berry, Superluminal speeds for relativistic random waves, J. Phys. A: Math. Theor. 45, 185308
(2012).
35. O. Hosten, and P. Kwiat, Observation of the spin hall effect of light via weak measurements, Science 319,
787 (2008).
36. P. A. M. Dirac, The Principles of Quantum Mechanics (The Clarendon Press, Oxford, 4th edition, 1958).
37. See Supplemental Material for details on the super-oscillatory lens optimization, analytical calculation of
diffraction characteristics, second-order correlation function measurement, evolution dynamics of local
wavevector, and estimation of optical efficiency.
38. T. Grosjean, and D. Courjon, Polarization filtering induced by imaging system: effect on image structure,
Phy. Rev. E 67, 046611 (2003).
39. C. Kurtsiefer, M. Oberparleiter, and H. Weinfurter, High-efficiency entangled photon pair collection in type-
II parametric fluorescence, Phy. Rev. A 64, 023802 (2001).
40. E. Bocquillon, C. Couteau, M. Razavi, R. Laflamme, and G. Weihs, Coherence measures for heralded
single-photon sources, Phy. Rev. A 79, 035801 (2009).
41. E. Katzav, and M. Schwartz, Yield-optimized superoscillations, IEEE Trans. Signal Process. 61, 3113
(2013).
42. D. G. Lee, and P. J. S. G. Ferreira, Superoscillations with optimum energy concentration, IEEE Trans.
Signal Process. 62, 4857 (2014).
43. M. V. Berry, The adiabatic phase and Pancharatnam’s phase for polarized light, J. Mod. Opt. 34, 1401
(1987).
44. M. R. Dennis, K. O’Holleran, and M. J. Padgett, Singular optics: optical vortices and polarization
singularities, Prog. Optics 53, 293 (2009).
45. M. V. Bashevoy, V. A. Fedotov, and N. I. Zheludev, Optical whirlpool on an absorbing metallic
nanoparticle, Opt. Express 13, 8372 (2005).
46. M. V. Berry, Quantum backflow, negative kinetic energy, and optical retro-propagation, J. Phys. A: Math.
Theor. 43, 415302 (2010).

47. A. N. Boto, P. Kok, D. S. Abrams, S. L. Braunstein, C. P. Williams, and J. P. Dowling, Quantum
interferometric optical lithography: Exploiting entanglement to beat the diffraction limit, Phys. Rev. Lett.
85, 2733 (2000).
ACKNOWLEDGMENTS
The authors are grateful for the financial support from the Advanced Optics in Engineering
Programme from the Agency for Science, Technology and Research of Singapore with Grant
number 122-360-0009, Singapore Ministry of Education Academic Research Fund Tier 3
with Grant number MOE2011-T3-1-005, and the UK Engineering and Physical Sciences
Research Council with Grant numbers EP/F040644/1 and EP/G060363/1, the Royal Society
of London, and the University of Southampton Enterprise Fund. C. C. would like to
acknowledge partial funding of the Labex ACTION program (Contract No. ANR-11-LABX-
0001-01).
The data from this paper can be obtained from the University of Southampton ePrints
research repository: http://dx.doi.org/10.5258/SOTON/376636

Supplementary Material for
Quantum super-oscillation of a single photon
Guanghui Yuan,1 Stefano Vezzoli,
1 Charles Altuzarra,
1,2 Edward T. F. Rogers,
3,4 Christophe Couteau,
1,2,5 Cesare
Soci,1 and Nikolay I. Zheludev
1,3*
1TPI & Centre for Disruptive Photonic Technologies, Nanyang Technological University, Singapore 637371, Singapore
2CINTRA, CNRS-NTU-Thales, CNRS UMI 3288, Singapore
3Optoelectronics Research Centre and Centre for Photonic Metamaterials, University of Southampton, Southampton, UK
4Institute for Life Sciences, University of Southampton, Southampton, UK
5Laboratory for Nanotechnology, Instrumentation and Optics, ICD CNRS UMR 6281, University of Technology of Troyes,
Troyes, France *[email protected]
Contents:
1. Super-oscillatory lens design and optimization
2. Vectorial angular spectrum method to calculate the diffraction patterns
3. Energy concentration ratio inside the hotspots
4. Focusing performance of an ideal diffraction-limited cylindrical lens
5. Second-order correlation function measurement
6. Effect of limited aperture of single-photon detectors
7. Evolution dynamics of 𝑘𝑙𝑜𝑐𝑎𝑙 along propagation
8. Estimation of the optical efficiency of the system

1. Super-oscillatory lens design and optimization
The design of the super-oscillatory lens (SOL) is based on the powerful binary particle swarm
optimization (BPSO) algorithm [1], which is a computational method that optimizes a problem with regard
to a given merit function using a population of ‘particles’ in the N-dimensional search space. The y
coordinate perpendicular to the slit (assumed to be orientated along x) is divided into N=75 pairs of slits,
each of which has either unit or zero transmittance, and the BPSO algorithm searches for the best
arrangement of opaque and transparent slits. The total mask size is 60 μm along both x and y directions and
the slit width along y is ∆r=400 nm. The target function to describe the intensity profiles of electric fields
near focus is defined as exp (−𝑦2
𝑎2) exp [−(𝑧−𝑧0)
2
𝑏2 ], where 𝑧0 is the axial central position of the focal spot,
𝑎 =𝐹𝑊𝐻𝑀
2√𝑙𝑛2, 𝑏 =
𝐷𝑂𝐹
2√𝑙𝑛2, FWHM is the full-width half maximum of transverse spot size and DOF is the depth
of focus. In the optimization, we used a swarm of 75 particles and 500 iterations. The optimum mask
design is achieved at minimal variance between the actual intensity distribution and the merit function, as
given in Figs. S1a,b respectively. The detailed parameters are given in Table S1. For an intuitive
comparison, the original design and the scanning electron micrograph of the fabricated SOL are shown in
Figs. S1c,d, where 24 pairs of slits with different widths are obtained.
Table S1. Design parameters of the sample
𝑧0 (µm) FWHM(λ) DOF (µm) Binary transmittance (starting from y center outward)
10 0.4 1 010010000011001100110110110101100101011010101101000110011010111111010101010
Fig. S1. a, actual intensity distribution of the optimized SOL (horizontal: 8 μm to 12 μm, vertical: -1 μm to 1 μm). b, defined
merit function in the same region. c, SOL design: the black and white regions denote zero and unit transmittance
respectively. d, SEM image of the fabricated SOL. The displayed areas are 64 μm by 64 μm.
2. Vectorial angular spectrum method to calculate the diffraction patterns
According to [2], the full electric field solutions of the Maxwell equation after passing through the SOL
for the polarizations along (|𝐻⟩) and perpendicular to (|𝑉⟩) the slits can be respectively expressed as
�⃑⃑� |𝐻⟩(𝑥, 𝑦, 𝑧) = 𝐸𝑥,|𝐻⟩(𝑥, 𝑦, 𝑧)�⃑� 𝑥 + 𝐸𝑦,|𝐻⟩(𝑥, 𝑦, 𝑧)�⃑� 𝑦 (1a)
�⃑⃑� |𝑉⟩(𝑥, 𝑦, 𝑧) = 𝐸𝑥,|𝑉⟩(𝑥, 𝑦, 𝑧)�⃑� 𝑥 + 𝐸𝑦,|𝑉⟩(𝑥, 𝑦, 𝑧)�⃑� 𝑦 + 𝐸𝑧,|𝑉⟩(𝑥, 𝑦, 𝑧)�⃑� 𝑧 (1b)
where

𝐸𝑥,|𝐻⟩(𝑥, 𝑦, 𝑧) = ∬�̃�0 sin2 𝜑 exp[𝑖(𝑘𝑡 cos𝜑 𝑥 + 𝑘𝑡 sin𝜑 𝑦 + 𝑘𝑧𝑧)]𝑘𝑡𝑑𝑘𝑡𝑑𝜑
= ∬�̃�0𝑘𝑦
2
𝑘𝑡2 exp[𝑖(𝑘𝑥𝑥 + 𝑘𝑦𝑦 + 𝑘𝑧𝑧)]𝑑𝑘𝑥𝑑𝑘𝑦
= 𝐹𝑇−1 {�̃�0(𝑘𝑥, 𝑘𝑦, 0) ×𝑘𝑦
2
𝑘𝑡2 × exp (𝑖√𝑘2 − 𝑘𝑡
2𝑧)} (2a)
𝐸𝑦,|𝐻⟩(𝑥, 𝑦, 𝑧) = −∬ �̃�0 sin𝜑 cos𝜑 exp[𝑖(𝑘𝑡 cos𝜑 𝑥 + 𝑘𝑡 sin𝜑 𝑦 + 𝑘𝑧𝑧)]𝑘𝑡𝑑𝑘𝑡𝑑𝜑
= −∬ �̃�0𝑘𝑥𝑘𝑦
𝑘𝑡2 exp[𝑖(𝑘𝑥𝑥 + 𝑘𝑦𝑦 + 𝑘𝑧𝑧)]𝑑𝑘𝑥𝑑𝑘𝑦
= −𝐹𝑇−1 {�̃�0(𝑘𝑥 , 𝑘𝑦, 0) ×𝑘𝑥𝑘𝑦
𝑘𝑡2 × exp(𝑖√𝑘2 − 𝑘𝑡
2𝑧)} (2b)
where �̃�0(𝑘𝑥, 𝑘𝑦, 0) = 𝐹𝑇{𝐸0(𝑥, 𝑦, 0)} is the angular spectrum of the SOL located at 𝑧 = 0, 𝐹𝑇 and 𝐹𝑇−1
denote the Fourier transform and inverse Fourier transform respectively, 𝑘𝑡 = √𝑘𝑥2 + 𝑘𝑦
2 is the transverse
wavevector, 𝜑 is the polar angle, 𝑘𝑥 = 𝑘𝑡 cos𝜑, 𝑘𝑦 = 𝑘𝑡 sin𝜑, and 𝑘𝑧 = √𝑘2 − 𝑘𝑡2.
The calculated electric field components at the focal plane (𝑧 = 10 𝜇𝑚) are shown in Fig. S2, seen from
which the 𝐸𝑦,|𝐻⟩ component can be neglected since its amplitude is relatively small while 𝐸𝑥,|𝐻⟩ is
dominant and there are only slight distortions near the left/right edges of the horizontal slits.
Fig. S2. Calculated electric field distributions at 𝑧 = 10 𝜇𝑚 under |𝐻⟩ excitation. a, 𝐸𝑥,|𝐻⟩ shows uniform intensity profile
along the slit except at the left/right edges. b, 𝐸𝑦,|𝐻⟩ is small, inferred from the colorbar. There is no 𝐸𝑧 component for |𝐻⟩
polarization.
In the similar way, for |𝑉⟩ polarization,
𝐸𝑦,|𝑉⟩(𝑥, 𝑦, 𝑧) = 𝐹𝑇−1 {�̃�0(𝑘𝑥, 𝑘𝑦, 0) × (1 −𝑘𝑡
2
𝑘2)𝑘𝑦
2
𝑘𝑡2 × exp(𝑖√𝑘2 − 𝑘𝑡
2𝑧)} (3a)
𝐸𝑥,|𝑉⟩(𝑥, 𝑦, 𝑧) = 𝐹𝑇−1 {�̃�0(𝑘𝑥 , 𝑘𝑦, 0) × (1 −𝑘𝑡
2
𝑘2)𝑘𝑥𝑘𝑦
𝑘𝑡2 × exp (𝑖√𝑘2 − 𝑘𝑡
2𝑧)} (3b)
𝐸𝑧,|𝑉⟩(𝑥, 𝑦, 𝑧) = −𝐹𝑇−1 {�̃�0(𝑘𝑥, 𝑘𝑦, 0) × √1 −𝑘𝑡
2
𝑘2
𝑘𝑦
𝑘× exp(𝑖√𝑘2 − 𝑘𝑡
2𝑧)} (3c)
The corresponding electric field components at the focal plane (𝑧 = 10 𝜇𝑚) are shown in Fig. S3.
Similarly, the 𝐸𝑥,|𝑉⟩ component is relatively small and negligible while 𝐸𝑦,|𝑉⟩ and 𝐸𝑧,|𝑉⟩ are dominant and
only have slight distortions near the slit edges. 𝐸𝑧,|𝑉⟩ appears owing to the projection of electric field into
the axial direction under high-numerical-aperture focusing, and it has a double-peak and zero axial

intensity due to destructive interference. However, this longitudinal component will not be detected by the
CCD camera or single-photon detector due to polarization filtering [3].
Fig. S3. Electric field distributions at 𝑧 = 10 𝜇𝑚 under |𝑉⟩ polarization excitation. a, 𝐸𝑥,|𝑉⟩ is relatively small and can be
neglected. b, 𝐸𝑦,|𝑉⟩ shows uniform intensity profile along the slits. c, 𝐸𝑧,|𝑉⟩ is null at 𝑦 = 0 due to destructive interference
and has double-peak sidebands after high-NA focusing.
It is also worth noting that the plasmonic effect, that is the contribution from surface plasmon polaritons
(SPPs), can also be neglected since the smallest slit width here is around half-wavelength which results in
relatively low excitation efficiency of SPPs. This is confirmed by FDTD simulations where we use the
perfect electrical conductor (PEC) boundary conditions, which do not support surface plasmons since
electric fields cannot penetrate into them, to replace the real gold films and we obtain similar diffraction
patterns shown in Fig. S4a,b for the case of |𝐻⟩ polarization. From a line profile comparison at 𝑧 = 10 𝜇𝑚
as shown in Fig. S4c, the two boundary conditions give the same peak positions and similar relative
intensities of the hotspot and the sidebands. For |𝐻⟩ , surface plasmons cannot be generated due to
momentum mismatching. We can conclude that surface plasmons will not dominate the far-field diffraction
patterns in our experiment.
Fig. S4. Electric field intensity profiles under |𝑉⟩ polarization using: a, gold film and b, perfect electrical conductor as the
mask material. c, Direct line profile comparison between a and b at 𝑧 = 10 𝜇𝑚.

3. Energy concentration ratio inside the hotspots
Using rigorous FDTD simulation, we have calculated the optical power distributions at the focal plane
(z=10𝜇 m) for both |𝐻⟩ and |𝑉⟩ polarizations, as shown in the Fig. S5. The energy concentration ratio
inside the central super-oscillatory hotspot is found to be 7.5% and 9% for |𝐻⟩ and |𝑉⟩ polarization
respectively. As the size of the hotspot is reduced further, less energy will be concentrated in the hotspot.
The energy that can be channeled into the super-oscillatory region decreases exponentially with the
number of super-oscillations.
Fig. S5. Normalized optical power distributions at the focal plane: a, |𝐻⟩ and b, |𝑉⟩ polarization. The results are obtained
from FDTD simulation.
For real applications, there are already several approaches to cope with the non-superoscillatory part of
the signal (more specifically the sidebands). For example in super-resolution imaging: a) the hotspot
generator can be designed and optimized to increase the intensity of the hotspot and lower the background
sidebands. The peak electric field intensity of the hotspot |𝐸|2 in this work is 3 times higher than that of
the sidebands. The intensity ratio between the highest sidebands and the hotspots is 0.26 and 0.31 for |𝐻⟩
and |𝑉⟩ polarizations respectively. This allows that most of the signals originate from the central hotspot,
especially in nonlinear optical imaging where the signal would be possibly proportional to |𝐸|4; b) the
field of view defined as the separation between the two nearest sidebands can be optimized and increased
to an extent that only the signal coming from the hotspot will be recorded by a high-magnification
objective in a confocal detection scheme which substantially reduces the scattering from the sidebands and
diminishes the image distortion.

4. Focusing performance of an ideal diffraction-limited cylindrical lens
Fig. S6. Focusing properties of an ideal cylindrical lens with phase factor of exp(−𝑖𝑘0𝑦2 𝑓⁄ ) which generates diffraction-
limited hotspots with peak located at z=10 μm: a, |𝐻⟩ and b, |𝑉⟩ polarizations. The intensity profiles along the white lines in
y and z direction are shown as yellow and blue curves respectively, where the value of 𝑓 is adjusted to be 𝑓𝑇𝐸 = 11.9 𝜇𝑚 and
𝑓𝑇𝑀 = 11.6 𝜇𝑚 so as to achieve the focal length exactly as 10 μm. These patterns are calculated using vectorial angular
spectrum method, showing hotspots with FWHM of 0.62λ and 0.7λ for |𝐻⟩ and |𝑉⟩ polarizations respectively.
5. Second-order correlation function measurement
In this section we summarize the procedure for measuring the intensity auto-correlation function of the
heralded single photon source, based on SPDC.
First of all, we recall the definition of the auto-correlation function for quantized fields where the
intensity is measured at time t=0 and after a delay t= τ:
g(2)(τ) =⟨�̂�−(0)�̂�−(𝜏)�̂�+(𝜏)�̂�+(0)⟩
⟨�̂�−(0)�̂�+(0)⟩2 (4)
For Fock states |n> (eigenstates of the intensity), the auto-correlation function at zero delay g(2)
(0) can
be easily calculated to be:
g(2)(0) = 1 −1
𝑛 (5)
Therefore, a measurement of g(2)
(0) between 0 and 0.5 represents an experimental characterization of a true
single photon source.
g(2)
(τ) measurements are usually performed with a Hanbury Brown-Twiss (HBT) interferometer setup,
as sketched in Fig. S7: the light is sent through a 50:50 beam splitter and the intensities in the two channels
are measured by two detectors and electronically correlated. When single photon counters are used as
detectors, the intensities are replaced by number of counts N1,2 and the product of intensities by the
coincidence counts N12 detected within a window Δ (of typically few ns):
g(2)(0) =𝑁12
𝑁1𝑁2 (6)

An SPDC source requires a heralded g(2)
(0) measurement. Indeed, the non-linear down-conversion of a
pump photon into two twin photons (called signal and idler) is a completely stochastic process. As
illustrated in Fig. S7, the idler photon is used to gate the arrival of the signal on the other channel. Without the
‘heralding’ of the photons, the statistics of the light arriving at the detectors would be that of a thermal field. In
this case the auto-correlation function can be written as:
g(2)(0) =𝑃12𝑔
𝑃1𝑔𝑃2𝑔 (7)
Where Pig is the conditional probability of detecting one photon on channel i, given the presence of a
photon on channel g, for instance P1g = N1g /Ng . The final expression is:
g(2)(0) =𝑁12𝑔𝑁𝑔
𝑁1𝑔𝑁2𝑔 (8)
thus requires the measurements of single count rate on the idler Ng (~5.23×10⁶ counts in a 20-second time
window), coincidences between the idler and the signal on the two channels of the HBT setup N1g
(~5.1×10⁴) and N2g (~2.1×10
4), and triple coincidences N12g (~18).
Fig. S7. Schematics of the setup for heralded g(2)(0) measurement. The counts on the idler Ng are used to herald the presence
of photons in the signal beam inside the Hanbury Brown-Twiss (HBT) setup.
6. Effect of limited aperture of single-photon detectors
The effective pixel size of our single-photon detectors is 62.5 μm, which is given by the core size of the
multimode fiber for collecting the photons. This large aperture size improves the collection efficiency but
will limit the resolution. In fact, the signals we captured in the experiment are the convolution of the real
signals (superoscillatory wavefunctions of the single photons) and aperture function of the multimode
fiber. This will enlarge the super-oscillatory spot size. In our case, the 62.5 μm aperture shows an
increment of 6.8% to the FWHM of the theoretically calculated hotspot while a 30 μm aperture would only
give an increment of 1.6%, as shown in Fig. S8. This explains why the spot size in the single-photon
experiment is larger than the theoretical prediction.
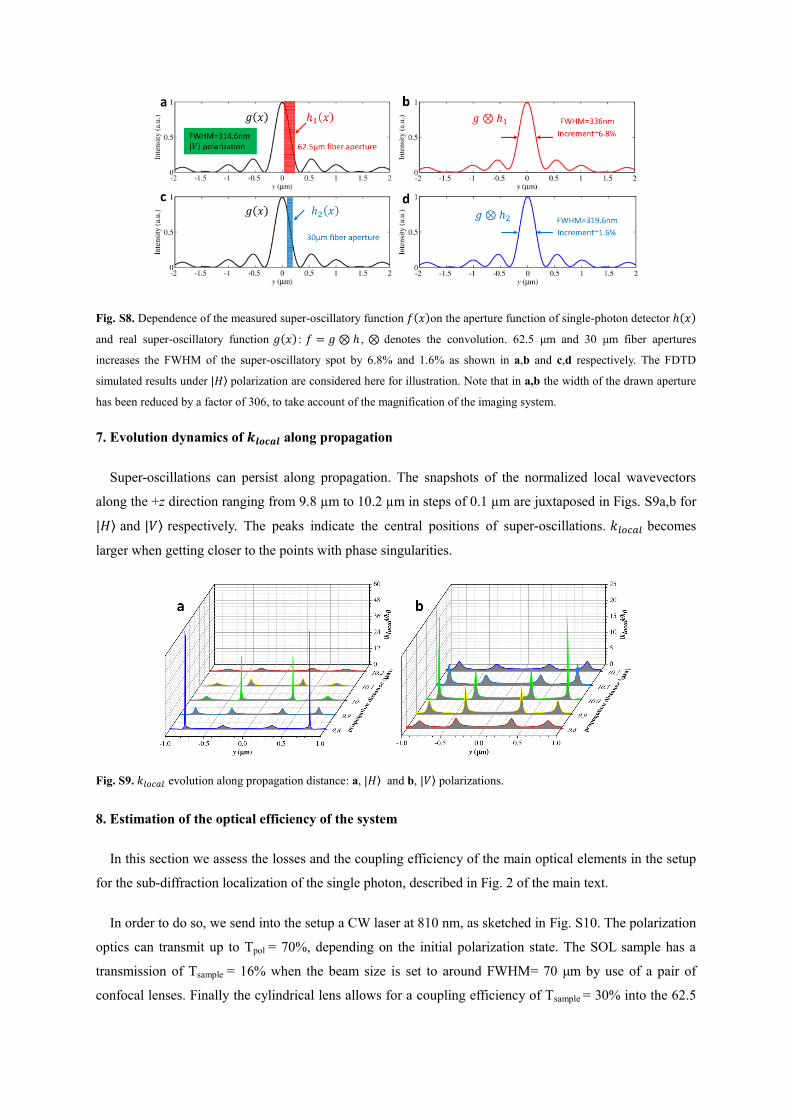
Fig. S8. Dependence of the measured super-oscillatory function 𝑓(𝑥)on the aperture function of single-photon detector ℎ(𝑥)
and real super-oscillatory function 𝑔(𝑥) : 𝑓 = 𝑔 ⊗ ℎ , ⊗ denotes the convolution. 62.5 μm and 30 μm fiber apertures
increases the FWHM of the super-oscillatory spot by 6.8% and 1.6% as shown in a,b and c,d respectively. The FDTD
simulated results under |𝐻⟩ polarization are considered here for illustration. Note that in a,b the width of the drawn aperture
has been reduced by a factor of 306, to take account of the magnification of the imaging system.
7. Evolution dynamics of 𝒌𝒍𝒐𝒄𝒂𝒍 along propagation
Super-oscillations can persist along propagation. The snapshots of the normalized local wavevectors
along the +z direction ranging from 9.8 µm to 10.2 µm in steps of 0.1 µm are juxtaposed in Figs. S9a,b for
|𝐻⟩ and |𝑉⟩ respectively. The peaks indicate the central positions of super-oscillations. 𝑘𝑙𝑜𝑐𝑎𝑙 becomes
larger when getting closer to the points with phase singularities.
Fig. S9. 𝑘𝑙𝑜𝑐𝑎𝑙 evolution along propagation distance: a, |𝐻⟩ and b, |𝑉⟩ polarizations.
8. Estimation of the optical efficiency of the system
In this section we assess the losses and the coupling efficiency of the main optical elements in the setup
for the sub-diffraction localization of the single photon, described in Fig. 2 of the main text.
In order to do so, we send into the setup a CW laser at 810 nm, as sketched in Fig. S10. The polarization
optics can transmit up to Tpol = 70%, depending on the initial polarization state. The SOL sample has a
transmission of Tsample = 16% when the beam size is set to around FWHM= 70 μm by use of a pair of
confocal lenses. Finally the cylindrical lens allows for a coupling efficiency of Tsample = 30% into the 62.5

μm multi-mode fiber. The ratio between the intensity measured at the maximum of the main peak and the
total intensity collected by a full scan along the y direction is Nmax / Ntot = 3.4 %.
Fig. S10. Schematics of the setup for single photon sub-wavelength localization measurement, showing the losses and
coupling efficiency of the main optical elements, measured with an 810 nm CW laser.
Starting with a rate of single counts of about N ≈ 100000 counts/s in the signal beam generated by
down-conversion and coupled into a single mode fiber, we would expect N ≈ 120 counts/s at the maximum
of the of the super-oscillatory peak, after the SOL and the coupling into the multi-mode fiber. We typically
measure rates between 60 and 100 counts/s. Corresponding coincidence counts are about 15-25 counts/s,
consistent with a detection efficiency of ~ 20% on the idler channel.
References
1. N. Jin, and Y. Rahmat-Samii, Advances in particle swarm optimization for antenna designs: Real-
number, binary, single-objective and multiobjective implementations, IEEE Trans. Antenn. Propag. 55,
556 (2007).
2. R. Martínez-Herrero, M. M. Mejías, S. Bosch, and A. Carnicer, Vectorial structure of nonparaxial
electromagnetic beams, J. Opt. Soc. Am. A 18, 1678 (2001).
3. T. Grosjean, and D. Courjon, Polarization filtering induced by imaging system: effect on image
structure, Phy. Rev. E 67, 046611 (2003).