Embed Size (px)
Citation preview
ANALYSIS BASED ON NEW YORK FED CONSUMER CREDIT PANEL/EQUIFAX DATA
Q U A R T E R L Y R E P O R T O N
HOUSEHOLD DEBT AND CREDIT
2 0 2 0 : Q 4 ( R E L E A S E D F E B R U A R Y 2 0 2 1 )
FEDERAL RESERVE BANK of NEW YORKR E S E A R C H A N D S TAT I S T I C S G R O U P
CENTER FOR MICROECONOMIC DATAW W W . N E W Y O R K F E D . O R G / M I C R O E C O N O M I C S
Household Debt and Credit Developments in 2020Q41
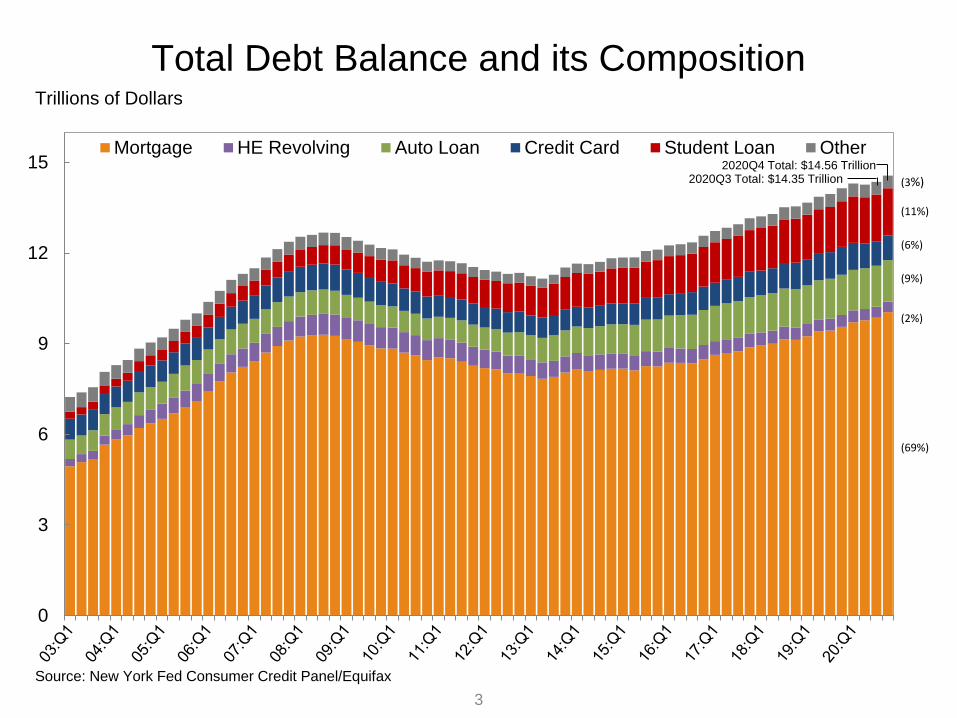
Aggregate household debt balances increased by $206 billion in the fourth quarter of 2020, a 1.4% rise from 2020Q3, and
now stand at $14.56 trillion. Balances are $414 billion higher than at the end of 2019.
Balances
Mortgage balances shown on consumer credit reports surpassed $10 trillion in the 4th quarter, and stood at $10.04 trillion at
the end of December, a $182 billion increase from 2020Q3. Balances on home equity lines of credit (HELOC) saw a $13 billion
decline, the 16th consecutive decrease since 2016Q4, bringing the outstanding balance to $349 billion. Credit card balances increased
in the fourth quarter, by $12 billion, a modest seasonal increase following the sharp $76 billion contraction in the second quarter and
$10 billion decrease in the third. Credit card balances are $108 billion lower than they had been at the end of 2019, the largest yearly
decline seen since the series begins in 1999, consistent with continued weakness in consumer spending as well as paydowns by card
holders. Auto loan balances increased by $14 billion in the fourth quarter. Student loan balances increased by $9 billion. In total, non-
housing balances increased by $37 billion, but remain $31 billion below the 2019Q4 levels.
Originations
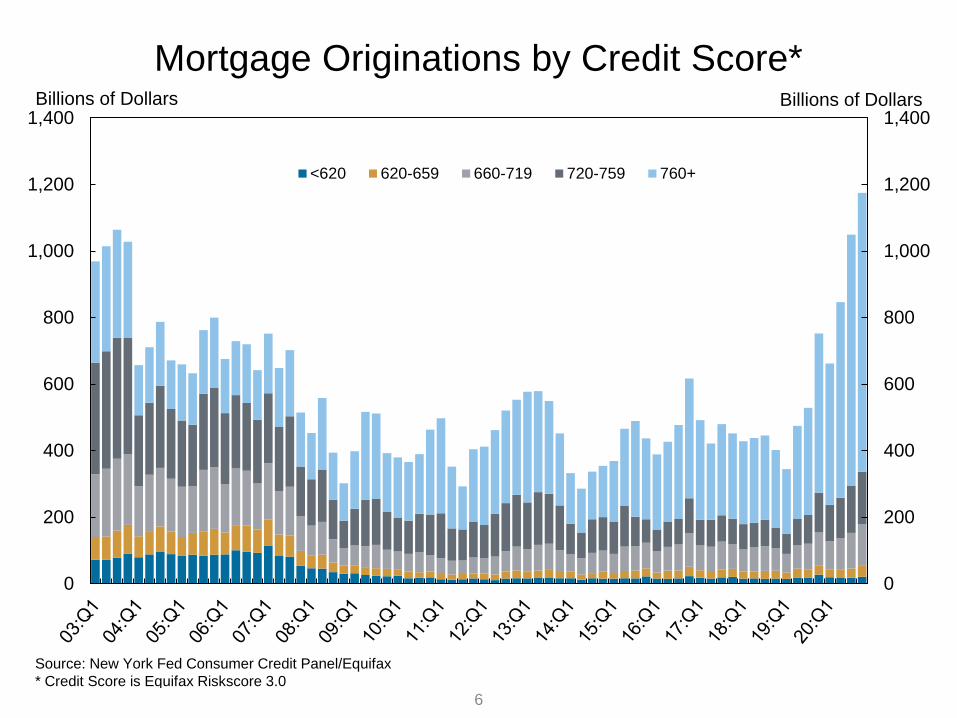
New extensions of credit were substantial in 2020Q4, with a record high level of newly originated mortgages and auto loans.
Mortgage originations, measured as appearances of new mortgage balances on consumer credit reports and which include refinances,
were at $1.2 trillion, surpassing in nominal terms the volumes seen during the historic refinance boom in 2003Q3. Auto loan
originations, which includes both loans and leases, were down slightly from the record high seen in 2020Q3 but were at the second
highest level for the series, at $162 billion. In contrast, both HELOC and credit cards saw declines in aggregate credit limits.
Aggregate credit limits on credit cards declined by $10 billion, continuing the declines of $31 billion in the third quarter and $53
billion during the second. Aggregate credit limits on HELOC accounts declined by $14 billion.
Median mortgage origination credit scores remained roughly stable at a high level, with the median credit score of newly
originated mortgages at 786, reflecting a high share of refinances. The median credit score on newly originated auto loans increased,
from 712 to 717.
Delinquency & Public Records
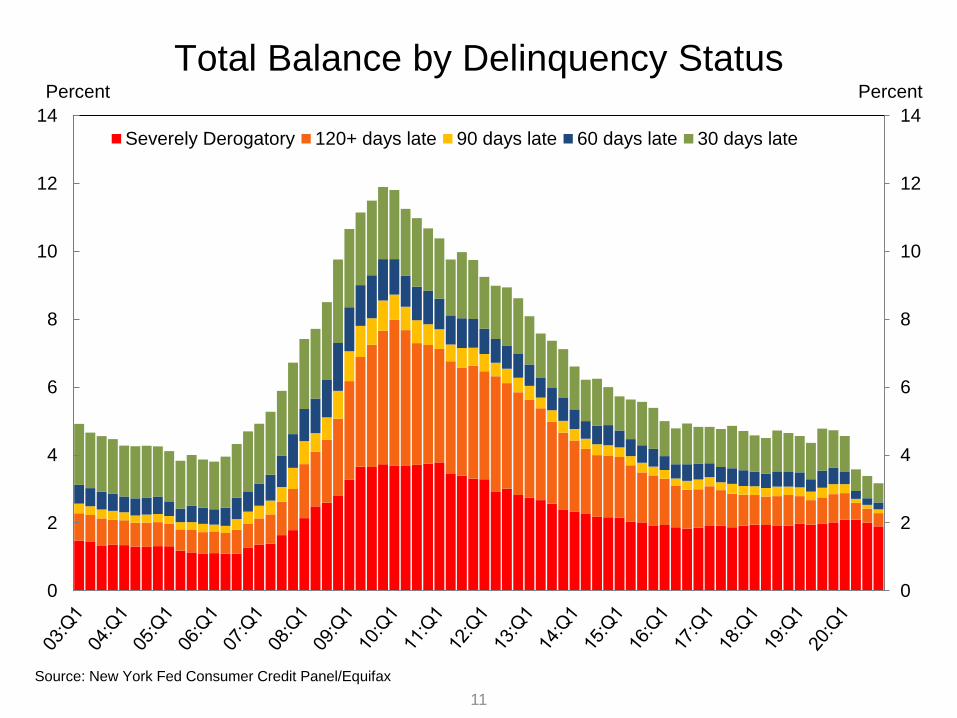
Aggregate delinquency rates have continued to decline in the fourth quarter and continuing what was seen in the second and
third, reflecting an uptake in forbearances (provided by both the CARES Act and voluntarily offered by lenders), which protect
borrowers’ credit records from the reporting of skipped or deferred payments. As of late December, 3.2% of outstanding debt was in
some stage of delinquency, a 0.2 percentage point decrease from the third quarter, and 1.6 percentage points lower than the rate
observed in the fourth quarter of 2019 and before the Covid pandemic hit the United States. Of the $462 billion of debt that is
delinquent, $349 billion is seriously delinquent (at least 90 days late or “severely derogatory”, which includes some debts that have
been removed from lenders’ books but upon which they continue to attempt collection).
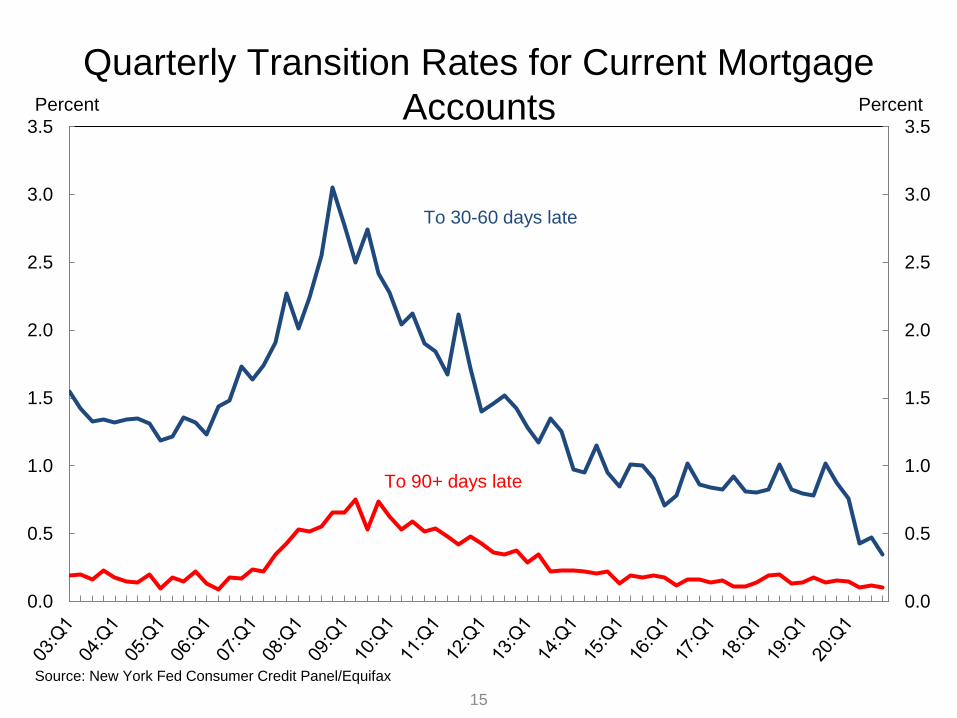
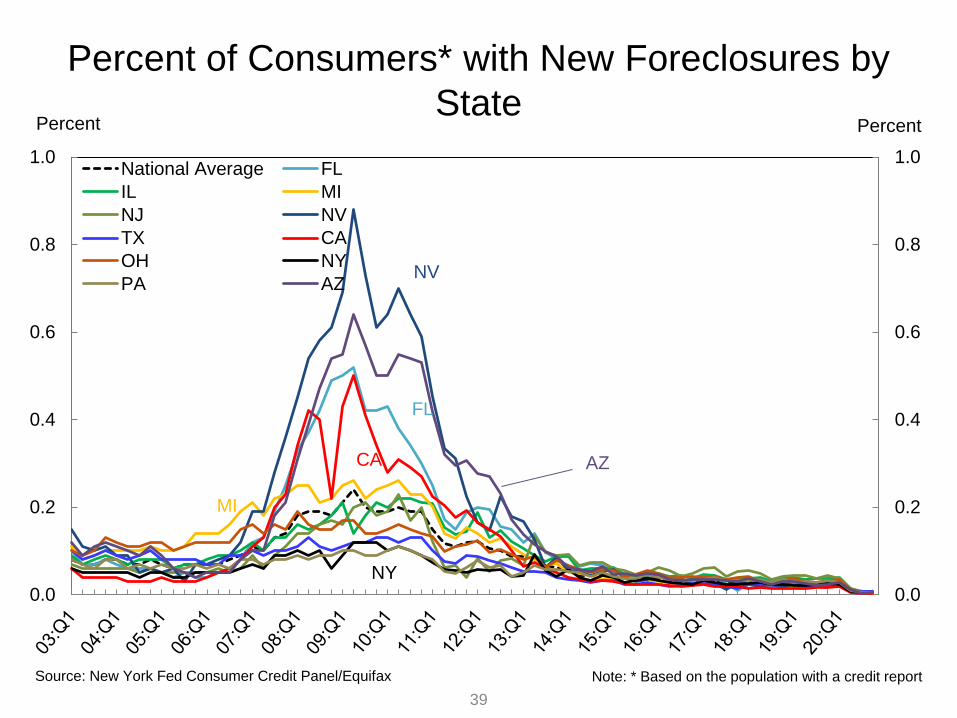
The uptake in forbearances continues to be visible in the delinquency transition rates for mortgages. The share of mortgages
that transitioned to early delinquency ticked down to a low 0.4%, as the option to enter forbearance remained. Meanwhile, 54% of
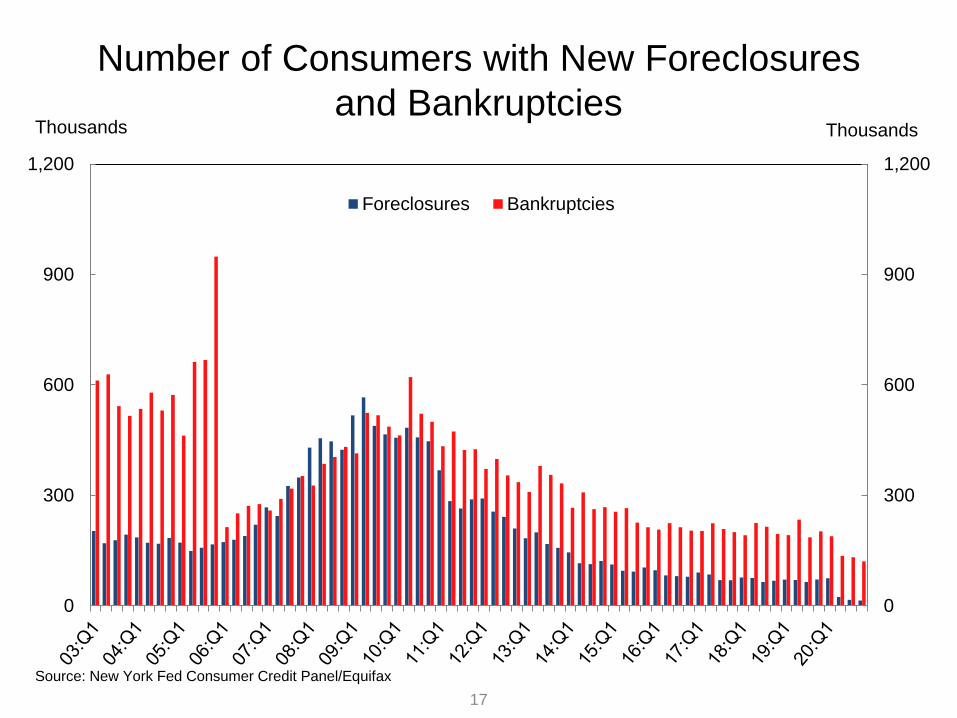
loans in early delinquency transitioned to current. Foreclosures remain on pause for most loans due to the CARES-provisioned
moratorium, and the fourth quarter saw only 14,000 new foreclosure starts.
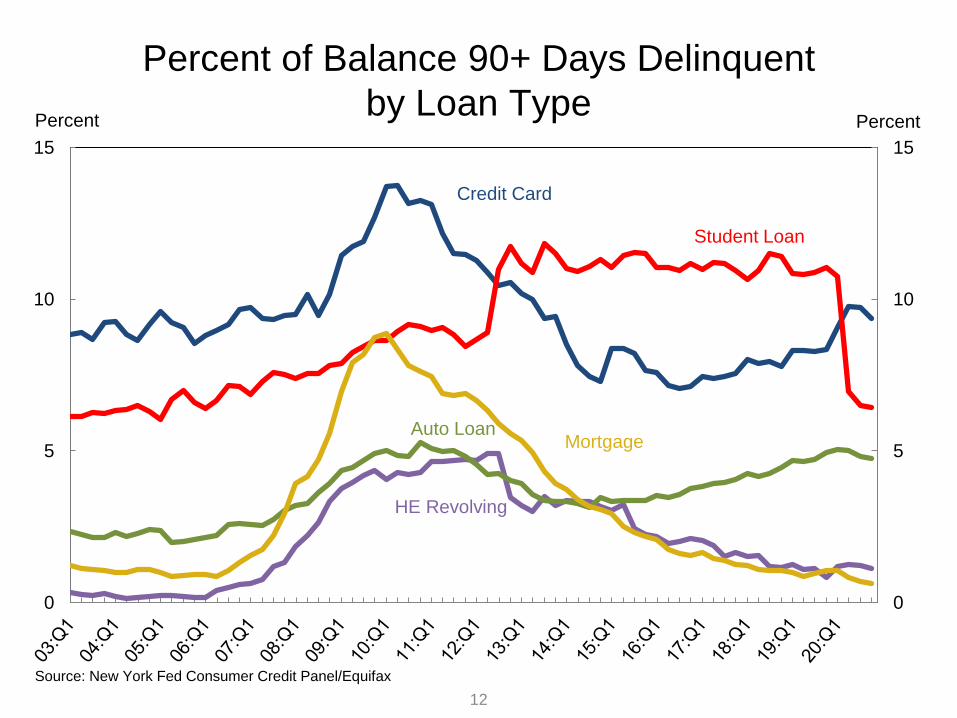
Delinquency rates by product continued to decline, and new transitions into early delinquency declined across the board,
continuing to reflect the various borrower assistance programs available. The share of student loans that transitioned to delinquency
continue to fall, as the majority of outstanding federal student loans are covered by CARES Act administrative forbearances. With
federally-backed mortgages also eligible for forbearances, the share of mortgages that transitioned into delinquency fell to 2%
(annualized) in the fourth quarter, down one and a half percentage points since the fourth quarter of 2019. Auto loans and credit cards
also showed continued declines in their delinquency transition rates, reflecting the impact of government stimulus programs and bank-
offered forbearance options for troubled borrowers.
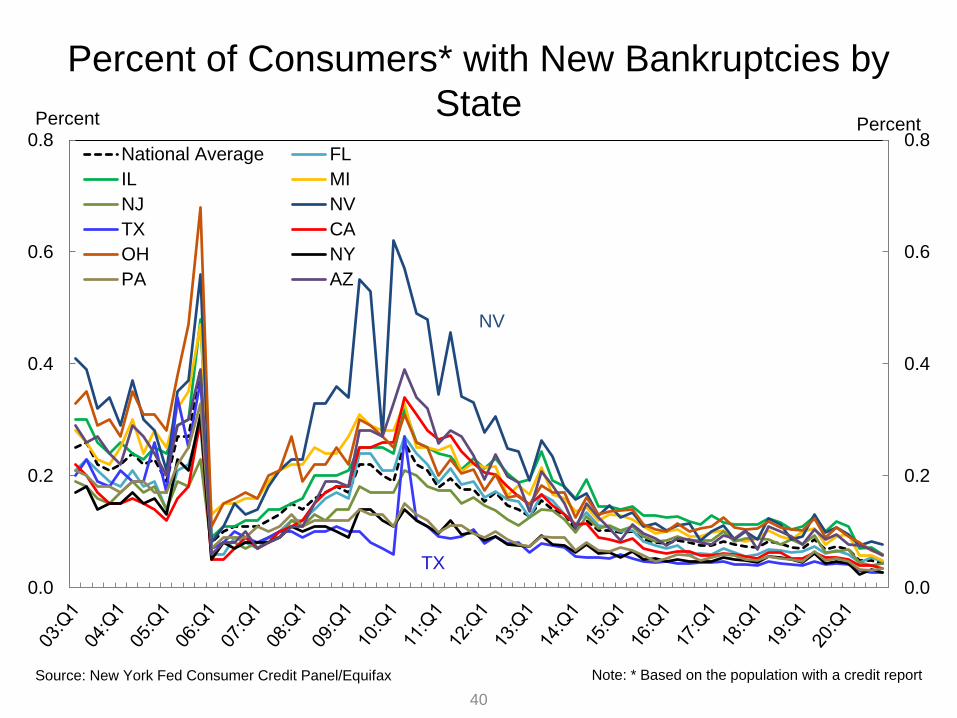
About 121,000 consumers had a bankruptcy notation added to their credit reports in 2020Q4, a decline from the previous
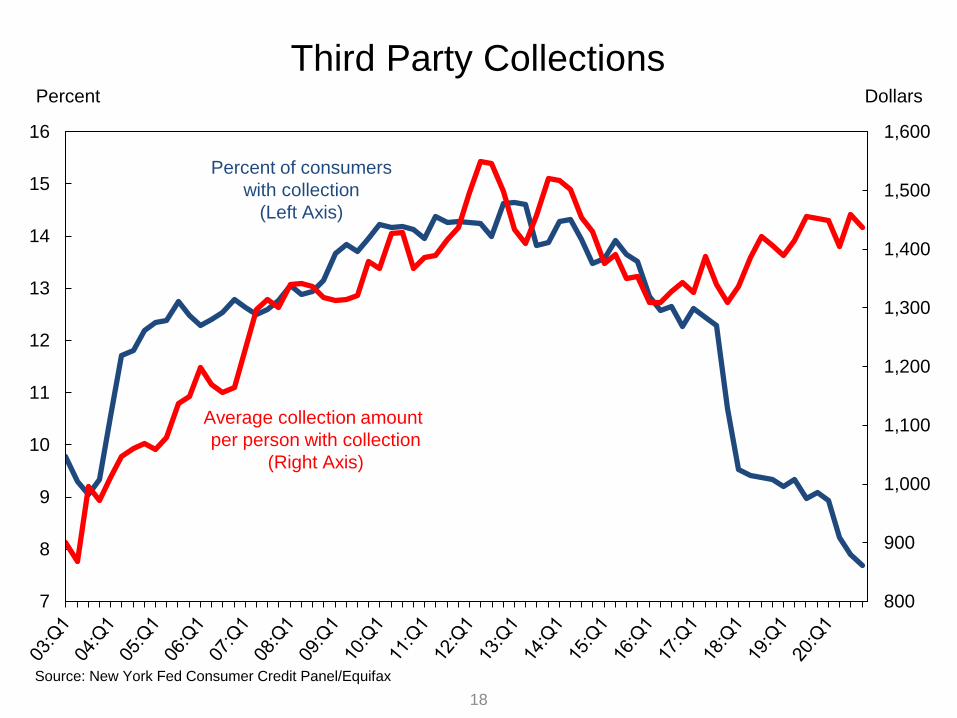
quarter and a new historical low. The share of consumers with a collection also declined sharply.
Housing Debt
There was $1.2 trillion in newly originated mortgage debt in 2020Q4.
1 This report is based on the New York Fed Consumer Credit Panel, which is constructed from an anonymized, nationally representative random sample drawn from
Equifax credit report data. For details on the data set and the measures reported here, see the data dictionary available at the end of this report. Please contact Joelle
Scally with questions at [email protected].
About 30,000 individuals had a new foreclosure notation added to their credit reports during the second half of 2020, by far the
lowest six months we have seen since the beginning of our series in 1999.
Student Loans
Outstanding student loan debt stood at $1.56 trillion in the fourth quarter, a $9 billion increase from the third quarter.
About 6.5% of aggregate student debt was 90+ days delinquent or in default in 2020Q4.2 The lower level of student debt
delinquency reflects a Department of Education decision to report current status on loans eligible for CARES Act forbearances.
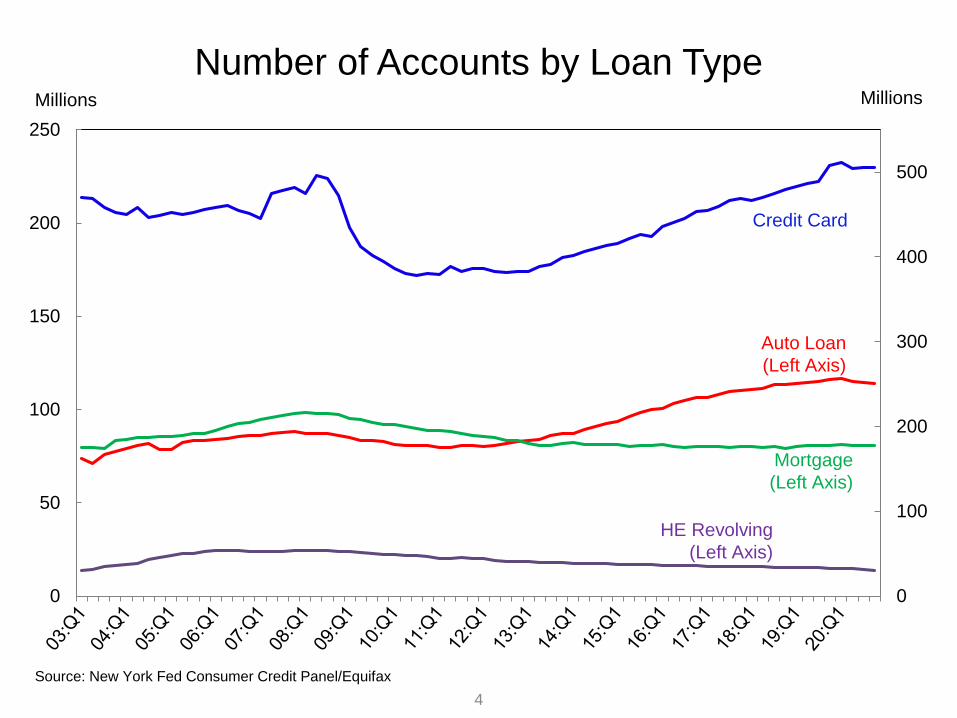
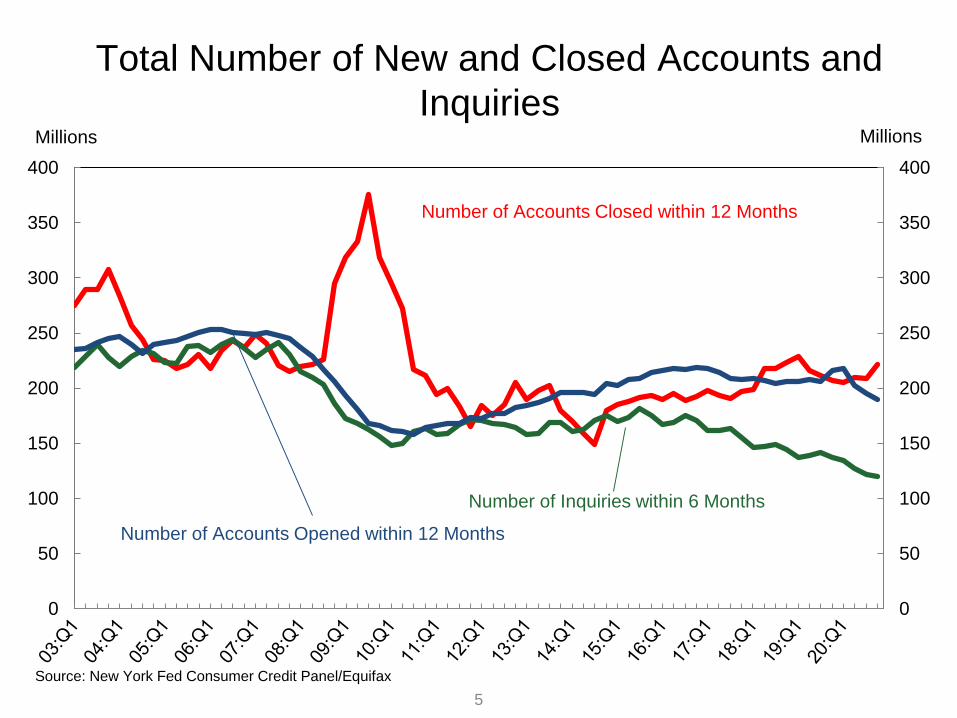
Account Closings, Credit Inquiries and Collection Accounts
The number of credit inquiries within the past six months – an indicator of consumer credit demand – was at 120 million, a
modest decline from the previous quarter. Inquiries have been subdued since the second quarter of 2020 when the large effects of
the pandemic hit the US.
Account openings declined by 5 million accounts to 190 million following larger drops in the second and third quarters of 2020.
2 As explained in a 2012 report, delinquency rates for student loans are likely to understate effective delinquency rates because about half of these loans are currently in
deferment, in grace periods or in forbearance and therefore temporarily not in the repayment cycle. This implies that among loans in the repayment cycle delinquency
rates are roughly twice as high.
February 2021 FEDERAL RESERVE BANK OF NEW YORK RESEARCH AND STATISTICS ● MICROECONOMIC STUDIES
Table of Contents NATIONAL CHARTS
Total Debt Balance and its Composition..................................................................................3 Number of Accounts by Loan Type.........................................................................................4 Total Number of New and Closed Accounts and Inquiries......................................................5 Mortgage Originations by Credit Score....................................................................................6 Credit Score at Origination: Mortgages....................................................................................7 Auto Loan Originations by Credit Score..................................................................................8 Credit Score at Origination: Auto Loans..................................................................................9 Credit Limit and Balance for Credit Cards and HE Revolving .............................................10 Total Balance by Delinquency Status.....................................................................................11 Percent of Balance 90+ Days Delinquent by Loan Type.......................................................12 Flow into Early Delinquency (30+) by Loan Type................................................................13 Flow into Serious Delinquency (90+) by Loan Type.............................................................14 Quarterly Transition Rates for Current Mortgage Accounts .................................................15 Quarterly Transition Rates for 30-60 Day Late Mortgage Accounts ....................................16 Number of Consumers with New Foreclosures and Bankruptcies ........................................17 Third Party Collections...........................................................................................................18
SELECT CHARTS BY AGE Total Debt Balance By Age....................................................................................................20 Debt Share by Product Type and Age (2020Q4)....................................................................21 Auto Loan Originations by Age.............................................................................................22 Mortgage Originations by Age...............................................................................................23 Quarterly Transition into Serious Delinquency (90+) by Age...............................................24 Quarterly Transition into Serious Delinquency (90+) for Mortgages by Age.......................25 Quarterly Transition into Serious Delinquency (90+) for Auto Loans by Age.....................26 Quarterly Transition into Serious Delinquency (90+) for Credit Cards by Age....................27 Quarterly Transition into Serious Delinquency (90+) for Student Loans by Age.................28 New Foreclosures by Age......................................................................................................29 New Bankruptcies by Age.....................................................................................................30
CHARTS BY SELECT STATE Total Debt Balance Per Capita by State.................................................................................32 Composition of Debt Balance per Capita* by State (2020Q4) .............................................33 Delinquency Status of Debt Balance per Capita* by State (2020Q4) ..................................34 Percent of Balance 90+ Days Late by State...........................................................................35 Percent of Mortgage Debt 90+ Days Late by State ...............................................................36 Quarterly Transition Rates into 30+ Days Late by State........................................................37 Quarterly Transition Rates into 90+ Days Late by State .......................................................38 Percent of Consumers with New Foreclosures by State ........................................................39 Percent of Consumers with New Bankruptcies by State ........................................................40

Page Left Blank Intentionally1

NATIONAL CHARTS
2
3
0
3
6
9
12
15Mortgage HE Revolving Auto Loan Credit Card Student Loan Other
Trillions of Dollars
Total Debt Balance and its Composition
Source: New York Fed Consumer Credit Panel/Equifax
2020Q4 Total: $14.56 Trillion2020Q3 Total: $14.35 Trillion (3%)
(11%)
(6%)
(9%)
(2%)
(69%)
4
0
100
200
300
400
500
0
50
100
150
200
250
Number of Accounts by Loan TypeMillions Millions
Credit Card
Mortgage
(Left Axis)
Auto Loan
(Left Axis)
HE Revolving
(Left Axis)
Source: New York Fed Consumer Credit Panel/Equifax
5
0
50
100
150
200
250
300
350
400
0
50
100
150
200
250
300
350
400
Total Number of New and Closed Accounts and
InquiriesMillionsMillions
Number of Inquiries within 6 Months
Number of Accounts Opened within 12 Months
Number of Accounts Closed within 12 Months
Source: New York Fed Consumer Credit Panel/Equifax
6
0
200
400
600
800
1,000
1,200
1,400
0
200
400
600
800
1,000
1,200
1,400
<620 620-659 660-719 720-759 760+
Source: New York Fed Consumer Credit Panel/Equifax
* Credit Score is Equifax Riskscore 3.0
Mortgage Originations by Credit Score*Billions of Dollars Billions of Dollars
7
50th percentile
25th percentile
10th percentile
500
550
600
650
700
750
800
500
550
600
650
700
750
800
Credit Score at Origination: Mortgages*Score Score
Source: New York Fed Consumer Credit Panel/Equifax
* Credit Score is Equifax Riskscore 3.0; mortgages include first-liens only.
8
0
40
80
120
160
200
0
40
80
120
160
200<620 620-659 660-719 720-759 760+
Source: New York Fed Consumer Credit Panel/Equifax
* Credit Score is Equifax Riskscore 3.0
Auto Loan Originations by Credit Score*Billions of Dollars Billions of Dollars
9
500
550
600
650
700
750
800
500
550
600
650
700
750
800
Credit Score at Origination: Auto Loans*Score
Source: New York Fed Consumer Credit Panel/Equifax
* Credit Score is Equifax Riskscore 3.0
50th percentile
25th percentile
10th percentile
Score
10
0
1
2
3
4
0
1
2
3
4HELOC Balance CC Balance CC Limit HELOC Limit
Trillions of Dollars Trillions of Dollars
Credit Limit and Balance for Credit Cards and HE
Revolving
Source: New York Fed Consumer Credit Panel/Equifax
11
0
2
4
6
8
10
12
14
0
2
4
6
8
10
12
14
Severely Derogatory 120+ days late 90 days late 60 days late 30 days late Zero
Total Balance by Delinquency StatusPercent
Source: New York Fed Consumer Credit Panel/Equifax
Percent
12
0
5
10
15
0
5
10
15
Credit Card
MortgageAuto Loan
HE Revolving
Percent of Balance 90+ Days Delinquent
by Loan TypePercent Percent
Source: New York Fed Consumer Credit Panel/Equifax
Student Loan
13
0
2
4
6
8
10
12
14
16
0
2
4
6
8
10
12
14
16
Transition into Delinquency (30+) by Loan Type
Source: New York Fed Consumer Credit Panel/EquifaxNote: 4 Quarter Moving Sum
Student loan data are not reported prior to 2004 due to uneven reporting
Credit Card
Mortgage
Auto Loan
HE Revolving
Percent of Balance
Student Loan
Percent of Balance
14
0
2
4
6
8
10
12
0
2
4
6
8
10
12
Student Loan
Transition into Serious Delinquency (90+)
by Loan Type
Source: New York Fed Consumer Credit Panel/Equifax
Note: 4 Quarter Moving Sum
Student loan data are not reported prior to 2004 due to uneven reporting
Credit CardMortgage
Auto Loan
HE Revolving
Percent of BalancePercent of Balance
15
0.0
0.5
1.0
1.5
2.0
2.5
3.0
3.5
0.0
0.5
1.0
1.5
2.0
2.5
3.0
3.5
To 30-60 days late
To 90+ days late
Quarterly Transition Rates for Current Mortgage
AccountsPercent Percent
Source: New York Fed Consumer Credit Panel/Equifax
16
0
10
20
30
40
50
60
70
0
10
20
30
40
50
60
70
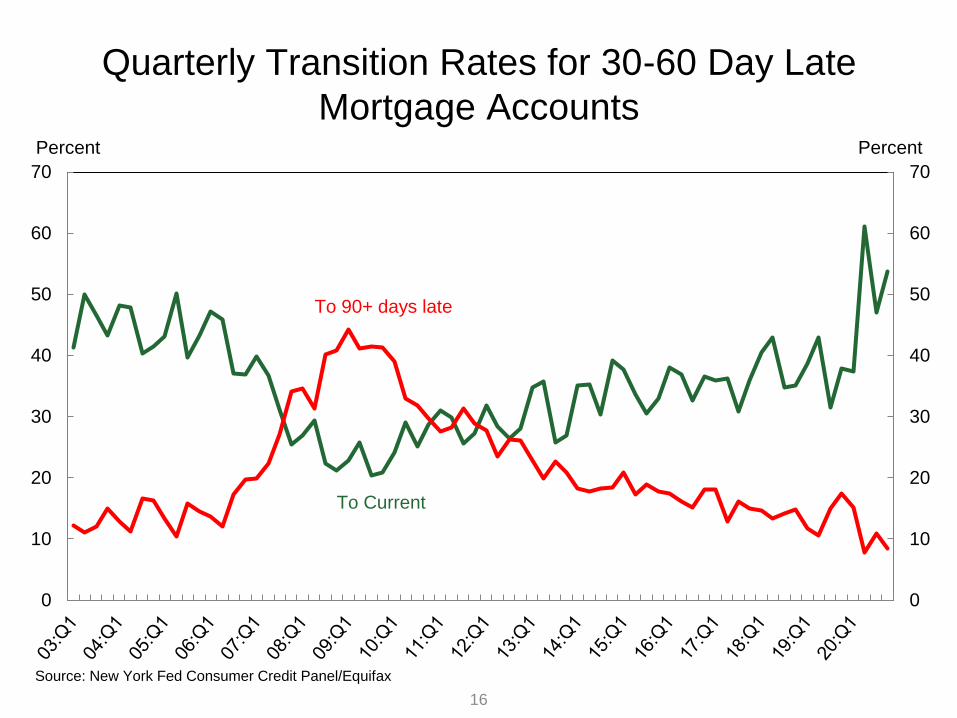
To Current
To 90+ days late
Quarterly Transition Rates for 30-60 Day Late
Mortgage AccountsPercent Percent
Source: New York Fed Consumer Credit Panel/Equifax
17
0
300
600
900
1,200
0
300
600
900
1,200
Foreclosures Bankruptcies
Thousands
Number of Consumers with New Foreclosures
and BankruptciesThousands
Source: New York Fed Consumer Credit Panel/Equifax
18
800
900
1,000
1,100
1,200
1,300
1,400
1,500
1,600
7
8
9
10
11
12
13
14
15
16
Third Party CollectionsDollars
Percent of consumers
with collection
(Left Axis)
Average collection amount
per person with collection
(Right Axis)
Percent
Source: New York Fed Consumer Credit Panel/Equifax

SELECT CHARTS BY AGE
19
20
0
3
6
9
12
15
0
3
6
9
12
1518-29 30-39 40-49 50-59 60-69 70+
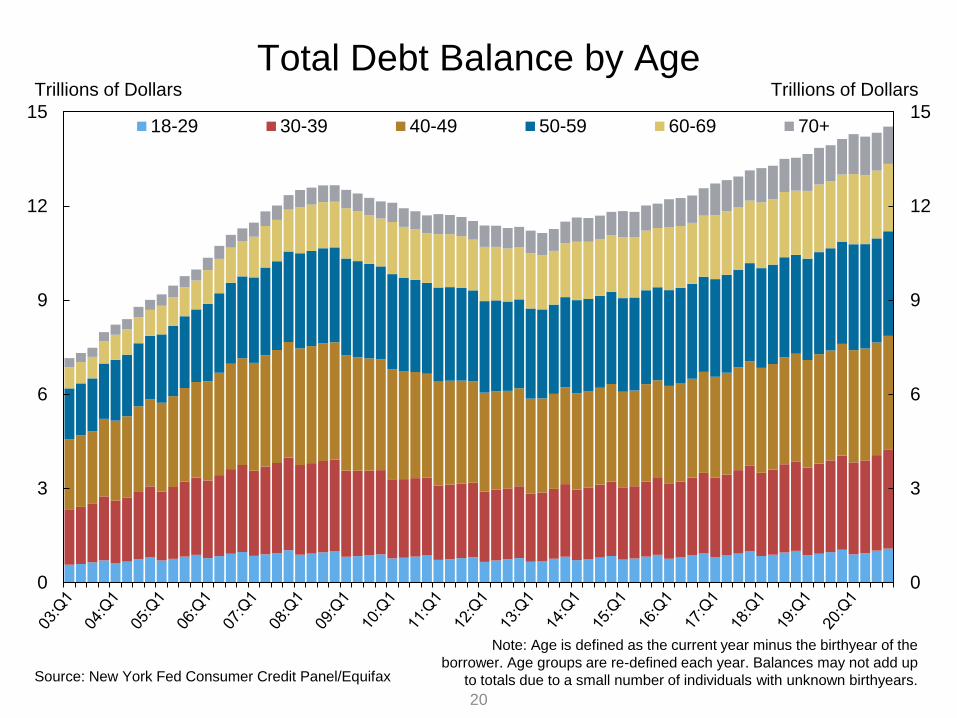
Trillions of Dollars
Total Debt Balance by AgeTrillions of Dollars
Source: New York Fed Consumer Credit Panel/Equifax
Note: Age is defined as the current year minus the birthyear of the
borrower. Age groups are re-defined each year. Balances may not add up
to totals due to a small number of individuals with unknown birthyears.
21
0%
20%
40%
60%
80%
100%
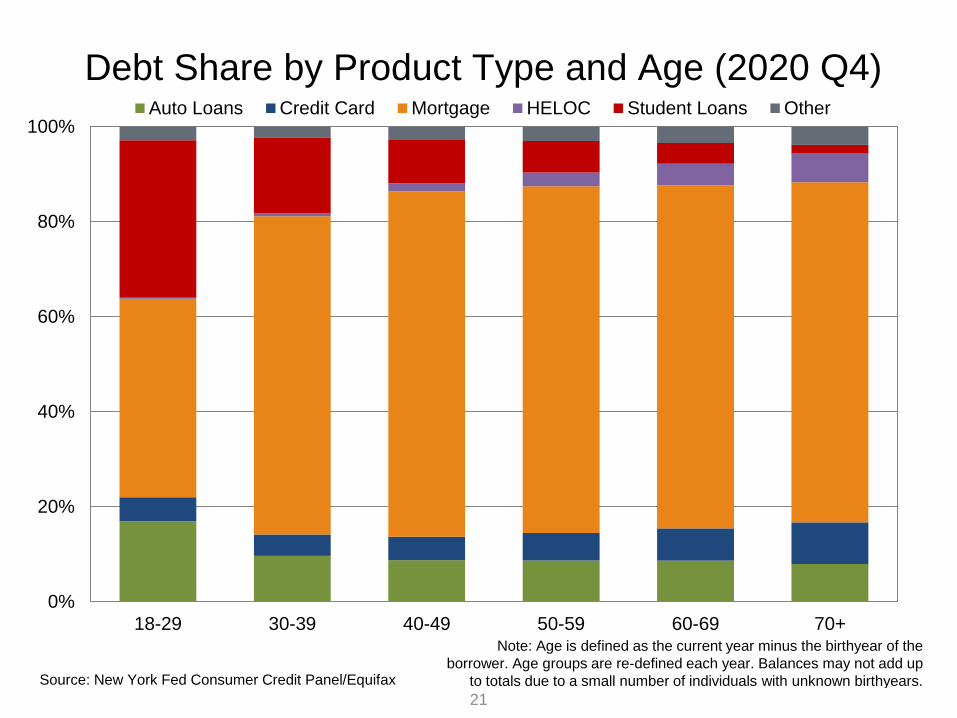
18-29 30-39 40-49 50-59 60-69 70+
Auto Loans Credit Card Mortgage HELOC Student Loans Other
Source: New York Fed Consumer Credit Panel/Equifax
Debt Share by Product Type and Age (2020 Q4)
Note: Age is defined as the current year minus the birthyear of the
borrower. Age groups are re-defined each year. Balances may not add up
to totals due to a small number of individuals with unknown birthyears.
22
0
20
40
60
80
100
120
140
160
180
200
0
20
40
60
80
100
120
140
160
180
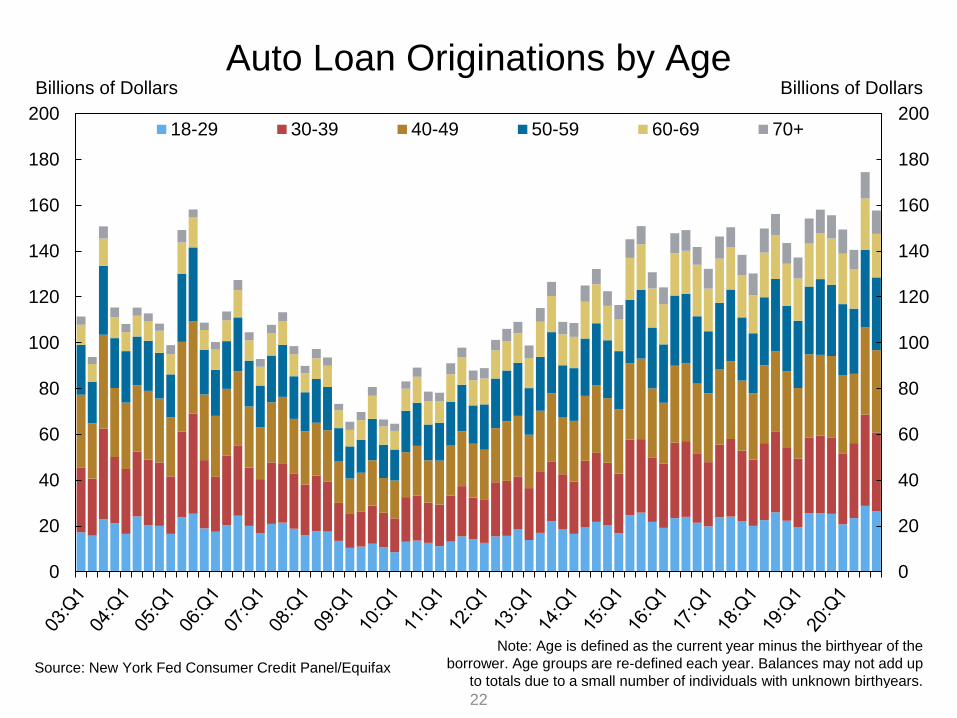
20018-29 30-39 40-49 50-59 60-69 70+
Source: New York Fed Consumer Credit Panel/Equifax
Auto Loan Originations by AgeBillions of Dollars Billions of Dollars
Note: Age is defined as the current year minus the birthyear of the
borrower. Age groups are re-defined each year. Balances may not add up
to totals due to a small number of individuals with unknown birthyears.
23
0
200
400
600
800
1,000
1,200
1,400
0
200
400
600
800
1,000
1,200
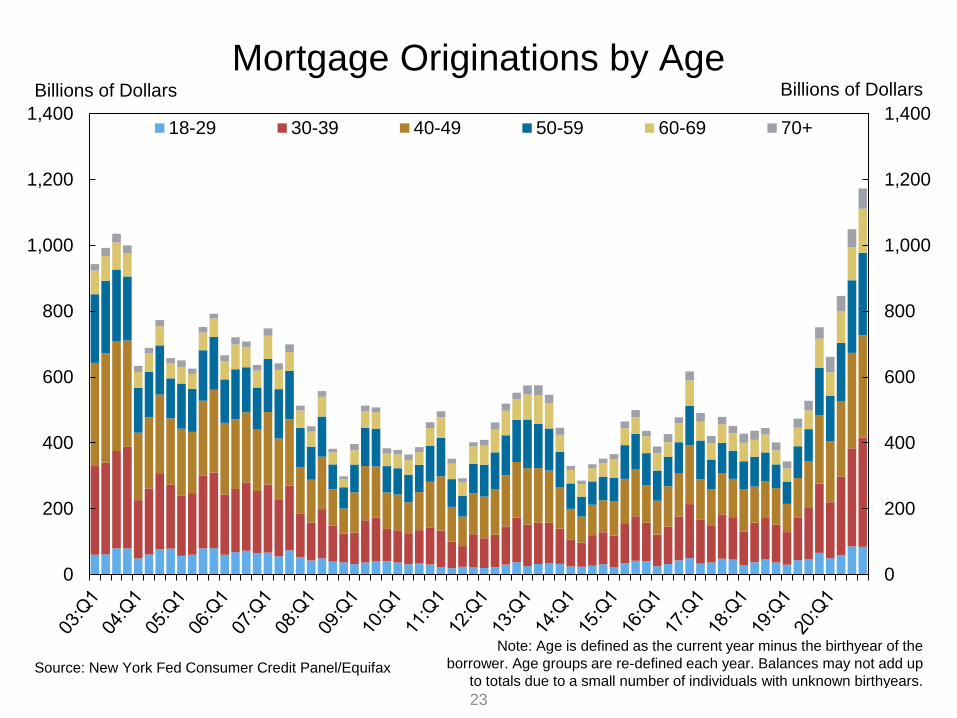
1,40018-29 30-39 40-49 50-59 60-69 70+
Source: New York Fed Consumer Credit Panel/Equifax
Mortgage Originations by AgeBillions of Dollars Billions of Dollars
Note: Age is defined as the current year minus the birthyear of the
borrower. Age groups are re-defined each year. Balances may not add up
to totals due to a small number of individuals with unknown birthyears.
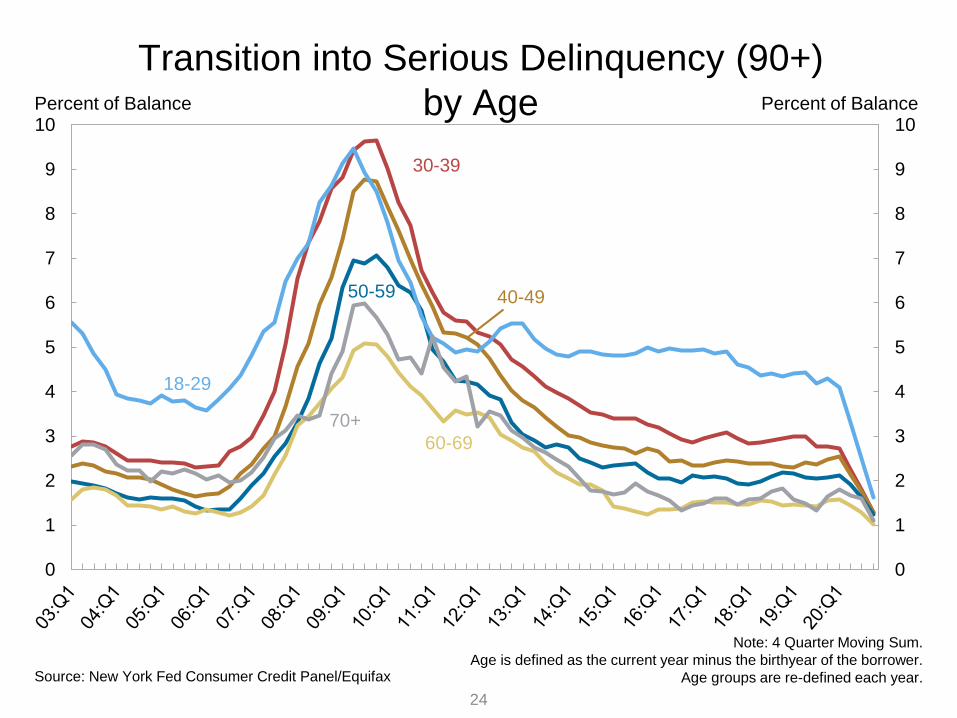
24
0
1
2
3
4
5
6
7
8
9
10
0
1
2
3
4
5
6
7
8
9
10
Transition into Serious Delinquency (90+)
by Age
Source: New York Fed Consumer Credit Panel/Equifax
40-49
60-69
30-39
50-59
Percent of Balance
18-29
Percent of Balance
70+
Note: 4 Quarter Moving Sum.
Age is defined as the current year minus the birthyear of the borrower.
Age groups are re-defined each year.
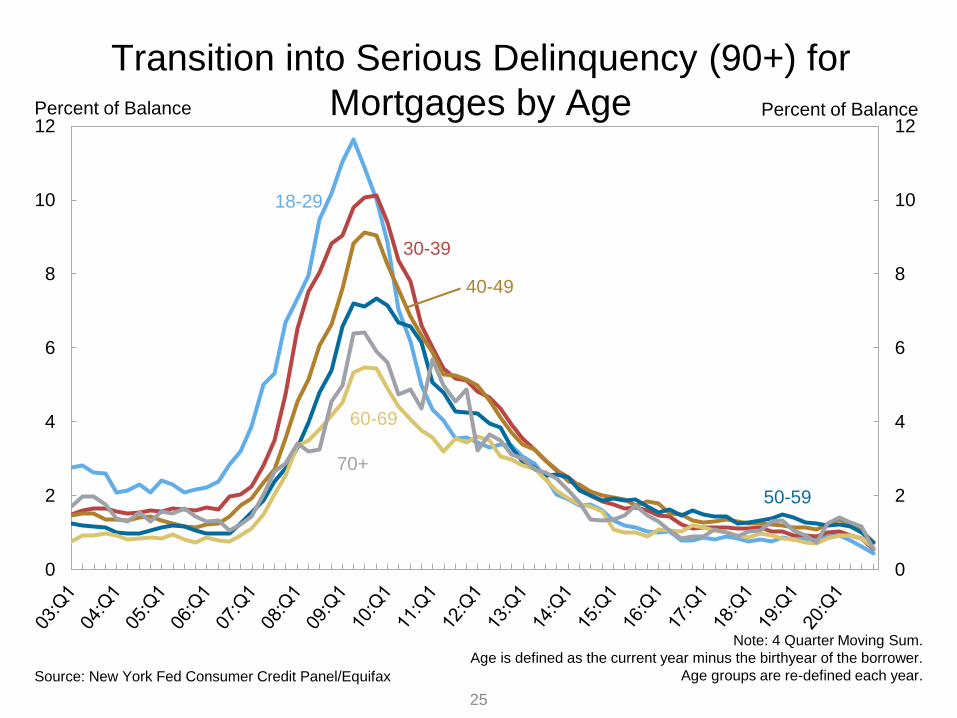
25
0
2
4
6
8
10
12
0
2
4
6
8
10
12
Transition into Serious Delinquency (90+) for
Mortgages by Age
Source: New York Fed Consumer Credit Panel/Equifax
30-39
60-69
40-49
50-59
Percent of Balance
18-29
Percent of Balance
70+
Note: 4 Quarter Moving Sum.
Age is defined as the current year minus the birthyear of the borrower.
Age groups are re-defined each year.
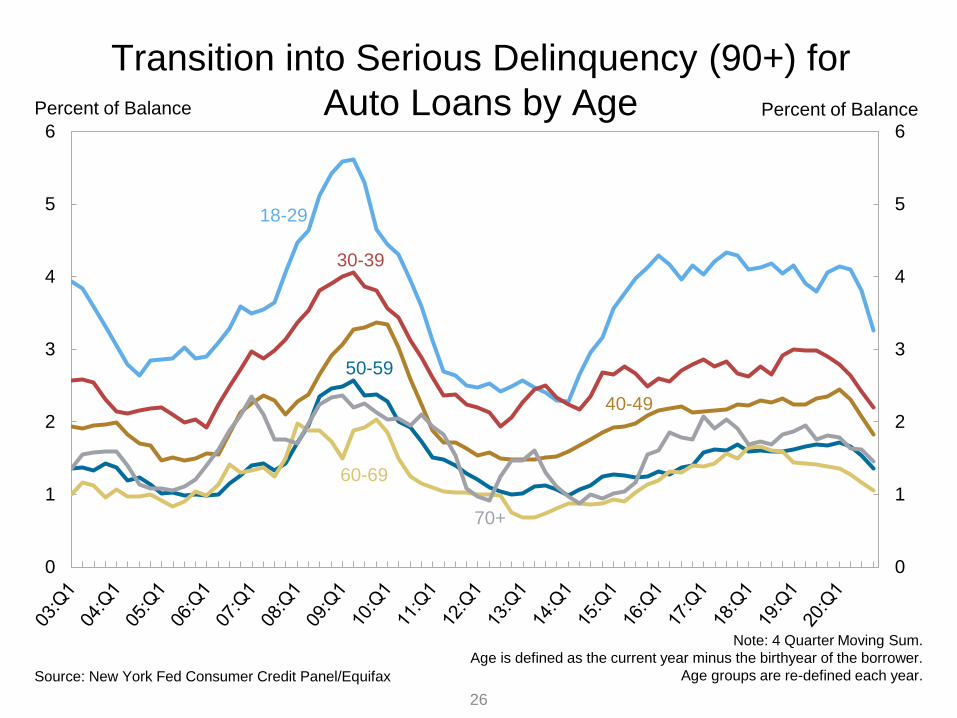
26
0
1
2
3
4
5
6
0
1
2
3
4
5
6
Transition into Serious Delinquency (90+) for
Auto Loans by Age
Source: New York Fed Consumer Credit Panel/Equifax
30-39
60-69
40-49
50-59
Percent of Balance
18-29
Percent of Balance
70+
Note: 4 Quarter Moving Sum.
Age is defined as the current year minus the birthyear of the borrower.
Age groups are re-defined each year.
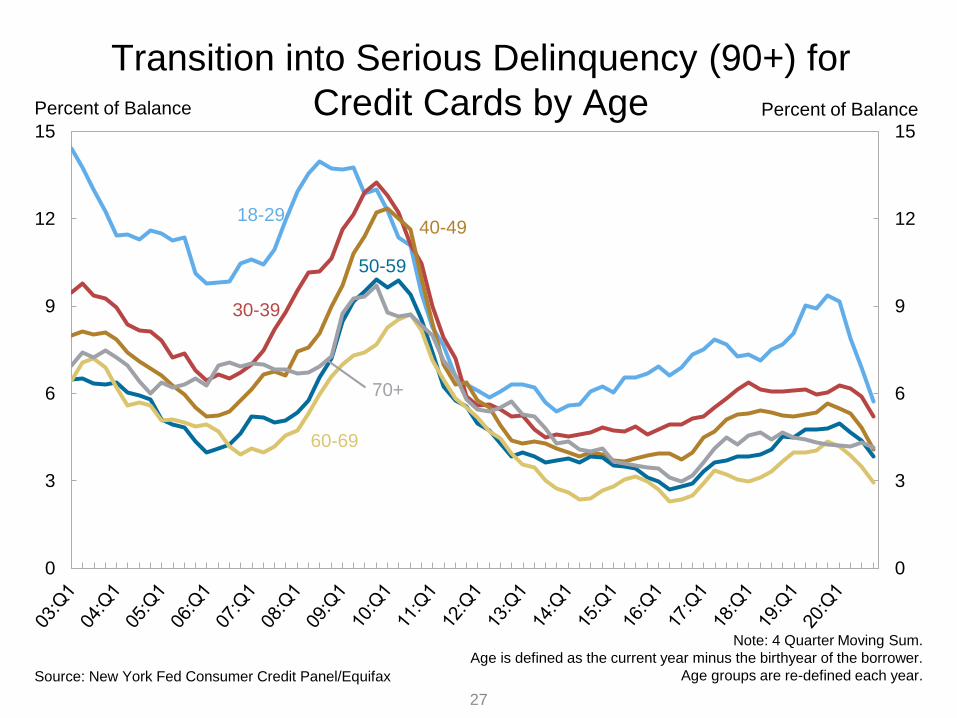
27
0
3
6
9
12
15
0
3
6
9
12
15
Transition into Serious Delinquency (90+) for
Credit Cards by Age
Source: New York Fed Consumer Credit Panel/Equifax
30-39
70+
40-49
50-59
Percent of Balance
18-29
Percent of Balance
60-69
Note: 4 Quarter Moving Sum.
Age is defined as the current year minus the birthyear of the borrower.
Age groups are re-defined each year.
28
0
3
6
9
12
15
0
3
6
9
12
15
Transition into Serious Delinquency (90+) for
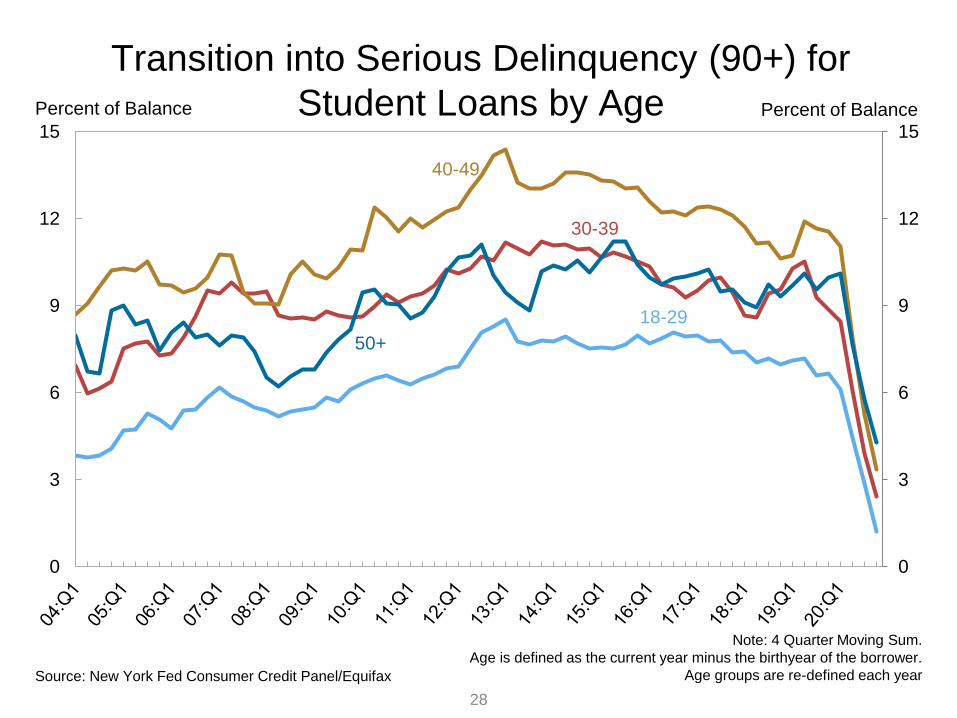
Student Loans by Age
Source: New York Fed Consumer Credit Panel/Equifax
30-39
40-49
50+
Percent of Balance
18-29
Percent of Balance
Note: 4 Quarter Moving Sum.
Age is defined as the current year minus the birthyear of the borrower.
Age groups are re-defined each year
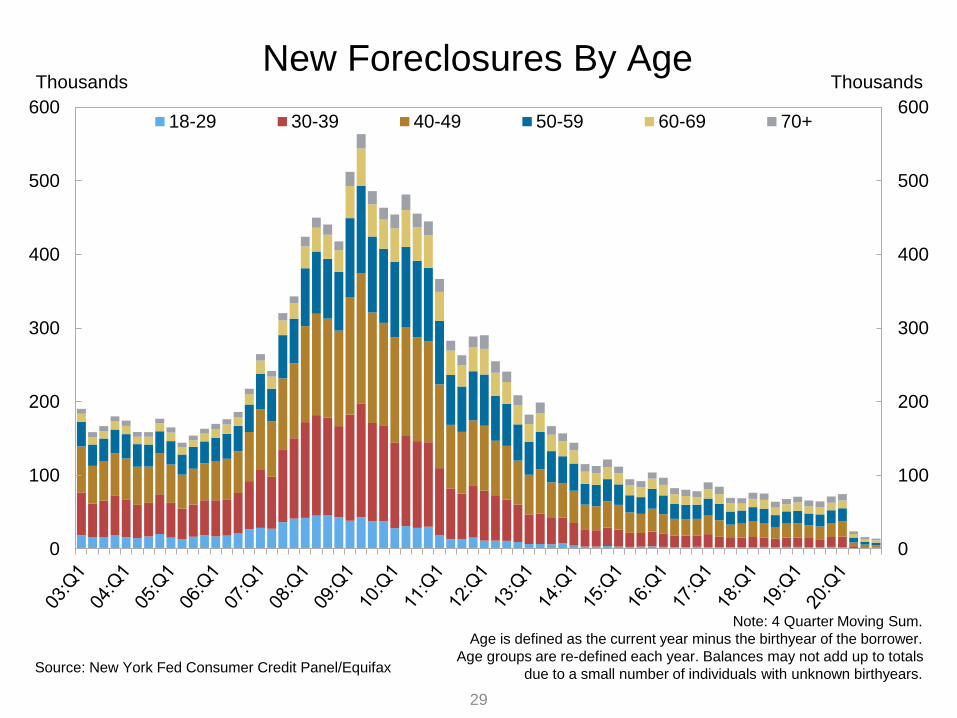
29
0
100
200
300
400
500
600
0
100
200
300
400
500
60018-29 30-39 40-49 50-59 60-69 70+
Source: New York Fed Consumer Credit Panel/Equifax
New Foreclosures By AgeThousands Thousands
Note: 4 Quarter Moving Sum.
Age is defined as the current year minus the birthyear of the borrower.
Age groups are re-defined each year. Balances may not add up to totals
due to a small number of individuals with unknown birthyears.
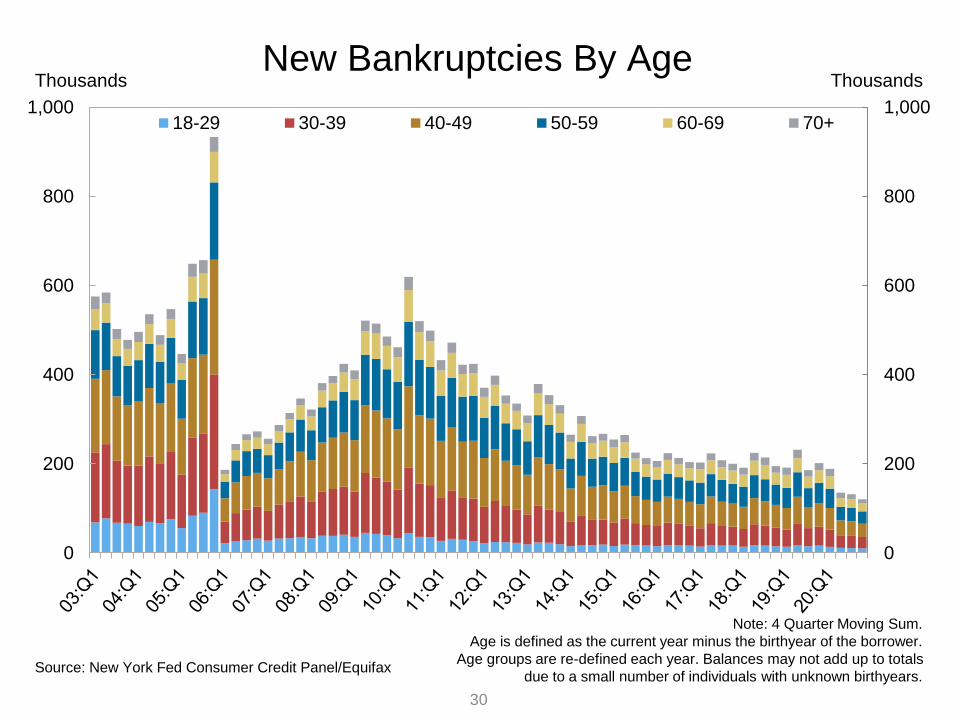
30
0
200
400
600
800
1,000
0
200
400
600
800
1,00018-29 30-39 40-49 50-59 60-69 70+
Source: New York Fed Consumer Credit Panel/Equifax
New Bankruptcies By AgeThousands Thousands
Note: 4 Quarter Moving Sum.
Age is defined as the current year minus the birthyear of the borrower.
Age groups are re-defined each year. Balances may not add up to totals
due to a small number of individuals with unknown birthyears.

CHARTS BY SELECT STATE
31
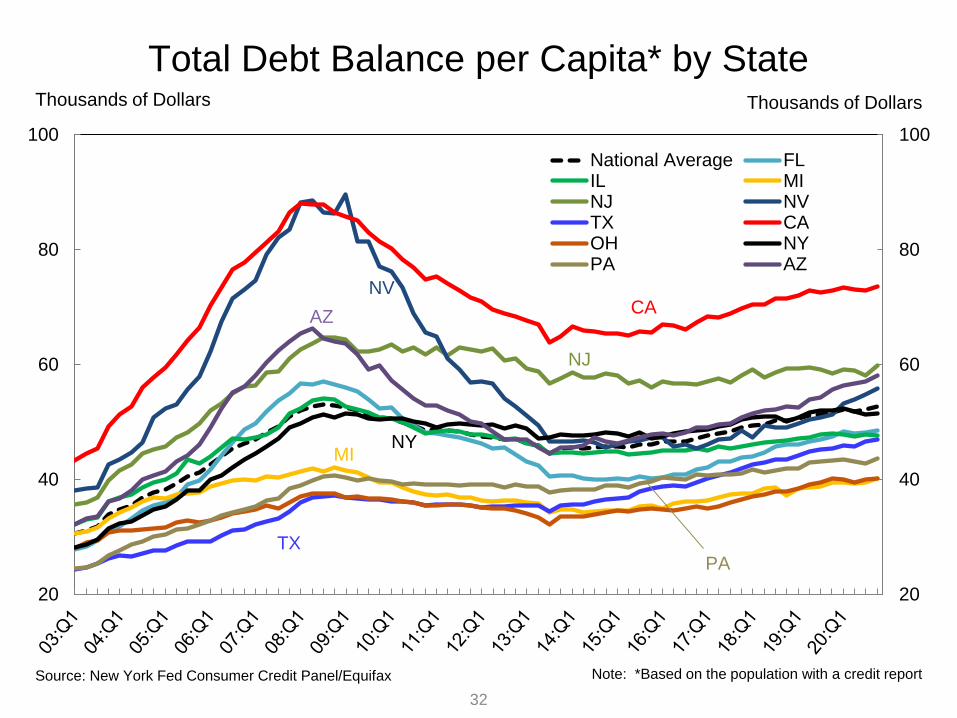
32
20
40
60
80
100
20
40
60
80
100
National Average FLIL MINJ NVTX CAOH NYPA AZ
Thousands of Dollars
Total Debt Balance per Capita* by StateThousands of Dollars
CANV
AZ
NJ
TX
MINY
PA
Note: *Based on the population with a credit reportSource: New York Fed Consumer Credit Panel/Equifax

33
0
20
40
60
80
AZ CA FL IL MI NJ NV NY OH PA TX US
Mortgage HE Revolving Auto Loan Credit Card Student Loan Other
Thousands of Dollars Thousands of Dollars
Note: * Based on the population with a credit reportSource: New York Fed Consumer Credit Panel/Equifax
Composition of Debt Balance per Capita*
by State (2020 Q4)

34
0
20
40
60
80
0
20
40
60
80
AZ CA FL IL MI NJ NV NY OH PA TX US
Current 30-day late 60-day late 90-day late 120-day late Severely Derogatory
Thousands of Dollars Thousands of Dollars
Note: * Based on the population with a credit reportSource: New York Fed Consumer Credit Panel/Equifax
Delinquency Status of Debt Balance per Capita*
by State (2020 Q4)
35
0
3
6
9
12
15
18
21
24
0
3
6
9
12
15
18
21
24
National Average FL
IL MI
NJ NV
TX CA
OH NY
PA AZ
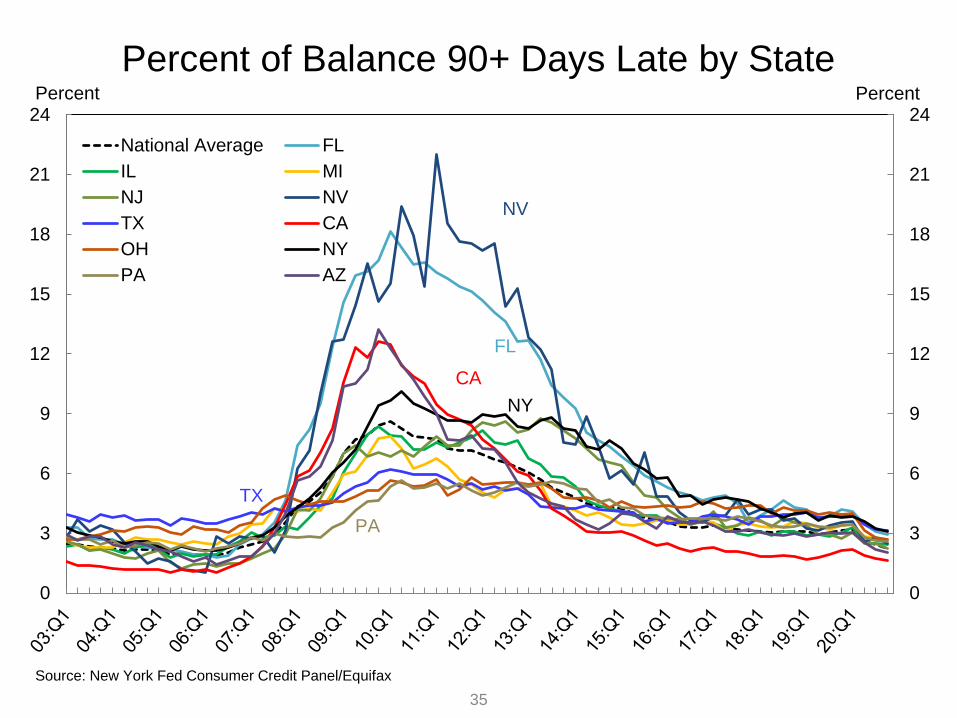
Percent of Balance 90+ Days Late by State
CA
NV
FL
TX
NY
PA
Source: New York Fed Consumer Credit Panel/Equifax
Percent Percent
36
0
3
6
9
12
15
18
21
24
27
0
3
6
9
12
15
18
21
24
27
National Average FL
IL MI
NJ NV
TX CA
OH NY
PA AZ
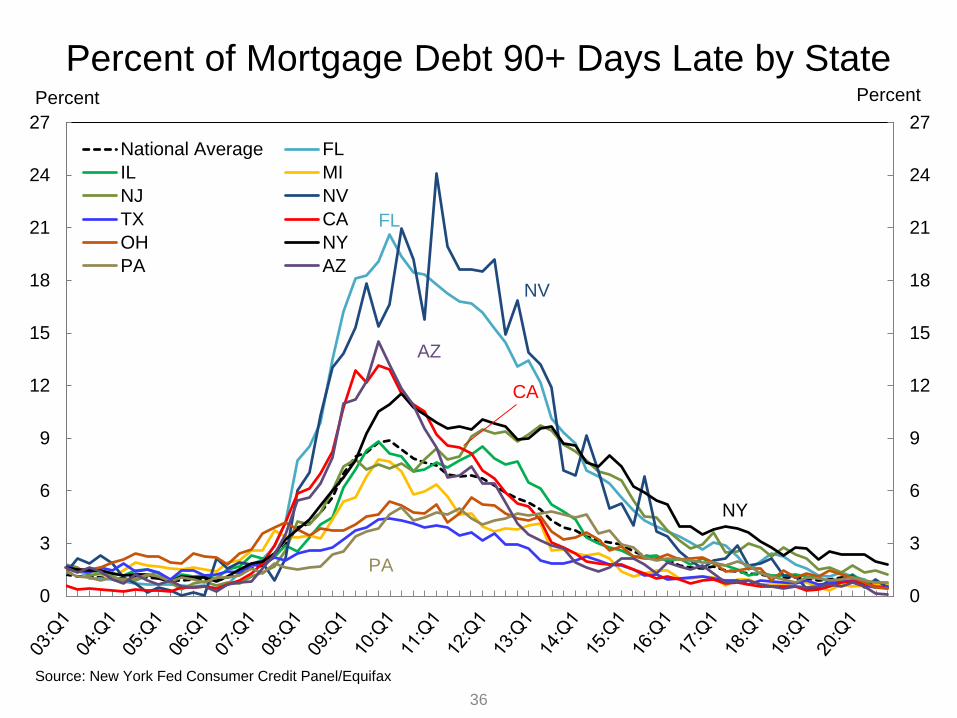
Percent of Mortgage Debt 90+ Days Late by State
CA
NV
AZ
FL
NY
PA
Source: New York Fed Consumer Credit Panel/Equifax
Percent Percent
37
0
5
10
15
20
25
30
0
5
10
15
20
25
30National Average FLIL MINJ NVTX CAOH NYPA AZ
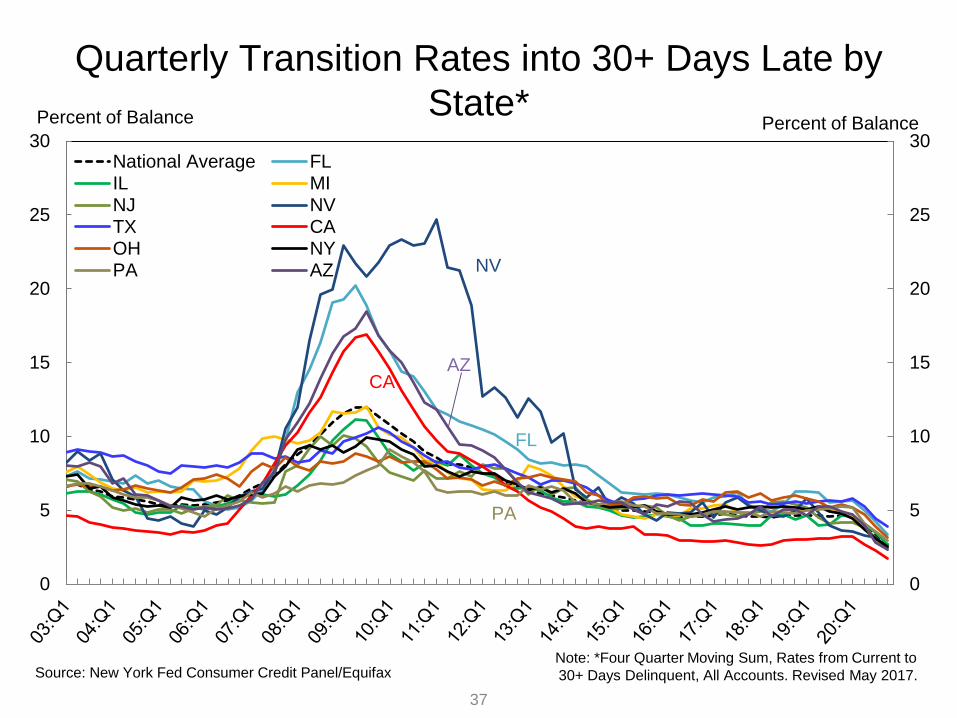
Quarterly Transition Rates into 30+ Days Late by
State*
NV
FL
Source: New York Fed Consumer Credit Panel/Equifax
Percent of Balance
AZCA
Note: *Four Quarter Moving Sum, Rates from Current to
30+ Days Delinquent, All Accounts. Revised May 2017.
PA
Percent of Balance
38
0
5
10
15
20
25
0
5
10
15
20
25National Average FLIL MINJ NVTX CAOH NYPA AZ
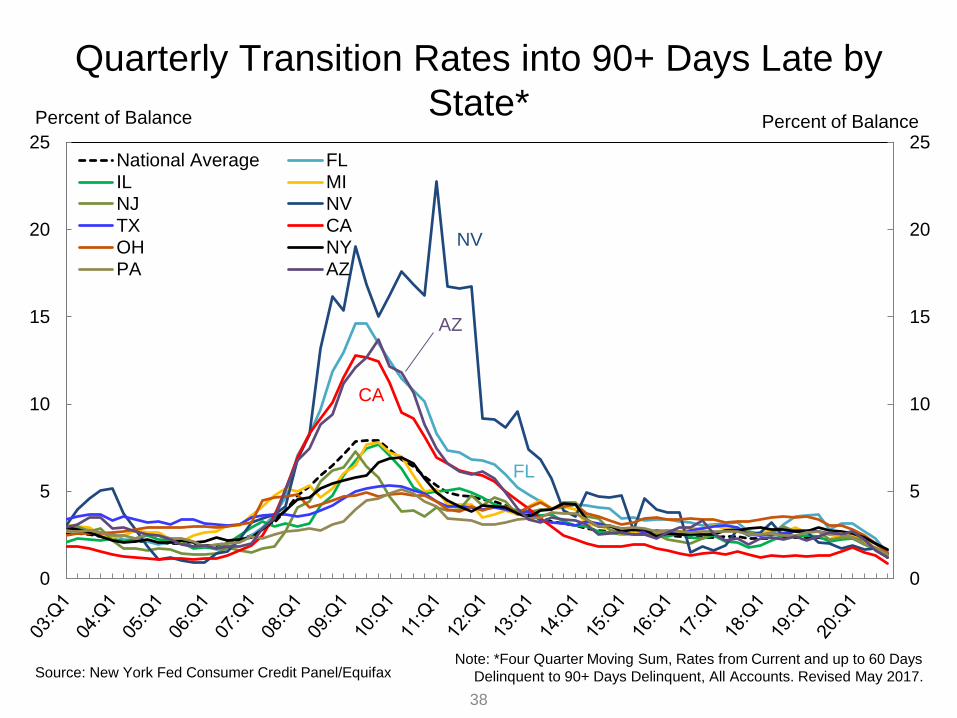
Quarterly Transition Rates into 90+ Days Late by
State*
NV
FL
Percent of Balance
AZ
CA
Source: New York Fed Consumer Credit Panel/EquifaxNote: *Four Quarter Moving Sum, Rates from Current and up to 60 Days
Delinquent to 90+ Days Delinquent, All Accounts. Revised May 2017.
Percent of Balance
39
0.0
0.2
0.4
0.6
0.8
1.0
0.0
0.2
0.4
0.6
0.8
1.0National Average FL
IL MI
NJ NV
TX CA
OH NY
PA AZ
Percent of Consumers* with New Foreclosures by
State
CA
NV
AZ
FL
NY
MI
Note: * Based on the population with a credit reportSource: New York Fed Consumer Credit Panel/Equifax
Percent Percent
40
0.0
0.2
0.4
0.6
0.8
0.0
0.2
0.4
0.6
0.8National Average FL
IL MI
NJ NV
TX CA
OH NY
PA AZ
Percent of Consumers* with New Bankruptcies by
State
NV
Note: * Based on the population with a credit reportSource: New York Fed Consumer Credit Panel/Equifax
Percent Percent
TX
Data Dictionary
The FRBNY Consumer Credit Panel consists of detailed Equifax credit-report data for a unique longitudinal quarterly panel of individuals and households from 1999 to 20191. The panel is a nationally representative 5% random sample of all individuals with a social security number and a credit report (usually aged 19 and over). We also sampled all other individuals living at the same address as the primary sample members, allowing us to track household-level credit and debt for a random sample of US households. The resulting database includes approximately 44 million individuals in each quarter. More details regarding the sample design can be found in Lee and van der Klaauw (2010).2 A comprehensive overview of the specific content of consumer credit reports is provided in Avery, Calem, Canner and Bostic (2003).3
The credit report data in our panel primarily includes information on accounts that have been reported by the creditor within 3 months of the date that the credit records were drawn each quarter. Thus, accounts that are not currently reported on are excluded. Such accounts may be closed accounts with zero balances, dormant or inactive accounts with no balance, or accounts that when last reported had a positive balance. The latter accounts include accounts that were either subsequently sold, transferred, or paid off as well as accounts, particularly derogatory accounts, that are still outstanding but on which the lender has ceased reporting. According to Avery et al (2003), the latter group of noncurrently reporting accounts, with positive balances when last reported, accounted for approximately 8% of all credit accounts in their sample. For the vast majority of these accounts, and particularly for mortgage and installment loans, additional analysis suggested they had been closed (with zero balance) or transferred.4 Our exclusion of the latter accounts is comparable to some ‘stale account rules’ used by credit reporting companies, which treat noncurrently reporting revolving and nonrevolving accounts with positive balances as closed and with zero balance.
All figures shown in the tables and graphs are based on the 5% random sample of individuals. To reduce processing costs, we drew a 2% random subsample of these individuals, meaning that the results presented here are for a 0.1% random sample of individuals with credit reports, or approximately 267,000 individuals as of Q1 2017.5 In computing several of these statistics, account was taken of the joint or individual nature of various loan accounts. For example, to minimize biases due to double counting, in computing individual-level total balances, 50% of the balance associated with each joint account was attributed to that individual. Per-capita figures are computed by dividing totals for our sample by the total number of people in our sample, so these figures apply to the population of individuals who have a credit report.
In comparing aggregate measures of household debt presented in this report to those included in the Board of Governor’s Flow Of Funds (FoF) Accounts, there are several important considerations. First, among the different components included in the FoF household debt measure (which also includes debt of nonprofit organizations), our measures are directly comparable to two of its components: home mortgage debt and consumer credit. Total mortgage debt and non-mortgage debt in the third quarter of 2009 were respectively $9.7 and $2.6 trillion, while the comparable amounts in the FoF for the same quarter were
1 Note that reported aggregates, especially in 2003-2004, may reflect some delays in the reporting of student loans by servicers to credit bureaus which could lead to some undercounting of student loan balances. Quarterly data prior to Q1 2003, excluding student loans, will remain available on the Household Credit webpage. 2 Lee, D. and W. van der Klaauw, “An introduction to the FRBNY Consumer Credit Panel”, [2010]. 3 Avery, R.B., P.S. Calem, G.B. Canner and R.W. Bostic, “An Overview of Consumer Data and Credit Reporting”, Federal Reserve Bulletin, Feb. 2003, pp 47-73. 4 Avery et al (2003) found that for many nonreported mortgage accounts a new mortgage account appeared around the time the account stopped being reported, suggesting a refinance or that the servicing was sold. Most revolving and open non-revolving accounts with a positive balance require monthly payments if they remain open, suggesting the accounts had been closed. Noncurrently reporting derogatory accounts can remain unchanged and not requiring updating for a long time when the borrower has stopped paying and the creditor may have stopped trying to collect on the account. Avery et al report that some of these accounts appeared to have been paid off. 5 Due to relatively low occurrence rates we used the full 5% sample for the computation of new foreclosure and bankruptcy rates. Additionally, to capture and account for servicer discrepancies, we used the 1% sample for student loan data. For all other graphs, we found the 0.1% sample to provide a very close representation of the 5% sample.
41
$10.3 and $2.5 trillion, respectively.6 Second, a detailed accounting for the remaining differences between the debt measures from both data sources will require a more detailed breakdown and documentation of the computation of the FoF measures.7
Loan types. In our analysis we distinguish between the following types of accounts: mortgage accounts, home equity revolving accounts, auto loans and leases, bank card accounts, student loans and other loan accounts. Mortgage accounts include all mortgage installment loans, including first mortgages and home equity installment loans (HEL), both of which
are closed-end loans. Home Equity Revolving accounts (aka Home Equity Line of Credit or HELOC), unlike home equity installment loans, are home equity loans with a revolving line of credit where the borrower can choose when and how often to borrow up to an updated credit limit. Auto Loans are loans taken out to purchase a car, including leases, provided by automobile dealers and automobile financing companies. Bankcard accounts (or credit card accounts) are revolving accounts for banks, bankcard companies, national credit card companies, credit unions and savings & loan associations. Student Loans include loans to finance educational expenses provided by banks, credit unions and other financial institutions as well as federal and state governments. The Other category includes Consumer Finance (sales financing, personal loans) and Retail (clothing, grocery, department stores, home furnishings, gas etc) loans.
Our analysis excludes authorized user trades, disputed trades, lost/stolen trades, medical trades, child/family support trades, commercial trades and, as discussed above, inactive trades (accounts not reported on within the last 3 months).
Total debt balance. Total balance across all accounts, excluding those in bankruptcy.
Number of open, new and closed accounts. Total number of open accounts, number of accounts opened within the last 12 months. Number of closed accounts is defined as the difference between the number of open accounts 12 months ago plus the number of accounts opened within the last 12 months, minus the total number of open accounts at the current date.
Inquiries. Number of credit-related consumer-initiated inquiries reported to the credit reporting agency in the past 6 months. Only ‘hard pulls’ are included, which are voluntary inquiries generated when a consumer authorizes lenders to request a copy of their credit report. It excludes inquiries made by creditors about existing accounts (for example to determine whether they want to send the customer pre-approved credit applications or to verify the accuracy of customer-provided information) and inquiries made by consumers themselves. Note that inquiries are credit reporting company specific and not all inquiries associated with credit activities are reported to each credit reporting agency. Moreover, the reporting practices for the credit reporting companies may have changed during the period of analysis.
High credit and balance for credit cards. Total amount of high credit on all credit cards held by the consumer. High credit is either the credit limit, or highest balance ever reported during history of this loan. As reported by Avery et al (2003) the use of the highest-balance measure for credit limits on accounts in which limits are not reported likely understates the actual credit limits available on those accounts.
High credit and balance for HE Revolving. Same as for credit cards, but now applied to HELOCs.
Credit utilization rates (for revolving accounts). Computed as proportion of available credit in use (outstanding balance divided by credit limit), and for reasons discussed above are likely to overestimate actual credit utilization.
6 Flow of Funds Accounts of the United States, Flows and Outstandings, Third Quarter 2009, Board of Governors, Table L.100. 7 Our debt totals exclude debt held by individuals without social security numbers. Additional information suggests that total debt held by
such individuals is relatively small and accounts for little of the difference.
42
Delinquency status. Varies between current (paid as agreed), 30-day late (between 30 and 59 day late; not more than 2 payments past due), 60-day late (between 60 and 89 days late; not more than 3 payments past due), 90-day late (between 90 and 119 days late; not more than 4 payments past due), 120-day late (at least 120 days past due; 5 or more payments past due) or collections, and severely derogatory (any of the previous states combined with reports of a repossession, charge off to bad debt or foreclosure). Not all creditors provide updated information on payment status, especially after accounts have been derogatory for a longer period of time. Thus the payment performance profiles obtained from our data may to some extent reflect reporting practices of creditors.
Percent of balance 90+ days late. Percent of balance that is either 90-day late, 120-day late or severely derogatory. 90+ days late is synonymous to seriously delinquent.
New foreclosures. Number of individuals with foreclosures first appearing on their credit report during the past 3 months. Based on foreclosure information provided by lenders (account level foreclosure information) as well as through public records. Note that since borrowers may have multiple real estate loans, this measure is conceptually different from foreclosure rates often reported in the press. For example, a borrower with a mortgage currently in foreclosure would not be counted here if he receives a foreclosure notice on an additional mortgage account. In the case of joint mortgages, both borrowers’ reports indicate the presence of a foreclosure notice in the last 3 months, and both are counted here.
New bankruptcies. New bankruptcies first reported during the past 3 months. Based on bankruptcy information provided by lenders (account level bankruptcy information) as well as through public records.
Collections. Number and amount of 3rd party collections (i.e. collections not being handled by original creditor) on file within the last 12 months. Includes both public record and account level 3rd party collections information. As reported by Avery et al (2003), only a small proportion of collections are related to credit accounts with the majority of collection actions being associated with medical bills and utility bills.
Consumer Credit Score. Credit score is the Equifax Risk Score 3.0. It was developed by Equifax and predicts the likelihood of a consumer becoming seriously delinquent (90+ days past due). The score ranges from 280-850, with a higher score being viewed as a better risk than someone with a lower score.
New (seriously) delinquent balances and transition rates. New (seriously) delinquent balance reported in each loan category. For mortgages, this is based on the balance of each account at the time it enters (serious) delinquency, while for other loan types it is based on the net increase in the aggregate (seriously) delinquent balance for all accounts of that loan type belonging to an individual. Transition rates. The transition rate is the new (seriously) delinquent balance, expressed as a percent of the previous quarter’s balance that was not (seriously) delinquent.
Newly originated installment loan balances. We calculate the balance on newly originated mortgage loans as they first appear on an individual’s credit report. For auto loans we compare the total balance and number of accounts on an individual credit report in consecutive quarters. New auto loan originations are then defined as increases in the balance accompanied by increases in the number of accounts reported.
© 2021. Federal Reserve Bank of New York. Equifax is a registered trademark of Equifax Inc. All rights reserved.
43


![Index [] · ERL GMBH Stammhaus ERL GMBH NL Halle ERL GMBH NL Dresden ERL GMBH VB Berlin/Brandenburg Kleegartenstraße 34, 94405 Landau Ahornstraße 3b, 06246 Bad](https://img.pdfslide.net/doc/110x75/5b523f507f8b9ae22c8d18a6/index-erl-gmbh-stammhaus-erl-gmbh-nl-halle-erl-gmbh-nl-dresden-erl-gmbh.jpg)