Embed Size (px)
Citation preview

Asetek A/S – Third Quarter Report 2017
Asetek A/S CVR No. 34880522
Quarterly Report Three Months Ended September 30, 2017
Published October 25, 2017

Asetek A/S – Third Quarter Report 2017
2
Highlights
• Q3 revenue growth of 24% driven by high-end gaming cooling demand
• $1.4 million pre-tax profit and $3.0 million EBITDA adjusted in the quarter
• New desktop product developments with Lenovo and AMD
• Full-year 2017 data center revenue expectation changed: Now anticipating roughly the same level as in 2016 due to an unexpected adjustment to a large anticipated order in Q4
• Firming up full-year 2017 desktop revenue growth expectations to 15%-20% compared to the earlier announced 10%-20%
Key figures
Figures in USD (000's) Q3 2017 Q3 2016 30-Sep-17 30-Sep-16 2016Unaudited Unaudited Unaudited Unaudited
Revenue 17,652 14,249 40,270 33,009 50,921 Gross profit 6,589 5,844 14,908 13,082 19,750 Gross margin 37.3% 41.0% 37.0% 39.6% 38.8%Operating profit 1,723 2,043 1,972 2,186 4,669
Reconciliation from IFRS to EBITDA adjusted:Operating profit 1,723 2,043 1,972 2,186 4,669 Add: Depreciation and amortization 712 594 1,731 1,909 2,450 Add: Share based compensation 553 115 1,116 240 328 EBITDA adjusted (unaudited) 2,988 2,752 4,819 4,335 7,447
By Segment (Unaudited):Desktop: Desktop revenue 15,614 12,431 36,815 29,430 45,752 Desktop gross margin 38.2% 42.4% 38.0% 40.2% 39.9% Desktop EBITDA adjusted 5,081 4,519 11,259 9,496 15,142
Datacenter: Datacenter revenue 2,038 1,818 3,455 3,579 5,169 Datacenter gross margin 30.5% 31.9% 26.8% 35.4% 28.6% Datacenter EBITDA adjusted (1,571) (1,002) (5,009) (3,205) (5,079)
Headquarters: Headquarters costs* (522) (765) (1,431) (1,956) (2,616)
*Headquarters costs include intellectual property defense, HQ admin costs, litigation award; Excludes share based comp.
Total Company:
Nine months ended

Asetek A/S – Third Quarter Report 2017
3
Highlights
Financial results
• Asetek reported revenue of $17.7 million in the third quarter of 2017, a 24% increase from the third quarter of 2016. Revenue for the first nine months of 2017 amounted to $40.3 million, representing growth of 22% compared with the same period of 2016. The increases from prior year for both the third quarter and first nine months reflect higher desktop revenue driven by shipments in the DIY market.
• Gross margins were 37% for both the third quarter and the first nine months of 2017 (41% and 40% in the comparable periods of 2016). The decline in the third quarter and first nine months of 2017 was principally due to a richer mix of desktop products shipped in 2016.
• Group pre-tax income totaled $1.4 million and EBITDA adjusted was $3.0 million in the third quarter of 2017, compared with pre-tax income of $2.0 million and EBITDA adjusted of $2.8 million in the third quarter of 2016. Pre-tax income for the first nine months was $0.9 million and EBITDA adjusted was $4.8 million, compared with prior year pre-tax income of $2.1 million and EBITDA adjusted of $4.3 million.
• Third-quarter and year-to-date 2017 results reflect increased costs associated with organizational growth and share based compensation. Year-to-date results also reflect approximately $1.0 million of foreign exchange loss associated principally with the weakening of the U.S. dollar vs. the Danish krone in 2017.
Operations
• During the quarter, Asetek announced that its retention kits will be included with shipments of AMD’s new Ryzen Threadripper CPUs. Retention kits enable desktop customers to easily attach Asetek cooling systems to processors.
• Asetek announced in August that its products will liquid cool Lenovo’s Legion Y920 tower computer, a new high-performance gaming machine.
• In the third quarter, Asetek received orders for RackCDU D2C™ (Direct-to-Chip) liquid cooling from Penguin Computing for two HPC sites at U.S. Department of Energy National Laboratories.
Financial results by segment
• Desktop revenue was $15.6 million in the third quarter, an increase of 26% from the same period of 2016. Revenue in the first nine months was $36.8 million, an increase of 25% from the same period of 2016. Operating profit from the desktop segment was $5.1 million for the third quarter and $11.3 million for the first nine months, both reflecting improvement over the respective periods of 2016, due to an increase in DIY product sales.
• Data center revenue increased to $2.0 million in the third quarter, from $1.8 million in the same period of 2016. Revenue in the first nine months of 2017 totaled $3.5 million, compared with $3.6 million in the same period of 2016. Operating loss from the data center segment was $1.6 million for the third quarter and $5.0 million for the first nine months of 2017. This compares with losses of $1.0 million and $3.2 million in 2016, respectively.
• The decline in data center revenue in the first nine months was due to fewer shipments to OEM customers in Q1 2017. In anticipation of future demand for data center solutions, Asetek has added personnel in the past year, most of whom are focused on the data center business. Variability of results is expected while the Company secures new OEM partners and growth of end-user adoption through existing OEM partners.
Outlook • Due to an unexpected adjustment to a large anticipated order in Q4, the full-year 2017 data center expectation has been changed. Asetek now anticipates revenue at roughly the same level as in 2016. Outlook for the desktop segment has been firmed up to full-year revenue growth expectations of 15%-20% compared to the earlier announced 10%-20%.
• In February, the Company announced the signing of a development agreement with an undisclosed major player in the data center market. The customer is expected to launch the first product at the SC17 tradeshow in November 2017.

Asetek A/S – Third Quarter Report 2017
4
Financial review The figures below relate to the consolidated accounts for the third quarter and first nine months of 2017, which comprise activities within the two segments Desktop and Data Center. The figures are unaudited.
Income Statement (Consolidated)
Asetek reported total revenue of $17.7 million in the third quarter of 2017, reflecting growth of 24% over the same period of 2016 ($14.2 million). Total revenue in the first nine months of 2017 was $40.3 million, an increase of 22% over the same period of 2016 ($33.0 million). The increase in the third quarter and first nine months compared with prior year, reflects principally growth in shipments of desktop DIY products.
Desktop sales unit volumes for the third quarter of 2017 were 289,000, an 11% increase from the same period of last year (262,000). Unit shipments for the first nine months of 2017, represented a 17% increase compared with the same period of 2016. The increase in unit shipments in both periods was a function of strong demand in the DIY market. Average selling prices (ASPs) per unit in the third quarter and first nine months increased from the respective periods of 2016 due to variability in the mix of products shipped.
Gross margin was 37.3% for the third quarter of 2017, a decrease from 41.0% in the same period last year. Gross margin for the first nine months of 2017 decreased to 37.0% from 39.6% in the first nine months of 2016. The decrease in gross margin in both periods reflects a comparatively richer mix of products shipped in 2016.
Total operating expense increased in the third quarter and first nine months when compared with the same periods of 2016. The Company has added personnel since mid-2016 resulting in an increase in compensation costs in the third quarter and first nine months of 2017, when compared with the same periods of the prior year. Share based compensation costs associated with warrants issued to employees increased to $0.6 million and $1.1 million in the third quarter and first nine months of 2017 ($0.1 million and $0.2 million in the same periods of 2016), respectively.
Finance expenses included net foreign exchange losses of $0.3 million and $1.0 million in the third quarter and first nine months of 2017 (net $11,000 loss and $0.1 million loss in the respective periods of 2016). The year-to-date foreign exchange loss was principally a function of the weakening of the U.S. dollar against the Danish kroner by 11% during the period. The effect was offset by a positive currency translation adjustment of $1.2 million included in equity for the first nine months 2017.
Asetek reported pre-tax income of $1.4 million and $0.9 million in the third quarter and first nine months of 2017, compared with pre-tax income of $2.0 million and $2.1 million in the respective periods of 2016.

Asetek A/S – Third Quarter Report 2017
5
Balance Sheet (Consolidated)
Asetek’s total assets at September 30, 2017 amounted to $43.9 million, a $2.7 million increase from December 31, 2016. The increase in assets is principally due to positive cash flow generated by operations partially offset by the distribution of a NOK1.00 per share dividend in 2017.
Non-current assets increased by $2.8 million in the first nine months of 2017 principally due to acquisition of manufacturing equipment and software. Inventory has increased from year-end
2016 to support the increase in sales volume. Total liabilities increased $1.9 million from December 31, 2016 associated with the increase in operations. Working capital (current assets minus current liabilities) decreased by $1.3 million during the first nine months to $18.2 million at September 30, 2017. Total cash and cash equivalents was $17.7 million at September 30, 2017.
Cash Flow (Consolidated)
Net cash provided by operating activities was $4.6 million for the first nine months of 2017, compared with $7.1 million provided by operating activities in the same period of 2016.
Cash used by investing activities was $3.1 million for the first nine months of 2017, mainly related to additions in capitalized development, manufacturing equipment and software. This figure compares to $2.0 million used in the same period of 2016, and reflects the growth in the business.
Cash used by financing activities was $2.2 million in the first nine months of 2017, compared with $62,000 used in the first nine months of 2016. Cash used in first nine months of 2017 was due principally to the payment of a dividend of NOK1.00 per share. This was partially offset by cash flows received from the exercise of warrants and options by employees.
Net increase in cash and cash equivalents was $0.1 million in the first nine months of 2017, compared with an increase of $5.2 million in the same period of 2016.

Asetek A/S – Third Quarter Report 2017
6
Segment breakdown The company is reporting on two distinct segments; the Desktop segment and the Data Center segment.
The two segments are identified by their specific sets of products and specific sets of customers. The splitting of operating expenses between segments is based on the company’s best judgment, and done by using the company’s employee/project time tracking system and project codes from the accounting system. Operating expenses that are not divisible by nature (rent, telecommunication expenses, etc.) have been split according to actual time spent on the two businesses, and the company’s best estimate for attribution. Costs incurred for intellectual property defense, financing, foreign exchange and headquarters administration have been classified separately as headquarters costs and excluded from segment operating expenses as indicated.
Unaudited breakdown of the income statement
Operations - Third QuarterFigures in USD (000's)
Q3 2017 Q3 2016 Q3 2017 Q3 2016Revenues 15,614 12,431 2,038 1,818 Cost of sales 9,647 7,164 1,416 1,238 Gross Profit 5,967 5,267 622 580 Gross Margin 38.2% 42.4% 30.5% 31.9%
Total operating expenses 886 748 2,193 1,582
EBITDA adjusted 5,081 4,519 (1,571) (1,002) EBITDA margin 32.5% 36.4% N/A N/A
Desktop Data center
Operations - First Nine Months
Figures in USD (000's)YTD 2017 YTD 2016 YTD 2017 YTD 2016
Revenues 36,815 29,430 3,455 3,579 Cost of sales 22,832 17,611 2,530 2,313 Gross Profit 13,983 11,819 925 1,266 Gross Margin 38.0% 40.2% 26.8% 35.4%
Total operating expenses 2,724 2,323 5,934 4,471
EBITDA, adjusted 11,259 9,496 (5,009) (3,205) EBITDA margin 30.6% 32.3% N/A N/A
Desktop Data center
Headquarters Costs
Figures in USD (000's) Q3 2017 Q3 2016 YTD 2017 YTD 2016Litigation costs 600 443 1,597 1,104 Litigation award received (346) - (997) - Other headquarters costs 268 322 831 852 Total headquarters costs 522 765 1,431 1,956
See reconci l iation to s tatement of comprehens ive income in Key Figures on page 1.
Nine months

Asetek A/S – Third Quarter Report 2017
7
Desktop financials
Desktop revenue and margin development USD (000’s)
Asetek desktop revenue was $15.6 million in the third quarter of 2017, an increase of 26% from the third quarter of 2016. As expected, the increase resulted from significant demand in the do-it-yourself (DIY) market. In the third quarter of 2017, revenue from the DIY, Gaming/Performance Desktop PC and Workstation markets comprised 84%, 15% and 1%, respectively of total desktop revenue.
Desktop gross margin increased in the third quarter of 2017 compared with Q2 2017 after a one-off proactive replacement of customer product in Q2 2017. Gross margins historically have reflected variations in the mix of products shipped during a specific quarter.
Desktop market update and outlook
During the third quarter, Asetek announced that it will liquid cool Lenovo’s Legion Y920 tower computer, a new high-performance gaming machine. The Company also announced that its retention kits will be included with shipments of AMD’s new Ryzen Threadripper CPUs. Retention kits enable desktop customers to easily attach Asetek cooling systems to processors. In addition to the new Lenovo gaming solution, five new desktop products began shipping in the DIY market in the third quarter.
Asetek expects fourth-quarter 2017 revenue in the DIY market to grow modestly from the record level achieved in the fourth quarter of 2016. Fourth-quarter revenue in the Gaming/Performance
Desktop PC market is expected to grow modestly from the level achieved in the fourth quarter of 2016.
Due to continued positive development within the desktop segment, Asetek has firmed-up its full-year 2017 desktop revenue growth expectations to 15%-20% compared to the earlier announced 10%-20%. Revenue variability by quarter is expected to continue.
Due to the recent weakening of the U.S. dollar and increasing manufacturing cost price pressure in China, the Company expects gross margin in the fourth quarter of 2017 to decline from gross margin

Asetek A/S – Third Quarter Report 2017
8
in the third quarter of 2017. Asetek is taking proactive measures to lessen these effects.
Overall, the desktop market continues to thrive despite the challenges facing the PC industry. This success is the result of various factors, including the continuous influx of new, more powerful technologies as well as recurring releases of popular, high profile computer games. The growth is also driven by customers’ desire for a more
immersive gaming experience, which is increasing demand for new technologies such as 4K screen resolution and virtual reality capability. These new technologies require high performing graphics processors (GPUs), which also demand advanced cooling. Asetek expects continued growth from this segment in the future.
Data center financials
Financial development USD (000’s)
Asetek’s data center revenue was $2.0 million in the third quarter of 2017, compared with $1.8 million in the same period of 2016. The increase in the third quarter reflects an increase in shipments to OEMs. Revenue variability is expected to continue while the Company secures new OEM partners and growth of end-user adoption through existing OEM partners.
Data center gross margin decreased in the third quarter and first nine months of 2017 compared with the respective periods of 2016. The decrease in the first nine months was due to a component failure with one product configuration at a specific customer in the second quarter of 2017. Gross margin has also fluctuated in part due to variability in the mix of deliverables on government contracts relative to the volume of product shipments to OEMs. This variability is expected to continue into 2018.
While Asetek continues the implementation of its data center strategy, costs are driven by investments in technology development, manufacturing, and sales development with data center partners and OEM customers.
Data center market update and outlook
The high performance computing (HPC) industry’s increasing demand for high density combined with extreme high performance is leading an industry-wide trend toward higher wattage CPUs and GPUs. At normal density, the heat emitted by these high- powered processors is no longer addressable by air
cooling alone. As a result, this trend is accelerating the adoption of Asetek’s data center liquid cooling.
In February, the Company announced the signing of a development agreement with an undisclosed major player in the data center market. The customer is expected to launch the first product at
Asetek A/S – Third Quarter Report 2017
9
the SC17 tradeshow in November 2017, with revenue to Asetek beginning at that time.
Through new orders received from data center OEM partners in the first nine months of 2017, the Company is increasing its end-user adoption with technology deployed to new HPC installations. In the third quarter 2017, Asetek received multiple orders from Penguin Computing for RackCDU D2C™ (Direct-to-Chip) liquid cooling for two HPC sites at U.S. Department of Energy National Laboratories. Data center product orders received are recognized as revenue when the product is shipped, typically eight to twelve weeks after the order is received.
Progress on Asetek’s three-year contract with the U.S. Department of Defense (DoD) continued in the third quarter, generating revenue of $0.2 million, principally from installation activities at an unnamed data center site. This project is expected to be completed in mid-2018.
Today, Asetek has major liquid cooling installations at multiple HPC sites in the North America, Asia and Europe and is liquid cooling nine of the world’s most powerful supercomputers listed in the June 2017 Top500 and Green500.
Fujitsu is using Asetek’s liquid cooling to remove heat from processors and other high power components in its PRIMERGY servers to cost effectively deliver maximum performance and high cluster density. Recent projects have included Oakforest-PACS, one of the most powerful supercomputers in Japan, as well as QPACE3 owned by the University of Regensburg Germany. Both systems are ranked in the Top500 and Green500.
Penguin Computing incorporates RackCDU D2C™ liquid cooling into its Tundra™ Extreme Scale (ES)
HPC and Relion 2900 servers. Penguin’s end customers include the U.S. National Nuclear Security Administration’s CTS-1 systems deployment at three national laboratories. Four of these CTS-1 systems incorporate Asetek’s liquid cooling and all are both Top500 and Green500 listed supercomputers.
Asetek’s strategy in the data center market is to increase end-user adoption within existing OEM customers, and to add new OEM customers. The Company plans to achieve this by continuing to develop and defend its market-leading technology and leverage the successful performance achieved at its installed base of universities, enterprises and government entities.
Asetek has increased staffing and manufacturing capacity to support the planned growth of the data center business. Beginning July 1, 2017, Asetek expanded usage of its 4,700 square meter operating facility in Denmark resulting in the addition of 2,200 square meters of space that was previously subleased to a tenant. The majority of this additional space will be utilized for data center manufacturing & development operations. The additional operational expenditure associated with the extra space is approximately $0.2 million per year.
Due to an unexpected adjustment to a large anticipated order in Q4, the full-year 2017 data center revenue expectation has been changed. Asetek now anticipates revenue at roughly the same level as in 2016. Future revenue and operating results are however expected to fluctuate as partnerships with large OEMs are developed.
Asetek A/S – Third Quarter Report 2017
10
Intellectual Property Asetek holds a portfolio of intellectual property (IP) rights including patents providing competitive advantages and high barriers to entry for competitors. Currently Asetek has pending patent and utility model applications worldwide, with additional applications under preparation.
As part of efforts to build and maintain its market share, the Company continues to closely review and assess all competitive offerings for infringement of its patents. The Company has strengthened its intellectual property platform and competitiveness via several positive lawsuit outcomes in prior years.
The Company is involved in various ongoing legal disputes, including the following matters:
In December 2014, the U.S. District Court unanimously ruled in favor of Asetek on all claims in a patent infringement lawsuit against CMI USA, Inc. (“CMI”). Upon appeal by CMI, the Federal Circuit U.S. Court of Appeals affirmed the prior rulings regarding infringement, validity, damages and injunction against CMI, reversed the injunction solely against Cooler Master based on the current record, and remanded to the district court for further investigation regarding whether Cooler Master should also be enjoined along with CMI. The proceedings were settled in September 2017 by a
confidential settlement agreement by Asetek, Cooler Master, and CMI. Asetek has received approximately $1.0 million in awards associated with this litigation. In a related case, in September 2017, Asetek executed a settlement agreement and permanent injunction with an online retailer that prohibits the retailer from offering for sale the infringing Cooler Master products.
On September 30, 2014, Asia Vital Components Co., Ltd. filed suit against Asetek in the Eastern District of Virginia, requesting a declaratory judgment of non-infringement and invalidity of Asetek's ’362 and 764 patents. Asetek disputes these allegations. In December 2016 the case was transferred to the Northern District of California. The parties are preparing for a hearing in December 2017. No trial date has been set.
In April 2016, Asetek initiated patent infringement proceedings against Cooler Master and Coolergiant before the District Court The Hague, pertaining to commerce in The Netherlands. In the case against Cooler Master, by decision on September 20, 2017, the Court dismissed Asetek’s claim. Currently Asetek is examining whether to appeal the decision.

Asetek A/S - Third Quarter Report 2017
11
Risk FactorsThe Company has historically incurred operating losses and is in the development stages of its data center business.
The Company’s revenue growth is dependent on the market acceptance of its data center offerings and the release of new products from server OEM customers to facilitate its trial system deployments. Revenue in the desktop segment is subject to fluctuations and is dependent, in part, on the popularity and new releases of end user products by Asetek’s customers.
In the first nine months of 2017, two customers accounted for 38% and 20% of total revenue. In the event of a decline or loss of either of these significant customers, replacement of the revenue stream would be difficult for Asetek to achieve in the short term. Asetek is actively pursuing strategies to broaden its customer base in efforts to mitigate this risk, and has generated increasing rates of revenue growth in 2017 from other customers.
Asetek relies upon suppliers and partners to supply products and services at competitive prices. Asetek’s desktop products have been historically assembled by a single contract manufacturer which
may be difficult to substitute in the short term if the need should arise. Asetek mitigates the supplier risk with Company-owned supplemental manufacturing lines which can be utilized if necessary.
Asetek has filed and defended lawsuits against competitors for patent infringement. While some of the recent cases have been settled or dismissed, some may continue, and new cases may be initiated. Such cases may proceed for an extended period and could potentially lead to an unfavorable outcome to Asetek. Asetek has incurred significant legal costs associated with litigation and may continue to do so in the future to the extent management believes it is necessary to protect intellectual property.
Asetek operates internationally in Denmark, USA, China, and Taiwan and is subject to foreign exchange risk. As of September 30, 2017, its principal cash holdings are maintained in deposit accounts in U.S. dollars and Danish krone.
A more thorough elaboration on risk factors can be found in the Company’s Annual Report for 2016, available from the Company’s website: www.asetek.com

Asetek A/S - Third Quarter Report 2017
12
Condensed Interim Financial Statements
Consolidated Statement of Comprehensive Income
These financial statements should be read in conjunction with the accompanying notes.
Figures in USD (000's) Q3 2017 Q3 2016 30-Sep-17 30-Sep-16 2016Unaudited Unaudited Unaudited Unaudited
Revenue 17,652$ 14,249$ 40,270$ 33,009$ 50,921$ Cost of sales 11,063 8,405 25,362 19,927 31,171 Gross profit 6,589 5,844 14,908 13,082 19,750
Research and development 1,099 834 2,989 2,390 3,428 Sell ing, general and administrative 4,113 2,967 10,944 8,506 11,653 Other income (346) - (997) - - Total operating expenses 4,866 3,801 12,936 10,896 15,081
Operating income 1,723 2,043 1,972 2,186 4,669
Foreign exchange (loss) gain (319) (11) (991) (95) 330 Finance costs (22) (6) (34) (29) (8) Total financial income (expenses) (341) (17) (1,025) (124) 322
Income before tax 1,382 2,026 947 2,062 4,991
Income tax (expense) benefit (6) 29 (45) (3) 4,646
Income for the period 1,376 2,055 902 2,059 9,637
Other comprehensive income items that may be reclassified to profit or loss in subsequent periods:Foreign currency translation adjustments 490 20 1,217 120 (455)
Total comprehensive income 1,866$ 2,075$ 2,119$ 2,179$ 9,182$
Income per share (in USD):Basic 0.05$ 0.08$ 0.04$ 0.08$ 0.39$ Diluted 0.05$ 0.08$ 0.03$ 0.08$ 0.38$
Nine months ended

Asetek A/S - Third Quarter Report 2017
13
Consolidated Balance Sheet
These financial statements should be read in conjunction with the accompanying notes.
Figures in USD (000's) 30 Sept 2017 31 Dec 2016ASSETS Unaudited
Non-current assetsIntangible assets 2,573$ 1,871$ Property and equipment 3,421 1,684 Deferred income tax assets 5,107 4,874 Other assets 722 642 Total non-current assets 11,823 9,071
Current assetsInventory 1,799 1,158 Trade receivables and other 12,550 13,325 Cash and cash equivalents 17,739 17,610 Total current assets 32,088 32,093
Total assets 43,911$ 41,164$
EQUITY AND LIABILITIES
EquityShare capital 418$ 417$ Retained earnings 27,762 28,130 Translation and other reserves 963 (257) Total equity 29,143 28,290
Non-current liabilitiesLong-term debt 834 264 Total non-current liabilities 834 264
Current liabilitiesShort-term debt 702 524 Accrued liabil ities 2,318 1,305 Accrued compensation & employee benefits 1,577 1,413 Trade payables 9,337 9,368 Total current liabilities 13,934 12,610
Total liabilities 14,768 12,874 Total equity and liabilities 43,911$ 41,164$
Asetek A/S - Third Quarter Report 2017
14
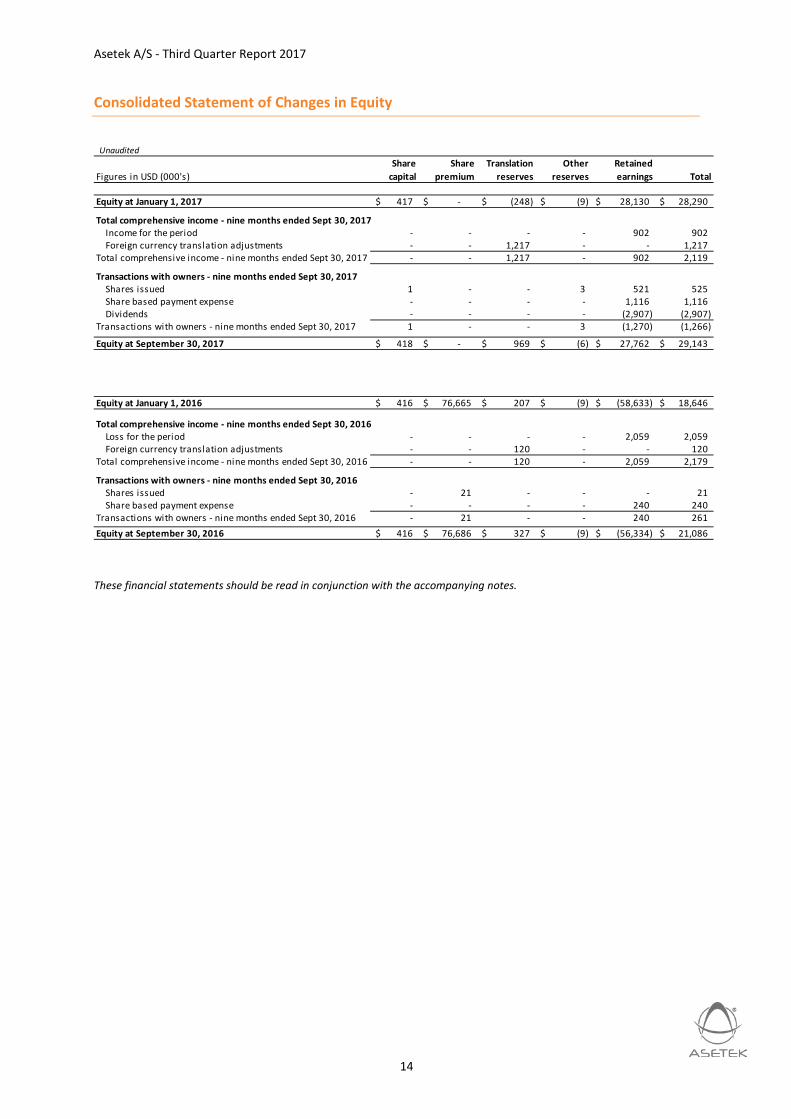
Consolidated Statement of Changes in Equity
These financial statements should be read in conjunction with the accompanying notes.
Unaudited
Figures in USD (000's)Share
capitalShare
premiumTranslation
reservesOther
reservesRetained earnings Total
Equity at January 1, 2017 417$ -$ (248)$ (9)$ 28,130$ 28,290$
Total comprehensive income - nine months ended Sept 30, 2017Income for the period - - - - 902 902 Foreign currency translation adjustments - - 1,217 - - 1,217
Total comprehensive income - nine months ended Sept 30, 2017 - - 1,217 - 902 2,119
Transactions with owners - nine months ended Sept 30, 2017Shares issued 1 - - 3 521 525 Share based payment expense - - - - 1,116 1,116 Dividends - - - - (2,907) (2,907)
Transactions with owners - nine months ended Sept 30, 2017 1 - - 3 (1,270) (1,266)
Equity at September 30, 2017 418$ -$ 969$ (6)$ 27,762$ 29,143$
Equity at January 1, 2016 416$ 76,665$ 207$ (9)$ (58,633)$ 18,646$
Total comprehensive income - nine months ended Sept 30, 2016Loss for the period - - - - 2,059 2,059 Foreign currency translation adjustments - - 120 - - 120
Total comprehensive income - nine months ended Sept 30, 2016 - - 120 - 2,059 2,179
Transactions with owners - nine months ended Sept 30, 2016Shares issued - 21 - - - 21 Share based payment expense - - - - 240 240
Transactions with owners - nine months ended Sept 30, 2016 - 21 - - 240 261 Equity at September 30, 2016 416$ 76,686$ 327$ (9)$ (56,334)$ 21,086$

Asetek A/S - Third Quarter Report 2017
15
Consolidated Cash Flow Statement
These financial statements should be read in conjunction with the accompanying notes.
Figures in USD (000's) 30-Sep-17 30-Sep-16 2016Unaudited Unaudited
Cash flows from operating activitiesIncome for the period 902$ 2,059$ 9,637$ Depreciation and amortization 1,731 1,909 2,450 Finance costs (income) 34 29 8 Income tax expense (benefit) 44 3 (4,646) Impairment of intangible assets - 6 28 Cash receipt (payment) for income tax (38) (3) (40) Share based payments expense 1,115 240 328 Changes in trade receivables, inventories, other assets 1,571 287 (3,895) Changes in trade payables and accrued liabil ities (806) 2,594 3,936 Net cash provided by (used in) operating activities 4,553 7,124 7,806
Cash flows from investing activitiesAdditions to intangible assets (1,813) (1,402) (1,835) Purchase of property and equipment (1,272) (549) (1,077) Net cash used in investing activities (3,085) (1,951) (2,912)
Cash flows from financing activitiesFunds drawn (paid) against l ine of credit (20) (5) 142 Proceeds from issuance of share capital 529 21 133 Payment of dividends (2,491) - - Principal and interest payments on finance leases (175) (78) (100) Net cash provided by (used in) financing activities (2,157) (62) 175
Effect of exchange rate changes on cash and cash equivalents 818 122 (519)
Net changes in cash and cash equivalents 129 5,233 4,550 Cash and cash equivalents at beginning of period 17,610 13,060 13,060 Cash and cash equivalents at end of period 17,739$ 18,293$ 17,610$
Supplemental disclosures - Property and equipment acquired under finance leases 813$ 97$ 140$
Nine months ended

Asetek A/S - Third Quarter Report 2017
16
Notes to the quarterly financial statements
1. General information Asetek A/S (‘the Company’), and its subsidiaries (together, ‘Asetek Group’, ‘the Group’ or ‘Asetek’) designs, develops and markets thermal management solutions used in computers and data center servers. The Group’s core products utilize liquid cooling technology to provide improved performance, acoustics and energy efficiency. The Company is based in Aalborg, Denmark with offices in USA, China and Taiwan. The Company’s shares trade on the Oslo Stock Exchange under the symbol ‘ASETEK’.
These condensed consolidated financial statements for the quarter ended September 30, 2017 have been prepared on a historical cost convention in accordance with International Accounting Standard 34 (IAS 34) ‘Interim Financial Reporting’ as adopted by the European Union (EU) and do not include all of the information and disclosure required in the annual consolidated financial statements. These statements should be read in conjunction with the Asetek A/S 2016 Annual Report.
The accounting policies adopted in preparation of these condensed consolidated financial statements are consistent with those followed in the preparation of the Company’s annual consolidated financial statements for the year ended December 31, 2016.
The Group operates in an industry where seasonal or cyclical variations in total sales are not normally experienced during the financial year.
2. Equity A cash dividend in respect of the year ended December 31, 2016 of NOK1.00 per share, for a total of $2.9 million, was approved at the annual general meeting in April 2017.
In July 2017, the Company granted 106,999 warrants to management. Each warrant has an exercise price of NOK 113.00 (USD 13.49) per share and becomes exercisable gradually over a period of four years. In April 2017, the Company granted a total of 509,687 warrants to management and board members. Each warrant has an exercise price of NOK 76.25 (USD $8.91) per share and becomes exercisable gradually over a period of one or four years. Using the Black-Scholes pricing model, the estimated fair value of the total warrants granted in the first nine months of 2017 is approximately $2.7 million.
At September 30, 2017, there were 25.2 million common shares outstanding and 0.3 million shares in treasury. Treasury shares may be used to fulfill a portion of share options and warrants outstanding which total approximately 2.3 million. Share based payment expense associated with total warrants and options outstanding was $1.1 million and $0.2 million in the nine months ended September 30, 2017 and 2016, respectively.
3. Intangible assets The Group’s business includes a significant element of research and development activity. Under IAS 38, there is a requirement to capitalize and amortize development spend to match costs to expected benefits from projects deemed to be commercially viable. Costs capitalized are recorded on the balance sheet as intangible assets, net of amortization. In the first nine months of 2017, the Company capitalized approximately $1.8 million of development costs and recorded amortization of approximately $1.1 million (capitalized costs of $1.4 million and amortization of $1.4 million in first nine months of 2016).

Asetek A/S - Third Quarter Report 2017
17
4. Earnings (losses) per share IAS 33 requires disclosure of basic and diluted earnings per share for entities whose shares are publicly traded. Basic earnings per share is calculated by dividing the profit or loss attributable to equity holders of the Company by the weighted average number of common shares outstanding during the period. Diluted earnings per share is calculated by adjusting the number of common shares outstanding used in the Basic calculation for the effect of dilutive equity instruments, which include options, warrants and debt or preferred shares that are convertible to common shares, to the extent their inclusion in the calculation would be dilutive.
5. Transactions with related parties In addition to the Company’s grant of warrants referenced in Note 2, the following represent additional transactions with related parties. The Company’s chairman is a member of the board of directors of Corsair, a customer of the Company. During the nine months ended September 30, 2017 and 2016, Asetek had sales of inventory to Corsair of $15.5 million and $17.8 million, respectively. As of September 30, 2017 and 2016, Asetek had outstanding trade receivables from Corsair of $3.8 million and $4.9 million, respectively. The Company’s CEO serves as Chairman of the Board for a vendor that supplies information technology services to the Company. In the nine months ended September 30, 2017 and 2016, the Company purchased services totaling approximately $0.3 million and $0.2 million, respectively, from this vendor.
Third QuarterQ3 2017 Q3 2016
Income attributable to equity holders of the Company (USD 000's) 1,376$ 2,055$ Weighted average number of common shares outstanding (000's) 25,170 24,842 Basic income per share 0.05$ 0.08$
Weighted average number of common shares oustanding (000's) 25,170 24,842 Instruments with potentially dilutive effect: Warrants and options 1,517 759
Weighted average number of common shares oustanding, diluted 26,687 25,601
Diluted income per share 0.05$ 0.08$
Year to date30-Sep-17 30-Sep-16
Income attributable to equity holders of the Company (USD 000's) 902$ 2,059$ Weighted average number of common shares outstanding (000's) 25,083 24,837 Basic income per share 0.04$ 0.08$
Weighted average number of common shares oustanding 25,083 24,837 Instruments with potentially dilutive effect: Warrants and options 1,384 560
Weighted average number of common shares oustanding, diluted 26,467 25,397
Diluted income per share 0.03$ 0.08$
Nine months ended

Asetek A/S - Third Quarter Report 2017
18
6. New accounting standard for income taxes In June 2017, the International Accounting Standards Board (IASB) issued IFRS interpretation IFRIC 23 — Uncertainty over Income Tax Treatments. This standard clarifies how to apply the recognition and measurement requirements of International Accounting Standard 12, Income Taxes, when there is uncertainty in income tax treatments. According to IFRIC 23, an entity must determine the probability of the relevant tax authority accepting each tax treatment used in their income tax filing, including considering the expected value of the tax treatment when determining taxable profit (tax loss), tax bases, unused tax losses, unused tax credits and tax rates. The effective date for adoption of IFRIC 23 is annual periods beginning on or after January 1, 2019, though early adoption is permitted. The Company is currently evaluating the effect that IFRIC 23 will have on the consolidated financial statements.
7. IFRS accounting compared with U.S. GAAP Since 2011, the Company’s annual consolidated financial statements have been prepared in accordance with International Financial Reporting Standards (IFRS). Previously, the Company’s consolidated financial statements were prepared in accordance with U.S. generally accepted accounting principles (GAAP). The following represent the principal effects to Asetek’s financial statements as a result of this change:
Intangible assets. Capitalization of costs associated with product development is required under IFRS but is not required under GAAP. Intangible assets of $2.57 million on the Company’s balance sheet at September 30, 2017 represent the capitalization of product development costs, net of amortization. The associated amortization over the products’ lifecycle is charged as an operating expense.
Share based compensation. IFRS requires that each installment of a share based payment award be treated as a separate grant and separately measured and attributed to expense over the vesting period. As a result, calculation of share based payment expense under IFRS generally results in recognition of a greater amount of expense earlier in the life of the option grant than the comparable calculation under GAAP.
Asetek A/S - Third Quarter Report 2017
19
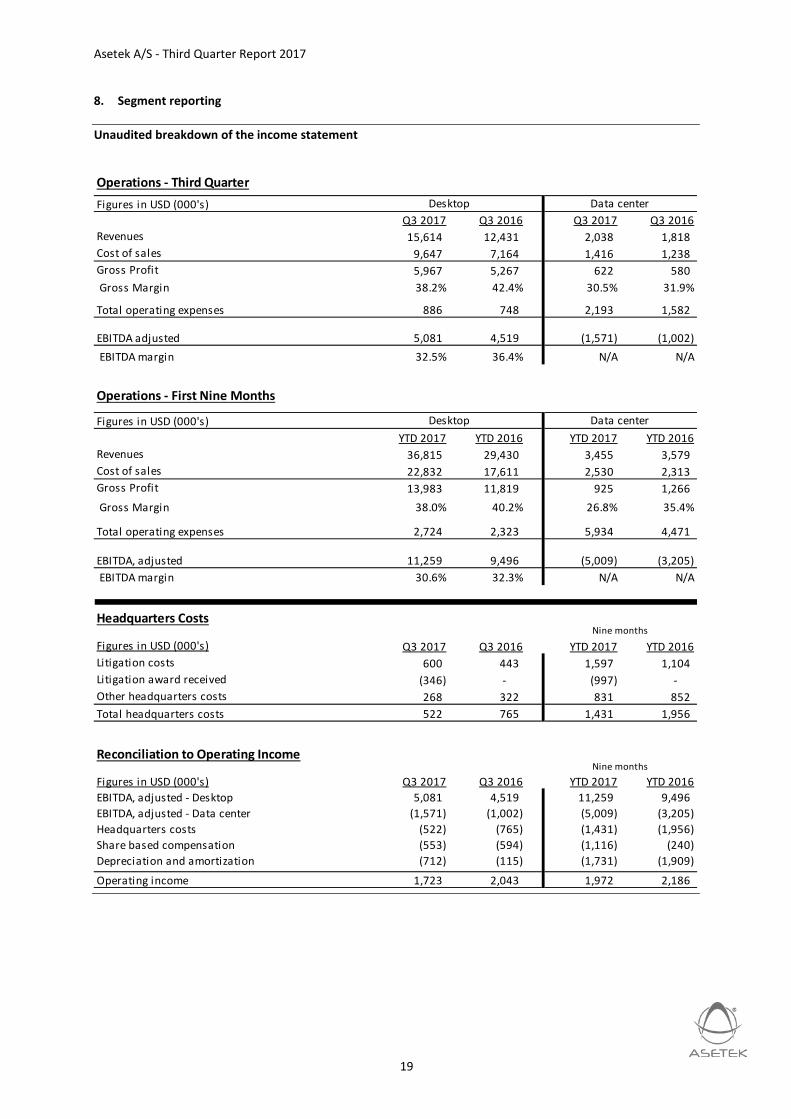
8. Segment reporting
Unaudited breakdown of the income statement
Operations - Third QuarterFigures in USD (000's)
Q3 2017 Q3 2016 Q3 2017 Q3 2016Revenues 15,614 12,431 2,038 1,818 Cost of sales 9,647 7,164 1,416 1,238 Gross Profit 5,967 5,267 622 580 Gross Margin 38.2% 42.4% 30.5% 31.9%
Total operating expenses 886 748 2,193 1,582
EBITDA adjusted 5,081 4,519 (1,571) (1,002) EBITDA margin 32.5% 36.4% N/A N/A
Operations - First Nine Months
Figures in USD (000's)YTD 2017 YTD 2016 YTD 2017 YTD 2016
Revenues 36,815 29,430 3,455 3,579 Cost of sales 22,832 17,611 2,530 2,313 Gross Profit 13,983 11,819 925 1,266 Gross Margin 38.0% 40.2% 26.8% 35.4%
Total operating expenses 2,724 2,323 5,934 4,471
EBITDA, adjusted 11,259 9,496 (5,009) (3,205) EBITDA margin 30.6% 32.3% N/A N/A
Headquarters Costs
Figures in USD (000's) Q3 2017 Q3 2016 YTD 2017 YTD 2016Litigation costs 600 443 1,597 1,104 Litigation award received (346) - (997) - Other headquarters costs 268 322 831 852 Total headquarters costs 522 765 1,431 1,956
Nine months
Desktop Data center
Desktop Data center
Reconciliation to Operating Income
Figures in USD (000's) Q3 2017 Q3 2016 YTD 2017 YTD 2016EBITDA, adjusted - Desktop 5,081 4,519 11,259 9,496 EBITDA, adjusted - Data center (1,571) (1,002) (5,009) (3,205) Headquarters costs (522) (765) (1,431) (1,956) Share based compensation (553) (594) (1,116) (240) Depreciation and amortization (712) (115) (1,731) (1,909)
Operating income 1,723 2,043 1,972 2,186
Nine months

Asetek A/S - Third Quarter Report 2017
20
Statement by the Board of Directors and ManagementThe Board of Directors and the Management have considered and adopted the Quarterly Report of Asetek A/S for the period 1 January – 30 September 2017. The Interim Report is presented in accordance with the International Accounting Standard IAS 34 on Interim Financial Reporting and additional Danish disclosure requirements. The accounting policies applied in the Interim Report are unchanged from those applied in the Group’s Annual Report for 2016.
We consider the accounting policies appropriate, the accounting estimates reasonable and the
overall presentation of the Interim Report adequate. Accordingly, we believe that the Interim Report gives a true and fair view of Asetek’s consolidated financial position, results of operations and cash flows for the period.
In our opinion, the Interim Report includes a true and fair account of the matters addressed and describes the most significant risks and elements of uncertainty facing Asetek. The Interim Report has not been audited or reviewed by the auditors.
Asetek A/S
Aalborg, 25 October 2017
Management:
André S. Eriksen CEO
Peter Dam Madsen CFO
Board of Directors:
Sam Szteinbaum Chairman Joergen Smidt
Member
Chris J. Christopher Member Knut Øversjøen
Member
Jim McDonnell Member

Asetek A/S – Third Quarter Report 2017
21
Contact:
André S. Eriksen, CEO: +45 2125 7076
Peter Dam Madsen, CFO: +45 2080 7200
Company Information: Asetek A/S Assensvej 2 DK9220 Aalborg East Denmark Phone: +45 9645 0047 Fax: +45 9645 0048 Web site: www.asetek.com Email: [email protected]

![,6758=,21, 3(5 /$ 5('$=,21( '(/ 352*5$00$ 75,(11 ... · ,vwlwxwr shu o lqqryd]lrqh h wudvsduhq]d ghjol dssdowl h od frpsdwlelolwj dpelhqwdoh ,6758=,21, 3(5 /$ 5('$=,21( '(/ 352*5$00$](https://img.pdfslide.net/doc/110x75/5eddde28ad6a402d666916da/675821-35-521-352500-7511-vwlwxwr-shu-o-lqqrydlrqh.jpg)
![,6758=,21, 3(5 /$ 5,/(9$=,21( '(, 7$66, ())(77,9, */2% ... · ,vwux]lrql shu od ulohyd]lrqh ghl wdvvl hiihwwlyl joredol phgl ± &rqvxowd]lrqh 6(=,21( , ,6758=,21, 3(5 /$ 6(*1$/$=,21(](https://img.pdfslide.net/doc/110x75/5f612e2258001969af274806/675821-35-5921-766-779-2-vwuxlrql-shu-od-ulohydlrqh.jpg)


![,67,7872 683(5,25( ,6758=,21( 6(&21'$5,$ 67$7$/( '21 / 0 ......'21 / 0,/$1, ,67,7872 683(5,25( ,6758=,21( 6(&21'$5,$ 67$7$/(75$'$7( 9$ &odvvh gl &rqfruvr $ 6flhq]h whfqrorjlh h whfqlfkh](https://img.pdfslide.net/doc/110x75/60000d02084a1c1bab29deda/677872-683525-675821-6215-677-21-0-21-01.jpg)