Embed Size (px)
Citation preview
Q2 AUGUST 2021
QUARTERLY BID BAROMETERBusiness Improvement Districts in the British Isles
Featuring footfall analysis of 39 Coastal Town BIDs
Based on figures from 1st April – 30th June 2021
TownandPlace.AI
EXECUTIVE SUMMARY
2 | British BIDs: Quarterly BID Barometer Q2 2021 British BIDs: Quarterly BID Barometer Q2 2021 | 3
INTRODUCTION
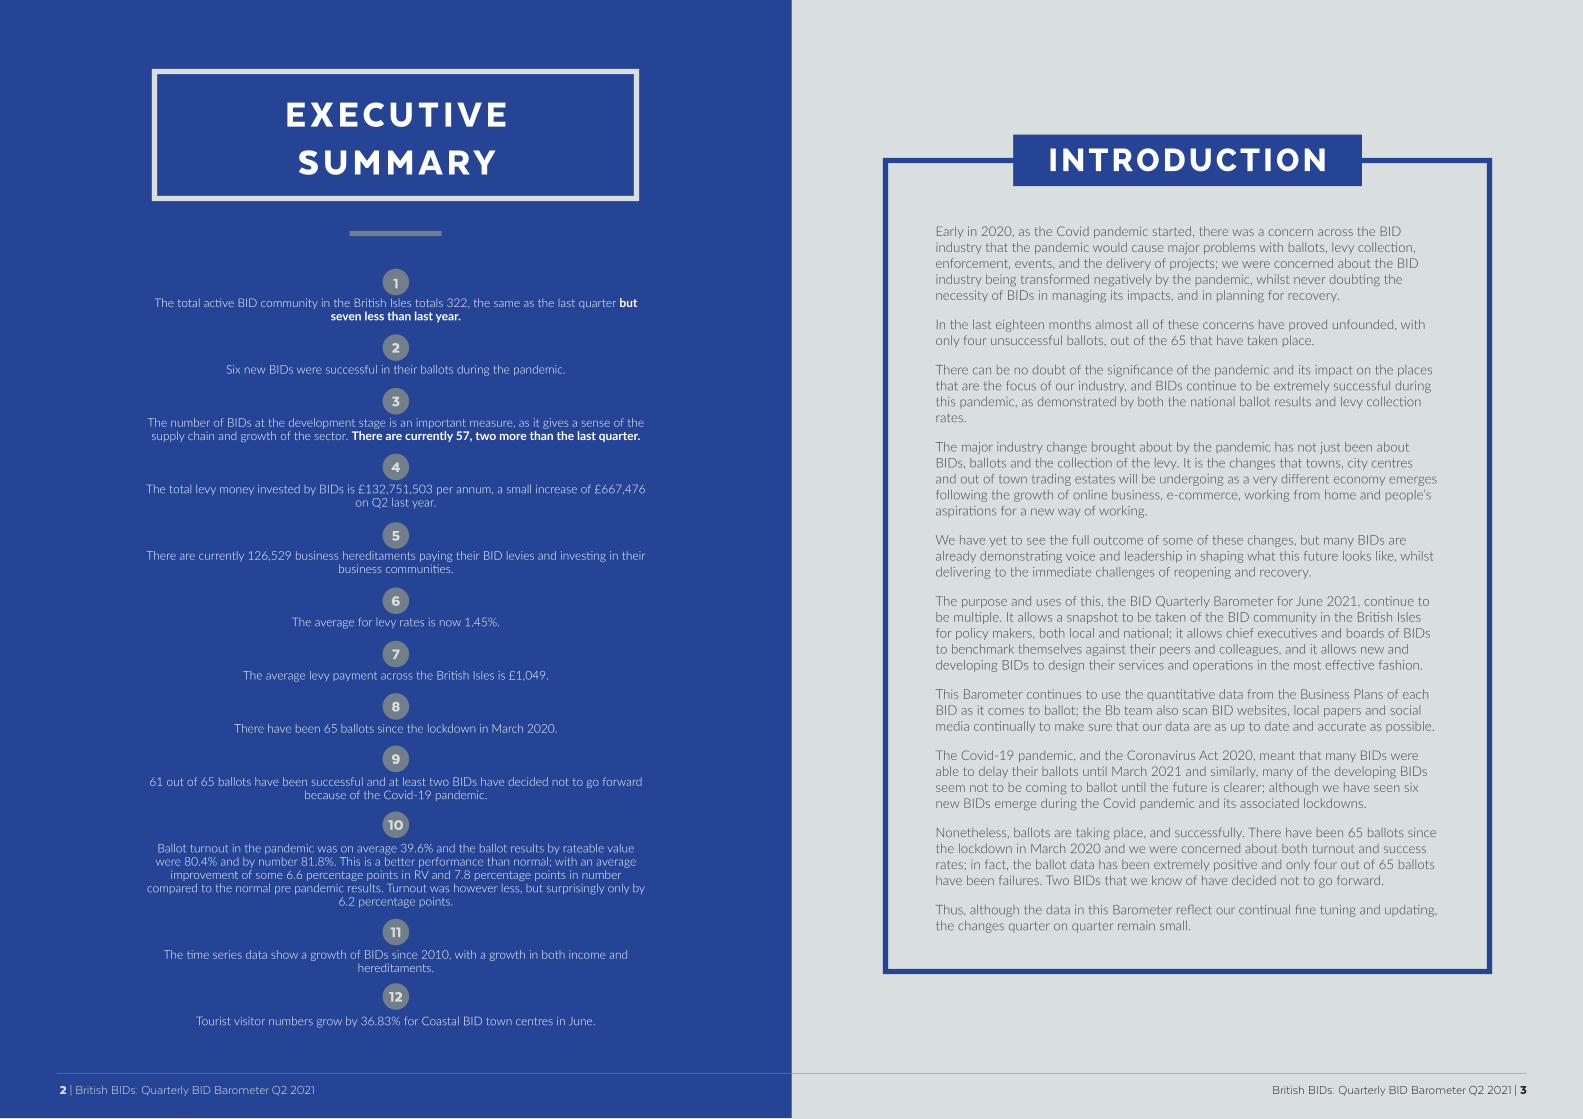
Early in 2020, as the Covid pandemic started, there was a concern across the BID industry that the pandemic would cause major problems with ballots, levy collection, enforcement, events, and the delivery of projects; we were concerned about the BID industry being transformed negatively by the pandemic, whilst never doubting the necessity of BIDs in managing its impacts, and in planning for recovery.
In the last eighteen months almost all of these concerns have proved unfounded, with only four unsuccessful ballots, out of the 65 that have taken place.
There can be no doubt of the significance of the pandemic and its impact on the places that are the focus of our industry, and BIDs continue to be extremely successful during this pandemic, as demonstrated by both the national ballot results and levy collection rates.
The major industry change brought about by the pandemic has not just been about BIDs, ballots and the collection of the levy. It is the changes that towns, city centres and out of town trading estates will be undergoing as a very different economy emerges following the growth of online business, e-commerce, working from home and people’s aspirations for a new way of working.
We have yet to see the full outcome of some of these changes, but many BIDs are already demonstrating voice and leadership in shaping what this future looks like, whilst delivering to the immediate challenges of reopening and recovery.
The purpose and uses of this, the BID Quarterly Barometer for June 2021, continue to be multiple. It allows a snapshot to be taken of the BID community in the British Isles for policy makers, both local and national; it allows chief executives and boards of BIDs to benchmark themselves against their peers and colleagues, and it allows new and developing BIDs to design their services and operations in the most effective fashion.
This Barometer continues to use the quantitative data from the Business Plans of each BID as it comes to ballot; the Bb team also scan BID websites, local papers and social media continually to make sure that our data are as up to date and accurate as possible.
The Covid-19 pandemic, and the Coronavirus Act 2020, meant that many BIDs were able to delay their ballots until March 2021 and similarly, many of the developing BIDs seem not to be coming to ballot until the future is clearer; although we have seen six new BIDs emerge during the Covid pandemic and its associated lockdowns.
Nonetheless, ballots are taking place, and successfully. There have been 65 ballots since the lockdown in March 2020 and we were concerned about both turnout and success rates; in fact, the ballot data has been extremely positive and only four out of 65 ballots have been failures. Two BIDs that we know of have decided not to go forward.
Thus, although the data in this Barometer reflect our continual fine tuning and updating, the changes quarter on quarter remain small.
The total active BID community in the British Isles totals 322, the same as the last quarter but seven less than last year.
Six new BIDs were successful in their ballots during the pandemic.
The number of BIDs at the development stage is an important measure, as it gives a sense of the supply chain and growth of the sector. There are currently 57, two more than the last quarter.
The total levy money invested by BIDs is £132,751,503 per annum, a small increase of £667,476 on Q2 last year.
There are currently 126,529 business hereditaments paying their BID levies and investing in their business communities.
The average for levy rates is now 1.45%.
The average levy payment across the British Isles is £1,049.
There have been 65 ballots since the lockdown in March 2020.
61 out of 65 ballots have been successful and at least two BIDs have decided not to go forward because of the Covid-19 pandemic.
Ballot turnout in the pandemic was on average 39.6% and the ballot results by rateable value were 80.4% and by number 81.8%. This is a better performance than normal; with an average
improvement of some 6.6 percentage points in RV and 7.8 percentage points in number compared to the normal pre pandemic results. Turnout was however less, but surprisingly only by
6.2 percentage points.
The time series data show a growth of BIDs since 2010, with a growth in both income and hereditaments.
Tourist visitor numbers grow by 36.83% for Coastal BID town centres in June.
1
2
3
4
5
6
7
8
9
10
11
12
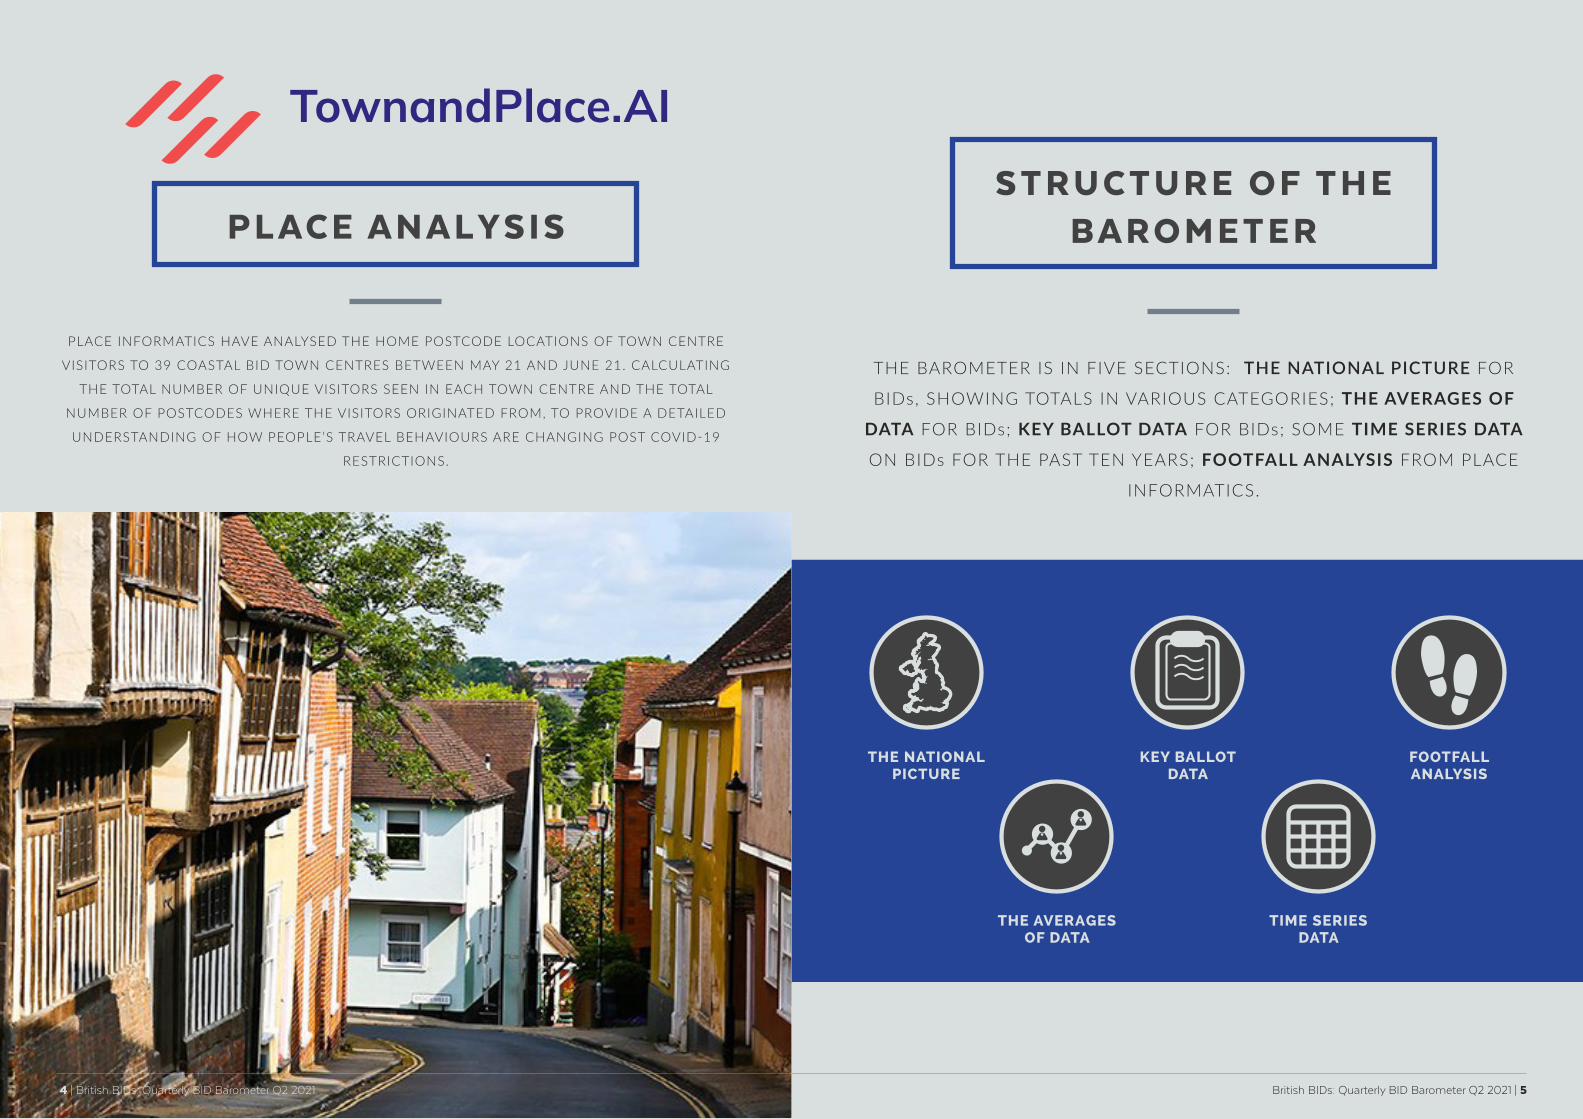
STRUCTURE OF THE BAROMETER
THE BAROMETER IS IN FIVE SECTIONS: THE NATIONAL PICTURE FOR
BIDs , SHOWING TOTALS IN VARIOUS CATEGORIES; THE AVERAGES OF
DATA FOR BIDs ; KEY BALLOT DATA FOR BIDs ; SOME TIME SERIES DATA
ON BIDs FOR THE PAST TEN YEARS; FOOTFALL ANALYSIS FROM PLACE
INFORMATICS.
PLACE ANALYSIS
PLACE INFORMATICS HAVE ANALYSED THE HOME POSTCODE LOCATIONS OF TOWN CENTRE
VISITORS TO 39 COASTAL BID TOWN CENTRES BETWEEN MAY 21 AND JUNE 21. CALCULATING
THE TOTAL NUMBER OF UNIQUE VISITORS SEEN IN EACH TOWN CENTRE AND THE TOTAL
NUMBER OF POSTCODES WHERE THE VISITORS ORIGINATED FROM, TO PROVIDE A DETAILED
UNDERSTANDING OF HOW PEOPLE’S TRAVEL BEHAVIOURS ARE CHANGING POST COVID-19
RESTRICTIONS.
4 | British BIDs: Quarterly BID Barometer Q2 2021 British BIDs: Quarterly BID Barometer Q2 2021 | 5
THE NATIONALPICTURE
THE AVERAGES OF DATA
KEY BALLOTDATA
TIME SERIESDATA
FOOTFALL ANALYSIS
TownandPlace.AI
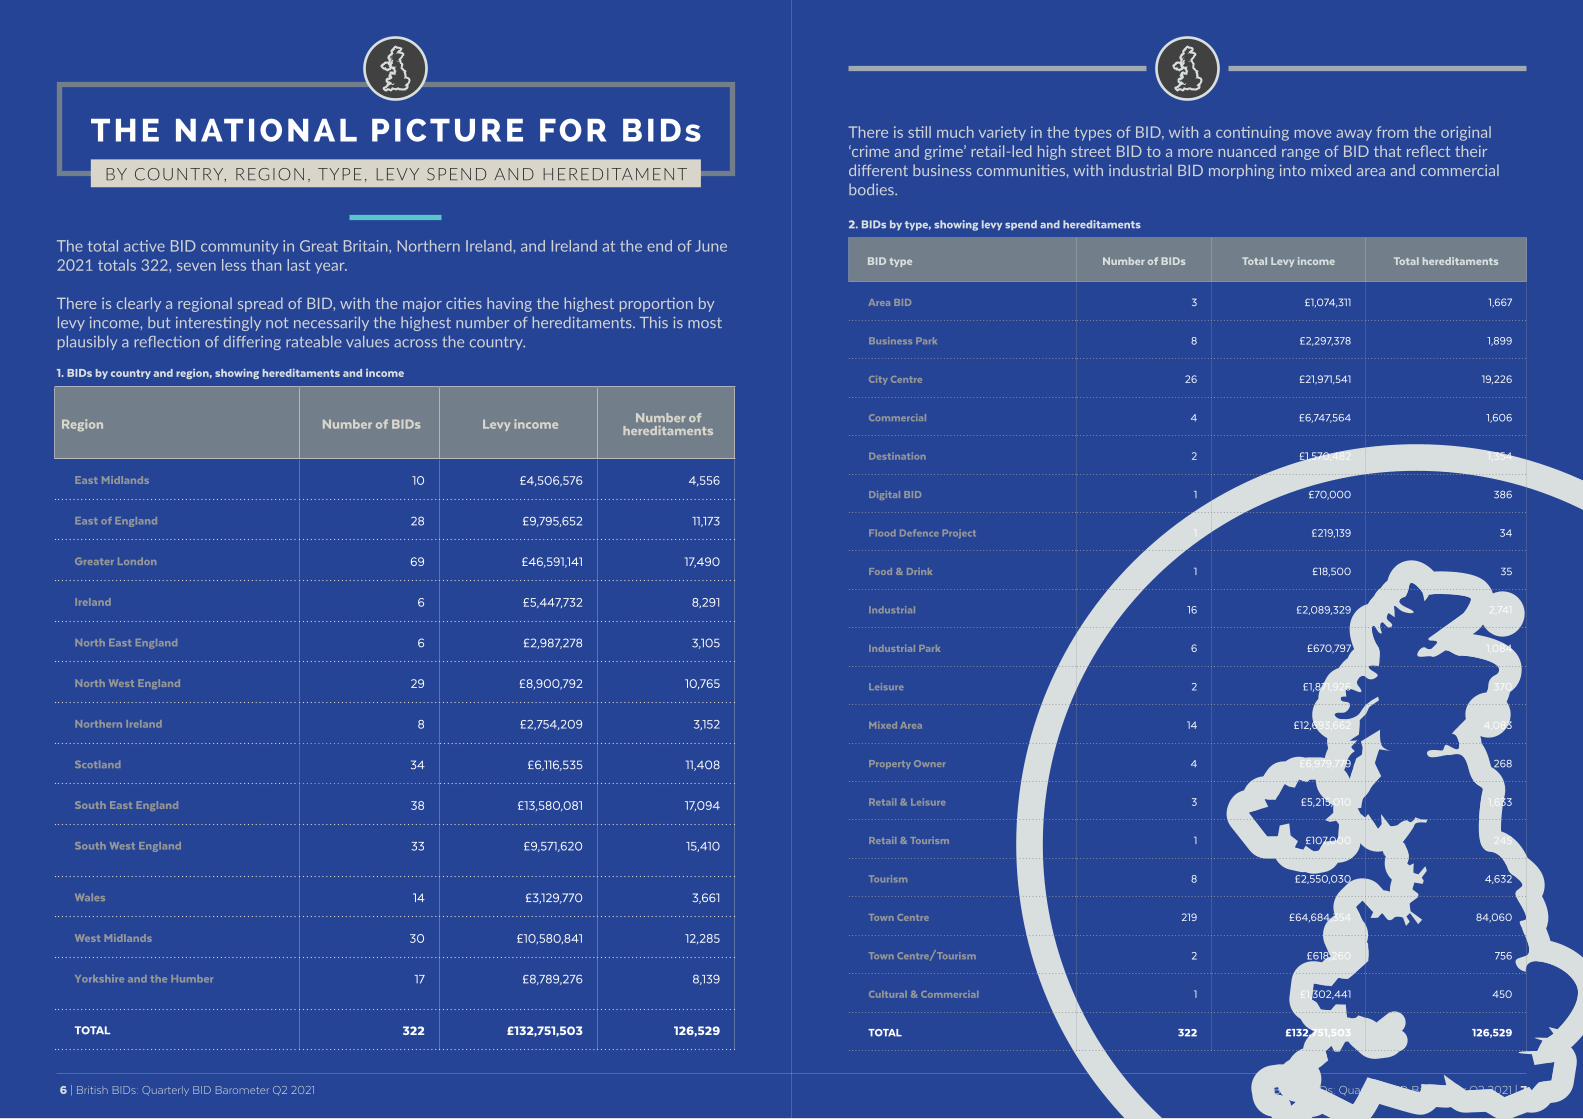
Region Number of BIDs Levy income Number of hereditaments
East Midlands 10 £4,506,576 4,556
East of England 28 £9,795,652 11,173
Greater London 69 £46,591,141 17,490
Ireland 6 £5,447,732 8,291
North East England 6 £2,987,278 3,105
North West England 29 £8,900,792 10,765
Northern Ireland 8 £2,754,209 3,152
Scotland 34 £6,116,535 11,408
South East England 38 £13,580,081 17,094
South West England 33 £9,571,620 15,410
Wales 14 £3,129,770 3,661
West Midlands 30 £10,580,841 12,285
Yorkshire and the Humber 17 £8,789,276 8,139
TOTAL 322 £132,751,503 126,529
The total active BID community in Great Britain, Northern Ireland, and Ireland at the end of June 2021 totals 322, seven less than last year.
There is clearly a regional spread of BID, with the major cities having the highest proportion by levy income, but interestingly not necessarily the highest number of hereditaments. This is most plausibly a reflection of differing rateable values across the country.
1. BIDs by country and region, showing hereditaments and income
There is still much variety in the types of BID, with a continuing move away from the original ‘crime and grime’ retail-led high street BID to a more nuanced range of BID that reflect their different business communities, with industrial BID morphing into mixed area and commercial bodies.
2. BIDs by type, showing levy spend and hereditaments
BID type Number of BIDs Total Levy income Total hereditaments
Area BID 3 £1,074,311 1,667
Business Park 8 £2,297,378 1,899
City Centre 26 £21,971,541 19,226
Commercial 4 £6,747,564 1,606
Destination 2 £1,570,482 1,354
Digital BID 1 £70,000 386
Flood Defence Project 1 £219,139 34
Food & Drink 1 £18,500 35
Industrial 16 £2,089,329 2,741
Industrial Park 6 £670,797 1,084
Leisure 2 £1,871,926 370
Mixed Area 14 £12,693,662 4,083
Property Owner 4 £6,979,779 268
Retail & Leisure 3 £5,215,010 1,633
Retail & Tourism 1 £107,000 245
Tourism 8 £2,550,030 4,632
Town Centre 219 £64,684,354 84,060
Town Centre/Tourism 2 £618,260 756
Cultural & Commercial 1 £1,302,441 450
TOTAL 322 £132,751,503 126,529
British BIDs: Quarterly BID Barometer Q2 2021 | 7 6 | British BIDs: Quarterly BID Barometer Q2 2021
BY COUNTRY, REGION, TYPE, LEVY SPEND AND HEREDITAMENT
THE NATIONAL PICTURE FOR BIDs
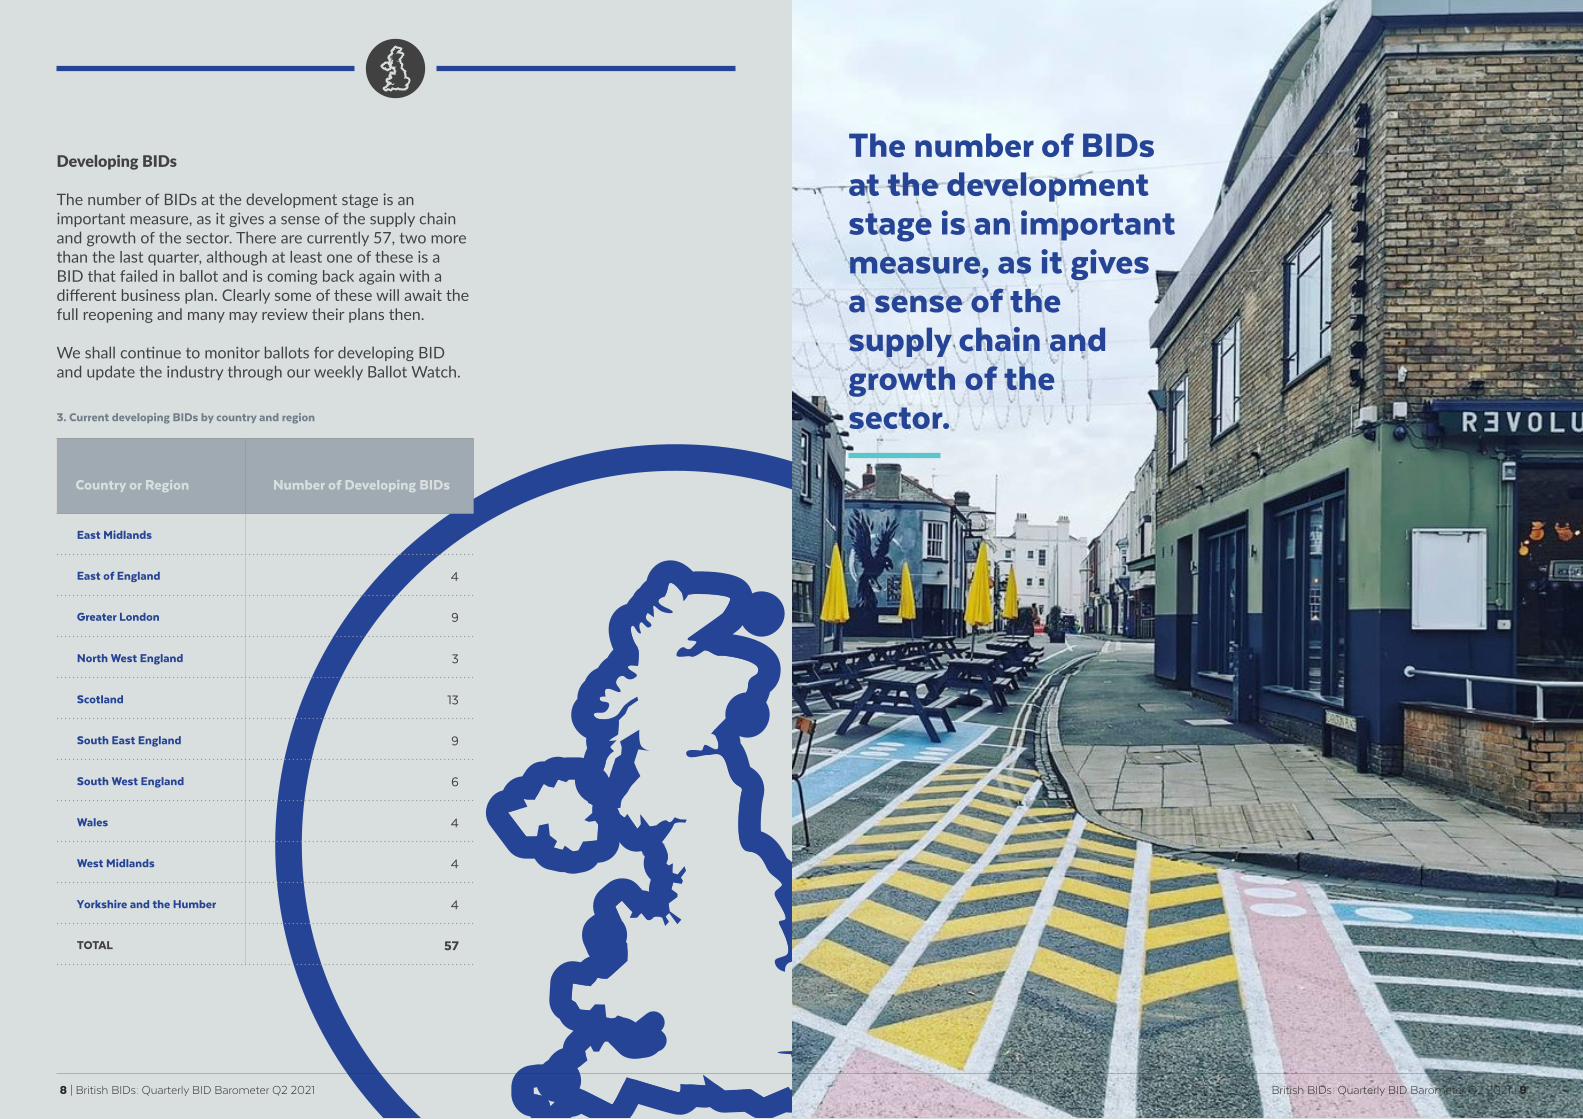
Developing BIDs
The number of BIDs at the development stage is an important measure, as it gives a sense of the supply chain and growth of the sector. There are currently 57, two more than the last quarter, although at least one of these is a BID that failed in ballot and is coming back again with a different business plan. Clearly some of these will await the full reopening and many may review their plans then.
We shall continue to monitor ballots for developing BID and update the industry through our weekly Ballot Watch.
Country or Region Number of Developing BIDs
East Midlands 1
East of England 4
Greater London 9
North West England 3
Scotland 13
South East England 9
South West England 6
Wales 4
West Midlands 4
Yorkshire and the Humber 4
TOTAL 57
3. Current developing BIDs by country and region
8 | British BIDs: Quarterly BID Barometer Q2 2021 British BIDs: Quarterly BID Barometer Q2 2021 | 9
The number of BIDs at the development stage is an important measure, as it gives a sense of the supply chain and growth of the sector.
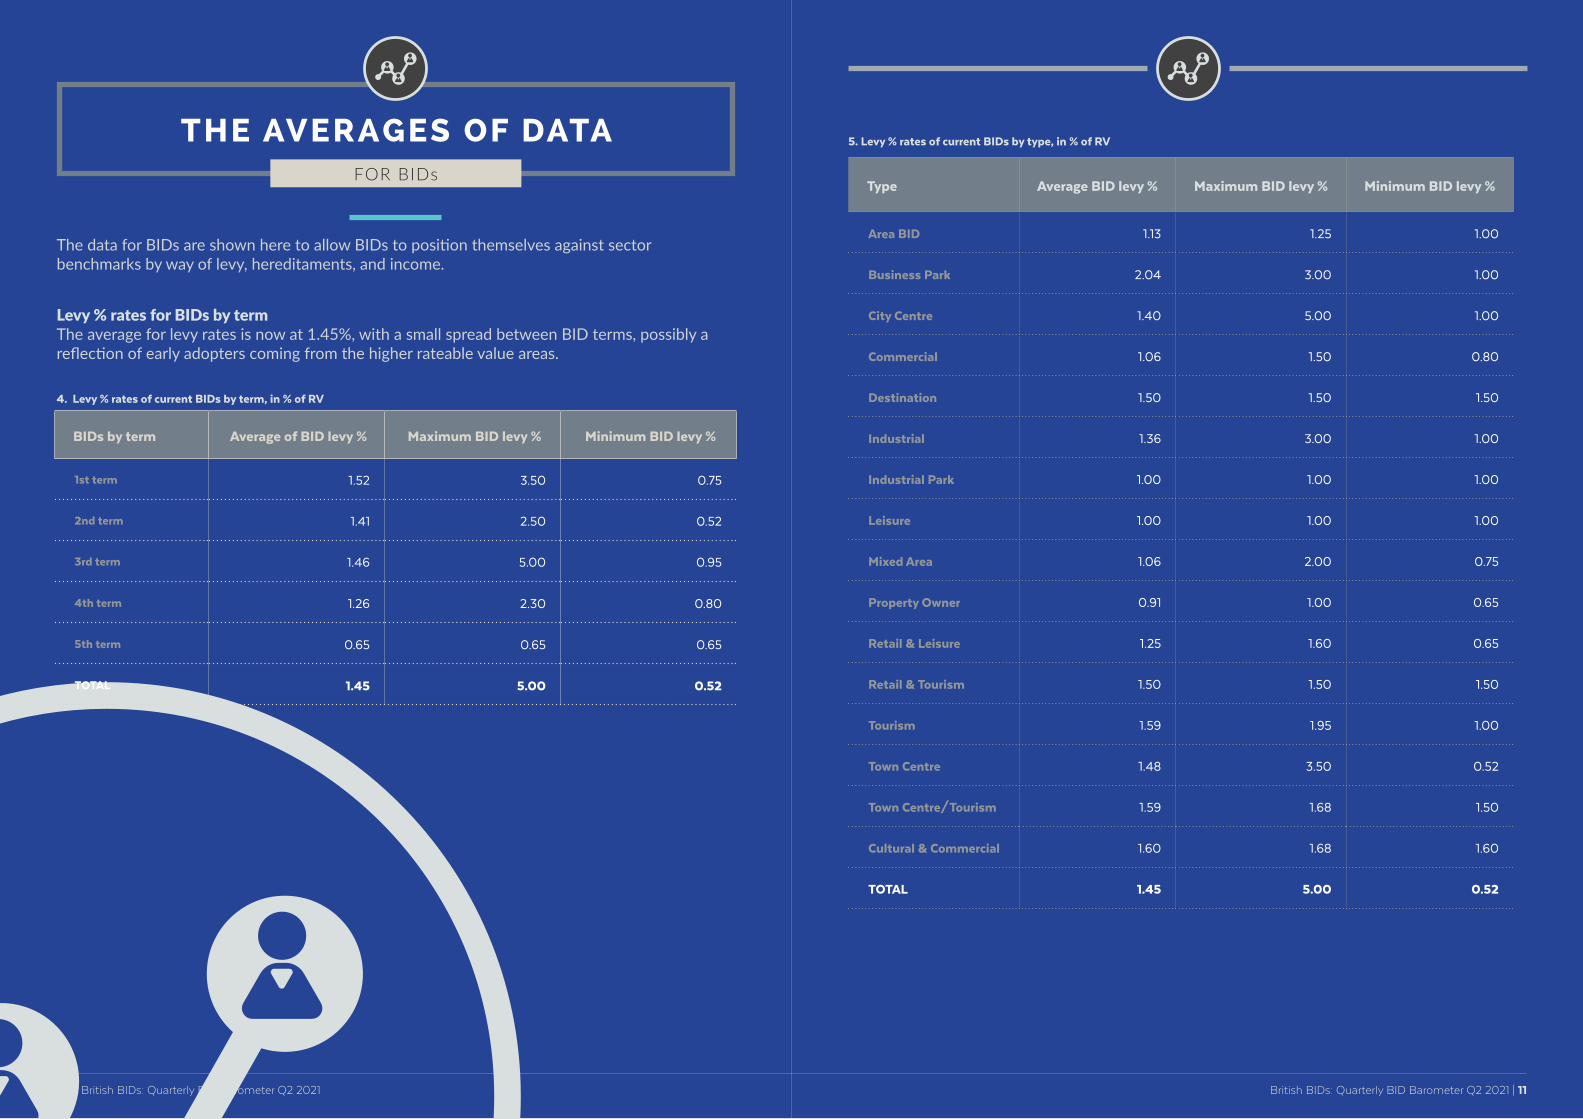
Type Average BID levy % Maximum BID levy % Minimum BID levy %
Area BID 1.13 1.25 1.00
Business Park 2.04 3.00 1.00
City Centre 1.40 5.00 1.00
Commercial 1.06 1.50 0.80
Destination 1.50 1.50 1.50
Industrial 1.36 3.00 1.00
Industrial Park 1.00 1.00 1.00
Leisure 1.00 1.00 1.00
Mixed Area 1.06 2.00 0.75
Property Owner 0.91 1.00 0.65
Retail & Leisure 1.25 1.60 0.65
Retail & Tourism 1.50 1.50 1.50
Tourism 1.59 1.95 1.00
Town Centre 1.48 3.50 0.52
Town Centre/Tourism 1.59 1.68 1.50
Cultural & Commercial 1.60 1.68 1.60
TOTAL 1.45 5.00 0.52
BIDs by term Average of BID levy % Maximum BID levy % Minimum BID levy %
1st term 1.52 3.50 0.75
2nd term 1.41 2.50 0.52
3rd term 1.46 5.00 0.95
4th term 1.26 2.30 0.80
5th term 0.65 0.65 0.65
TOTAL 1.45 5.00 0.52
Levy % rates for BIDs by term The average for levy rates is now at 1.45%, with a small spread between BID terms, possibly a reflection of early adopters coming from the higher rateable value areas.
4. Levy % rates of current BIDs by term, in % of RV
The data for BIDs are shown here to allow BIDs to position themselves against sector benchmarks by way of levy, hereditaments, and income.
5. Levy % rates of current BIDs by type, in % of RV
British BIDs: Quarterly BID Barometer Q2 2021 | 11 10 | British BIDs: Quarterly BID Barometer Q2 2021
FOR BIDs
THE AVERAGES OF DATA
British BIDs: Quarterly BID Barometer Q2 2021 | 13 12 | British BIDs: Quarterly BID Barometer Q2 2021
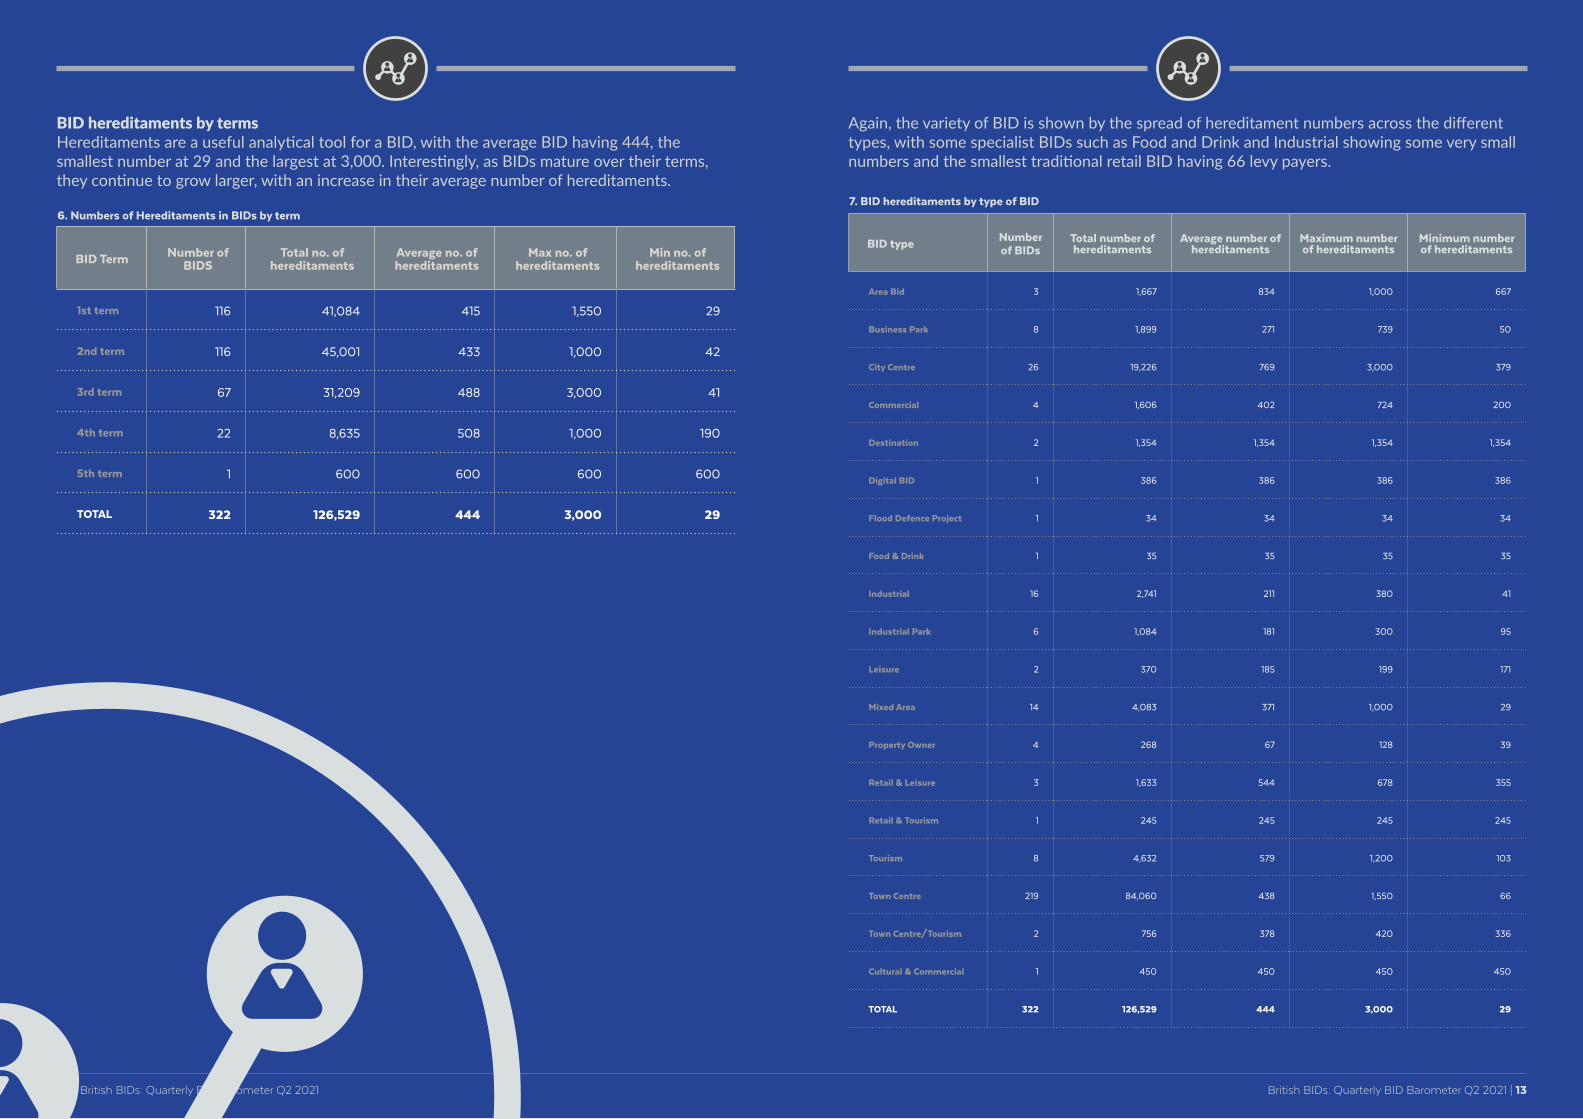
BID Term Number of BIDS
Total no. of hereditaments
Average no. of hereditaments
Max no. of hereditaments
Min no. of hereditaments
1st term 116 41,084 415 1,550 29
2nd term 116 45,001 433 1,000 42
3rd term 67 31,209 488 3,000 41
4th term 22 8,635 508 1,000 190
5th term 1 600 600 600 600
TOTAL 322 126,529 444 3,000 29
BID hereditaments by termsHereditaments are a useful analytical tool for a BID, with the average BID having 444, the smallest number at 29 and the largest at 3,000. Interestingly, as BIDs mature over their terms, they continue to grow larger, with an increase in their average number of hereditaments.
6. Numbers of Hereditaments in BIDs by term
Again, the variety of BID is shown by the spread of hereditament numbers across the different types, with some specialist BIDs such as Food and Drink and Industrial showing some very small numbers and the smallest traditional retail BID having 66 levy payers.
7. BID hereditaments by type of BID
BID type Number of BIDs
Total number of hereditaments
Average number of hereditaments
Maximum number of hereditaments
Minimum number of hereditaments
Area Bid 3 1,667 834 1,000 667
Business Park 8 1,899 271 739 50
City Centre 26 19,226 769 3,000 379
Commercial 4 1,606 402 724 200
Destination 2 1,354 1,354 1,354 1,354
Digital BID 1 386 386 386 386
Flood Defence Project 1 34 34 34 34
Food & Drink 1 35 35 35 35
Industrial 16 2,741 211 380 41
Industrial Park 6 1,084 181 300 95
Leisure 2 370 185 199 171
Mixed Area 14 4,083 371 1,000 29
Property Owner 4 268 67 128 39
Retail & Leisure 3 1,633 544 678 355
Retail & Tourism 1 245 245 245 245
Tourism 8 4,632 579 1,200 103
Town Centre 219 84,060 438 1,550 66
Town Centre/Tourism 2 756 378 420 336
Cultural & Commercial 1 450 450 450 450
TOTAL 322 126,529 444 3,000 29
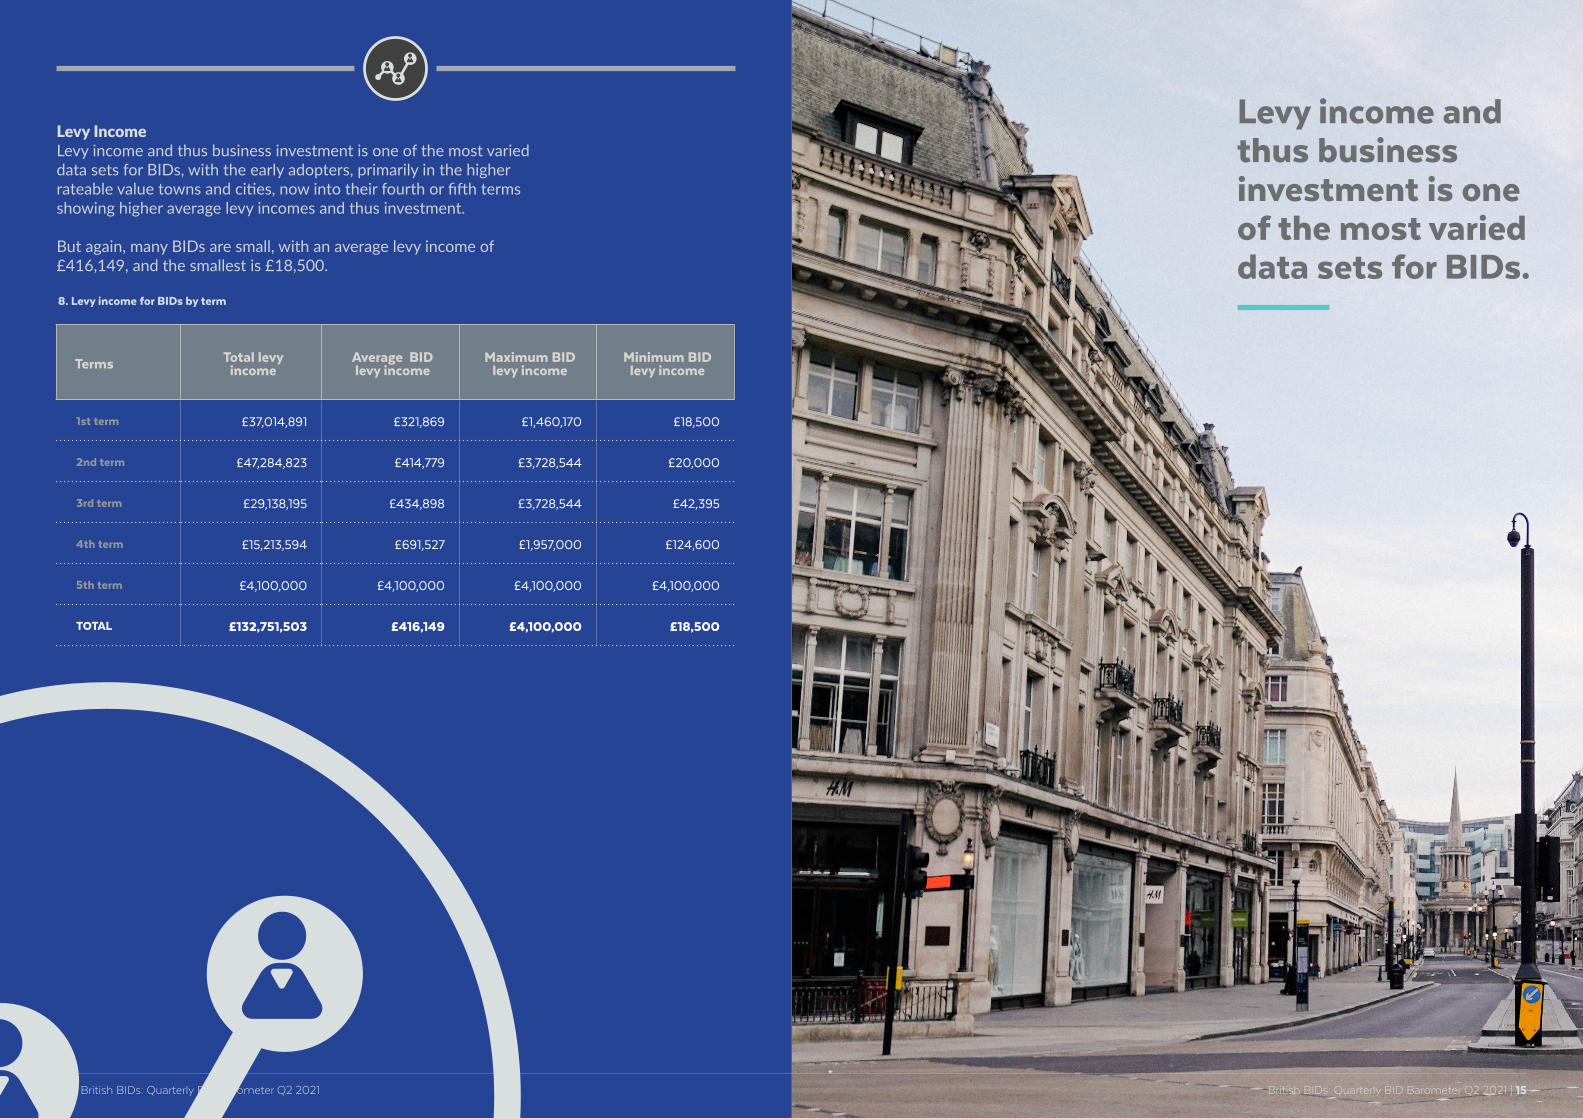
Levy IncomeLevy income and thus business investment is one of the most varied data sets for BIDs, with the early adopters, primarily in the higher rateable value towns and cities, now into their fourth or fifth terms showing higher average levy incomes and thus investment.
But again, many BIDs are small, with an average levy income of £416,149, and the smallest is £18,500.
8. Levy income for BIDs by term
Terms Total levy income
Average BID levy income
Maximum BID levy income
Minimum BID levy income
1st term £37,014,891 £321,869 £1,460,170 £18,500
2nd term £47,284,823 £414,779 £3,728,544 £20,000
3rd term £29,138,195 £434,898 £3,728,544 £42,395
4th term £15,213,594 £691,527 £1,957,000 £124,600
5th term £4,100,000 £4,100,000 £4,100,000 £4,100,000
TOTAL £132,751,503 £416,149 £4,100,000 £18,500
British BIDs: Quarterly BID Barometer Q2 2021 | 15 14 | British BIDs: Quarterly BID Barometer Q2 2021
Levy income and thus business investment is one of the most varied data sets for BIDs.
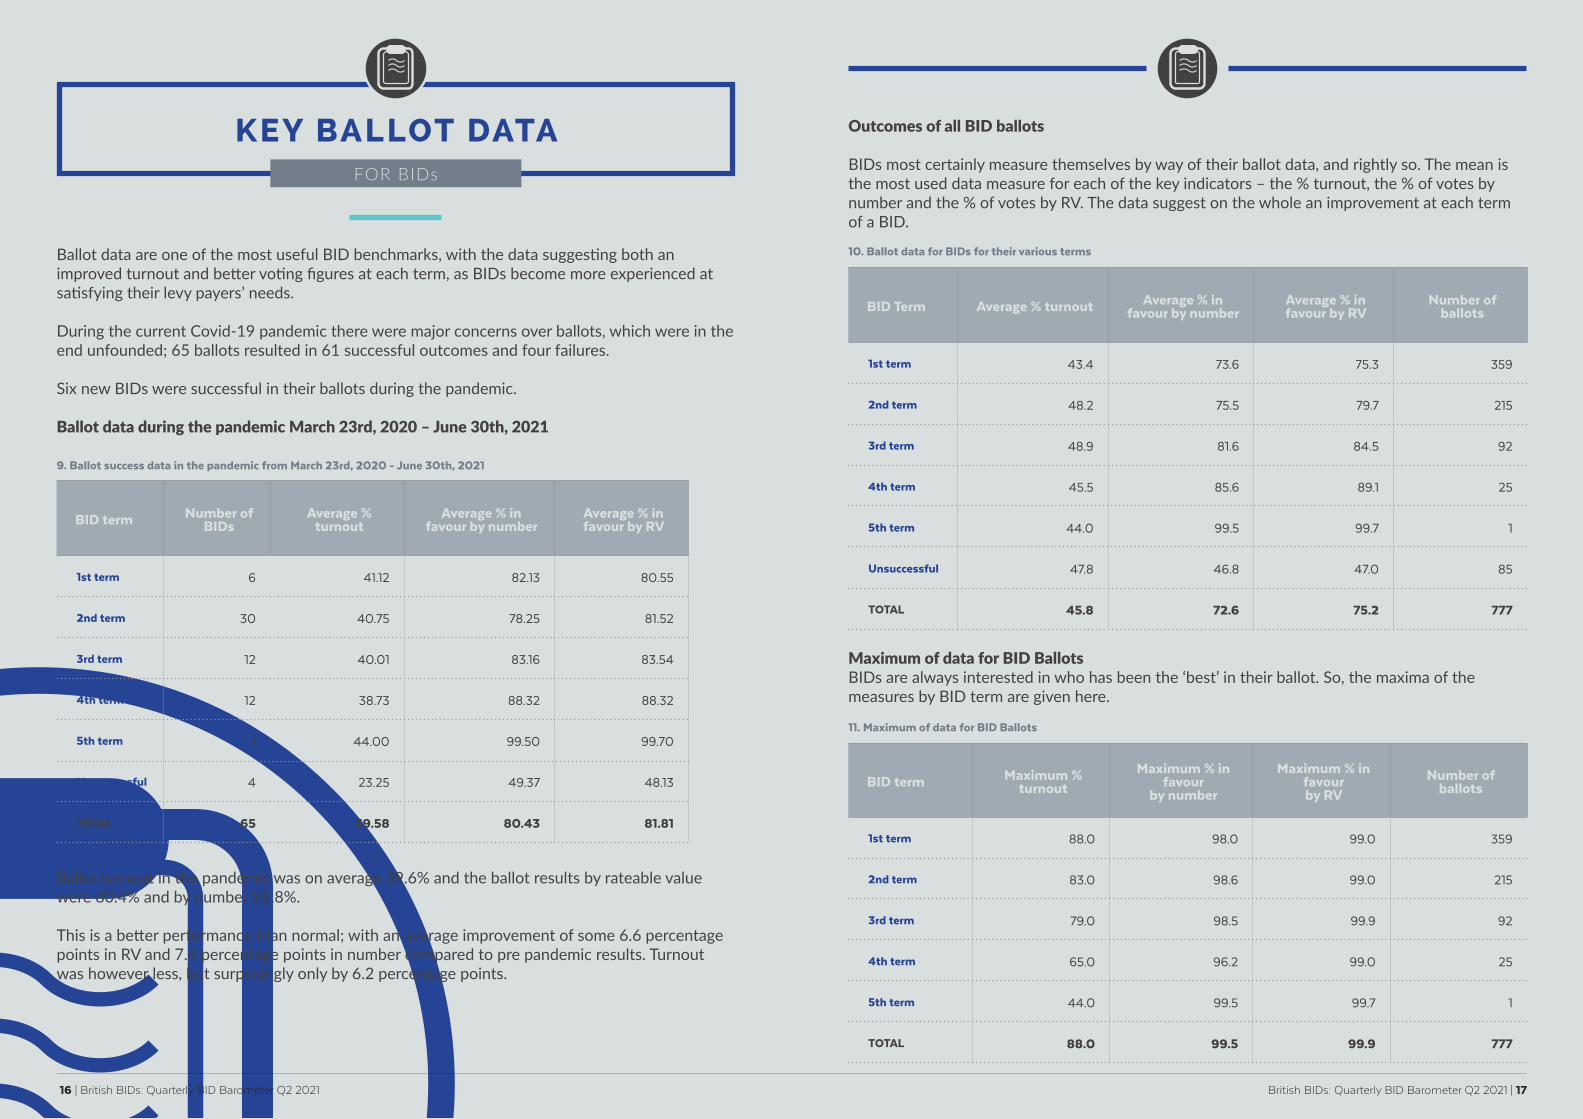
Ballot data are one of the most useful BID benchmarks, with the data suggesting both an improved turnout and better voting figures at each term, as BIDs become more experienced at satisfying their levy payers’ needs.
During the current Covid-19 pandemic there were major concerns over ballots, which were in the end unfounded; 65 ballots resulted in 61 successful outcomes and four failures.
Six new BIDs were successful in their ballots during the pandemic.
Ballot data during the pandemic March 23rd, 2020 – June 30th, 2021
9. Ballot success data in the pandemic from March 23rd, 2020 - June 30th, 2021
Outcomes of all BID ballots
BIDs most certainly measure themselves by way of their ballot data, and rightly so. The mean is the most used data measure for each of the key indicators – the % turnout, the % of votes by number and the % of votes by RV. The data suggest on the whole an improvement at each term of a BID.
Maximum of data for BID Ballots BIDs are always interested in who has been the ‘best’ in their ballot. So, the maxima of the measures by BID term are given here.
10. Ballot data for BIDs for their various terms
11. Maximum of data for BID Ballots
BID Term Average % turnout Average % in favour by number
Average % in favour by RV
Number of ballots
1st term 43.4 73.6 75.3 359
2nd term 48.2 75.5 79.7 215
3rd term 48.9 81.6 84.5 92
4th term 45.5 85.6 89.1 25
5th term 44.0 99.5 99.7 1
Unsuccessful 47.8 46.8 47.0 85
TOTAL 45.8 72.6 75.2 777
BID term Number of BIDs
Average % turnout
Average % in favour by number
Average % in favour by RV
1st term 6 41.12 82.13 80.55
2nd term 30 40.75 78.25 81.52
3rd term 12 40.01 83.16 83.54
4th term 12 38.73 88.32 88.32
5th term 1 44.00 99.50 99.70
Unsuccessful 4 23.25 49.37 48.13
TOTAL 65 39.58 80.43 81.81
BID term Maximum % turnout
Maximum % in favour
by number
Maximum % in favour by RV
Number of ballots
1st term 88.0 98.0 99.0 359
2nd term 83.0 98.6 99.0 215
3rd term 79.0 98.5 99.9 92
4th term 65.0 96.2 99.0 25
5th term 44.0 99.5 99.7 1
TOTAL 88.0 99.5 99.9 777
Ballot turnout in the pandemic was on average 39.6% and the ballot results by rateable value were 80.4% and by number 81.8%.
This is a better performance than normal; with an average improvement of some 6.6 percentage points in RV and 7.8 percentage points in number compared to pre pandemic results. Turnout was however less, but surprisingly only by 6.2 percentage points.
16 | British BIDs: Quarterly BID Barometer Q2 2021 British BIDs: Quarterly BID Barometer Q2 2021 | 17
FOR BIDs
KEY BALLOT DATA
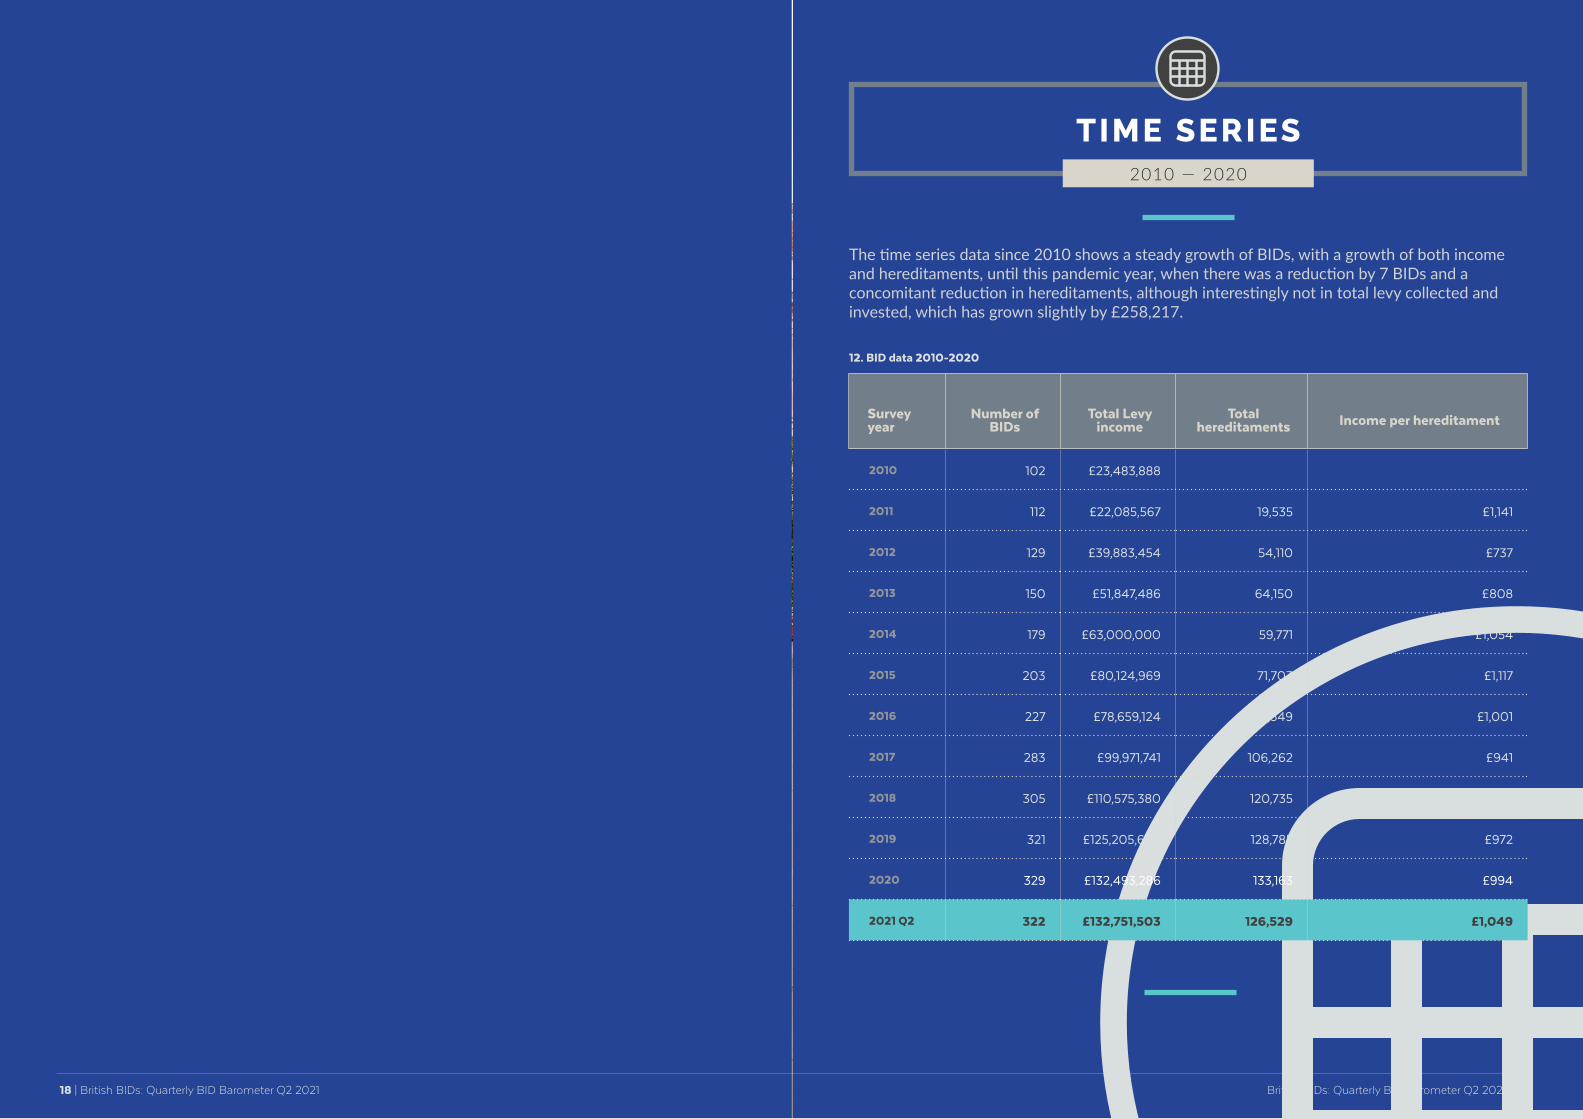
The time series data since 2010 shows a steady growth of BIDs, with a growth of both income and hereditaments, until this pandemic year, when there was a reduction by 7 BIDs and a concomitant reduction in hereditaments, although interestingly not in total levy collected and invested, which has grown slightly by £258,217.
12. BID data 2010-2020
Survey year
Number of BIDs
Total Levy income
Total hereditaments Income per hereditament
2010 102 £23,483,888
2011 112 £22,085,567 19,535 £1,141
2012 129 £39,883,454 54,110 £737
2013 150 £51,847,486 64,150 £808
2014 179 £63,000,000 59,771 £1,054
2015 203 £80,124,969 71,703 £1,117
2016 227 £78,659,124 78,549 £1,001
2017 283 £99,971,741 106,262 £941
2018 305 £110,575,380 120,735 £916
2019 321 £125,205,608 128,785 £972
2020 329 £132,493,286 133,163 £994
2021 Q2 322 £132,751,503 126,529 £1,049
Time series data since 2010 show a growth of BIDs since that year... until this pandemic year, when there was a reduction by 7 BIDs
British BIDs: Quarterly BID Barometer Q2 2021 | 19 18 | British BIDs: Quarterly BID Barometer Q2 2021
2010 — 2020
TIME SERIES
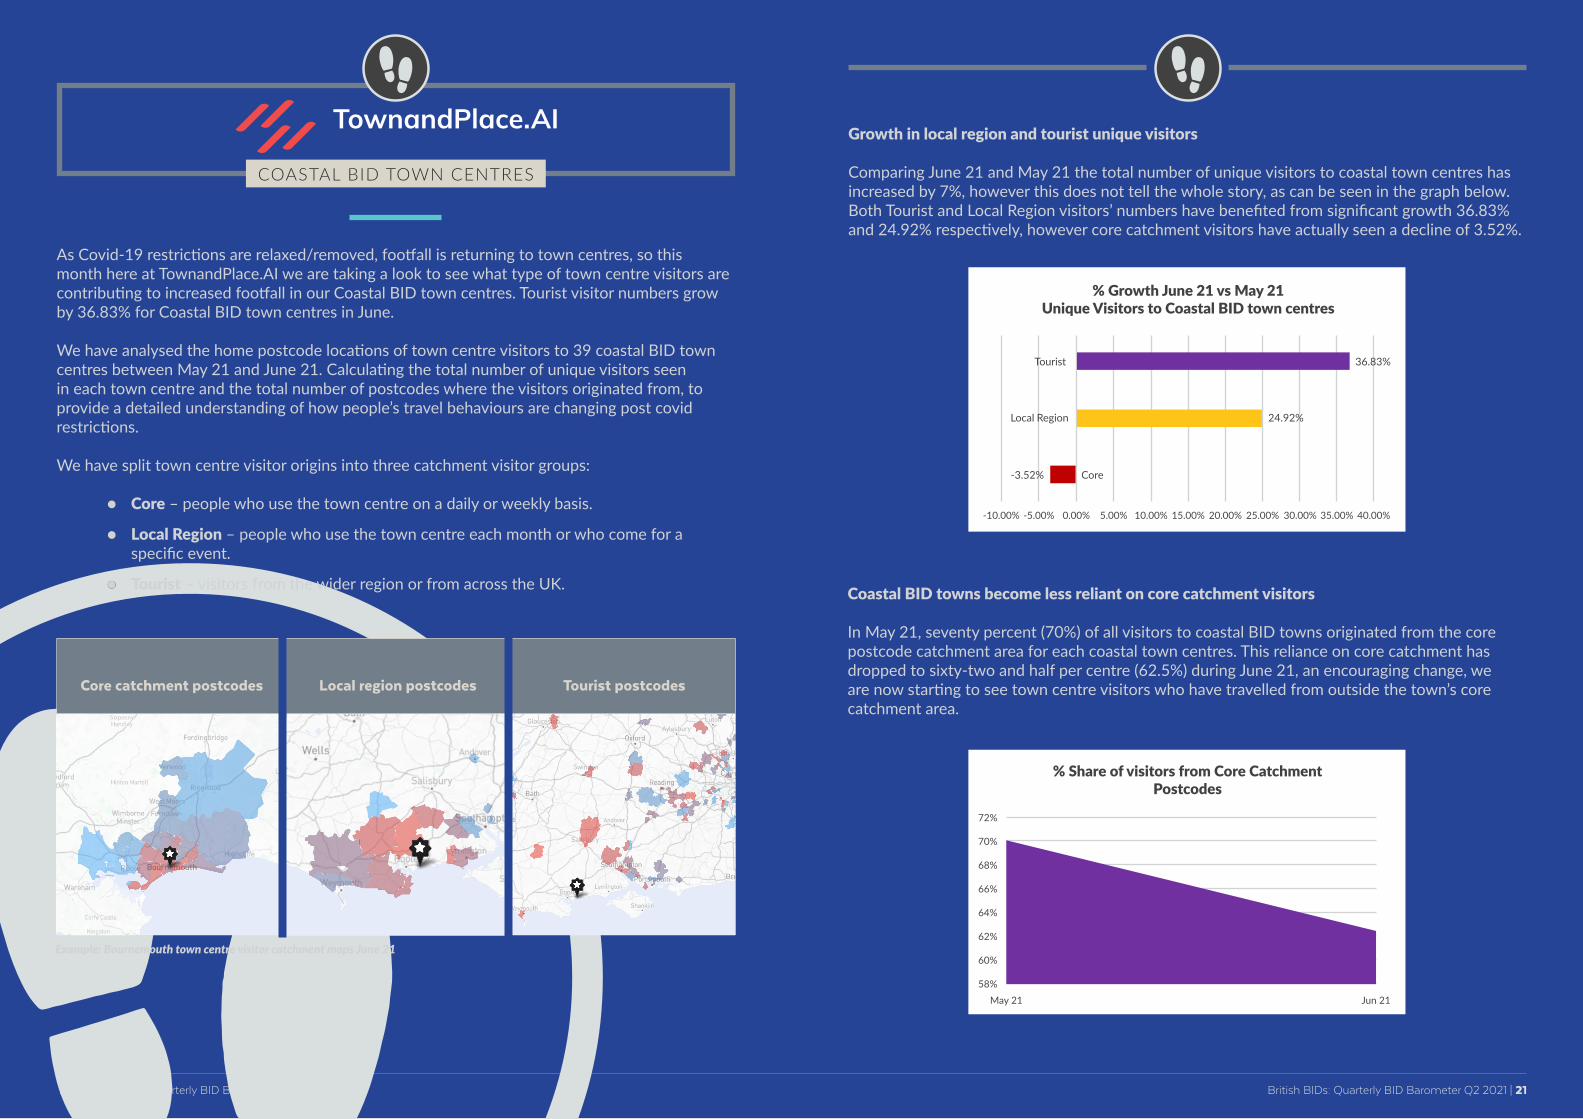
Growth in local region and tourist unique visitors
Comparing June 21 and May 21 the total number of unique visitors to coastal town centres has increased by 7%, however this does not tell the whole story, as can be seen in the graph below. Both Tourist and Local Region visitors’ numbers have benefited from significant growth 36.83% and 24.92% respectively, however core catchment visitors have actually seen a decline of 3.52%.
Coastal BID towns become less reliant on core catchment visitors
In May 21, seventy percent (70%) of all visitors to coastal BID towns originated from the core postcode catchment area for each coastal town centres. This reliance on core catchment has dropped to sixty-two and half per centre (62.5%) during June 21, an encouraging change, we are now starting to see town centre visitors who have travelled from outside the town’s core catchment area.
% Growth June 21 vs May 21Unique Visitors to Coastal BID town centres
Tourist
Local Region
Core
36.83%
24.92%
-3.52%
-10.00% -5.00% 0.00% 5.00% 10.00% 15.00% 20.00% 25.00% 30.00% 35.00% 40.00%
Core catchment postcodes Local region postcodes Tourist postcodes
COASTAL BID TOWN CENTRES
As Covid-19 restrictions are relaxed/removed, footfall is returning to town centres, so this month here at TownandPlace.AI we are taking a look to see what type of town centre visitors are contributing to increased footfall in our Coastal BID town centres. Tourist visitor numbers grow by 36.83% for Coastal BID town centres in June.
We have analysed the home postcode locations of town centre visitors to 39 coastal BID town centres between May 21 and June 21. Calculating the total number of unique visitors seen in each town centre and the total number of postcodes where the visitors originated from, to provide a detailed understanding of how people’s travel behaviours are changing post covid restrictions.
We have split town centre visitor origins into three catchment visitor groups:
• Core – people who use the town centre on a daily or weekly basis.
• Local Region – people who use the town centre each month or who come for a specific event.
• Tourist – visitors from the wider region or from across the UK.
Example: Bournemouth town centre visitor catchment maps June 21
British BIDs: Quarterly BID Barometer Q2 2021 | 21 20 | British BIDs: Quarterly BID Barometer Q2 2021
TownandPlace.AI
% Share of visitors from Core Catchment Postcodes
May 21 Jun 2158%
60%
62%
64%
66%
68%
70%
72%
Footfall and tourism town centre data
To view the latest July 21 footfall, tourism and visitor catchment data for your BID town centre, click on the link https://townandplace.ai/signup and register for your FREE 14-day access pass. TownandPlace.AI is a ‘no hardware required’ provider of footfall, visitor behaviour and tourism data for over 2,300 town centres across the UK.
If you have any questions regarding the available footfall, tourism and visitor behaviour data for your town centre please get in touch with:
Clive Hall, Visitor Insights [email protected]
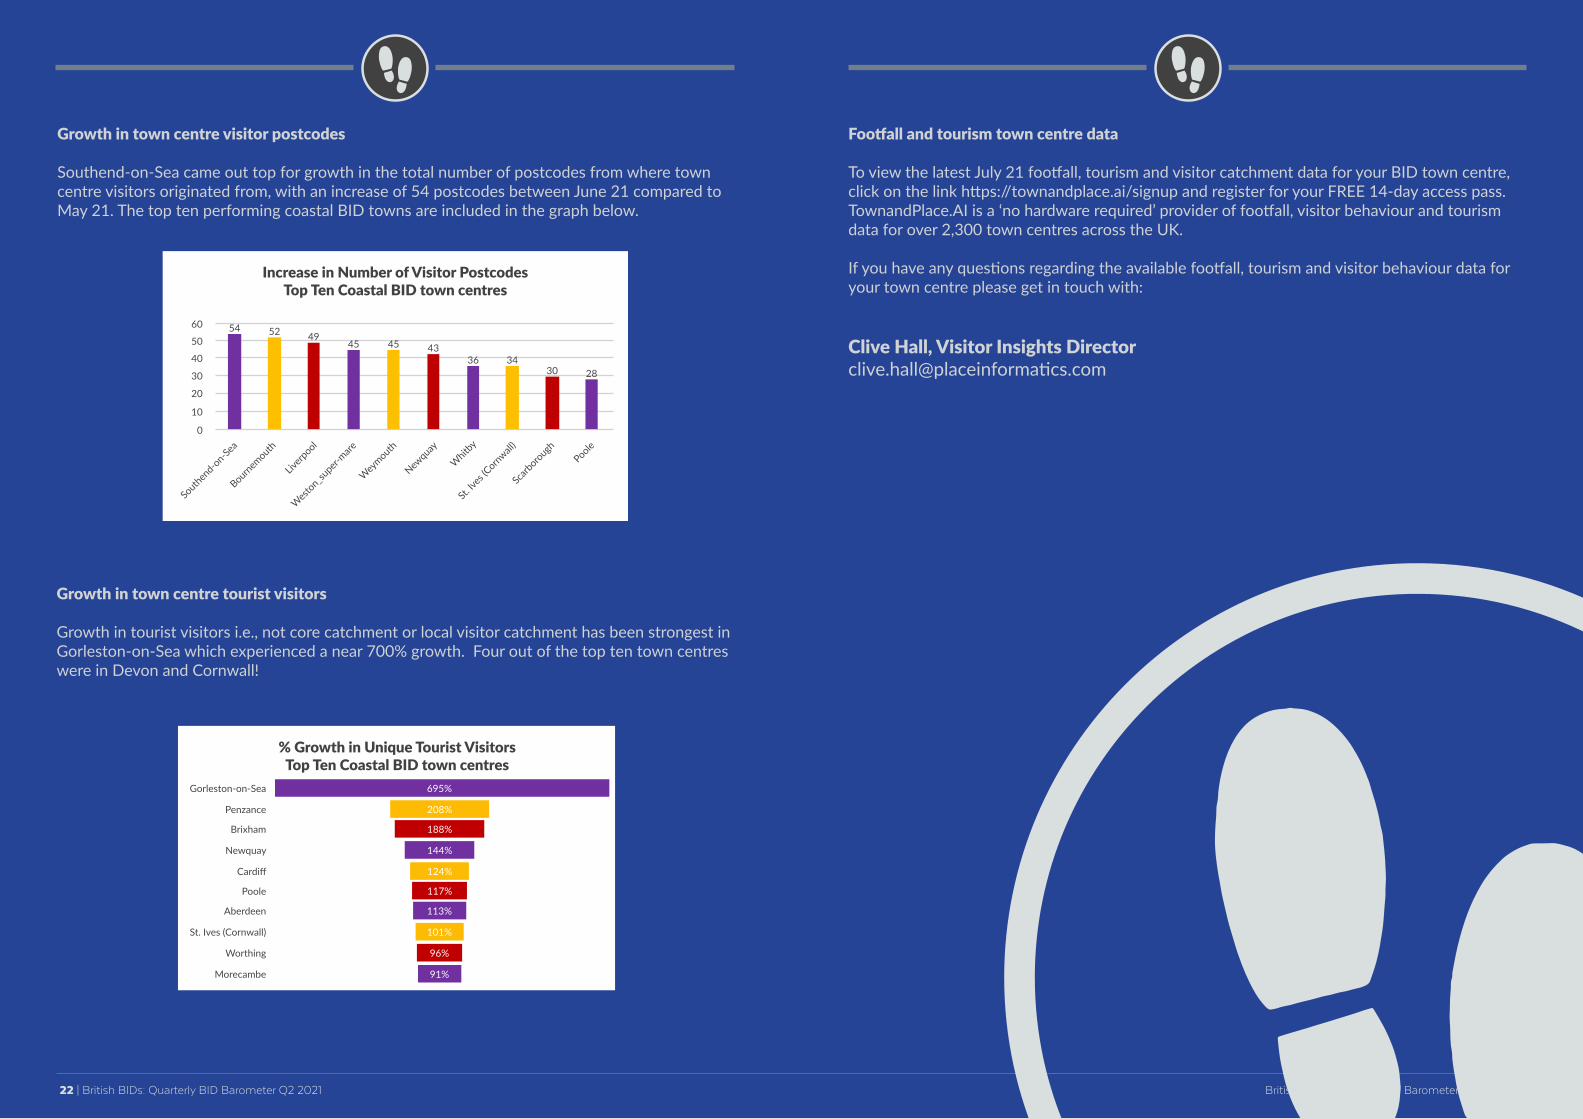
Growth in town centre visitor postcodes
Southend-on-Sea came out top for growth in the total number of postcodes from where town centre visitors originated from, with an increase of 54 postcodes between June 21 compared to May 21. The top ten performing coastal BID towns are included in the graph below.
Growth in town centre tourist visitors
Growth in tourist visitors i.e., not core catchment or local visitor catchment has been strongest in Gorleston-on-Sea which experienced a near 700% growth. Four out of the top ten town centres were in Devon and Cornwall!
British BIDs: Quarterly BID Barometer Q2 2021 | 23 22 | British BIDs: Quarterly BID Barometer Q2 2021
Increase in Number of Visitor PostcodesTop Ten Coastal BID town centres
Southen
d-on-Sea
Bournemouth
Liverp
ool
Wes
ton_super-
mare
Wey
mouth
Newquay
Whitb
y
St. Iv
es (C
ornwall)
Scarb
oroughPoole
0
10
20
30
40
50
60 54 52 4945 45 43
36 3430 28
% Growth in Unique Tourist VisitorsTop Ten Coastal BID town centres
St. Ives (Cornwall)
Aberdeen
Poole
Cardiff
Newquay
Brixham
Penzance
Gorleston-on-Sea
Morecambe
Worthing
695%
208%
188%
144%
124%
117%
113%
101%
96%
91%

0845 112 0118www.britishbids.info
[email protected] @BritishBIDs | british_bids | british-bids
© Copyright BBIDS Limited (t/a British BIDs): All material is protected by copyright. You may not copy, reproduce, scrape, augment, post or transmit it in any way without permission of BBIDS Limited (trading as British BIDs), the copyright owner. Prior written consent of the copyright holder must be obtained for any use of material. No part may be distributed or copied for any commercial purpose.


![Barometer [2006]](https://img.pdfslide.net/doc/110x75/577d35011a28ab3a6b8f584c/barometer-2006.jpg)