Embed Size (px)
Citation preview

31 MARCH 2015
QUARTERLY COMMENTARY 1
SIMON CHRISTOFFEL MARAIS1964 – 2015
77398-QC 1 Cover.indd 2 2015/04/22 3:09 PM
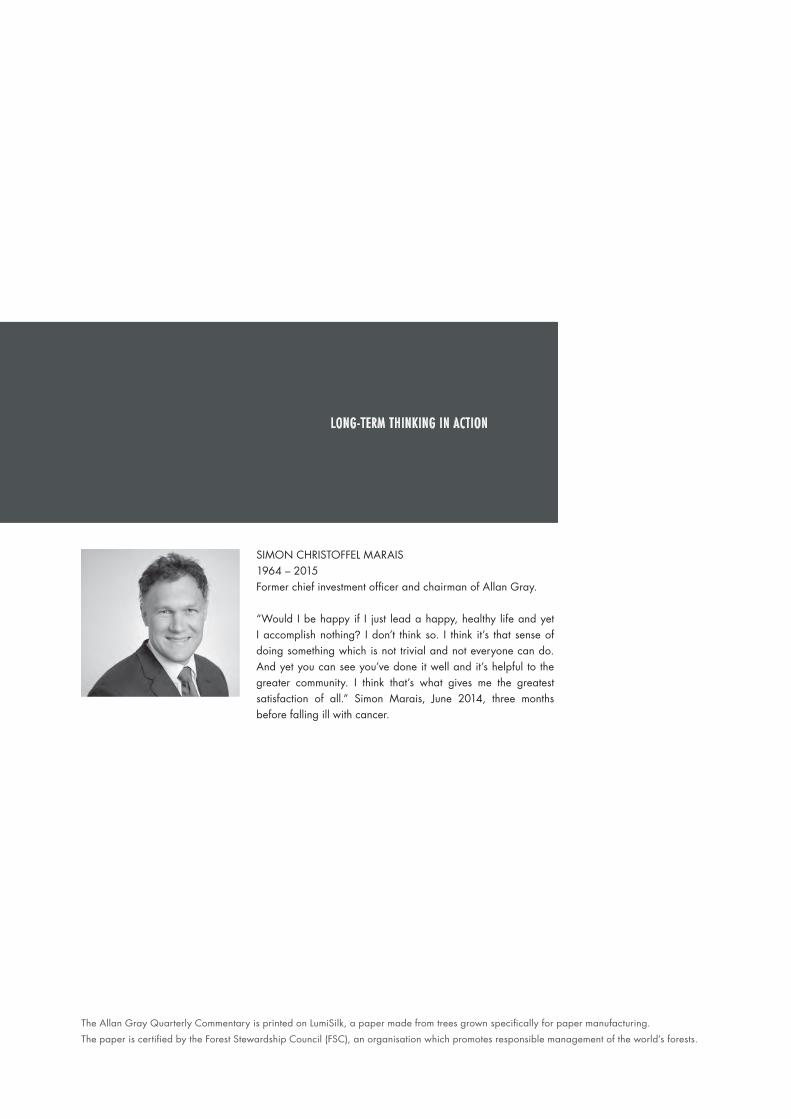
SIMON CHRISTOFFEL MARAIS1964 – 2015Former chief investment officer and chairman of Allan Gray.
“Would I be happy if I just lead a happy, healthy life and yet I accomplish nothing? I don’t think so. I think it’s that sense of doing something which is not trivial and not everyone can do. And yet you can see you’ve done it well and it’s helpful to the greater community. I think that’s what gives me the greatest satisfaction of all.” Simon Marais, June 2014, three months before falling ill with cancer.
The Allan Gray Quarterly Commentary is printed on LumiSilk, a paper made from trees grown specifically for paper manufacturing.
The paper is certified by the Forest Stewardship Council (FSC), an organisation which promotes responsible management of the world’s forests.
LONG-TERM THINKING IN ACTION
77398-QC 1 Cover.indd 3 2015/04/22 3:09 PM

CON T EN T S
01 COMMENTS FROM THE CHIEF OPERATING OFFICER
Rob Dower
03 THE BENEFITS (OR NOT?) OF FORESIGHT Simon Marais
05 PLATINUM AND PALLADIUM: LOW-RISK OPPORTUNITIES Tim Acker
08 DECONSTRUCTING THE INVESTMENT CASE FOR PROPERTY Yusuf Mowlana & Jacques Plaut
11 ORBIS GLOBAL EQUITY: GUIDED BY OUR INVESTMENT PHILOSOPHY Graeme Forster
14 STABLE FUND: SAFEGUARDING OUR CLIENTS’ CAPITAL IS OUR CORE FOCUS Mahesh Cooper & Fiona Jeffery
18 DELAYS TO RETIREMENT REFORM SHOULDN’T MEAN DELAYS TO YOUR RETIREMENT SAVINGS Richard Carter
21 ACTIVE VERSUS PASSIVE Thandi Ngwane
23 ALLAN GRAY BALANCED, STABLE AND EQUITY FUND PORTFOLIOS
24 INVESTMENT TRACK RECORD
25 PERFORMANCE AND TOTAL EXPENSE RATIOS
29 THE ALLAN GRAY GROUP
77398-QC 1 Pages 297x210.indd 1 2015/04/20 2:51 PM

1 QC 1 2015
COM MEN T S F ROM T HE CHIE F OP ER AT ING OF F IC ER
ROB DOWER
This Quarterly Commentary is dedicated to Simon Marais, chairman of Allan Gray Limited, who passed away on 26 February this year.
In recent issues we have printed images refl ecting very long-term investments on the front cover. For our fi rm, and for many of our clients, Simon’s career has perhaps been the best long-term investment of all. His contribution to our business was nothing short of extraordinary.
Simon submitted an impressive CV when he applied for a programming job here in 1991: Honours in both maths and physics and a Masters degree in physics, all cum laude, from Stellenbosch, and a Phd in physics from Cambridge. He had returned to South Africa with the intention of doing post-doctoral work in physics but was attracted to the fi eld of investments – I imagine for the reasons in his quote on the inside cover: the opportunity to solve challenging problems, where if you do a good job it makes a big difference to people.
Within a few months he was pulled into the investment team as an equity analyst. By 1994 he was managing client portfolios, in 1998 he was promoted to chief investment offi cer and in 2001 he took over from Allan Gray as chairman of Allan Gray South Africa. Staying on as non-executive chairman, he moved to our sister company Orbis for a two-year stint in London as head of research, but soon migrated again to warmer Sydney, Australia, where he founded and grew Allan Gray Australia into a highly respected contrarian asset manager.
If he had done nothing else at all, Simon’s 20-year track record of adding value in different markets was exceptional. He beat the index in South Africa, globally at Orbis and fi nally in Australian equities, and he did so by a wide margin and over different periods.
But of course this wasn’t his only achievement. Apart from his record as an investor, Simon’s distinctive gift was that he could communicate ideas simply and with wonderful clarity. He liked speaking to clients about their portfolios,
and sharing his ideas on the radio or in newspapers. This is unusual: many investors are worried about looking stupid or being caught out in some way. This was not the case for Simon, maybe because he was always straight and he spoke his mind without worrying about what others thought. We have reprinted his 2008 article on ‘foresight’ without edits or updating. I think you’ll agree that it has weathered well.
Simon wasn’t obsessive about work. His fi rst priority was always his wife and three boys and he was lucky to have several very close friends, some of them Allan Gray colleagues. He was blessed with a very wide range of talents, which he appeared to relish. Outside of work, he considered the toughest maths problems to be a form of recreation. He was an enthusiastic and surprisingly fast touch rugby player, skilled and competitive at tennis, and a sought-after partner for lunchtime games of bridge in our Cape Town offi ce.
Simon was a true friend for life to his colleagues and we will miss him.
77398-QC 1 Pages 297x210.indd 1 2015/04/20 2:51 PM

2QC 1 2015
Allocat ing between proper ty and commodit ies
This issue of Quarterly Commentary includes two articles on important asset allocation decisions in our balanced portfolios. In our first piece, Tim Acker takes a look at platinum and palladium and explains why we prefer investing in these actual physical commodities to buying shares in the mining companies that produce them. In a second investment article, Yusuf Mowlana and Jacques Plaut discuss the performance and prospects of listed property companies. Our portfolios have a bigger exposure to zero-yield metal bars than to the property sector, which currently pays an average yield of 5.1%.
Although listed property has done extremely well, especially in the last year, in our view the true underlying performance of South African property companies has not been as strong as their share prices suggest. Because property companies distribute virtually all of their net rental income, they are forced to borrow to fund substantial renovations. This works well when property valuations are rising, but not when they stagnate or fall. Just as leverage has augmented returns during the up cycle, it will detract from returns in the down cycle.
On the other hand, while a platinum bar in a vault may not provide a yield today it will be just as shiny in 20 years’ time. The same can’t be said of a shiny A-grade office block – in 20 years’ time it will probably need renovation, and may even be on the wrong side of town.
At current prices, less than half of South Africa’s platinum mines generate enough revenue to cover cash operating costs and capital expenditures. South Africa has the vast bulk of the world’s known platinum resources, so it is hard to see a significant new source of mine supply. Global mine supply of these metals has been falling for years already and it will probably accelerate if prices remain at these levels. Moreover, the cost to mine an ounce of platinum has grown by roughly 15% per year over the last decade, and it is likely to continue to grow. We certainly have more conviction on the potential for rand capital gains on platinum and palladium from today’s valuations, than we do for further gains from property.
Orbis’ share selec t ion
While the Orbis funds performed very well in 2013, much of this was given back in a disappointing 2014, albeit on a substantially different share portfolio. Looking at the application of our philosophy in global markets, Graeme Forster, from our offshore partner Orbis, discusses how sometimes it takes time for our investment theses to play out. In some of the more painful periods, prices can become increasingly detached from their underlying value as shares which are unloved, ignored, or misunderstood by the market continue on their path of underperformance. The encouraging flip side is that this presents exciting buying opportunities. We are confident that Orbis’ stock-picking abilities will add value to our portfolios over the long term.
Act ive versus passive
In this quarter’s Investing Tutorial, we look as objectively as we can at the difference between active and passive styles of investing. Thandi Ngwane reminds us that managers who outperform also often invest in ways that are contrary to the popular opinions of the time, and their portfolios may be going down while the market is going up. If you choose an active manager you need to stick with your choice during periods of underperformance so you can enjoy the returns when they come.
Manager choice is an important aspect of your investment decisions. This is true whether you are an individual investing for yourself, or an employer looking for retirement savings solutions for your staff. Richard Carter gives us an update on retirement reform and offers some pointers for employers looking for savings solutions for their staff.
Thank you for choosing us as your manager, and for your continued trust and support.
Kind regards
Rob Dower
77398-QC 1 Pages 297x210.indd 2 2015/04/20 2:51 PM
3 QC 1 2015
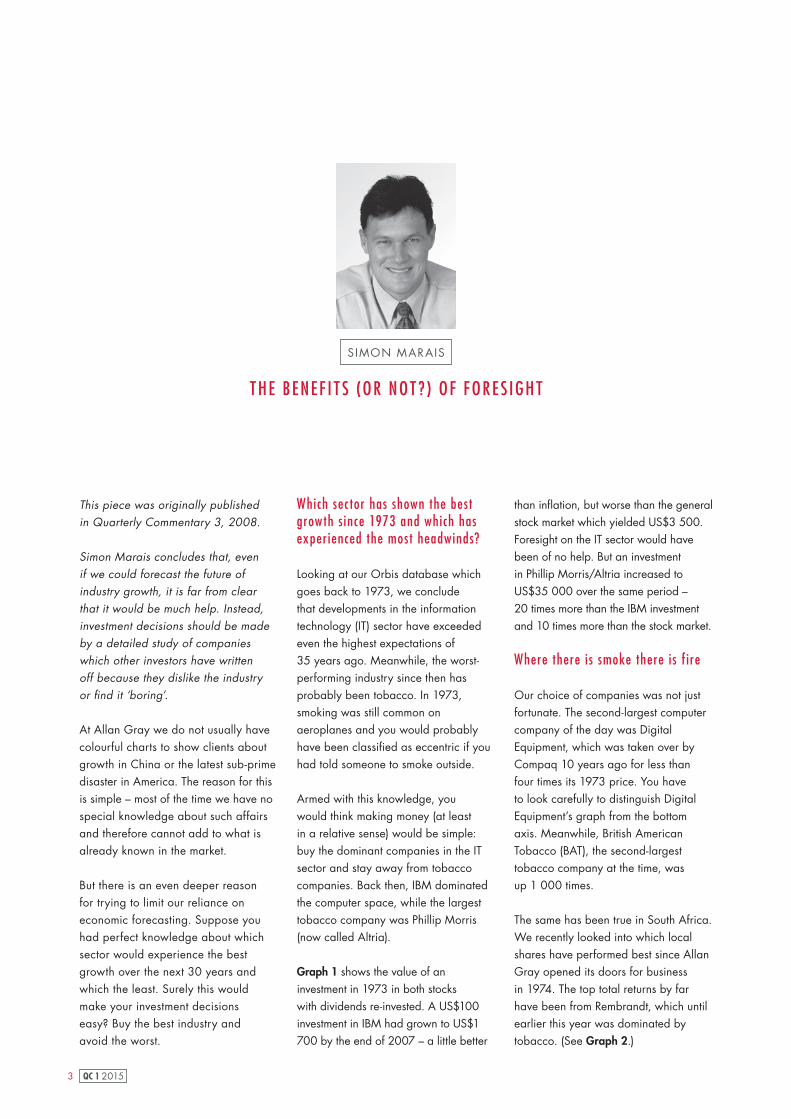
This piece was originally published in Quarterly Commentary 3, 2008.
Simon Marais concludes that, even if we could forecast the future of industry growth, it is far from clear that it would be much help. Instead, investment decisions should be made by a detailed study of companies which other investors have written off because they dislike the industry or fi nd it ‘boring’.
At Allan Gray we do not usually have colourful charts to show clients about growth in China or the latest sub-prime disaster in America. The reason for this is simple – most of the time we have no special knowledge about such affairs and therefore cannot add to what is already known in the market.
But there is an even deeper reason for trying to limit our reliance on economic forecasting. Suppose you had perfect knowledge about which sector would experience the best growth over the next 30 years and which the least. Surely this would make your investment decisions easy? Buy the best industry and avoid the worst.
T HE BENEF I T S (OR NO T ?) OF F OR E S IGH T
SIMON MARAIS
Which sec tor has shown the best grow th s ince 1973 and which has experienced the most headwinds?
Looking at our Orbis database which goes back to 1973, we conclude that developments in the information technology (IT) sector have exceeded even the highest expectations of 35 years ago. Meanwhile, the worst-performing industry since then has probably been tobacco. In 1973, smoking was still common on aeroplanes and you would probably have been classifi ed as eccentric if you had told someone to smoke outside.
Armed with this knowledge, you would think making money (at least in a relative sense) would be simple: buy the dominant companies in the IT sector and stay away from tobacco companies. Back then, IBM dominated the computer space, while the largest tobacco company was Phillip Morris (now called Altria).
Graph 1 shows the value of an investment in 1973 in both stocks with dividends re-invested. A US$100 investment in IBM had grown to US$1 700 by the end of 2007 – a little better
than infl ation, but worse than the general stock market which yielded US$3 500. Foresight on the IT sector would have been of no help. But an investment in Phillip Morris/Altria increased to US$35 000 over the same period – 20 times more than the IBM investment and 10 times more than the stock market.
Where there is smoke there is f ire
Our choice of companies was not just fortunate. The second-largest computer company of the day was Digital Equipment, which was taken over by Compaq 10 years ago for less than four times its 1973 price. You have to look carefully to distinguish Digital Equipment’s graph from the bottom axis. Meanwhile, British American Tobacco (BAT), the second-largest tobacco company at the time, was up 1 000 times.
The same has been true in South Africa. We recently looked into which local shares have performed best since Allan Gray opened its doors for business in 1974. The top total returns by far have been from Rembrandt, which until earlier this year was dominated by tobacco. (See Graph 2.)
77398-QC 1 Pages 297x210.indd 3 2015/04/20 2:51 PM

4QC 1 2015
The importance of a holistic approach to financial markets research
The examples mentioned illustrate that perfect foresight in macroeconomics is often of little value; in fact, it could actively lead you to make poor investments. One of the most under-appreciated facts about financial market research is, in our view, that it is not only the growth in your markets that is important; even more significant is the growth in competition that you face. This is the part that is very difficult, if not impossible, to predict.
The computer industry experienced rapid growth, but that spawned massive competition and constant innovation. The large incumbents of the day had to fight both existing and new competitors
for their market. Emerging competitors such as Apple, Microsoft, Dell and Google had innovative business models that the incumbents found difficult to copy. At the same time, the tobacco industry faced a shrinking market, rising taxes, a ban on advertising and a series of huge lawsuits.
However, nobody entered the market and the incumbents could pass all costs on to their customers and, with no re-investment needs, all profits could flow to investors as dividends.
Cracks in the crystal bal l theory
So we can conclude that even if (and it is a very big if) we could forecast the future of industry growth, it is far from clear whether the information would
help much. Instead, we elect to stick to our investment philosophy: we make our investment decisions by completing a detailed study of companies. We often choose industries that other investors dislike or have written off as ‘boring’. Our research involves a careful studyof financial accounts and annual reports, management and competitor interviews and a strong focus on value. In this way we make sure we do not overpay.
While this approach does not work every year (as some of our more recent numbers show), it has stood us in good stead since inception. We have no doubt that as long as we keep up our standards of analysis, our approach will work for the next 34 years. No need for that crystal ball then!
TOTA
L RE
TURN
INDE
X (1
973
BASE
= 1
) 1 00
80
60
40
20
0
GRAPH 1 TECHNOLOGY VERSUS TOBACCO
1973 1975 1977 1979 1981 1983 1985 1987 1989 1991 1993 1995 1997 1999 2001 2003 2005 2007
BAT
ALTR IA (PH I L I P MORR IS )
IBM
DIG I TAL EQU IPMENT
Source: Datastream
700 000
600 000
500 000
400 000
300 000
200 000
100 000
0
GRAPH 2 TOTAL RATE OF RETURN
1974 1976 1978 1980 1982 1984 1986 1988 1990 1992 1994 1996 1998 2000 2002 2004 2006 2008
REMBRANDT GROUP 34 -YEAR CAGR* : 28 .75%
ALS I ** 34 -YEAR CAGR* : 19 .31%
* CAGR = Compound Annual Growth Rate ** FTSE/JSE All Share Index
Source: Allan Gray research
100
538 500
40 500
77398-QC 1 Pages 297x210.indd 4 2015/04/22 2:27 PM

5 QC 1 2015
Investing in platinum or palladium directly is taking a view that the prices of these commodities will increase. Tim Acker explains why we currently prefer this approach to buying shares in mining companies that produce these metals.
An investor buying shares of South African platinum companies 10 years ago and holding them until 2015 would have earned a return1 slightly less than infl ation and signifi cantly less than that of the overall market. The poor performance of platinum mining shares is despite the rand price of platinum and palladium, the two most important platinum group metals (PGMs), increasing dramatically over this period, as shown in Graph 1.
Today, unlike in 2005, investors have two ways to get exposure to the sector:
Buy shares in platinum mining companies, or
Buy platinum and palladium metal bars through listed debentures
In some ways analysing an investment in commodities is very different from buying
P L AT INUM A ND PA L L A DIUM : LOW-R I SK OP P OR T UNI T IE S
shares in a company. Bars of precious metal do not generate revenue or pay dividends, so how does one determine the intrinsic value? As is the case with any asset, price is determined by supply and demand. Here we can apply our normal fundamental research process.
Our investment case for platinum and palladium is based on the belief that demand will grow faster than supply and the cost of supply will continue to increase. Short-term price movements may be unpredictable, but we believe that backing these fundamentals will lead to a favourable outcome for the patient, long-term investor.
Ris ing demand
Platinum and palladium have a variety of industrial uses, including in catalytic converters for vehicles, and overall demand is growing. PGMs have unique properties that catalyse the conversion of harmful pollutants emitted by vehicles into less harmful carbon dioxide and water vapour. Global vehicle sales are growing as people in developing countries become richer and more likely to buy cars. Increasingly strict emissions standards are requiring car manufacturers to use more PGMs in each catalyst.
*All in rands, based to R100 at the start. Source: I-Net BFA
T IM ACKER
800
700
600
500
400
300
200
100
02005 2006 2007 2008 2009 2010 2011 2012 2013 2014 2015
GRAPH 1 FTSE/JSE AFRICA PLATINUM MINING INDEX VS PGM PRICES*
PALLAD IUM PR ICE PLAT INUM PR ICE F TSE/JSE AFR ICA PLAT INUM MIN ING INDEX
77398-QC 1 Pages 297x210.indd 5 2015/04/20 2:51 PM

6QC 1 2015
Jewellery is another important, but fluctuating, component of platinum demand.
Decl ining resources
Global mining supply of platinum and palladium peaked roughly a decade ago (see Graph 2). It is interesting to compare this with South Africa’s gold production, which peaked in 1970. In the subsequent 45 years, SA gold production volumes have declined by more than 80%, but production from various other countries has more than made up for this decline. Contrast this with platinum: SA’s mineral-rich Bushveld Complex region produces approximately 70% of the world’s mining supply of platinum2 and contains an even-larger percentage of the world’s known reserves. The Norilsk region in northern Russia produces approximately half the remaining platinum mine supply. As platinum supply is so concentrated, it is extremely unlikely that SA could be replaced as a source of supply.
The problem is that SA production is falling, mostly due to declining grades. The shallow and easy-to-mine areas have mostly been exploited. Mining companies now have to go deeper and spend more
money to retrieve fewer grams per ton of rock mined. The supply of recycled platinum and palladium has been growing, but even when this is included, the total supply of both metals is still in decline.
Increasing input cost s
Over the past 10 years the cost to mine an ounce of platinum has increased, on average, by 15% per year, far in excess of the general inflation rate. This dramatic rise in costs has eroded the profits mining companies could potentially have earned from higher prices. Apart from the decline in grades discussed above, the chief culprits have been higher wages, declining productivity and pressure from government not to retrench workers. A high level of unionisation and inflexible
labour laws suggest that above-inflation wage increases are likely to continue. Recent examples of these pressures are the rise of the Association of Mineworkers and Construction Union (AMCU), increased inter-union
rivalry and the five-month strike by approximately 70 000 platinum-sector workers in 2014. As platinum mines become older and deeper they also need more maintenance and have increasing refrigeration and ventilation requirements.
Decl ining produc t ion capaci t y
At current PGM prices, less than half of SA’s platinum mines generate enough revenue to cover cash operating costs and capital expenditures. As we don’t expect costs to decrease, higher platinum and palladium prices are needed for the mining companies to break even and earn some return on their investments. What happens if prices do not increase? Mines can remain loss-making or marginal in the short term. Eventually, however, producers are forced to close loss-making mines and cancel expansion plans (this is already happening). In the meantime, production gradually declines as current mines are depleted.The majority of SA mines will have to keep producing for global platinum
Source: Johnson Matthey
1As measured by the FTSE/JSE Africa Platinum Mining Index return including dividends. 2For palladium, SA and Russia each accounts for approximately 40% of mining supply.
“THE MAJORITY OF SA MINES WILL HAVE TO KEEP PRODUCING FOR GLOBAL PLATINUM
SUPPLY TO EQUAL THE DEMAND”
PALLAD IUM
PLAT INUM
MIL
LION
OUN
CES
G RAPH 2 GLOBAL MINING PRODUCTION (MILLION OUNCES)
80 82 84 86 88 90 92 94 96 98 00 02 04 06 08 10 12 14
9
8
7
6
5
4
3
2
1
-
77398-QC 1 Pages 297x210.indd 6 2015/04/20 5:02 PM

7 QC 1 2015
TABLE 1 ALLAN GRAY BALANCED FUND PORTFOLIO WEIGHTS (AS A PERCENTAGE OF FUND) – 31 MARCH 2015
Platinum (platinum bars in a vault, via listed debentures) 2.1%
Palladium (palladium bars in a vault, via listed debentures) 0.5%
PGM mining shares 0.3%
supply to equal the (reasonably inflexible) demand. Effectively this means that rand PGM prices need to at least keep up with increases in SA mining costs.
A wor thwhi le investment oppor tuni ty?
As the past 10 years have shown, rising platinum and palladium prices are not necessarily enough to ensure good returns for shareholders of mining companies. Even if the next 10 years do turn out to be a good time to invest in mining companies, it would almost certainly be with the help of appreciating platinum and palladium
prices. At a time when assets in most markets are generally expensive, we tend to focus more on the possible downside of investments. We see a smaller risk of permanent loss of capital in owning the PGMs rather than the mining companies.
Conversely, the potential upside of owning platinum mining companies
may not be that big, as both labour and government seem likely to continue to make heavy demands on any economic profit generated by South African mines. Given this trade-off between risk and potential reward, we currently have a significantly larger exposure to platinum and palladium metals in our portfolios than to platinum mining companies (see Table 1).
Tim joined Allan Gray as an equity analyst in 2013. He has a Masters in Accounting, specialising in Taxation, from Stellenbosch University and is a CA(SA).
Source: Allan Gray
77398-QC 1 Pages 297x210.indd 7 2015/04/20 2:51 PM

8QC 1 2015
The South African property sector has been a huge winner over the last decade, returning 22% per year compared with 18% for the FTSE/JSE All Share Index (ALSI). Yusuf Mowlana and Jacques Plaut discuss how the sector has managed to perform so well, why we don’t think this performance will be repeated, and why property companies may be more risky than they appear at fi rst glance.
Looking back…
The past decade has been a very good one for property investors, as shown in Graph 1, which refl ects the total return of the property sector compared to shares and bonds over various time periods. Allan Gray clients have been underweight the sector over all these periods. With the benefi t of hindsight, this was obviously a mistake. Looking back, we underestimated the extent to which interest rates would decline and stay low under a very accommodative monetary policy in developed countries, and we underestimated the ability of some management teams to add value to their portfolios. On top of this, the resulting tailwind to valuations allowed listed property companies to benefi t
DECONS T RUC T ING T HE IN V E S T MEN T C A SE F OR P ROP ER T Y
from earnings-enhancing acquisitions in South Africa and overseas.
The return on any investment can be usefully broken down into a sum of the initial dividend yield, the growth in dividends, and the change in rating, or ‘re-valuation’, over time.
For clarifi cation, the dividend yield is the latest dividend, divided by the price of the investment. As the price goes up the dividend yield falls, so a lower dividend yield implies a more expensive share. When the dividend yield changes
in this way, it is called a ‘re-valuation’: the market changes its mind about how much a rand of dividends is worth.
Using this formula, we can break the 22% total annual return from property over the last decade into 8.7% from the initial dividend yield, 7.6% from dividend growth and 5.9% from re-valuation.
…Versus where we are now
While this past decade’s performance has been fantastic, it is unlikely to be
YUSUF MOWLANA & JACQUES PLAUT
45%
40%
35%
30%
25%
20%
15%
10%
5%
0%1 YEAR 3 YEARS 5 YEARS 10 YEARS
SA L I S T ED PROPERTY ALB I 2ALS I 1
*As at 31 March 2015. 1 FTSE/JSE All Share Index (ALSI). 2 JSE All Bond Index (ALBI).Source: I-Net BFA
GRAPH 1 ANNUALISED TOTAL RETURN OF PROPERTY VERSUS SHARES AND BONDS*
77398-QC 1 Pages 297x210.indd 8 2015/04/20 2:51 PM

9 QC 1 2015
repeated. Investors who buy into the sector today are only getting a 5.1% initial dividend yield, as shown in Graph 2. This might not seem so much more expensive than the 8.7% yield they would have received in 2005, but it equates to a 70% price increase!
Next, let’s consider dividend growth. The sector’s 8% growth over the last 10 years is better than inflation, which has averaged 6%, but worse than the average JSE-listed company, which has grown dividends at about 16% per year over the same period. Even this relatively modest 8% is an overstatement of underlying growth, since it has been boosted by acquisitions (which we discuss in more detail later), and by property companies paying less interest on their debt.
More generally, the upside from owning a property share is limited compared to other businesses. Some companies can re-invest earnings at a 30% plus return on equity, property companies tend to do single digits. Part of this is probably because the competitive position is different. Despite location advantages,
most malls and offices can be replicated, but it is harder to compete with an established brand like Cartier or the technology and commercial innovation expertise at work in Tencent.
In the last five years, there have been 29 new property listings, more than in any other sector. These have been driven by favourable valuations, but also by recent changes to regulation
favouring listed property over unlisted property. Large new offices are under construction in Sandton, Gauteng, despite already-high vacancies, generally low levels of net space uptake and a trend towards more efficient use of space. In most industries, high levels of investment, coupled with more competition, equals lower returns for existing players. With capacity expanding ahead of demand growth, certainly
one should expect lower growth in dividends for the next part of the industry cycle.
Lastly, re-valuation has added 6% to overall returns over the last 10 years, but this may not be the case over the next 10. Because interest rates are currently zero in many countries, investors are paying high prices for risky assets like shares, junk bonds,
and property. This has benefited South African property companies, which are currently trading at record-high valuations.
The large South African property companies in the sector currently trade at a premium to the 10-year rolling bond yield which was previously only surpassed in 2007 during the last decade. Investors appear to be pricing in future growth which is higher relative
Source: I-Net BFA
18
16
14
12
10
%
8
6
4
2
0
2002 2003 2004 2005 2006 2007 2008 2009 2010 2011 2012 2013 2014 2015
GRAPH 2 PROPERTY SECTOR DIVIDEND YIELD SINCE 2002
“BUT RIGHT NOW, WE THINK INVESTORS ARE PAYING A PREMIUM FOR PROPERTY STOCKS THAT IS NOT
JUSTIFIED BY THE FUNDAMENTAL PROSPECTS.”
77398-QC 1 Pages 297x210.indd 9 2015/04/20 5:05 PM

10QC 1 2015
TABLE 1 GROWTHPOINT CUMULATIVE CASH FLOWS (R bn)*
Cash profits from property rentals 17.6
Dividends to shareholders - 16.5
Capital expenditure - 37.2
Debt raised 12.7
Equity raised 23.6
Yusuf is part of the investment team. He joined Allan Gray in 2013 after completing his articles to qualify as a CA(SA). Yusuf holds a BBusSc degree from UCT.
Jacques joined Allan Gray in 2008 as an equity analyst after working as a management consultant. He began managing a portion of client equity and
balanced portfolios earmarked for associate portfolio managers from March 2013. Jacques completed his BSc degree at UCT.
to history and the risk is that growth disappoints.
Risks in the sec tor
One explanation for the sector’s high valuation could be that investors see very low risk to current earnings. We think this view is optimistic.
Many companies use debt to boost their returns. There is nothing wrong with this, but the extent to which this happens in the property sector is somewhat disquieting. Some property companies have a debt balance that is seven times larger than annual income. To put this another way: if a company in such a position applied all its income to paying off debt – and paid no dividends – it would take seven years to pay off all the debt. The only other sector that is more geared than this is the banking sector. It is no coincidence that both sectors have long-term contracts with their clients and relatively stable income. But in times of stress, the large debt balances will become more prominent in investors’ minds. Economically stressed tenants can’t always meet their commitments nor easily renew leases. If debt holders suddenly required higher interest rates or safer covenants, equity holders would be in trouble. If property valuers became more conservative, the ratio of
debt to property value would increase, and property companies would have to raise more money from shareholders. We saw this all happen to a dramatic extent in Australia in 2008.
Property companies do not account for the replacement cost of assets like other companies do: there is no depreciation charge on the income statement. In this respect, long-term earnings are overstated, and property companies normally need to issue debt or shares to be able to pay for capital expenditure. Take Growthpoint, the largest South African property stock, as a typical example. Table 1 shows some cash flow numbers for the share over the past decade.
It is clear that capital expenditure – some of which was for growth, and some of which was for replacing or upgrading old buildings – has been paid for by borrowing money and by issuing shares. It is striking that the company has raised R7bn more from shareholders than it has paid to shareholders. As a result, Growthpoint’s shares in issue have increased by 14% per year over this period.
To a large extent, these shares have been issued to make acquisitions. And mostly, Growthpoint has bought
companies trading on a higher dividend yield than itself – in other words, companies that the market has placed on a cheaper valuation than Growthpoint itself. This operation has the effect of boosting earnings per share even when there is no actual organic improvement. (Please refer to Simon Marais’ article in Quarterly Commentary 2, 2000, for a fuller explanation of how this works.)
We believe Growthpoint has added real value by issuing all those shares in order to make acquisitions, however we don’t think this is something it will be able to repeat given its current size.
Beware of paying a premium
With hindsight, there were times in the last 10 years when we should have been more positive about property. But right now, we think that investors are paying a premium multiple for property stocks that is not justified by the fundamental prospects.
The re-valuation tailwind is not likely to repeat, and may even reverse. Dividend growth has been boosted by acquisitions. We think the market does not fully appreciate all of the risks in the sector, especially the high level of gearing. Unlike in the late 1990s, when more than 20% of our clients’ balanced portfolios was invested in property and the dividend yield on the property sector went as high as 23%, we continue to have an underweight position in the sector.
*July 2004 – June 2014Source: Growthpoint Financial Statements, Allan Gray Research
77398-QC 1 Pages 297x210.indd 10 2015/04/20 2:51 PM

11 QC 1 2015
This piece was originally published in the Orbis March 2015 Quarterly Manager’s Report.
Over the 25-year history of Orbis’ Global Equity Fund, the underlying investment philosophy has not changed. We value businesses on a bottom-up basis and buy the shares of those that are priced at a signifi cant discount to our assessment of intrinsic value. Assuming we are correct in our analysis,which is something we review throughout the life of each investment, we believe that the price of each share we’ve selected will come to refl ect the underlying value of the business. What we are less sure of is the timing.
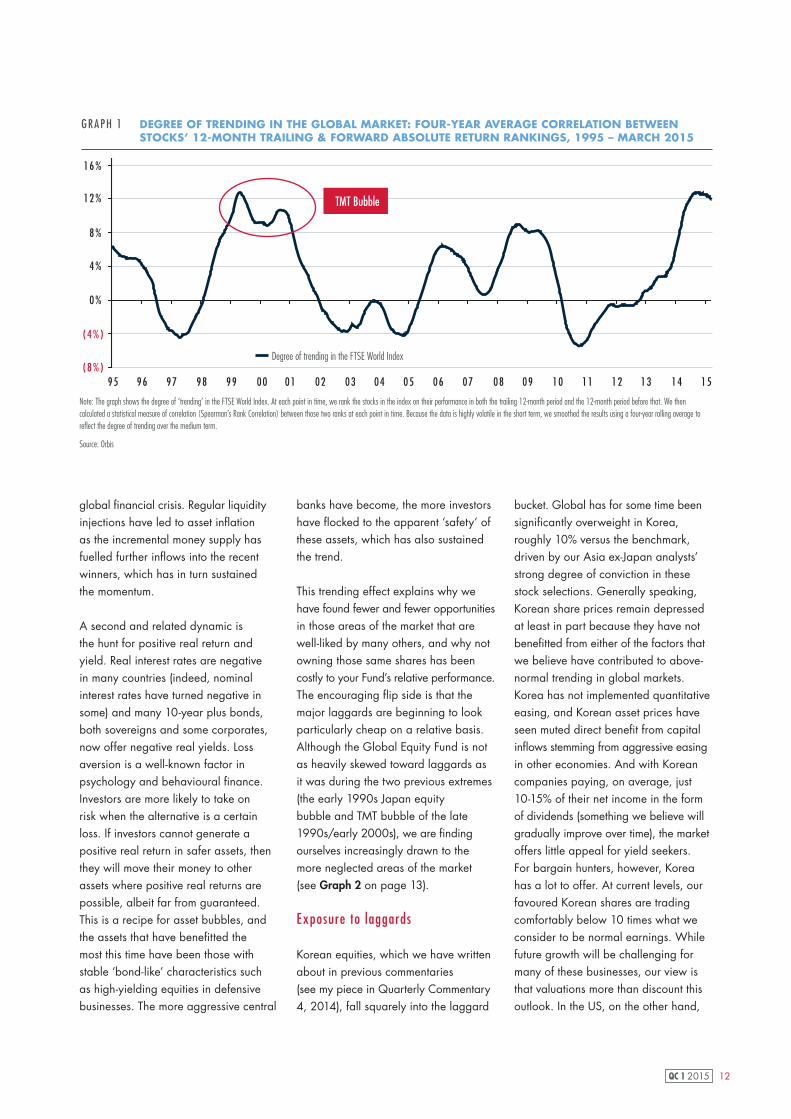
Painful periods have common charac teris t ic s
In some of the more painful periods, prices can become increasingly detached from the underlying value. These periods typically have some common characteristics. One such trait is the degree to which shares are ‘trending’, defi ned as the tendency for shares that have outperformed the
OR BIS GLOBA L EQUI T Y: GUIDED BY OUR IN V E S T MEN T P HILO S OP H Y
GRAEME FORSTER
market in the recent past to continue to outperform, and vice versa. During these periods, it’s more likely that your Fund’s holdings, which are often unloved, ignored, or misunderstood by the market, will continue on their path of underperformance and move further away from intrinsic value.
Graph 1 plots the degree to which global shares have, on average, trended since the mid-1990s. As one would expect, the late 1990s saw a high degree of trending as technology, media, and telecommunications (TMT) shares outperformed consistently for multiple years. It was a classic example of share prices becoming detached from the reality of their fundamental value, and your Fund,
along with those managed by many other value-oriented managers, struggled to keep up with the broader stockmarket. The most recent period,
which spans the end of the global fi nancial crisis until today, has also been a strongly trending market. That’s not to say that our own mistakes did not contribute to below-par performance in either of these periods, only that there have been other headwinds that have been less under our control.
This is an emotive graph, as it hints at the potential for a similar valuation dislocation to that witnessed before the TMT bubble began to burst. We wouldn’t go that far. For one, the extreme trending in that period was sustained for a few years longer than we have seen recently, and is a stark reminder that today’s trending environment could be far from over. However, the graph does illustrate
that the trending effect has been abnormally strong. Part of this has been driven by extreme measures taken by central banks in the wake of the
“BY FOCUSING RELENTLESSLY ON INTRINSIC VALUE . . . WE CAN EARN OUR KEEP AS STEWARDS OF YOUR CAPITAL .”
77398-QC 1 Pages 297x210.indd 11 2015/04/20 2:51 PM
12QC 1 2015
global financial crisis. Regular liquidity injections have led to asset inflation as the incremental money supply has fuelled further inflows into the recent winners, which has in turn sustained the momentum.
A second and related dynamic is the hunt for positive real return and yield. Real interest rates are negative in many countries (indeed, nominal interest rates have turned negative in some) and many 10-year plus bonds, both sovereigns and some corporates, now offer negative real yields. Loss aversion is a well-known factor in psychology and behavioural finance. Investors are more likely to take on risk when the alternative is a certain loss. If investors cannot generate a positive real return in safer assets, then they will move their money to other assets where positive real returns are possible, albeit far from guaranteed. This is a recipe for asset bubbles, and the assets that have benefitted the most this time have been those with stable ‘bond-like’ characteristics such as high-yielding equities in defensive businesses. The more aggressive central
banks have become, the more investors have flocked to the apparent ‘safety’ of these assets, which has also sustained the trend.
This trending effect explains why we have found fewer and fewer opportunities in those areas of the market that are well-liked by many others, and why not owning those same shares has been costly to your Fund’s relative performance. The encouraging flip side is that the major laggards are beginning to look particularly cheap on a relative basis. Although the Global Equity Fund is not as heavily skewed toward laggards as it was during the two previous extremes (the early 1990s Japan equity bubble and TMT bubble of the late 1990s/early 2000s), we are finding ourselves increasingly drawn to the more neglected areas of the market (see Graph 2 on page 13).
Exposure to laggards
Korean equities, which we have written about in previous commentaries (see my piece in Quarterly Commentary 4, 2014), fall squarely into the laggard
bucket. Global has for some time been significantly overweight in Korea, roughly 10% versus the benchmark, driven by our Asia ex-Japan analysts’ strong degree of conviction in these stock selections. Generally speaking, Korean share prices remain depressed at least in part because they have not benefitted from either of the factors that we believe have contributed to above-normal trending in global markets. Korea has not implemented quantitative easing, and Korean asset prices have seen muted direct benefit from capital inflows stemming from aggressive easing in other economies. And with Korean companies paying, on average, just 10-15% of their net income in the form of dividends (something we believe will gradually improve over time), the market offers little appeal for yield seekers. For bargain hunters, however, Korea has a lot to offer. At current levels, our favoured Korean shares are trading comfortably below 10 times what we consider to be normal earnings. While future growth will be challenging for many of these businesses, our view is that valuations more than discount this outlook. In the US, on the other hand,
GRAPH 1 DEGREE OF TRENDING IN THE GLOBAL MARKET: FOUR-YEAR AVERAGE CORRELATION BETWEEN STOCKS’ 12-MONTH TRAILING & FORWARD ABSOLUTE RETURN RANKINGS, 1995 – MARCH 2015
Source: Orbis
16%
95 96 97 98 99 00 01 02 03 04
TMT Bubble
05 06 07 08 09 10 11 12 13 14 15
12%
8%
4%
0%
(4%)
(8%)
Note: The graph shows the degree of ‘trending’ in the FTSE World Index. At each point in time, we rank the stocks in the index on their performance in both the trailing 12-month period and the 12-month period before that. We then calculated a statistical measure of correlation (Spearman’s Rank Correlation) between those two ranks at each point in time. Because the data is highly volatile in the short term, we smoothed the results using a four-year rolling average to reflect the degree of trending over the medium term.
Degree of trending in the FTSE World Index
77398-QC 1 Pages 297x210.indd 12 2015/04/22 11:34 AM

13 QC 1 2015
Graeme joined Orbis in 2007 and is a member of Orbis’ portfolio management and construction team in Bermuda. Before moving to Bermuda, Graeme spent five years in London where his primary responsibility was global quantitative equity research. He has a Master of Arts (Honours) in Mathematics (University of Oxford), Master of Research in Applied Mathematics (University of York), Doctor of Philosophy in Mathematical Epidemiology and Economics (University of Cambridge), and is a CFA charter holder.
sentiment is ebullient, with the market’s valuation now above 17 times next year’s estimated earnings—and those earnings are arguably above normal levels.
Aside from Korea, your Fund’s exposure to laggards is spread across a range of other shares. An example of a laggard we hold in Europe is The Royal Bank of Scotland (RBS). As is the case with the Fund’s Korean holdings, RBS has generated little interest from yield-seeking investors, being both leveraged and having not paid a dividend since
the final quarter of 2007. However, a new management team is in the process of shrinking the balance sheet, which is delaying the payment of dividends and obscures the true value of the underlying franchises. As the restructuring comes to a close, we expect RBS to emerge as a well-capitalised bank with excellent profitability and a solid dividend payout ratio. We believe the shares will deserve a premium to net asset value, or certainly more than the current valuation of just 0.7 times net asset value.
Of course, the laggards may continue to lag and we can never know how or when it will end. As George Charles Selden wrote over 100 years ago, ‘it is exhaustion of liquid capital that brings the bull movement to an end’, and the market doesn’t appear to be short of liquid capital for the time being. What we do know for certain is that momentum-driven markets have typically ended badly in the past. By focusing relentlessly on intrinsic value, it is during these times that we can earn our keep as stewards of your capital.
0 .75
Japan Bubb l e
Mor
e at
trac
tive
Higher relative return
TMT Bubb l e
Three-year subsequent relative return (RHS)
Relative attractiveness (LHS)
40%
30%
20%
10%
0%
(10%)
(20%)
(30%)
(40%)
0 .50
0 .55
0 .60
0 .65
0 .70
0 .25
0 .30
0 .35
0 .40
0 .45
90 91 92 93 94 95 96 97 98 99 00 01 02 03 04 05 06 07 08 09 10 11 12 13 14 15
GRAPH 2 GLOBAL LAGGARDS ARE BECOMING MORE ATTRACTIVE: RELATIVE ATTRACTIVENESS OF GLOBAL LAGGARDS AND THEIR THREE-YEAR SUBSEQUENT RELATIVE RETURN, 1990 - MARCH 2015
Source: Orbis
77398-QC 1 Pages 297x210.indd 13 2015/04/22 11:34 AM

14QC 1 2015
When we launched the Allan Gray Stable Fund 15 years ago, we hoped that it would provide clients with returns that were competitive with bank deposits. The Fund has more than lived up to this, exceeding bank deposits by 5.6% per year since its inception, with a low risk of capital loss. Mahesh Cooper and Fiona Jeffery go back to the basics in this article, describing how the Stable Fund goes about achieving its objectives and what investors can expect over the long term. They also unpack the recent performance of the Fund and its positioning in the light of current market conditions.
The Allan Gray Stable Fund was one of the fi rst of its kind in the South African unit trust space: a fund dedicated to delivering above-cash returns with low risk of capital loss. The Fund’s portfolio managers start with this objective of preserving our clients’ capital and then seek to deliver returns in excess of cash.
The Stable Fund is construc ted from the bot tom-up
We follow a valuation-based investment philosophy and construct our portfolios from the bottom-up, looking for assets, such as shares, bonds and property,
S TA BL E F UND : S A F EGUA R DING OUR C L IEN T S’ C A P I TA L I S OUR COR E F OCUS
MAHESH COOPER & FIONA JEFFERY
where the current price is less than our estimate of their intrinsic or underlying value. The Stable Fund’s positioning is a direct result of this approach: shares and other assets are selected based on their attractiveness relative to cash. For example, if we are able to fi nd many individual SA-listed shares attractive relative to cash, taking into account its focus on capital preservation, the Stable Fund will have a higher exposure to shares, eventually up to its maximum net equity exposure of 40%. On the fl ipside, the Fund can have zero exposure to shares if we are not able to fi nd
any attractively priced shares to buy. Alternatively, some of the share exposure may be through our offshore partner, Orbis (if we consider other markets to be more attractively priced than South Africa). The Stable Fund’s 40% share exposure limit contrasts with the Allan Gray Balanced Fund, where the net equity exposure must be between 40%
and 75%. Given the Stable Fund’s capital preservation objectives, the selection of individual assets is also inherently more conservative.
The Fund is often compared with others in the low equity multi-asset class category, many of which allow for a greater short-term risk of capital loss to try and capture a higher long-term return. As with all our funds, our portfolio managers pay no attention to how the Fund’s competitors are invested or the composition of any benchmark. The positioning of the Fund is driven solely by the objectives of
delivering above-cash returns with a low risk of capital loss. This means that there will be times when the Fund is ahead of its competitors, but there will also be times when the Fund is behind others in the same sector. Regardless, the portfolio managers always remain focused on achieving the Fund’s own objectives, irrespective of what others are doing.
“THE POSITIONING OF THE FUND IS SOLELY DRIVEN BY THE OBJECTIVES OF DELIVERING ABOVE-CASH RETURNS
WITH A LOW RISK OF CAPITAL LOSS.”
77398-QC 1 Pages 297x210.indd 14 2015/04/20 2:51 PM

15 QC 1 2015
What can we expec t over the very long term?
Readers of our Quarterly Commentary will know that we have been concerned about the level of the South African equity market for some time. South Africa has been a great place to invest in over the last 15 years, with all asset classes delivering returns well above inflation, and this has provided a boost for low equity strategies like the Stable Fund. However, very long-term historical data suggests investors should become accustomed to lower real returns going forward.
Graph 1 is based on data that tracks the after-inflation returns of different South African asset classes over the last 115 years. We have used this data to construct theoretical returns over rolling 10-year periods for a low equity portfolio invested in South African asset classes, comprising one-third equities, one-third bonds and one-third cash. The solid blue line shows the returns this portfolio has produced over 10-year rolling periods since 1900, with the bars representing the contributions
from the asset classes, while the dotted black line shows the average of these 10-year real rolling returns – just over 3% per year above inflation. Looking at recent history, we can see how returns from all South African asset classes have been well above their long-term averages. However, there have also been periods in the past when this low equity portfolio has delivered returns
below inflation over a 10-year period, sometimes for long periods at a time. After a long period of returns well above average (since the early 1990s), returns could be below their long-term average for a period of time, to offset the recent relative strength.
Graph 2 uses the same data as Graph 1, but instead of just looking at 10-year
50%
40%
30%
20%
10%
0%
-10%
-20%
-40%
-30%
-50%
NUMBER OF YEARS INVESTED
Source: Elory Dimson, Paul Marsh, and Mike Staunton, Triumph of the Optimists: 101 Years of Global Investment Returns, Princeton University Press, 2002 and subsequent research Elory Dimson, Paul Marsh, and Mike Staunton, The Credit Suisse Global Investment Returns Sourcebook 2015 I-Net BFA, Allan Gray Research
GRAPH 2 FLUCTUATION OF LONG-TERM REAL RETURNS FROM A THEORETICAL LOW EQUITY PORTFOLIO
Source: Elory Dimson, Paul Marsh, and Mike Staunton, Triumph of the Optimists: 101 Years of Global Investment Returns, Princeton University Press, 2002 and subsequent research Elory Dimson, Paul Marsh, and Mike Staunton, The Credit Suisse Global Investment Returns Sourcebook 2015 I-Net BFA, Allan Gray Research
12.0
8.0
10.0
6.0
4.0
2.0
0.0
-2.0
-4.0
-6.0
-8.0
1909
1912
1915
1918
1921
1924
1927
1930
1933
1936
1939
1942
1945
1948
1951
1954
1957
1960
1963
1966
1969
1972
1975
1978
1981
1984
1987
1990
1993
1996
1999
2002
2005
2008
2011
2014
G RAPH 1 TOTAL REAL RETURN FOR A THEORETICAL LOW EQUITY PORTFOLIO OVER THE VERY LONG TERM
WHEN THE BLUE L INE I S ABOVE 0% , THE PORTFOL IO HAS DEL IVERED RETURNS ABOVE INFLAT ION AND V I CE VERSA .
TOTA
L RE
AL R
ETUR
N (%
)
C ONTR IBUT ION FROM EQU I T I E S CONTR IBUT ION FROM BONDS CONTR IBUT ION FROM CASH TOTAL REAL RETURN AVERAGE REAL RETURN
VARI
ATIO
N OF
TOT
AL R
EAL
RETU
RNS
FOR
A
THEO
RETI
CAL
LOW
EQU
ITY
STRA
TEGY
(%)
1 2 3 4 5 6 7 8 9 10 11 12 13 14 15 16 17 18 19 20 21 22 23 24 25 26 27 28 29 30
OVER ALL 5-YEAR ROLLING PERIODS, THE LOW EQUITY PORTFOLIO HAS PRODUCED RETURNS VARYING FROM -7.9% TO 18.1% IN REAL TERMS.
77398-QC 1 Pages 297x210.indd 15 2015/04/20 2:51 PM
16QC 1 2015
Source: I-Net BFA, Allan Gray Research
real returns, it looks at the real returns achieved by the portfolio over different time periods. The vertical axis shows the spread of real returns that our hypothetical low equity portfolio would deliver over one, two, three years, etc., all the way to 30 years. For example, over all the five-year rolling periods going back to 1900, this portfolio has produced five-year real returns, which have varied between -7.9% and 18.1% per year. What becomes obvious is that, over the shorter term, the outcomes of the portfolio are much more variable than the longer term. This is true for most investments. It is also worth pointing out that, over a one-year period, the portfolio failed to outperform inflation 37% of the time; this drops to 31% over a two-year period. It is only after 25 years that all outcomes for the range of real returns are positive. So over the short term, investors can expect a lot more fluctuation in the real returns they experience than over the longer term. In addition, a low equity portfolio may deliver a negative nominal return over the short term. This has happened in 16 out of the last 115 calendar years for our hypothetical low equity portfolio.
With this in mind, let us consider the returns of the Fund.
Performance
The more recent returns for the Stable Fund have been disappointing relative to the longer-term returns. This is better understood in the context of the Fund’s positioning, which has been cautious over the last few years, and is covered in the next section.
Since inception 15 years ago, the Fund has delivered a return of 12.9% per year (7.2% real return). While we think
these returns are pleasing in light of the Fund’s capital preservation objectives and low levels of risk, they have been achieved during a very favourable environment for asset management in South Africa, during which all asset classes have performed strongly. It is important that we remind ourselves that this performance is in the past, and that prices today determine returns going forward. From the current high starting point, we expect that the next 15 years are likely to be far more challenging.
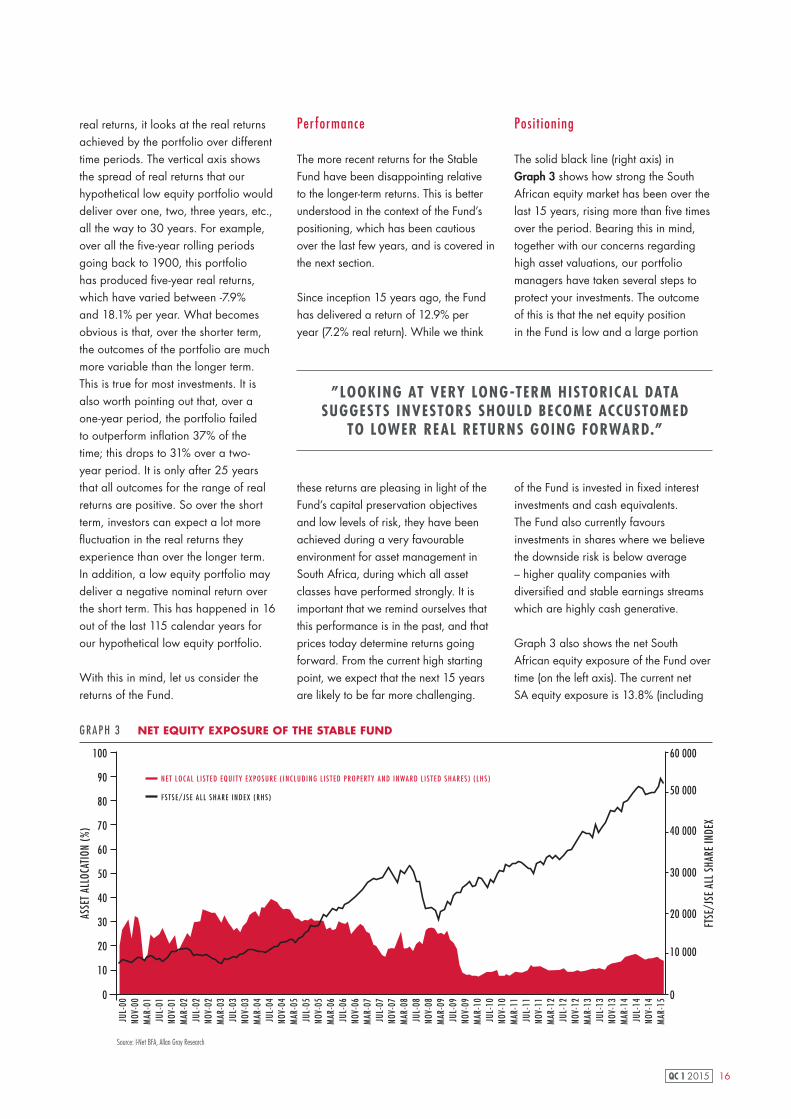
Posi t ioning
The solid black line (right axis) in Graph 3 shows how strong the South African equity market has been over the last 15 years, rising more than five times over the period. Bearing this in mind, together with our concerns regarding high asset valuations, our portfolio managers have taken several steps to protect your investments. The outcome of this is that the net equity position in the Fund is low and a large portion
of the Fund is invested in fixed interest investments and cash equivalents. The Fund also currently favours investments in shares where we believe the downside risk is below average – higher quality companies with diversified and stable earnings streams which are highly cash generative.
Graph 3 also shows the net South African equity exposure of the Fund over time (on the left axis). The current net SA equity exposure is 13.8% (including
”LOOKING AT VERY LONG-TERM HISTORICAL DATA SUGGESTS INVESTORS SHOULD BECOME ACCUSTOMED
TO LOWER REAL RETURNS GOING FORWARD.”
100
80
90
70
60
50
40
30
20
10
0
GRAPH 3 NET EQUITY EXPOSURE OF THE STABLE FUND
ASSE
T AL
LOCA
TION
(%)
FTSE
/JSE
ALL
SHA
RE IN
DEX
60 000
50 000
40 000
30 000
20 000
10 000
0
NET LOCAL L I S T ED EQU I TY EXPOSURE ( INCLUD ING L I S T ED PROPERTY AND INWARD L I S T ED SHARES ) ( LHS )
FS TSE/JSE ALL SHARE INDEX (RHS )
JUL-
00NO
V-00
MAR
-01
JUL-
01NO
V-01
MAR
-02
JUL-
02NO
V-02
MAR
-03
JUL-
03NO
V-03
MAR
-04
JUL-
04NO
V-04
MAR
-05
JUL-
05NO
V-05
MAR
-06
JUL-
06NO
V-06
MAR
-07
JUL-
07NO
V-07
MAR
-08
JUL-
08NO
V-08
MAR
-09
JUL-
09NO
V-09
MAR
-10
JUL-
10NO
V-10
MAR
-11
JUL-
11NO
V-11
MAR
-12
JUL-
12NO
V-12
MAR
-13
JUL-
13NO
V-13
MAR
-14
JUL-
14NO
V-14
MAR
-15
77398-QC 1 Pages 297x210.indd 16 2015/04/20 2:51 PM
17 QC 1 2015
Mahesh is a director of Allan Gray Proprietary Limited and heads up the Institutional Client Servicing team. He joined Allan Gray in 2003, having had
previous experience in investment and healthcare consulting. He completed his BBusSc degree at UCT and his MBA at IMD. He is a qualified actuary.
Fiona joined Allan Gray in 2009 as a business analyst in the Institutional Client Servicing team. She has a BCom (Hons) from the University of Stellenbosch
and is a CFA charter holder.
1 A hedged equity strategy offers clients a cash-like return, plus alpha (the extent to which the shares in the portfolio either outperform or underperform the market). It is important to bear in mind that alpha can be negative in the short term and therefore detract from the cash return. However, over the long term, we expect that Orbis’ and our stock selections will be able to add value for clients and hence enhance the cash returns.
2 Via the range of funds managed by our offshore investment partner, Orbis (excluding African ex-SA investments)
property), lower than the long-term average of 23.2% and well below the overall maximum 40% permitted. As is evident in Graph 3, we have been cautiously positioned for some time.
This low exposure to South African equities has hurt the Fund’s performance both in absolute terms and relative to its competition as the stock market has continued to rise. With the benefit of hindsight, we lowered the Fund’s equity exposure too quickly in 2009/10 post the global financial crisis. We can’t undo the past, but we do continuously and rigorously assess our positioning and, in light of current market conditions, we believe that the net South African equity exposure is appropriate.
A large portion of the Fund is invested in ‘hedged equities’, both locally and offshore. We use hedging when we are concerned about asset valuations as it provides downside protection for your investments. Hedged equities can be thought of as cash-equivalents where we effectively exchange market returns for more stable cash-like returns. At the same time, we retain exposure to the potential outperformance from our selection of shares relative to the market, which should further enhance returns over the long term1.
Unfortunately hedging has recently detracted from returns as equity markets have continued to outperform cash returns, and Orbis’ offshore stock selection has been disappointing. Hedged equities, however, offer a source of returns which are uncorrelated
to equities, adding diversification benefits on behalf of our clients. This portion of the Fund is also very liquid and, together with the cash in the portfolio, provides us with the flexibility of being able to materially increase net equity exposure (by decreasing the hedged equities and deploying the cash reserves) at some point in the future when shares present more attractive opportunities.
We also continue to hold the maximum permitted allocation of offshore assets2 in the Fund. We have written before about the benefits of investing offshore (please see Seema Dala’s piece in Quarterly Commentary 1, 2013 and Mahesh Cooper and Ian Liddle’s piece in Quarterly Commentary 4, 2010) and we continue to believe that the offshore exposure in the Fund will assist in preserving the purchasing power of our clients’ capital over the long term. However,
more recently this positioning has hurt performance. While the Orbis funds performed very well in 2013, last year was disappointing, with all of the Orbis’ funds underperforming their benchmarks. This was primarily driven by Orbis’ selection of shares performing poorly relative to global equity markets (see Graeme
Forster’s piece on page 11). Global equity markets are also looking more stretched and, in light of its conservative objectives, the Fund has favoured a more cautious net equity exposure offshore, which has detracted from returns given the strong performance of global markets.
Capital preservat ion is key
Although the Fund’s conservative positioning has hurt its recent performance, we believe that, in the current environment, it is the appropriate way to fulfil our objective of protecting our clients’ capital over the long term. We expect it to be more difficult to achieve cash-beating returns going forward. If equity markets locally and globally continue to perform strongly, our clients can expect the Stable Fund’s returns to be lower than its peers’ returns. However, if valuations revert to what we believe
are more normal levels, hopefully the more conservative approach we take in the Stable Fund will provide our clients with more downside protection. In the meantime, you can rest assured that we remain as focused as always on preserving and growing our clients’ investments over the long term.
“…HOPEFULLY THE MORE CONSERVATIVE APPROACH WE TAKE IN THE STABLE FUND WILL PROVIDE OUR
CLIENTS WITH MORE DOWNSIDE PROTECTION.”
77398-QC 1 Pages 297x210.indd 17 2015/04/20 2:51 PM

18QC 1 2015
In Quarterly Commentary 1, 2013 we wrote about retirement reform, discussing how the changes would affect existing and potential retirement fund members. Fast forward two years and most of the mooted changes have been delayed until at least 2016. But the delay in regulation is no reason to delay saving for retirement. The changes are positive, on the whole, and will make for a better, more well-rounded industry. Overall, Treasury wants us to save more and take less out along the way. Ultimately, this will lead to South Africans accumulating more retirement savings and thus enable smarter long-term choices when we retire.
Richard Carter discusses the benefi ts of saving for retirement through a modern unit trust-based retirement annuity fund, and how retirement annuities can be managed on a group basis to provide an excellent group savings solution for small to medium-sized businesses.
The 2015 Budget reminded us that retirement reform is an ongoing process, with several of the proposed changes potentially coming into effect on 1 March at the earliest.
DEL AY S T O R E T IR E MEN T R EF OR M SHOUL DN’ T ME A N DEL AY S T O YOUR R E T IR E MEN T S AV ING S
RICHARD CARTER
Table 1 on page 19 outlines where we are at. Understandably, potential investors would rather have certainty before making investment commitments. Delaying saving while waiting for clarity is a bad idea. The importance of starting to save for retirement sooner rather than later cannot be underestimated. We can’t get time back once we have spent it.
Accumulating enough capital to live comfortably in retirement is a daunting task for most people. To get this right you need to start investing early in life, keep putting aside enough on a regular basis, invest the money wisely and don’t
dip into your accumulated capital along the way. Getting any of these four ingredients wrong can undermine the end result. There has been uncertainty in the retirement landscape for some time, and we don’t expect this to go away overnight. An investor who took a
break from saving for the last two years could easily fi nd themselves more than two years behind, as not only have they put aside less capital and missed out on market growth, but they have also set their level of consumption higher. For many of us, the more we spend now, the harder it will be to live off less in future.
Take advantage of tax perks
The government encourages us to save for retirement by offering tax benefi ts for using approved retirement savings products, such as a retirement annuity fund (RA). RAs are effectively personal
retirement funds that, because they aren’t linked to your employer, go where you go. They give self-employed people a tax incentive to save for retirement, and are also an excellent way to increase retirement savings outside of your employer’s pension
“. . .YOU NEED TO START INVESTING EARLY, KEEP PUTTING ASIDE ENOUGH, INVEST THE MONEY WISELY AND
DON’T DIP INTO ACCUMULATED CAPITAL . . .”
77398-QC 1 Pages 297x210.indd 18 2015/04/20 2:51 PM

19 QC 1 2015
or provident fund. In addition, RAs are already structured to enforce preservation and provide for an easy transition into a pension at retirement – which are key elements of the retirement reform proposals.
A solut ion for groups
If you are an employer, consider offering your staff an RA as a benefit. Employers who illustrate to their staff that they care about their futures by providing them with a retirement savings solution, along with investor education, are likely to see increased employee engagement. Happy, engaged employees are less likely to start looking for greener pastures.
In many ways Group RAs can be a better choice for employers and their employees than other retirement funding options, such as umbrella funds, which can have higher costs and time-consuming administrative requirements.
An efficient group retirement annuity system allows employers, particularly those in small- to medium-sized businesses, the time to manage their businesses, while avoiding tedious administration requirements, all the while not detracting from the importance of retirement saving for their employees. Group systems also ensure that employees get all the benefits of an individually managed unit trust-based RA. These include:
Tax advantages Contributions to an RA (within certain limits) are tax deductible, and the returns employees earn while invested in an RA are tax-free. However, at retirement any cash lump sum taken will be taxed according to the retirement tax tables and the portion transferred to a pension-providing product will be taxed at the marginal tax rate.
Investment control Employees can choose the right unit trust to match their individual needs and circumstances. Keep in mind that, unlike a bank account, return is not guaranteed and may go up and down.
Flexibility and portability Employees can change their unit trust choice and their contribution amount, stop and restart contributions or add to their investment at any time, without fees or penalties. If an employee changes jobs, he/she can continue to contribute to their RA.
Investment protection An RA ensures that employees’ retirement investments are kept for their retirement because they will not be able to access their RA investment until they turn 55, and neither can any potential creditors.
TABLE 1 RETIREMENT REFORM – WHERE ARE WE AT?
CURRENT PROPOSED
Aligning retirement funds: accessing your money Before retirement: it is possible to draw your full benefit from a pension and provident fund, but not from an RA, when you leave the fund.
At retirement: Provident funds allow you to take your full investment as cash. Pension fund and RA members can only take one-third in cash, the rest must be used to purchase an income-providing product, such as a living annuity or a guaranteed annuity.
Treasury plans to harmonise retirement funds, but has stressed that vested rights will be protected. Provident fund members will not be forced to annuitise their historic savings.
Aligning retirement funds: tax Employer contributions to occupational pension and provident funds are not considered to be a fringe benefit.
Employer contributions to occupational pension and provident funds will eventually be taxed in the hands of the member as a fringe benefit and the member will get a tax deduction on the total contribution towards retirement funds, subject to the annual percentage and monetary limit.
Full withdrawal limits at retirement If the value of your retirement benefit at retirement is less than R75 000, you should be able to withdraw the entire amount without the need to purchase an annuity.
If the value of your retirement benefit at retirement is less than R150 000, you should be able to withdraw the entire amount without the need to purchase an annuity.
Increased tax deductions for contributions to retirement funds
You are allowed the greater of the following three tax deductions:- Minimum tax deduction: R1 750- R3 500 less any contributions made to a pension fund
- 15% of your non-retirement funding income
Retirement fund members will eventually enjoy increased tax deductions from their contributions to retirement funds of up to 27.5% of the greater of taxable income or employment income, and the introduction of an annual contribution ceiling of R350 000.
Estate duty in retirement annuity funds It has been possible for some individuals to avoid estate duty by transferring their assets into a retirement annuity fund before their death.
To eliminate the potential to avoid estate duty, government proposes that an amount equal to the non-deductible contributions to retirement funds be included in the dutiable estate when a retirement fund member passes away.
77398-QC 1 Pages 297x210.indd 19 2015/04/20 2:51 PM

20QC 1 2015
Richard joined Allan Gray in 2007 after working for several years in financial services in the UK. He is jointly responsible for the retail business, heading
up Product Development and is also a director of Allan Gray Life. Richard completed his B Bus Sc degree at UCT and is a qualified actuary.
Transparency, communication and education Approaches to communication vary depending on the RA provider. At Allan Gray we believe it is essential to give members ownership and a sense of responsibility for their investment. Members can register for a login for our secure website, which allows them to monitor and manage their investment online. We also offer member training and education.
How do tradi t ional employer ret irement funds dif fer from modern uni t trust-based R As?
Unlike an RA, where anyone can invest in their own right, in traditional pension or provident funds, contributions are deducted from employees’ pre-tax salary. Employees often have little control over their investment and when they leave their employer their membership of the fund ends.
Some employer funds give employees a specified retirement benefit – or pension – when they retire. These funds do not give members investment choice or control. In other funds,
the benefit is not guaranteed and depends on how much is contributed and how well the investment performs. In these funds, members may be allowed some degree of investment choice.
In comparison, modern unit trust-based RAs simply wrap around a unit trust investment. Members decide how their money is invested (within legal limits), which means they have more control over their potential investment return than they would in traditional employers’ retirement funds.
As an employer considering whether to go with a more traditional retirement fund, such as an umbrella pension fund, or a group RA, we think you should focus on three key points:
1. Consider the investment options available. While many products give access to great investment managers, not all do, and you want to be sure that your employees’ savings will be made to work as hard as possible by managers who are striving to deliver the best returns for the risk taken.
2. Look at the costs and transparency of disclosure. The range of fees and charges of different products can be bewildering. Don’t assume that the costs are similar in all retirement savings arrangements – they can be wildly different and these differences, compounded over a working lifetime, can be the difference between your employees enjoying a comfortable retirement or not having enough to live off.
3. Bear in mind what happens to your employees’ retirement savings if they exit your employment before retirement. In a conventional retirement fund employees have the opportunity to take all the accumulated savings. If they don’t invest these wisely, they end up having to start saving for retirement all over again. By contrast, when they leave a group RA, their individual RAs go with them. While this means no access to cash at a time when some cash may be useful, the discipline of having a pot of money which will be there when you finally retire, empowers people to secure a better future.
77398-QC 1 Pages 297x210.indd 20 2015/04/20 2:51 PM
21 QC 1 2015
INV
ESTIN
G TU
TOR
IALS
AC T I V E V ER SUS PA S S I V E
THANDI NGWANE
Thandi joined Allan Gray in 2008. She is a senior member of the distribution team having previously worked in legal and compliance and marketing in the financial services sector. Thandi completed her Masters of Business Law at the University of KwaZulu-Natal, has an advanced CFP from the University of the Free State and is an admitted attorney.
As a proud advocate of a committed active manager, Thandi Ngwane does her best to stay objective in discussing the pros and cons of active and passive investment approaches.
Every asset manager has an investment philosophy – a stated approach to investing. To understand an investment philosophy, a good question to start with is to ask whether the asset manager is an ‘active’ or ‘passive’ investor.
Active managers study individual assets or groups of assets and make an active choice about which to own for their clients and which not to own – thus the word ‘active’. They think that the market sometimes misprices assets, such as shares, bonds and property, and that this creates opportunities to earn a return, for example to buy a share at a discount and then to sell it when it goes up in price.
If they are skilled enough over the long term to get more than half of these decisions right, and if they also put a bit more money in the winners than in the losers in their portfolios, they grow the savings of their clients by more than had they invested in ‘the index’ (a basket of investment instruments, e.g. shares, representing the overall market).
Active managers can do better or worse than the market depending on which
individual shares or other investments they choose to own for their clients, and which they choose not to own. Not owning a share can have a positive outcome relative to the market, if that share loses value and drags down the overall market.
Passive managers, as their name implies, don’t make any active choices about what to own and what to leave out of their clients’ portfolios, they just buy a small amount of all the shares in the relevant stock-market index, normally in proportion to the market price of the company that that share represents. Since they don’t try to make active choices, their philosophy implies that the price of shares is efficiently set by the share market, in other words, that the current price of each share is the best indicator of its long-term value.
Naturally, passive investors have no hope of beating the market, but they also are not in danger of doing much worse than the market. And passive managers have lower costs because they don’t do research and therefore don’t need to employ any investment analysts.
Which is bet ter?
The prices of shares move when they are bought and sold. On each share trade there is a buyer and a seller, and, looking back, one of these will be right and one wrong. Because valuations are never certain, sometimes the lucky manager will be right. This is especially true over the short term when price movements are more random. Over the long term, when the business cycle has a chance to play through, more often it will be the manager with better skill who is right. Proponents of passive funds will argue that it is too difficult – maybe impossible – to tell who are the more skilled managers and who are less so. We disagree. As stock-picking
skill is something that relies on the right people and processes and a lasting philosophy, and in good managers all of these are persistent, we think that skill is normally evident in long-term returns.
On the other hand, since they have lower costs and don’t try to add value with research, passive managers should charge lower fees than their active counterparts. On an after-fees basis, the average passive investor will be guaranteed to do a little worse than the index, but not much. This may be a better result than trying to pick (and pay good money for) a mix of active managers who, on average, do not perform better than the index.
Whichever side you take, if there are too few active managers in a market, and thus not enough buying and selling of shares based on rigorous research, the market would get less and less efficiently priced and therefore worse at allocating investors’ savings to companies with the best prospects. Without enough active managers, the average outcome for all active and passive investors, and indeed the outcome for society, would be worse. One could say that investors in passive funds are free-riding on those paying for the research in active strategies.
If you pick an active manager it is important to have confidence in the manager you choose, especially as managers who are likely to outperform the index over the long term, are also likely to underperform for periods of time. Managers who outperform also often invest in ways that are contrary to the popular opinions of the time, and their portfolios may be going down while the market is going up. This can cause anxiety for some investors. If you choose an active manager you need to stick with your choice during periods of underperformance so you can enjoy the returns when they come.
77398-QC 1 Pages 297x210.indd 21 2015/04/20 2:51 PM

22QC 1 2015
..........................................................................................................................................................
..........................................................................................................................................................
..........................................................................................................................................................
..........................................................................................................................................................
..........................................................................................................................................................
..........................................................................................................................................................
..........................................................................................................................................................
..........................................................................................................................................................
..........................................................................................................................................................
..........................................................................................................................................................
..........................................................................................................................................................
..........................................................................................................................................................
..........................................................................................................................................................
..........................................................................................................................................................
..........................................................................................................................................................
..........................................................................................................................................................
..........................................................................................................................................................
..........................................................................................................................................................
..........................................................................................................................................................
..........................................................................................................................................................
..........................................................................................................................................................
..........................................................................................................................................................
..........................................................................................................................................................
..........................................................................................................................................................
..........................................................................................................................................................
..........................................................................................................................................................
..........................................................................................................................................................
..........................................................................................................................................................
..........................................................................................................................................................
..........................................................................................................................................................
..........................................................................................................................................................
..........................................................................................................................................................
..........................................................................................................................................................
..........................................................................................................................................................
NOTES
77398-QC 1 Pages 297x210.indd 22 2015/04/20 2:51 PM
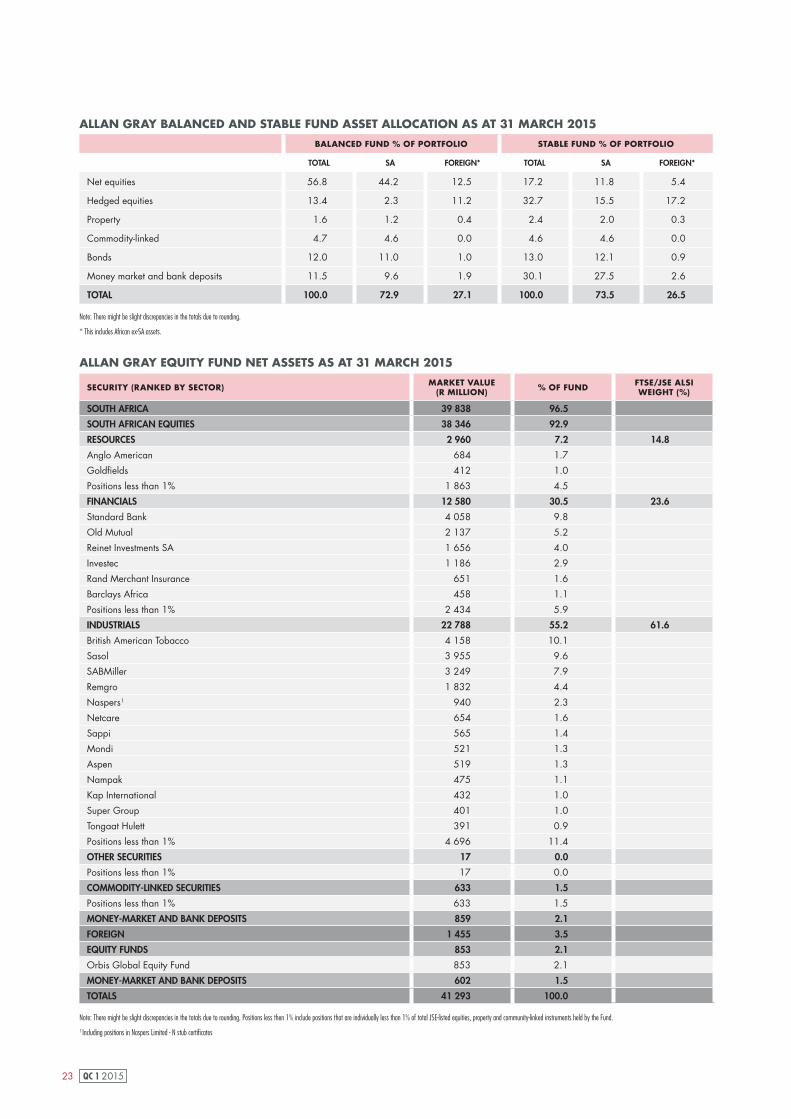
23 QC 1 2015
ALLAN GRAY EQUITY FUND NET ASSETS AS AT 31 MARCH 2015
SECURITY (RANKED BY SECTOR) MARKET VALUE(R MILLION) % OF FUND FTSE/JSE ALSI
WEIGHT (%)
SOUTH AFRICA 39 838 96.5
SOUTH AFRICAN EQUITIES 38 346 92.9
RESOURCES 2 960 7.2 14.8
Anglo American 684 1.7
Goldfields 412 1.0
Positions less than 1% 1 863 4.5
FINANCIALS 12 580 30.5 23.6
Standard Bank 4 058 9.8
Old Mutual 2 137 5.2
Reinet Investments SA 1 656 4.0
Investec 1 186 2.9
Rand Merchant Insurance 651 1.6
Barclays Africa 458 1.1
Positions less than 1% 2 434 5.9
INDUSTRIALS 22 788 55.2 61.6
British American Tobacco 4 158 10.1
Sasol 3 955 9.6
SABMiller 3 249 7.9
Remgro 1 832 4.4
Naspers1 940 2.3
Netcare 654 1.6
Sappi 565 1.4
Mondi 521 1.3
Aspen 519 1.3
Nampak 475 1.1
Kap International 432 1.0
Super Group 401 1.0
Tongaat Hulett 391 0.9
Positions less than 1% 4 696 11.4
OTHER SECURITIES 17 0.0
Positions less than 1% 17 0.0
COMMODITY-LINKED SECURITIES 633 1.5
Positions less than 1% 633 1.5
MONEY-MARKET AND BANK DEPOSITS 859 2.1
FOREIGN 1 455 3.5
EQUITY FUNDS 853 2.1
Orbis Global Equity Fund 853 2.1
MONEY-MARKET AND BANK DEPOSITS 602 1.5
TOTALS 41 293 100.0
BALANCED FUND % OF PORTFOLIO STABLE FUND % OF PORTFOLIO
TOTAL SA FOREIGN* TOTAL SA FOREIGN*
Net equities 56.8 44.2 12.5 17.2 11.8 5.4
Hedged equities 13.4 2.3 11.2 32.7 15.5 17.2
Property 1.6 1.2 0.4 2.4 2.0 0.3
Commodity-linked 4.7 4.6 0.0 4.6 4.6 0.0
Bonds 12.0 11.0 1.0 13.0 12.1 0.9
Money market and bank deposits 11.5 9.6 1.9 30.1 27.5 2.6
TOTAL 100.0 72.9 27.1 100.0 73.5 26.5
ALLAN GRAY BALANCED AND STABLE FUND ASSET ALLOCATION AS AT 31 MARCH 2015
Note: There might be slight discrepancies in the totals due to rounding.
* This includes African ex-SA assets.
Note: There might be slight discrepancies in the totals due to rounding. Positions less then 1% include positions that are individually less than 1% of total JSE-listed equities, property and community-linked instruments held by the Fund.
1 Including positions in Naspers Limited - N stub certificates
77398-QC 1 Pages 297x210.indd 23 2015/04/20 2:51 PM

24QC 1 2015
An investment of R10 000 made with Allan Gray on 15 June 1974 would have grown to R172 288 651 by 31 March 2015. By comparison, the returns generated by the FTSE/JSE All Share Index over the same period would have grown a similar investment to R7 869 019. Returns are before fees.
An investment of R10 000 made with Allan Gray on 1 January 1978 would have grown to R18 077 489 by 31 March 2015. The average total performance of global mandates of Large Managers over the same period would have grown a similar investment to R4 361 773. Returns are before fees.
INVESTMENT TRACK RECORD – SHARE RETURNS INVESTMENT TRACK RECORD – BALANCED RETURNS
25
20
15
10
5
0
RETURNS ANNUALISED TO 31.03.2015
ALLAN GRAY* AFLMW**
From 01.04.2014
(1 year)9.6
12.2
From 01.04.2012
(3 years)16.617.6
From 01.04.2010
(5 years)15.015.4
From 01.04.2005 (10 years)
17.215.9
Since 01.01.1978
22.317.7
25
30
20
15
10
5
0
RETURNS ANNUALISED TO 31.03.2015
ALLAN GRAY* FTSE/JSE ALL SHARE INDEX
From 01.04.2014
(1 year)13.312.5
From 01.04.2012
(3 years)20.319.4
From 01.04.2010
(5 years)18.316.1
From 01.04.2005 (10 years)
21.318.0
Since 01.01.1978
28.020.1
Since 15.06.1974
27.017.8
* Allan Gray commenced managing pension funds on 1 January 1978. The returns prior to 1 January 1978 are of individuals managed by Allan Gray, and these returns exclude income. Returns are before fees.** Consulting Actuaries Survey returns used up to December 1997. The return from 1 April 2010 is the average of the non-investable Alexander Forbes Large Manager Watch. The return for March 2015 is an estimate.Note: Listed property included from 1 July 2002. Inward listed included from November 2008 to November 2011.
ALLAN GRAY PROPRIETARY LIMITED GLOBAL MANDATE TOTAL RETURNS VS ALEXANDER FORBES GLOBAL MANAGER WATCH
PERIOD ALLAN GRAY* AFLMW** OUT/UNDER-PERFORMANCE
1974 – – –1975 – – –1976 – – –1977 – – –1978 34.5 28.0 6.51979 40.4 35.7 4.71980 36.2 15.4 20.81981 15.7 9.5 6.21982 25.3 26.2 - 0.91983 24.1 10.6 13.51984 9.9 6.3 3.61985 38.2 28.4 9.81986 40.3 39.9 0.41987 11.9 6.6 5.31988 22.7 19.4 3.31989 39.2 38.2 1.01990 11.6 8.0 3.61991 22.8 28.3 - 5.51992 1.2 7.6 - 6.41993 41.9 34.3 7.61994 27.5 18.8 8.71995 18.2 16.9 1.31996 13.5 10.3 3.21997 - 1.8 9.5 - 11.31998 6.9 - 1.0 7.91999 80.0 46.8 33.12000 21.7 7.6 14.12001 44.0 23.5 20.52002 13.4 - 3.6 17.12003 21.5 17.8 3.72004 21.8 28.1 - 6.32005 40.0 31.9 8.12006 35.6 31.7 3.92007 14.5 15.1 - 0.62008 - 1.1 - 12.3 11.22009 15.6 20.3 - 4.72010 11.7 14.5 - 2.82011 12.6 8.8 3.82012 15.1 20.0 - 4.92013 25.0 23.3 1.72014 10.3 10.3 0.02015 (to 31.03) 3.2 4.9 - 1.7
ALLAN GRAY PROPRIETARY LIMITED GLOBAL MANDATE SHARE RETURNS VS FTSE/JSE ALL SHARE INDEX
PERIOD ALLAN GRAY* FTSE/JSE ALL SHARE INDEX
OUT/UNDER-PERFORMANCE
1974 (from 15.06) - 0.8 - 0.8 0.01975 23.7 - 18.9 42.61976 2.7 - 10.9 13.61977 38.2 20.6 17.61978 36.9 37.2 - 0.31979 86.9 94.4 - 7.51980 53.7 40.9 12.81981 23.2 0.8 22.41982 34.0 38.4 - 4.41983 41.0 14.4 26.61984 10.9 9.4 1.51985 59.2 42.0 17.21986 59.5 55.9 3.61987 9.1 - 4.3 13.41988 36.2 14.8 21.41989 58.1 55.7 2.41990 4.5 - 5.1 9.61991 30.0 31.1 - 1.11992 - 13.0 - 2.0 - 11.01993 57.5 54.7 2.81994 40.8 22.7 18.11995 16.2 8.8 7.41996 18.1 9.4 8.71997 - 17.4 - 4.5 - 12.91998 1.5 - 10.0 11.51999 122.4 61.4 61.02000 13.2 0.0 13.22001 38.1 29.3 8.82002 25.6 - 8.1 33.72003 29.4 16.1 13.32004 31.8 25.4 6.42005 56.5 47.3 9.22006 49.7 41.2 8.52007 17.6 19.2 - 1.62008 - 13.7 - 23.2 9.52009 27.0 32.1 - 5.12010 20.3 19.0 1.32011 9.9 2.6 7.32012 20.6 26.7 - 6.12013 24.3 21.4 2.92014 16.2 10.9 5.32015 (to 31.03) 4.3 5.8 - 1.5
77398-QC 1 Pages 297x210.indd 24 2015/04/20 2:51 PM

25 QC 1 2015
ASS
ETS
UN
DER
M
AN
AG
EMEN
T
(R B
ILLI
ON
)
INCEP
TIO
N
DA
TESI
NCE
IN
CEP
TIO
N1
0 Y
EARS
5 Y
EARS
3 Y
EARS
1 Y
EAR
HIGH
NET
EQU
ITY
EXPO
SURE
(10
0%)
Alla
n G
ray
Equi
ty F
und
(AG
EF)
Aver
age
of S
outh
Afri
can
- Equ
ity -
Gen
eral
cat
egor
y (e
xcl.
Alla
n G
ray
Fund
s)1
41.3
01.1
0.19
9825
.918
.618
.418
.016
.016
.217
.519
.610
.512
.9
Alla
n G
ray-
Orb
is G
loba
l Equ
ity F
eede
r Fu
nd (
AG
OE)
FTSE
Wor
ld In
dex
14.3
01.0
4.20
0515
.714
.515
.714
.520
.121
.529
.530
.311
.321
.8
MED
IUM
NET
EQU
ITY
EXPO
SURE
(40
% -
75%
)
Alla
n G
ray
Bala
nced
Fun
d (A
GBF
) A
vera
ge o
f So
uth
Afr
ican
- M
ulti
Ass
et -
H
igh
Equi
ty c
ateg
ory
(exc
l. A
GBF
)2
106.
401
.10.
1999
18.9
14.1
15.4
13.7
13.8
13.2
15.3
15.4
8.3
11.5
Alla
n G
ray-
Orb
is G
loba
l Fun
d of
Fun
ds (
AG
GF)
6
0%
of
the
FTSE
Wor
ld In
dex
and
40
% o
f
the
JP M
orga
n G
loba
l Gov
ernm
ent B
ond
Inde
x
11.1
03.0
2.20
0411
.111
.613
.013
.315
.018
.222
.524
.28.
417
.4
LOW
NET
EQU
ITY
EXPO
SURE
(0%
- 4
0%)
Alla
n G
ray
Stab
le F
und
(AG
SF)
Dai
ly i
nter
est r
ate
of F
irst
Rand
Ban
k Li
mite
d pl
us 2
%36
.201
.07.
2000
12.9
9.3
11.1
8.3
9.2
6.7
9.5
6.5
6.1
6.9
VERY
LOW
NET
EQU
ITY
EXPO
SURE
(0%
- 2
0%)
Alla
n G
ray
Opt
imal
Fun
d (A
GO
F)D
aily
int
eres
t rat
e of
Fir
stRa
nd B
ank
Lim
ited
1.1
01.1
0.20
028.
46.
67.
86.
26.
74.
68.
24.
414
.74.
8
Alla
n G
ray-
Orb
is G
loba
l Opt
imal
Fun
d of
Fun
ds (
AG
OO
)A
vera
ge o
f U
S$ B
ank
depo
sits
and
Eur
o Ba
nk d
epos
its1.
102
.03.
2010
9.4
7.5
- -10
.18.
615
.112
.71.
61.
8
NO E
QUIT
Y EX
POSU
RE
Alla
n G
ray
Bond
Fun
d (A
GBD
)JS
E A
ll Bo
nd In
dex
(tota
l ret
urn)
0.7
01.1
0.20
049.
39.
29.
18.
99.
39.
78.
59.
010
.612
.4
Alla
n G
ray
Mon
ey M
arke
t Fu
nd (
AG
MF)
Ale
xand
er F
orbe
s Sh
ort-t
erm
Fix
ed In
tere
st
(STe
FI)
Com
posi
te In
dex3
8.7
03.0
7.20
018.
1 8.
17.
57.
35.
95.
75.
75.
66.
36.
1
ALL
AN
GRAY
SO
UTH
AFR
ICA
N U
NIT
TRU
STS
AN
NU
ALI
SED
PER
FORM
AN
CE
(RA
ND
)
IN P
ERCEN
TAG
E PER
AN
NU
M T
O 3
1 M
ARCH
20
15
(N
ET O
F FE
ES)
1 Sin
ce in
cepti
on to
28
Febru
ary 2
015
the be
nchm
ark w
as th
e FTS
E/JS
E All S
hare
Index
inclu
ding i
ncom
e.2
Since
ince
ption
to 3
1 Ja
nuary
201
3 the
benc
hmark
was
the m
arket
value
-weig
hted a
verag
e retu
rn of
the fu
nds i
n both
the D
omes
tic As
set A
lloca
tion M
edium
Equit
y and
Dom
estic
Asse
t Allo
catio
n Vari
able
Equit
y sec
tors o
f the
prev
ious A
SISA F
und C
lassif
icatio
n Stan
dard,
exclu
ding t
he Al
lan G
ray B
alanc
ed Fu
nd.
3 Sin
ce in
cepti
on to
31
March
200
3, th
e ben
chma
rk wa
s the
Alex
ande
r Forb
es 3
-Mon
th De
posit
Inde
x. Fro
m 1
April
2003
to 3
1 Oc
tober
2011
the b
ench
mark
was t
he D
omes
tic Fi
xed I
nteres
t Mon
ey M
arket
Colle
ctive
Inve
stmen
t Sch
eme s
ector
exclu
ding t
he Al
lan G
ray M
oney
Mark
et Fu
nd.
77398-QC 1 Pages 297x210.indd 25 2015/04/20 2:51 PM

26QC 1 2015
FEE
FOR
BEN
CH
MA
RK
PER
FOR
MA
NCE
PER
FOR
MA
NCE
FEES
O
THER
CO
STS
INCLU
DIN
G
TRA
DIN
G C
OST
SV
AT
TOTA
L EXP
ENSE
RAT
IO (T
ER)
Alla
n G
ray
Equi
ty F
und
1.46
%0.
60%
0.05
%0.
29%
2.40
%
Alla
n G
ray-
Orb
is G
loba
l Equ
ity F
eede
r Fu
nd1.
50%
0.72
%0.
23%
0.00
%2.
45%
Alla
n G
ray
Bala
nced
Fun
d1.
07%
0.37
%0.
10%
0.15
%1.
69%
Alla
n G
ray-
Orb
is G
loba
l Fun
d of
Fun
ds1.
28%
0.31
%0.
26%
0.00
%1.
85%
Alla
n G
ray
Stab
le F
und
1.03
%0.
40%
0.09
%0.
16%
1.68
%
Alla
n G
ray
Opt
imal
Fun
d1.
00%
1.31
%0.
12%
0.32
%2.
75%
Alla
n G
ray-
Orb
is G
loba
l Opt
imal
Fun
d of
Fun
ds1.
00%
0.01
%0.
23%
0.00
%1.
24%
Alla
n G
ray
Bond
Fun
d0.
25%
0.19
%0.
02%
0.06
%0.
52%
Alla
n G
ray
Mon
ey M
arke
t Fun
d0.
25%
N/A
0.01
%0.
04%
0.30
%
ALL
AN
GRAY
TO
TAL
EXPEN
SE R
ATI
OS
(TER
S) F
OR T
HE
YEA
R E
ND
ING
31
MA
RCH
20
15
A To
tal Ex
pens
e Rati
o (T
ER) o
f a po
rtfoli
o is
a mea
sure
of th
e por
tfolio
’s as
sets
that
were
relinq
uishe
d as a
paym
ent o
f ser
vices
rend
ered i
n th
e man
agem
ent o
f the
portf
olio.
The t
otal
opera
ting
expe
nses
are e
xpres
sed a
s a pe
rcent
age o
f the
avera
ge va
lue o
f the
portf
olio,
calcu
lated
for
the y
ear t
o 31
Marc
h 20
15. I
nclud
ed in
the T
ER is
the p
ropor
tion
of co
sts in
curre
d by t
he pe
rform
ance
comp
onen
t, fee
at be
nchm
ark an
d oth
er ex
pens
es. T
hese
are d
isclos
ed se
parat
ely as
perce
ntag
es o
f the
net
asse
t valu
e. Tra
ding
costs
(inc
luding
brok
erage
, VAT
, STT
, STR
ATE,
levy a
nd
inside
r trad
ing le
vy) a
re inc
luded
in th
e TER
. A h
igh TE
R wi
ll not
nec
essa
rily im
ply a
poor
retur
n no
r doe
s a lo
w TE
R im
ply a
good
retur
n. Th
e cur
rent T
ER ca
nnot
be re
garde
d as a
n ind
icatio
n of
futur
e TER
s.
77398-QC 1 Pages 297x210.indd 26 2015/04/20 2:51 PM

27 QC 1 2015
FOREI
GN
DO
MIC
ILED
FU
ND
S A
NN
UA
LISE
D P
ERFO
RM
AN
CE
(RA
ND
)
IN P
ERCEN
TAG
E PER
AN
NU
M T
O 3
1 M
ARCH
2015 (N
ET O
F FE
ES)
ASS
ETS
UN
DER
M
AN
AG
EMEN
T
(R B
ILLI
ON
)
INCEP
TIO
N
DA
TESI
NCE
IN
CEP
TIO
N1
0 Y
EARS
5 Y
EARS
3 Y
EARS
1 Y
EAR
HIGH
NET
EQU
ITY
EXPO
SURE
Orb
is G
loba
l Equ
ity F
und
FTSE
Wor
ld In
dex
100.
501
.01.
1990
19.2
13.8
15.7
14.5
20.1
21.4
29.7
30.1
11.2
21.8
Orb
is S
ICAV
Jap
an E
quity
(Ye
n) F
und
Toky
o St
ock
Pric
e In
dex
20.9
01.0
1.19
9815
.39.
212
.310
.618
.917
.626
.627
.718
.829
.3
Orb
is S
ICAV
Asi
a ex
-Jap
an E
quity
Fun
dM
SCI A
sia
ex-Ja
pan
Inde
x31
.501
.01.
2006
17.5
16.2
- -17
.617
.525
.124
.413
.927
.5
Alla
n G
ray
Afr
ica
ex-S
A E
quity
Fun
dSt
anda
rd B
ank
Afr
ica
Tota
l Ret
urn
Inde
x2.
801
.01.
2012
25.0
11.2
- -- -
23.0
9.2
– 5.
4–
10.7
Alla
n G
ray
Aus
tral
ia E
quity
Fun
dS&
P/A
SX 3
00
Acc
umul
atio
n In
dex
7.6
04.0
5.20
0615
.614
.4- -
16.7
15.7
19.6
21.4
1.6
8.0
MED
IUM
NET
EQU
ITY
EXPO
SURE
Orb
is S
ICAV
Glo
bal B
alan
ced
Fund
60
% M
SCI W
orld
Inde
x w
ith n
et d
ivid
ends
rei
nves
ted
an
d 4
0%
JP
Mor
gan
Glo
bal G
over
nmen
t Bon
d In
dex
16.9
01.0
1.20
1328
.326
.0- -
- -- -
12.9
17.6
LOW
NET
EQU
ITY
EXPO
SURE
Alla
n G
ray
Aus
tral
ia O
ppor
tuni
ty F
und
Rese
rve
Bank
of
Aus
tral
ia c
ash
rate
0.7
01.0
7.20
1114
.410
.2- -
- -12
.48.
4–
0.2
– 2
.8
VERY
LOW
NET
EQU
ITY
EXPO
SURE
Orb
is O
ptim
al S
A F
und-
US$
Cla
ssU
S$ B
ank
Dep
osits
19.3
01.0
1.20
0511
.29.
710
.28.
811
.410
.717
.716
.78.
215
.4
Orb
is O
ptim
al S
A F
und-
Euro
Cla
ssEu
ro B
ank
Dep
osits
8.3
01.0
1.20
058.
77.
08.
06.
67.
16.
010
.58.
5–
12.4
– 10
.1
77398-QC 1 Pages 297x210.indd 27 2015/04/20 2:51 PM
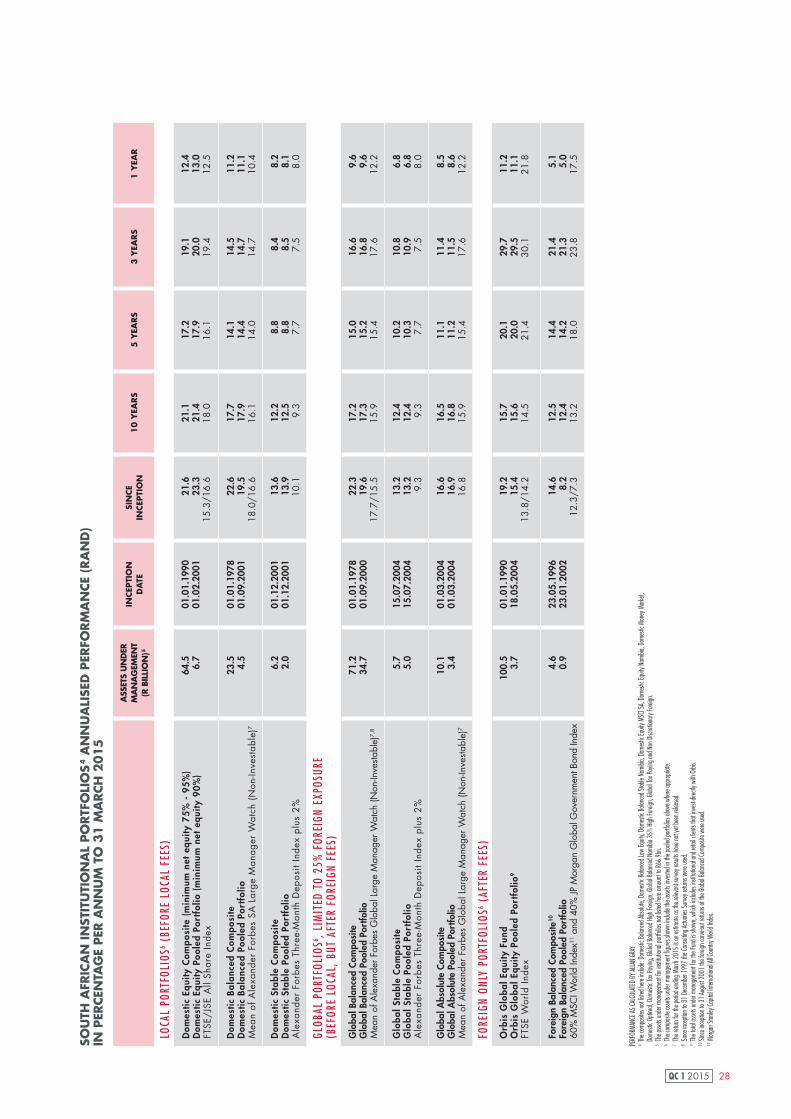
28QC 1 2015
ASS
ETS
UN
DER
M
AN
AG
EMEN
T
(R B
ILLI
ON
)5
INCEP
TIO
N
DA
TESI
NCE
IN
CEP
TIO
N1
0 Y
EARS
5 Y
EARS
3 Y
EARS
1 Y
EAR
LOCA
L PO
RTFO
LIOS
6 (BE
FORE
LOC
AL F
EES)
Dom
estic
Equ
ity C
ompo
site
(m
inim
um n
et e
quity
75%
- 9
5%)
Dom
estic
Equ
ity P
oole
d Po
rtfo
lio (
min
imum
net
equ
ity 9
0%)
FTSE
/JSE
All
Shar
e In
dex
64.5 6.7
01.0
1.19
9001
.02.
2001
21.6
23.3
15.3
/16.
6
21.1
21.4
18.0
17.2
17.9
16.1
19.1
20.0
19.4
12.4
13.0
12.5
Dom
estic
Bal
ance
d C
ompo
site
Dom
estic
Bal
ance
d Po
oled
Por
tfol
ioM
ean
of A
lexa
nder
For
bes
SA L
arge
Man
ager
Wat
ch (
Non
-Inve
stab
le)7
23.5 4.5
01.0
1.19
7801
.09.
2001
22.6
19.5
18.0
/16.
6
17.7
17.9
16.1
14.1
14.4
14.0
14.5
14.7
14.7
11.2
11.1
10.4
Dom
estic
Sta
ble
Com
posi
teD
omes
tic S
tabl
e Po
oled
Por
tfol
ioA
lexa
nder
For
bes
Thre
e-M
onth
Dep
osit
Inde
x pl
us 2
%
6.2
2.0
01.1
2.20
0101
.12.
2001
13.6
13.9
10.1
12.2
12.5
9.3
8.8
8.8
7.7
8.4
8.5
7.5
8.2
8.1
8.0
GLOB
AL P
ORTF
OLIO
S6 , LI
MIT
ED T
O 25
% F
OREI
GN E
XPOS
URE
(B
EFOR
E LO
CAL,
BUT
AFT
ER F
OREI
GN F
EES)
Glo
bal B
alan
ced
Com
posi
teG
loba
l Bal
ance
d Po
oled
Por
tfolio
Mea
n of
Ale
xand
er F
orbe
s G
loba
l Lar
ge M
anag
er W
atch
(Non
-Inve
stabl
e)7,
8
71.2
34.7
01.0
1.19
7801
.09.
2000
22.3
19.6
17.7
/15.
5
17.2
17.3
15.9
15.0
15.2
15.4
16.6
16.8
17.6
9.6
9.6
12.2
Glo
bal S
tabl
e C
ompo
site
Glo
bal S
tabl
e Po
oled
Por
tfol
ioA
lexa
nder
For
bes
Thre
e-M
onth
Dep
osit
Inde
x pl
us 2
%
5.7
5.0
15.0
7.20
0415
.07.
2004
13.2
13.2
9.3
12.4
12.4
9.3
10.2
10.3
7.7
10.8
10.9
7.5
6.8
6.8
8.0
Glo
bal A
bsol
ute
Com
posi
teG
loba
l Abs
olut
e Po
oled
Por
tfolio
Mea
n of
Ale
xand
er F
orbe
s G
loba
l Lar
ge M
anag
er W
atch
(Non
-Inve
stab
le)7
10.1 3.4
01.0
3.20
0401
.03.
2004
16.6
16.9
16.8
16.5
16.8
15.9
11.1
11.2
15.4
11.4
11.5
17.6
8.5
8.6
12.2
FORE
IGN
ONLY
POR
TFOL
IOS6 (
AFTE
R FE
ES)
Orb
is G
loba
l Equ
ity F
und
Orb
is G
loba
l Equ
ity P
oole
d Po
rtfo
lio9
FTSE
Wor
ld In
dex
100.
53.
701
.01.
1990
18.0
5.20
0419
.215
.413
.8/1
4.2
15.7
15.6
14.5
20.1
20.0
21.4
29.7
29.5
30.1
11.2
11.1
21.8
Fore
ign
Bala
nced
Com
posi
te10
Fore
ign
Bala
nced
Poo
led
Port
folio
60%
MSC
I Wor
ld In
dex11
and
40%
JP M
orga
n G
loba
l Gov
ernm
ent B
ond
Inde
x
4.6
0.9
23.0
5.19
9623
.01.
2002
14.6 8.2
12.3
/7.3
12.5
12.4
13.2
14.4
14.2
18.0
21.4
21.3
23.8
5.1
5.0
17.5
SOU
TH A
FRIC
AN
IN
STIT
UTI
ON
AL
PO
RTF
OLI
OS
4 A
NN
UA
LISE
D P
ERFO
RM
AN
CE
(RA
ND
)
IN P
ERCEN
TAG
E PER
AN
NU
M T
O 3
1 M
ARCH
2015
PERF
ORMA
NCE A
S CA
LCUL
ATED
BY
ALLA
N GR
AY4 Th
e com
posit
es no
t liste
d here
inclu
de: D
omes
tic B
alanc
ed Ab
solut
e, Do
mesti
c Bala
nced
Low
Equit
y, Do
mesti
c Bala
nced
Stab
le Na
mibia
, Dom
estic
Equit
y MSC
I SA,
Dome
stic E
quity
Nam
ibia,
Dome
stic M
oney
Mark
et,
Dome
stic O
ptima
l, Dom
estic
Tax P
aying
, Glob
al Ba
lance
d High
Forei
gn, G
lobal
Balan
ced N
amibi
a 35%
High
Forei
gn, G
lobal
Tax P
aying
and N
on D
iscret
ionary
Forei
gn.
5 The
asse
ts un
der m
anag
emen
t for
institu
tiona
l port
folios
not li
sted h
ere am
ount
to R6
6.9b
n.6 T
he co
mpos
ite as
sets
unde
r man
agem
ent fi
gures
show
n inc
lude t
he as
sets
inves
ted in
the p
ooled
portf
olios
abov
e whe
re ap
propri
ate.
7 The
retur
n for
the pe
riod e
nding
Marc
h 201
5 is
an es
timate
as th
e rele
vant
surve
y res
ults h
ave n
ot ye
t bee
n rele
ased
.8 S
ince i
ncep
tion t
o 31
Dece
mber
1997
the C
onsu
lting A
ctuari
es S
urvey
retur
ns w
ere us
ed.
9 The
total
asse
ts un
der m
anag
emen
t for
the Fu
nd is
show
n, wh
ich in
clude
s ins
titutio
nal a
nd re
tail c
lients
that
inves
t dire
ctly w
ith O
rbis.
10 S
ince i
ncep
tion t
o 31
Augu
st 20
01 th
e fore
ign ca
rve-ou
t retu
rns of
the G
lobal
Balan
ced C
ompo
site w
ere us
ed.
11 M
organ
Stan
ley Ca
pital
Intern
ation
al All
Coun
try W
orld I
ndex
.
77398-QC 1 Pages 297x210.indd 28 2015/04/20 2:51 PM
29 QC 1 2015
UNIT TRUSTS
A unit trust is a savings vehicle for investors who want to grow their money and may want to access it before they retire. Unit trusts allow investors to pool their money with other investors who have similar investment objectives. Unit trusts are also known as ‘portfolios of collective investment schemes’ or ‘funds’. Allan Gray has nine funds in its South African stable: Equity, Balanced, Stable, Optimal, Money Market, Bond, Global Equity Feeder, Global Fund of Funds and Global Optimal Fund of Funds.
RET IREMENT ANNUI TY*
The Allan Gray Retirement Annuity Fund (RA) is a savings vehicle for investors looking for a flexible, tax-efficient way to save for retirement. Investors can only access their money when they retire. Individually owned RAs can be managed on a group basis, offering employers a flexible solution to the challenge of retirement funding for their staff.
PRESERVAT ION FUNDS*
The Allan Gray Pension Preservation and Provident Preservation funds are savings vehicles for investors looking for a tax-efficient way to preserve existing retirement benefits when they leave a pension or provident fund, either as a result of a change in employment (e.g. retrenchment or resignation), or when they transfer from another preservation fund.
ENDOWMENT*The Allan Gray Endowment Policy is a savings policy for investors who want a tax-efficient way to save and wish to create liquidity in their estate.
L I V ING ANNUI TY*
The Allan Gray Living Annuity gives investors flexibility, within certain regulatory limits, to select an annuity best suited to their income needs after retirement. A living annuity provides investors with a regular income which is not guaranteed, and which is funded by growth on capital and income from interest and dividends.
OFFSHORE FUNDS
Allan Gray International manages Bermuda-listed portfolios in equities and bonds covering the continent of Africa. Through our partnership with Orbis we also offer you a cost-effective way to diversify your portfolio by investing internationally. There are two options for investing offshore through Allan Gray: invest in rand-denominated offshore funds without the need to use your offshore investment allowance, or use your offshore investment allowance to invest in foreign funds.
PLATFORM – LOCAL AND OFFSHORE
Our investment platform provides you with access to all of our products, as well as a focused range of unit trusts from other fund providers. The platform enables you to buy, sell and switch – usually at no charge – between the funds as your needs and objectives change. South African investors who wish to diversify their portfolios can also access funds from certain other offshore fund providers via the same platform.
L I F E POOLED PORTFOL IOS
The minimum investment per client is R20 million. Mandates include risk-profiled pooled portfolios: Stable Portfolio, Balanced Portfolio and Absolute Portfolio; asset class pooled portfolios: Money Market, Equity and Foreign, and finally an Optimal Portfolio.
SEGREGATED PORTFOL IOS
The minimum portfolio size is R500 million. Mandates are of a balanced or asset class specific nature.
BOTSWANAAllan Gray Botswana manages institutional portfolios on a segregated basis and offers our range of nine South African unit trusts to individual investors.
NAMIB IAAllan Gray Namibia offers institutional portfolios on a segregated and pooled basis and the Allan Gray Namibia Balanced Fund is available for institutions, retirement funds and individuals.
SWAZ I LAND Allan Gray Swaziland manages institutional portfolios on a segregated basis.
ALLAN GRAY ORB IS FOUNDAT ION
Allan Gray Orbis Foundation is a non-profit organisation that was established in 2005 as an education and development catalyst. It seeks to foster a next generation of high-impact leaders and entrepreneurs for the ultimate purpose of increased job creation in Southern Africa. The Foundation focuses on educational and experiential methods at the secondary and tertiary levels to realise the potential of bright young minds. Through its highly-researched learning programmes, it intends to equip talented young individuals with the skills, attitudes and motivation to have a significant future impact.
E 2
E2 stands for ‘excellence in entrepreneurship’ and as a long-term capital fund its purpose is to provide substantial financing to entrepreneurs who are graduates of the Allan Gray Orbis Foundation’s Fellowship Programme. In addition, E2 provides financing for social entrepreneurs who demonstrate exceptional leadership and creative initiative in the not-for-profit sectors.
*This product has unit trusts as its underlying investment option.
THE ALLAN GRAY GROUP
77398-QC 1 Pages 297x210.indd 29 2015/04/20 2:51 PM

30QC 1 2015
..........................................................................................................................................................
..........................................................................................................................................................
..........................................................................................................................................................
..........................................................................................................................................................
..........................................................................................................................................................
..........................................................................................................................................................
..........................................................................................................................................................
..........................................................................................................................................................
..........................................................................................................................................................
..........................................................................................................................................................
..........................................................................................................................................................
..........................................................................................................................................................
..........................................................................................................................................................
..........................................................................................................................................................
..........................................................................................................................................................
..........................................................................................................................................................
..........................................................................................................................................................
..........................................................................................................................................................
..........................................................................................................................................................
..........................................................................................................................................................
..........................................................................................................................................................
..........................................................................................................................................................
..........................................................................................................................................................
..........................................................................................................................................................
..........................................................................................................................................................
..........................................................................................................................................................
..........................................................................................................................................................
..........................................................................................................................................................
..........................................................................................................................................................
..........................................................................................................................................................
..........................................................................................................................................................
..........................................................................................................................................................
..........................................................................................................................................................
..........................................................................................................................................................
NOTES
77398-QC 1 Pages 297x210.indd 30 2015/04/20 2:51 PM

31 QC 1 2015
..........................................................................................................................................................
..........................................................................................................................................................
..........................................................................................................................................................
..........................................................................................................................................................
..........................................................................................................................................................
..........................................................................................................................................................
..........................................................................................................................................................
..........................................................................................................................................................
..........................................................................................................................................................
..........................................................................................................................................................
..........................................................................................................................................................
..........................................................................................................................................................
..........................................................................................................................................................
..........................................................................................................................................................
..........................................................................................................................................................
..........................................................................................................................................................
..........................................................................................................................................................
..........................................................................................................................................................
..........................................................................................................................................................
..........................................................................................................................................................
..........................................................................................................................................................
..........................................................................................................................................................
..........................................................................................................................................................
..........................................................................................................................................................
..........................................................................................................................................................
..........................................................................................................................................................
..........................................................................................................................................................
..........................................................................................................................................................
..........................................................................................................................................................
..........................................................................................................................................................
..........................................................................................................................................................
..........................................................................................................................................................
..........................................................................................................................................................
..........................................................................................................................................................
NOTES
77398-QC 1 Pages 297x210.indd 31 2015/04/20 2:51 PM

© A l l an G ray P rop r i e t a ry L im i t ed , 2015 .
D i r e c t o r s ExecutiveM Cooper BBusSc FIA FASSA R W Dower BSc (Eng) MBA I S Liddle BBusSc (Hons) CFAT Mhlambiso AB MBA JD
Non-ExecutiveW B Gray BCom MBA CFA (Ir ish)T J Mahuma BA (Hons) MPhil K C Morolo BSc (Eng) MEng
Company Se c r e t a ry C E Solomon BBusSc (Hons) CA (SA)
Reg i s t r a t i on Numbe r 2005/002576/07
Bus i ne s s Add re s s 1 Silo Square V&A Waterfront Cape Town 8001 P O Box 51318 V&A Waterfront Cape Town 8002 South Afr ica
C l i en t S e r v i c e Cen t r e Tel: 0860 000 654 / +27 (0)21 415 2301Fax: 0860 000 655 / +27 (0)21 415 2492Email: [email protected]: www.allangray.co.zaOffice hours: Monday to Friday 7:30 - 17:30
Collective Investment Schemes (unit trusts) are generally medium- to long-term investments. The value of participatory interest (units) may go down as well as up. Past performance is not necessarily a guide to the future. Unit trusts are traded at ruling prices and can engage in borrowing and scrip lending. A schedule of fees, charges and maximum commissions is available on request from the company/scheme. Commissions and incentives may be paid and if so, would be included in the overall costs. Unit trust prices are calculated on a net asset value basis, which, for money market funds, is the total book value of all assets in the portfolio divided by the number of units in issue. The Allan Gray Money Market Fund aims to maintain a constant price of 100 cents per unit. The total return to the investor is primarily made up of interest received, but may also include any gain or loss made on any particular instrument held. In most cases this will have the effect of increasing or decreasing the daily yield, but in some cases, for example in the event of a default on the part of an issuer of any instrument held by the Fund, it can have the effect of a capital loss. Such losses will be borne by the Allan Gray Money Market Fund and its investors and in order to maintain a constant price of 100 cents per unit, investors’ unit holdings will be reduced to the extent of such losses. Fluctuations or movements in exchange rates may also be the cause of the value of underlying international investments going up or down. Different classes of units apply to the Allan Gray Equity, Balanced, Stable and Optimal Funds only and are subject to different fees and charges. Forward pricing is used. A fund of funds unit trust may only invest in other unit trusts, which levy their own charges that could result in a higher fee structure for these portfolios. A feeder fund is a unit trust fund that, apart from assets in liquid form, consists solely of units in a single portfolio of a collective investment scheme. All of the unit trusts except the Allan Gray Money Market Fund may be capped at any time in order for them to be managed in accordance with their mandates. Allan Gray Unit Trust Management (RF) Proprietary Limited is a member of the Association for Savings & Investment SA (ASISA). Allan Gray Proprietary Limited, an authorised financial services provider, is the appointed investment manager of Allan Gray Unit Trust Management (RF) Proprietary Limited.
The FTSE/JSE Africa Index Series is calculated by FTSE International Limited (FTSE) in conjunction with the JSE Limited (JSE) in accordance with standard criteria. The FTSE/JSE Africa Index Series is the proprietary information of FTSE and the JSE. All copyright subsisting in the FTSE/JSE Africa Index Series index values and constituent lists vests in FTSE and the JSE jointly. All their rights are reserved.
Allan Gray Life Limited is an authorised financial services provider and Allan Gray Investment Services Proprietary Limited is an authorised administrative financial services provider.To read our Email Legal Notice, browse to this URL: http://www.allangray.co.za/legal/email_legal.aspx
77398-QC 1 Cover.indd 4 2015/04/22 3:09 PM