Embed Size (px)
Citation preview
Quarterly
Economic
Indicesof the Philippines
First Quarter 2014 to Fourth Quarter 2017
(1978=100)
ISSN-2094-1803
As of April 2018
REPUBLIC OF THE PHILIPPINES
PHILIPPINE STATISTICS AUTHORITY
The Quarterly Economic Indices of the Philippines (QEI)
is a publication compiled and consolidated by the Macroeconomic Accounts Service (MAS)
of the PHILIPPINE STATISTICS AUTHORITY (PSA)
For technical inquiries, please contact us at: (632) 376 1994 or e-mail us at [email protected].
TERMS OF USE OF PSA PUBLICATIONS
The PSA reserves its exclusive right to reproduce all its publications in whatever form. • Any part
of this publication should not be reproduced, recopied, lent or repackaged for other parties for
any commercial purposes without written permission from the PSA• Any part of this publication
may only be reproduced for internal use of the recipient/customer company. • Should any portion
of the data in this publication be included in a report/article, the title of the publication and the
PSA as publisher should be cited as the source of the data. • Any information derived from the
processing of data contained in this publication will not be the responsibility of PSA.
Published by the
Philippine Statistics Authority
Centris Cyberpod 3 Building
EDSA corner Quezon Avenue, Quezon City
Philippines
April 2018
The Quarterly Economic Indices of the Philippines is available in printed and
electronic formats (Excel/Word/PDF in CDRom).
Back issues of this publication are available for purchase.
For details, please contact us at (632) 376 1994 or at [email protected]

This publication on the Quarterly Economic Indices of the Philippines was compiled and consolidated by the Macroeconomic Accounts Service of the Philippine Statistics Authority (PSA).
For technical inquiries, please write / call: Florande S. Polistico Dean Joseph A. Villanueva Email addresses:
[email protected] [email protected]
Tel. No: (632) 376 - 1994 (telefax)
PSA Homepage: http://www.psa.gov.ph E-mail address: [email protected]

i
F O R E W O R D
The Quarterly Economic Indices (QEI) of the Philippines is a publication
intended to provide measures of growth in production, gross revenue, employment, and compensation in the various sectors of the economy. Specifically, these indicators were developed to guide users for more meaningful analysis of the current economic situation. The indices on compensation per employee, for instance, are used as deflators to express a current value in real terms or as bases for wage level/rate determination, forecasting and projection.
The sectoral indices are computed based on data from the Quarterly Survey of Philippine Business and Industry as well as from reports of various administrative and regulatory agencies with 1978 as base year. While quarterly data are available on a sectoral basis, not all data items are generated. Hence, indices on production are estimated only for agriculture; mining and quarrying; and electricity and water, while the indices on gross revenue, employment and compensation are computed for all sectors of industry and services, except for construction. For the latter, only the indices on compensation per employee are obtained.
The sectoral QEIs are prepared and consolidated by the Philippine Statistics Authority. Other data inputs are provided by different source agencies namely: Sugar Regulatory Administration (SRA), Forest Management Bureau (FMB), Manila Electric Company (MERALCO), Metropolitan Waterworks and Sewerage System-Regulatory Office (MWSS-RO), Mines and Geosciences Bureau (MGB), Department of Energy (DOE), and National Grid Corporation of the Philippines (NGCP).
As a matter of policy, revisions on the estimates for the immediately preceding quarter are undertaken quarterly while revisions for earlier quarters, if any, are made only during the first quarter round of estimates.
We wish to acknowledge with appreciation the full support, cooperation and valuable assistance provided by the data producing agencies in the compilation of the QEI.
LISA GRACE S. BERSALES, Ph.D. Undersecretary
National Statistician and Civil Registrar General 19 April 2018

ii
TABLE OF CONTENTS
Foreword i
Table of Contents ii
Acronyms v
I. Summary of Quarterly Economic Indices 1
Table 1.1 Indices on Gross Revenue 2
Table 1.2 Indices on Employment 3 Table 1.3 Indices on Compensation 4 Table 1.3.1 Indices on Compensation Per Employee
at Current Prices 5 Table 1.3.2 Indices on Compensation Per Employee
at Constant Prices 6
II. Quarterly Economic Indices 7
Agriculture, Fishery and Forestry 8
Table 2.1 Indices on Volume of Production 9
Mining and Quarrying 10
Table 3.1 Indices on Volume of Production 11 Table 3.1.1 Indices on Volume of Production Per Worker 12 Table 3.2 Indices on Employment 13
Table 3.3 Indices on Compensation 14 Table 3.3.1 Indices on Compensation Per Employee
at Current Prices 15 Table 3.3.2 Indices on Compensation Per Employee
at Constant Prices 16
Manufacturing 17
Table 4.1 Indices on Gross Revenue 18 Table 4.2 Indices on Employment 21 Table 4.3 Indices on Compensation 24
iii
Table 4.3.1 Indices on Compensation Per Employee at Current Prices 27
Table 4.3.2 Indices on Compensation Per Employee at Constant Prices 30
Construction 33
Table 5.1 Indices on Compensation Per Employee 34 At Current Prices
Electricity and Water 35
Table 6.1 Indices on Volume of Production 36 Table 6.1.1 Indices on Volume of Production Per Worker 36
Table 6.2 Indices on Employment 37 Table 6.3 Indices on Compensation 37
Table 6.3.1 Indices on Compensation Per Employee at Current Prices 38
Table 6.3.2 Indices on Compensation Per Employee at Constant Prices 38
Trade, Transportation and Communication 39 Table 7.1 Indices on Gross Revenue 40
Table 7.2 Indices on Employment 41 Table 7.3 Indices on Compensation 42
Table 7.3.1 Indices on Compensation Per Employee at Current Prices 43
Table 7.3.2 Indices on Compensation Per Employee at Constant Prices 44
Finance and Real Estate 45
Table 8.1 Indices on Gross Revenue 46 Table 8.2 Indices on Employment 47 Table 8.3 Indices on Compensation 48
Table 8.3.1 Indices on Compensation Per Employee at Current Prices 49
. Table 8.3.2 Indices on Compensation Per Employee at Constant Prices 50
Private Services 51
Table 9.1 Indices on Gross Revenue 52
iv
Table 9.2 Indices on Employment 53 Table 9.3 Indices on Compensation 54
Table 9.3.1 Indices on Compensation Per Employee at Current Prices 55
Table 9.3.2 Indices on Compensation Per Employee at Constant Prices 56
Technical Notes 57
Definition of Terms 69
The PSA Technical Staff 70
v
A C R O N Y M S U S E D
CPI - Consumer Price Index
DOE - Department of Energy
FMB - Forest Management Bureau
MERALCO - Manila Electric Company
MGB - Mines and Geosciences Bureau
MISSI - Monthly Integrated Survey of Selected Industries
MWSS-RO - Metropolitan Waterworks and Sewerage System – Regulatory Office MWCI - Manila Water Company, Inc. MWSI - Maynilad Water Services, Inc. NA - National Accounts
NGCP - National Grid Corporation of the Philippines
PSA - Philippine Statistics Authority
PSIC - Philippine Standard Industrial Classification
QEI - Quarterly Economic Indices
QSPBI - Quarterly Survey of Philippine Business and Industry
SRA - Sugar Regulatory Administration
QUARTERLY ECONOMIC INDICES OF THE PHILIPPINES
First Quarter 2014 – Fourth Quarter 2017

SUMMARY OF QUARTERLY
ECONOMIC INDICES
1
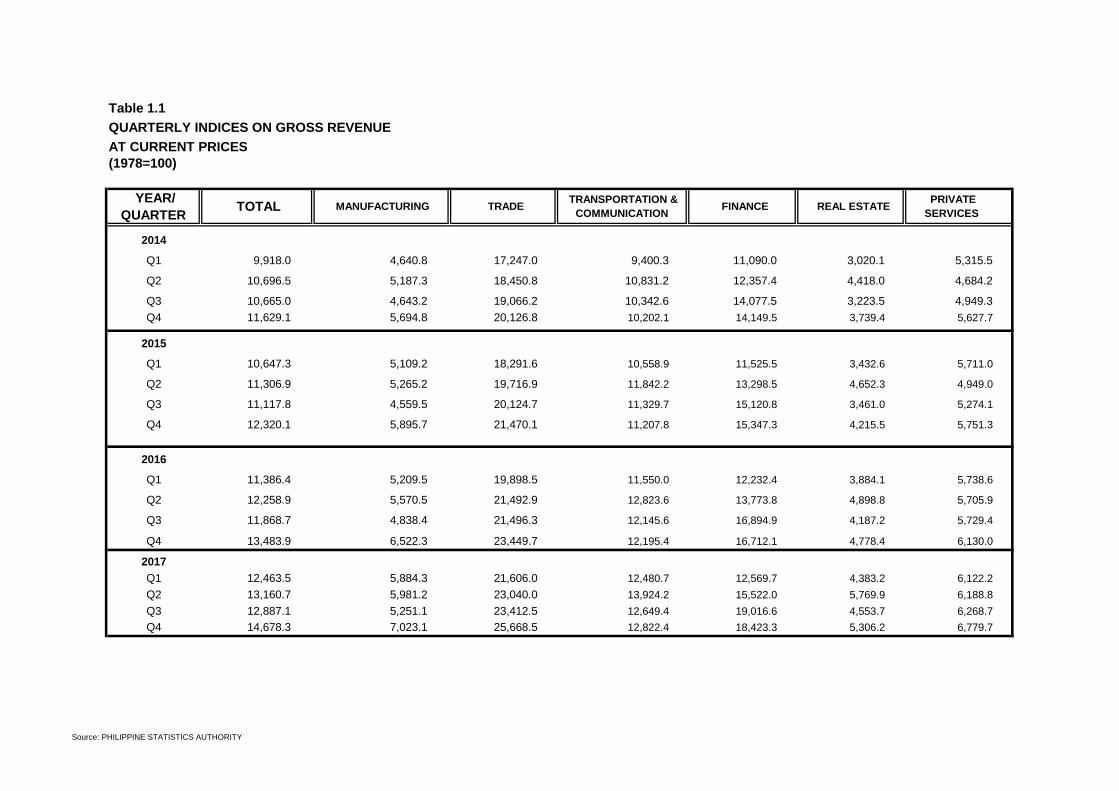
Table 1.1
QUARTERLY INDICES ON GROSS REVENUE
AT CURRENT PRICES
(1978=100)
2014
Q1 9,918.0 4,640.8 17,247.0 9,400.3 11,090.0 3,020.1 5,315.5
Q2 10,696.5 5,187.3 18,450.8 10,831.2 12,357.4 4,418.0 4,684.2
Q3 10,665.0 4,643.2 19,066.2 10,342.6 14,077.5 3,223.5 4,949.3
Q4 11,629.1 5,694.8 20,126.8 10,202.1 14,149.5 3,739.4 5,627.7
2015
Q1 10,647.3 5,109.2 18,291.6 10,558.9 11,525.5 3,432.6 5,711.0
Q2 11,306.9 5,265.2 19,716.9 11,842.2 13,298.5 4,652.3 4,949.0
Q3 11,117.8 4,559.5 20,124.7 11,329.7 15,120.8 3,461.0 5,274.1
Q4 12,320.1 5,895.7 21,470.1 11,207.8 15,347.3 4,215.5 5,751.3
2016
Q1 11,386.4 5,209.5 19,898.5 11,550.0 12,232.4 3,884.1 5,738.6
Q2 12,258.9 5,570.5 21,492.9 12,823.6 13,773.8 4,898.8 5,705.9
Q3 11,868.7 4,838.4 21,496.3 12,145.6 16,894.9 4,187.2 5,729.4
Q4 13,483.9 6,522.3 23,449.7 12,195.4 16,712.1 4,778.4 6,130.0
2017
Q1 12,463.5 5,884.3 21,606.0 12,480.7 12,569.7 4,383.2 6,122.2
Q2 13,160.7 5,981.2 23,040.0 13,924.2 15,522.0 5,769.9 6,188.8
Q3 12,887.1 5,251.1 23,412.5 12,649.4 19,016.6 4,553.7 6,268.7
Q4 14,678.3 7,023.1 25,668.5 12,822.4 18,423.3 5,306.2 6,779.7
MANUFACTURING PRIVATE
SERVICES
YEAR/
QUARTER TOTAL TRADE
TRANSPORTATION &
COMMUNICATION FINANCE REAL ESTATE
Source: PHILIPPINE STATISTICS AUTHORITY

Table 1.2
QUARTERLY INDICES ON EMPLOYMENT
(1978=100)
2014
Q1 175.3 18.9 211.4 185.4 139.5 96.0 204.0 76.5 158.2
Q2 213.6 13.9 285.2 142.6 141.1 97.3 207.7 79.3 163.5
Q3 174.8 19.8 208.7 141.1 141.3 95.4 213.6 81.2 165.6
Q4 167.4 11.7 192.5 149.3 145.1 95.6 216.0 83.5 167.3
2015
Q1 182.0 19.5 219.3 184.8 139.7 95.6 220.1 88.3 170.8
Q2 219.5 14.4 293.6 144.1 138.2 95.8 224.3 89.6 173.0
Q3 179.7 20.4 216.2 141.6 139.4 95.5 218.2 85.8 172.9
Q4 172.8 11.1 200.9 151.1 143.9 96.5 219.1 92.9 173.3
2016
Q1 182.0 18.3 217.4 187.3 141.2 97.4 224.2 95.4 172.9
Q2 221.9 13.7 296.6 145.3 140.8 98.6 226.7 95.0 173.5
Q3 181.7 19.9 217.7 142.2 141.8 101.8 221.2 87.0 173.5
Q4 176.0 10.7 203.2 153.1 147.3 102.6 226.3 96.7 177.7
2017
Q1 184.5 17.2 219.5 189.6 142.4 102.8 230.4 104.7 175.4
Q2 231.2 13.9 311.7 144.2 143.0 104.2 233.9 97.0 175.7
Q3 184.4 19.9 220.0 143.6 145.4 104.8 223.0 89.8 177.1
Q4 178.9 10.7 207.6 155.6 147.7 105.4 227.5 99.4 179.0
YEAR/
QUARTER TOTAL
ELECTRICITY &
WATER MANUFACTURING REAL ESTATE
TRANSPORTATION &
COMMUNICATIONS
MINING &
QUARRYING
PRIVATE
SERVICES FINANCE TRADE
Source: PHILIPPINE STATISTICS AUTHORITY
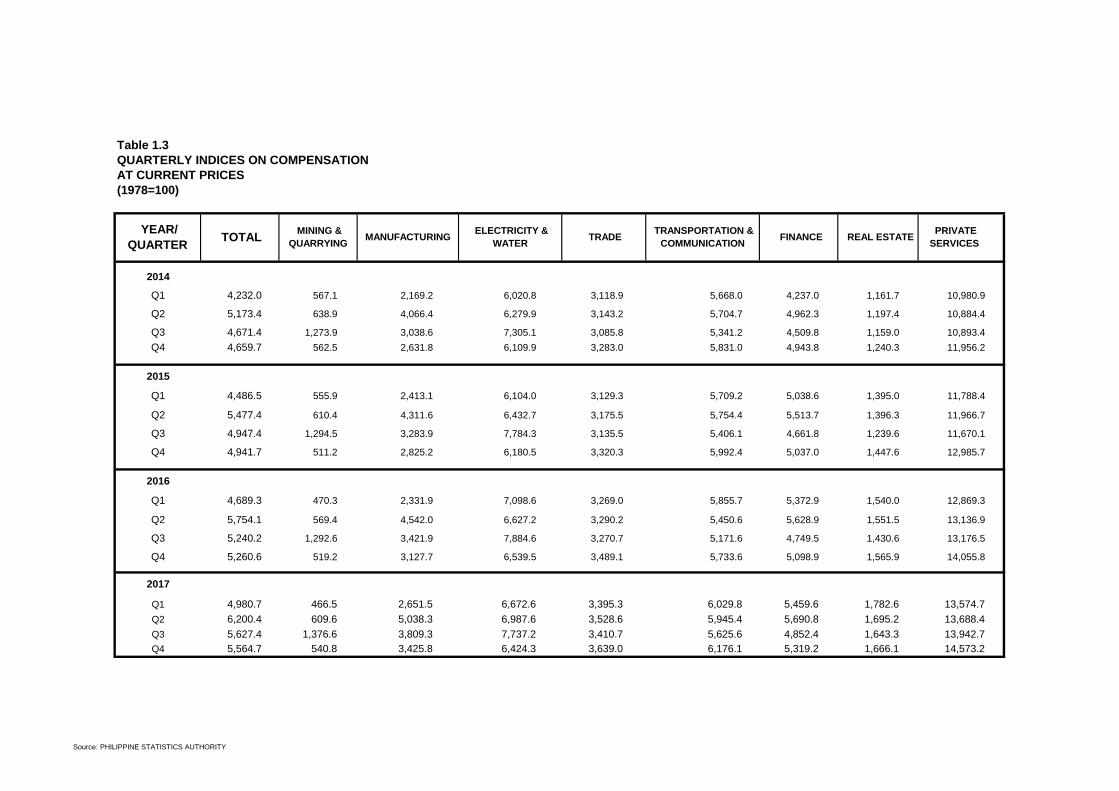
Table 1.3
QUARTERLY INDICES ON COMPENSATION
AT CURRENT PRICES
(1978=100)
2014
Q1 4,232.0 567.1 2,169.2 6,020.8 3,118.9 5,668.0 4,237.0 1,161.7 10,980.9
Q2 5,173.4 638.9 4,066.4 6,279.9 3,143.2 5,704.7 4,962.3 1,197.4 10,884.4
Q3 4,671.4 1,273.9 3,038.6 7,305.1 3,085.8 5,341.2 4,509.8 1,159.0 10,893.4
Q4 4,659.7 562.5 2,631.8 6,109.9 3,283.0 5,831.0 4,943.8 1,240.3 11,956.2
2015
Q1 4,486.5 555.9 2,413.1 6,104.0 3,129.3 5,709.2 5,038.6 1,395.0 11,788.4
Q2 5,477.4 610.4 4,311.6 6,432.7 3,175.5 5,754.4 5,513.7 1,396.3 11,966.7
Q3 4,947.4 1,294.5 3,283.9 7,784.3 3,135.5 5,406.1 4,661.8 1,239.6 11,670.1
Q4 4,941.7 511.2 2,825.2 6,180.5 3,320.3 5,992.4 5,037.0 1,447.6 12,985.7
2016
Q1 4,689.3 470.3 2,331.9 7,098.6 3,269.0 5,855.7 5,372.9 1,540.0 12,869.3
Q2 5,754.1 569.4 4,542.0 6,627.2 3,290.2 5,450.6 5,628.9 1,551.5 13,136.9
Q3 5,240.2 1,292.6 3,421.9 7,884.6 3,270.7 5,171.6 4,749.5 1,430.6 13,176.5
Q4 5,260.6 519.2 3,127.7 6,539.5 3,489.1 5,733.6 5,098.9 1,565.9 14,055.8
2017
Q1 4,980.7 466.5 2,651.5 6,672.6 3,395.3 6,029.8 5,459.6 1,782.6 13,574.7
Q2 6,200.4 609.6 5,038.3 6,987.6 3,528.6 5,945.4 5,690.8 1,695.2 13,688.4
Q3 5,627.4 1,376.6 3,809.3 7,737.2 3,410.7 5,625.6 4,852.4 1,643.3 13,942.7
Q4 5,564.7 540.8 3,425.8 6,424.3 3,639.0 6,176.1 5,319.2 1,666.1 14,573.2
YEAR/
QUARTER TOTAL
ELECTRICITY &
WATER MANUFACTURING REAL ESTATE
TRANSPORTATION &
COMMUNICATION
MINING &
QUARRYING
PRIVATE
SERVICES FINANCE TRADE
Source: PHILIPPINE STATISTICS AUTHORITY

Table 1.3.1
QUARTERLY INDICES ON COMPENSATION PER EMPLOYEE
AT CURRENT PRICES
(1978=100)
2014
Q1 2,413.8 3,004.7 1,026.3 3,246.9 2,235.8 5,905.9 2,077.3 1,517.7 6,941.2
Q2 2,422.3 4,600.7 1,425.9 4,403.5 2,228.1 5,865.0 2,389.6 1,509.3 6,655.2
Q3 2,673.1 6,419.0 1,456.0 5,177.9 2,184.3 5,600.1 2,111.2 1,427.8 6,579.1
Q4 2,783.9 4,805.1 1,367.1 4,091.6 2,263.3 6,100.6 2,289.1 1,486.2 7,145.3
2015
Q1 2,464.6 2,852.3 1,100.6 3,302.6 2,240.7 5,969.7 2,288.9 1,580.3 6,902.5
Q2 2,495.0 4,233.9 1,468.8 4,464.6 2,296.9 6,008.5 2,458.4 1,559.1 6,915.2
Q3 2,752.7 6,354.4 1,519.3 5,497.1 2,250.0 5,659.7 2,136.7 1,445.0 6,748.1
Q4 2,860.3 4,615.5 1,406.1 4,089.5 2,307.8 6,210.3 2,298.7 1,558.0 7,494.5
2016
Q1 2,576.2 2,575.8 1,072.6 3,790.6 2,315.1 6,009.0 2,396.9 1,614.5 7,443.3
Q2 2,592.9 4,152.3 1,531.4 4,560.8 2,337.1 5,528.1 2,483.1 1,633.6 7,572.4
Q3 2,884.6 6,493.5 1,571.9 5,543.7 2,305.8 5,081.7 2,147.2 1,643.8 7,595.3
Q4 2,988.1 4,869.1 1,538.9 4,270.8 2,368.7 5,586.2 2,253.3 1,620.1 7,908.1
2017
Q1 2,699.7 2,706.4 1,208.1 3,519.0 2,385.1 5,867.3 2,370.1 1,701.9 7,738.2
Q2 2,682.4 4,391.5 1,616.2 4,844.3 2,466.8 5,706.9 2,432.8 1,747.9 7,791.7
Q3 3,052.5 6,911.2 1,731.2 5,387.4 2,345.6 5,369.1 2,176.4 1,830.8 7,873.2
Q4 3,110.2 5,037.5 1,650.1 4,128.5 2,464.4 5,862.3 2,337.9 1,675.3 8,143.6
YEAR/
QUARTER TOTAL
ELECTRICITY &
WATER MANUFACTURING TRADE
TRANSPORTATION &
COMMUNICATION FINANCE REAL ESTATE
MINING &
QUARRYING
PRIVATE
SERVICES
Source: PHILIPPINE STATISTICS AUTHORITY
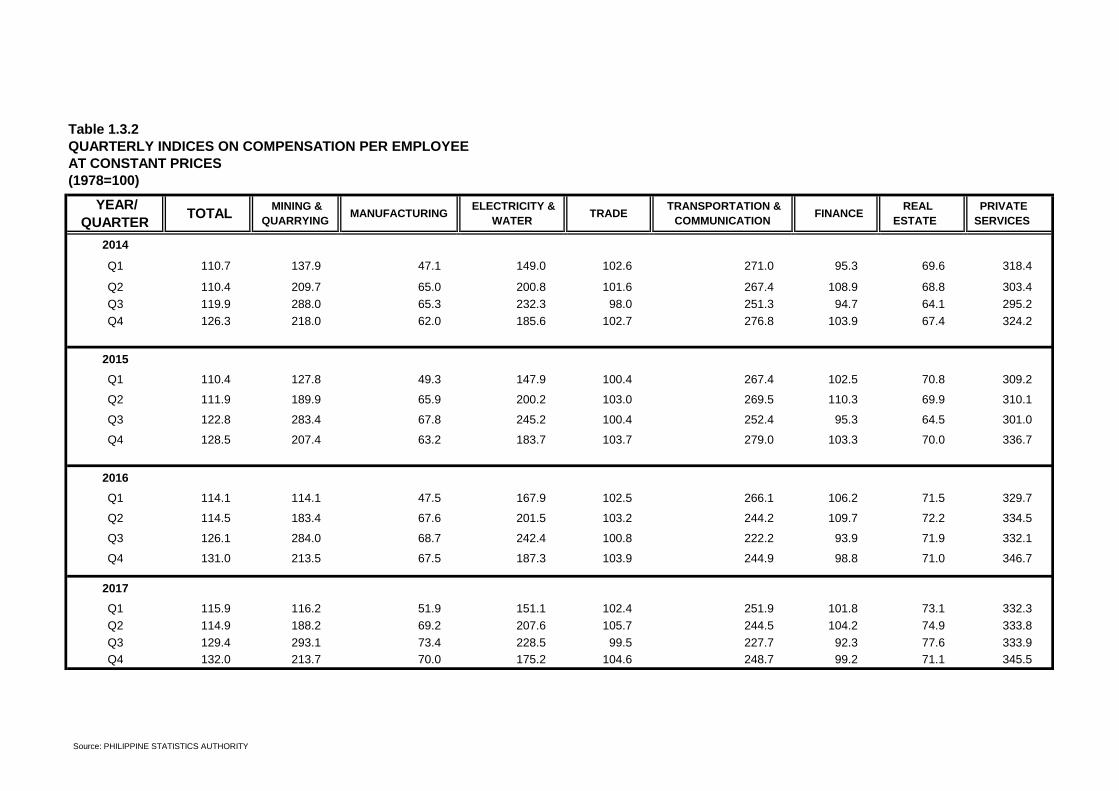
Table 1.3.2
QUARTERLY INDICES ON COMPENSATION PER EMPLOYEE
AT CONSTANT PRICES
(1978=100)
2014
Q1 110.7 137.9 47.1 149.0 102.6 271.0 95.3 69.6 318.4
Q2 110.4 209.7 65.0 200.8 101.6 267.4 108.9 68.8 303.4
Q3 119.9 288.0 65.3 232.3 98.0 251.3 94.7 64.1 295.2
Q4 126.3 218.0 62.0 185.6 102.7 276.8 103.9 67.4 324.2
2015
Q1 110.4 127.8 49.3 147.9 100.4 267.4 102.5 70.8 309.2
Q2 111.9 189.9 65.9 200.2 103.0 269.5 110.3 69.9 310.1
Q3 122.8 283.4 67.8 245.2 100.4 252.4 95.3 64.5 301.0
Q4 128.5 207.4 63.2 183.7 103.7 279.0 103.3 70.0 336.7
2016
Q1 114.1 114.1 47.5 167.9 102.5 266.1 106.2 71.5 329.7
Q2 114.5 183.4 67.6 201.5 103.2 244.2 109.7 72.2 334.5
Q3 126.1 284.0 68.7 242.4 100.8 222.2 93.9 71.9 332.1
Q4 131.0 213.5 67.5 187.3 103.9 244.9 98.8 71.0 346.7
2017
Q1 115.9 116.2 51.9 151.1 102.4 251.9 101.8 73.1 332.3
Q2 114.9 188.2 69.2 207.6 105.7 244.5 104.2 74.9 333.8
Q3 129.4 293.1 73.4 228.5 99.5 227.7 92.3 77.6 333.9
Q4 132.0 213.7 70.0 175.2 104.6 248.7 99.2 71.1 345.5
YEAR/
QUARTER TOTAL
PRIVATE
SERVICES
ELECTRICITY &
WATER TRADE
TRANSPORTATION &
COMMUNICATION FINANCE
MINING &
QUARRYING MANUFACTURING
REAL
ESTATE
Source: PHILIPPINE STATISTICS AUTHORITY
SECTORAL QUARTERLY
ECONOMIC INDICES
7

AGRICULTURE, FISHERY
AND
FORESTRY
8

Table 2.1
QUARTERLY INDICES ON VOLUME OF PRODUCTION
AGRICULTURE, FISHERY AND FORESTRY (AFF)
(1978=100)
2014
Q1 215.9 167.1 182.3 241.9 35.7 220.2 157.9 156.5 384.0 326.4 27.3
Q2 225.3 204.2 336.0 198.9 65.5 37.5 283.9 188.8 358.7 286.7 20.4
Q3 183.0 140.5 184.1 317.5 70.7 5.4 280.8 86.1 347.1 290.9 3.7
Q4 262.0 202.4 201.2 142.7 33.0 120.2 274.6 262.0 591.1 320.8 1.3
2015
Q1 217.7 169.6 184.9 251.5 35.9 213.9 164.2 158.8 400.3 317.0 17.1
Q2 223.3 198.7 326.5 167.7 65.0 31.7 283.4 190.5 376.6 282.4 14.9
Q3 183.5 136.2 155.2 312.1 71.4 3.1 290.3 90.7 366.3 294.1 4.3
Q4 261.2 200.5 193.6 134.0 32.9 110.9 279.8 275.0 615.0 309.4 1.5
2016
Q1 207.7 156.3 166.4 203.7 34.0 210.0 157.5 154.4 411.4 301.4 17.6
Q2 217.6 191.4 306.6 150.9 60.5 40.2 273.0 187.6 393.0 265.7 10.0
Q3 188.7 143.9 180.5 344.9 66.3 1.7 284.8 91.6 378.2 286.5 3.5
Q4 257.7 196.6 186.6 133.8 31.2 94.2 284.1 278.3 629.0 297.7 1.4
2017
Q1 223.6 177.0 187.1 251.5 33.2 212.1 161.6 182.6 422.1 303.6 14.4
Q2 231.5 216.6 342.5 220.3 60.9 103.3 280.1 187.8 403.0 257.9 13.2
Q3 192.8 150.6 206.1 335.5 68.4 2.8 294.6 93.4 385.8 279.0 2.7
Q4 263.3 202.0 194.7 126.3 32.3 108.0 293.1 283.2 649.0 296.1 1.4
FORESTRYTotal Crops Palay Corn Coconut Sugarcane Banana Other Crops
YEAR/
QUARTER
TOTAL
AFF
AGRICULTURAL CROPS
LIVESTOCK
& POULTRYFISHERY
Source: PHILIPPINE STATISTICS AUTHORITY 9

MINING AND QUARRYING
10
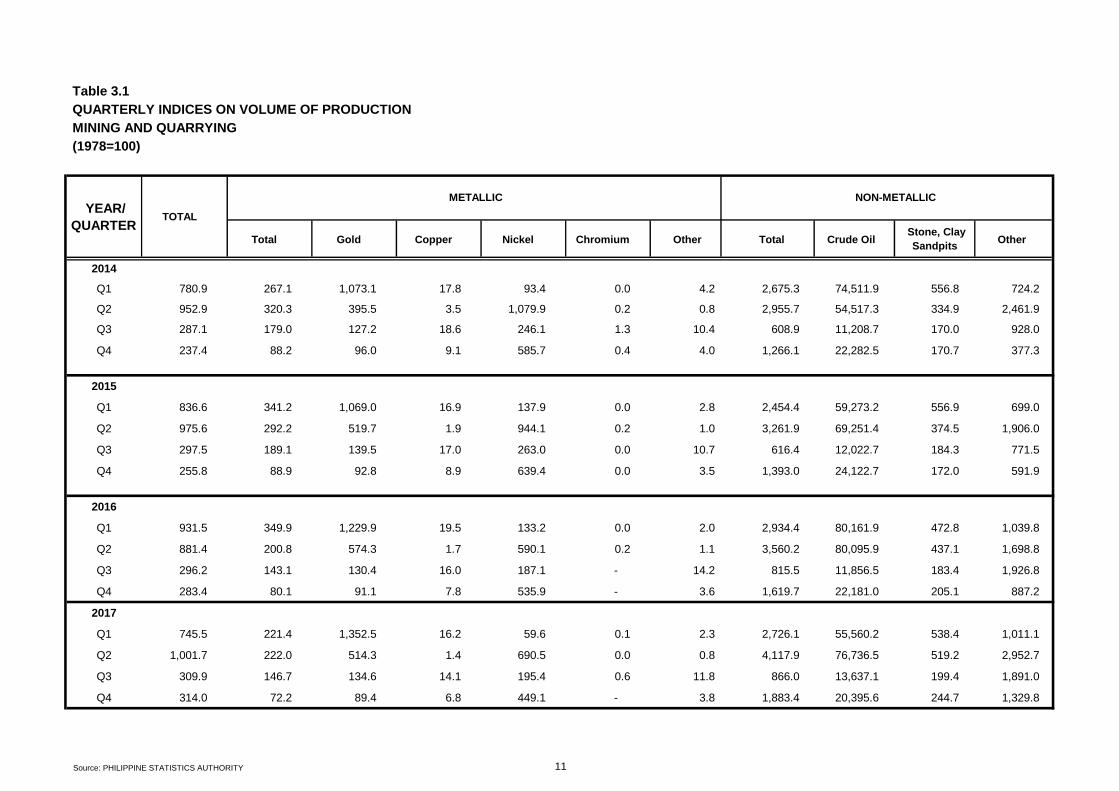
Table 3.1
QUARTERLY INDICES ON VOLUME OF PRODUCTION
MINING AND QUARRYING
(1978=100)
Total Gold Copper Nickel Chromium Other Total Crude Oil Other
2014
Q1 780.9 267.1 1,073.1 17.8 93.4 0.0 4.2 2,675.3 74,511.9 556.8 724.2
Q2 952.9 320.3 395.5 3.5 1,079.9 0.2 0.8 2,955.7 54,517.3 334.9 2,461.9
Q3 287.1 179.0 127.2 18.6 246.1 1.3 10.4 608.9 11,208.7 170.0 928.0
Q4 237.4 88.2 96.0 9.1 585.7 0.4 4.0 1,266.1 22,282.5 170.7 377.3
2015
Q1 836.6 341.2 1,069.0 16.9 137.9 0.0 2.8 2,454.4 59,273.2 556.9 699.0
Q2 975.6 292.2 519.7 1.9 944.1 0.2 1.0 3,261.9 69,251.4 374.5 1,906.0
Q3 297.5 189.1 139.5 17.0 263.0 0.0 10.7 616.4 12,022.7 184.3 771.5
Q4 255.8 88.9 92.8 8.9 639.4 0.0 3.5 1,393.0 24,122.7 172.0 591.9
2016
Q1 931.5 349.9 1,229.9 19.5 133.2 0.0 2.0 2,934.4 80,161.9 472.8 1,039.8
Q2 881.4 200.8 574.3 1.7 590.1 0.2 1.1 3,560.2 80,095.9 437.1 1,698.8
Q3 296.2 143.1 130.4 16.0 187.1 - 14.2 815.5 11,856.5 183.4 1,926.8
Q4 283.4 80.1 91.1 7.8 535.9 - 3.6 1,619.7 22,181.0 205.1 887.2
2017
Q1 745.5 221.4 1,352.5 16.2 59.6 0.1 2.3 2,726.1 55,560.2 538.4 1,011.1
Q2 1,001.7 222.0 514.3 1.4 690.5 0.0 0.8 4,117.9 76,736.5 519.2 2,952.7
Q3 309.9 146.7 134.6 14.1 195.4 0.6 11.8 866.0 13,637.1 199.4 1,891.0
Q4 314.0 72.2 89.4 6.8 449.1 - 3.8 1,883.4 20,395.6 244.7 1,329.8
YEAR/
QUARTER TOTAL
METALLIC NON-METALLIC
Stone, Clay
Sandpits
Source: PHILIPPINE STATISTICS AUTHORITY 11

Table 3.1.1
QUARTERLY INDICES ON VOLUME OF PRODUCTION PER WORKER
MINING AND QUARRYING
(1978=100)
Total Gold Copper Nickel Chromium Other Total Crude Oil Stone, Clay
Sandpits Other
2014
Q1 4,137.1 2,305.6 41,016.1 80.8 381.1 0.0 33.8 6,139.9 97,718.9 474.5 40,807.9
Q2 6,862.2 7,427.4 17,275.7 19.4 869.4 0.1 1.4 12,991.5 227,815.3 180.1 111,365.6
Q3 1,446.6 1,083.3 5,596.3 104.7 828.2 0.9 263.8 2,384.6 59,673.2 175.3 1,997.5
Q4 2,027.6 1,487.9 3,300.6 436.2 3,482.5 0.3 42.1 4,671.2 65,161.6 104.3 4,629.2
2015
Q1 4,292.7 2,865.0 39,285.0 88.3 461.0 0.0 22.0 5,271.1 81,579.6 448.6 73,622.8
Q2 6,767.3 6,496.4 21,233.9 12.2 739.1 0.1 0.8 14,160.4 355,703.6 184.8 138,093.8
Q3 1,460.3 1,126.7 5,300.5 100.5 1,015.3 0.0 149.5 2,162.1 80,110.8 177.2 2,545.9
Q4 2,309.2 1,583.0 2,893.2 484.7 4,614.4 0.1 20.9 5,515.3 92,088.7 103.0 9,249.9
2016
Q1 5,101.2 3,185.7 43,675.2 105.6 585.6 0.0 16.5 6,268.8 112,353.8 384.1 224,155.1
Q2 6,427.0 4,704.4 22,302.2 12.2 549.4 0.1 0.9 16,062.5 460,428.0 229.0 217,978.5
Q3 1,488.0 881.1 4,720.9 114.0 708.2 - 203.0 2,765.2 84,008.1 166.1 13,484.1
Q4 2,657.9 1,514.3 2,645.9 493.4 4,232.4 - 31.4 5,932.1 86,827.5 112.7 13,139.2
2017
Q1 4,324.7 2,137.2 45,658.5 109.7 249.8 0.1 28.6 6,157.2 79,887.9 422.3 250,606.2
Q2 7,216.6 5,085.9 18,834.0 11.3 615.2 0.0 0.4 19,101.2 457,137.8 245.8 444,858.6
Q3 1,556.1 884.8 4,641.6 119.6 700.2 1.4 104.5 3,210.7 100,134.2 163.1 19,161.4
Q4 2,924.6 1,363.6 2,550.0 415.2 3,444.9 - 47.4 6,679.1 84,112.3 126.6 19,546.3
YEAR/
QUARTER TOTAL
METALLIC NON-METALLIC
Source: PHILIPPINE STATISTICS AUTHORITY 12
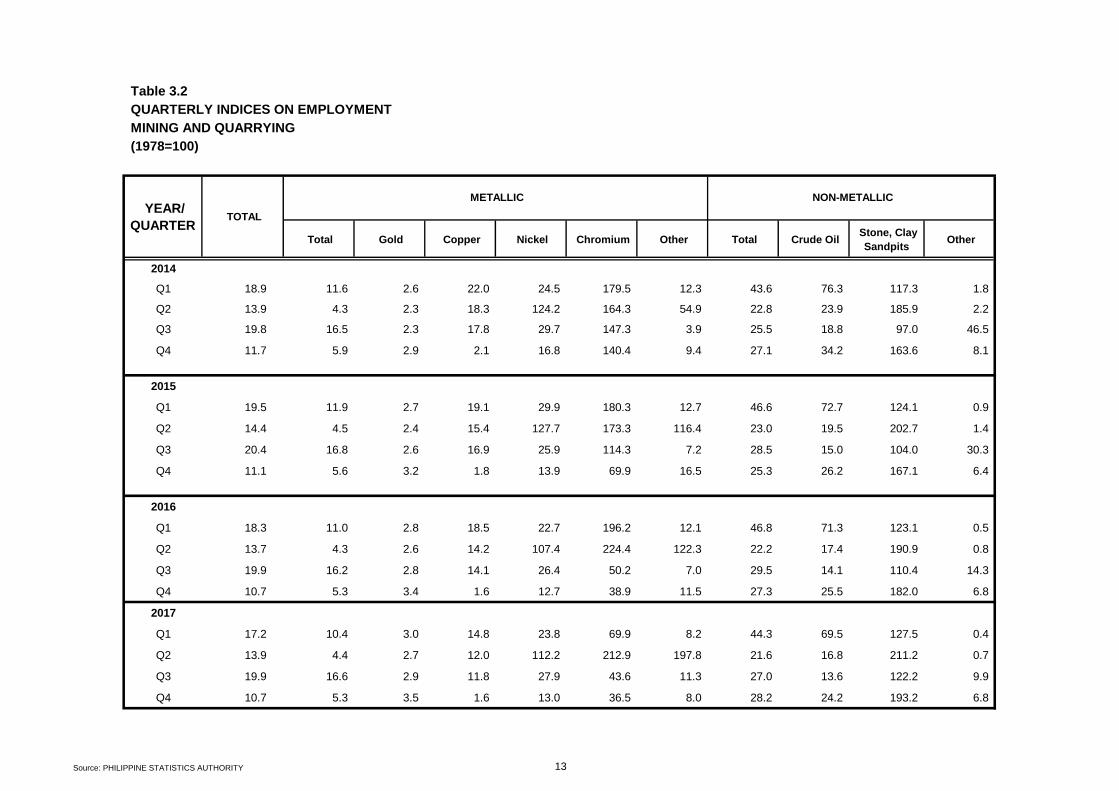
Table 3.2
QUARTERLY INDICES ON EMPLOYMENT
MINING AND QUARRYING
(1978=100)
Total Gold Copper Nickel Chromium Other Total Crude Oil Stone, Clay
Sandpits Other
2014
Q1 18.9 11.6 2.6 22.0 24.5 179.5 12.3 43.6 76.3 117.3 1.8
Q2 13.9 4.3 2.3 18.3 124.2 164.3 54.9 22.8 23.9 185.9 2.2
Q3 19.8 16.5 2.3 17.8 29.7 147.3 3.9 25.5 18.8 97.0 46.5
Q4 11.7 5.9 2.9 2.1 16.8 140.4 9.4 27.1 34.2 163.6 8.1
2015
Q1 19.5 11.9 2.7 19.1 29.9 180.3 12.7 46.6 72.7 124.1 0.9
Q2 14.4 4.5 2.4 15.4 127.7 173.3 116.4 23.0 19.5 202.7 1.4
Q3 20.4 16.8 2.6 16.9 25.9 114.3 7.2 28.5 15.0 104.0 30.3
Q4 11.1 5.6 3.2 1.8 13.9 69.9 16.5 25.3 26.2 167.1 6.4
2016
Q1 18.3 11.0 2.8 18.5 22.7 196.2 12.1 46.8 71.3 123.1 0.5
Q2 13.7 4.3 2.6 14.2 107.4 224.4 122.3 22.2 17.4 190.9 0.8
Q3 19.9 16.2 2.8 14.1 26.4 50.2 7.0 29.5 14.1 110.4 14.3
Q4 10.7 5.3 3.4 1.6 12.7 38.9 11.5 27.3 25.5 182.0 6.8
2017
Q1 17.2 10.4 3.0 14.8 23.8 69.9 8.2 44.3 69.5 127.5 0.4
Q2 13.9 4.4 2.7 12.0 112.2 212.9 197.8 21.6 16.8 211.2 0.7
Q3 19.9 16.6 2.9 11.8 27.9 43.6 11.3 27.0 13.6 122.2 9.9
Q4 10.7 5.3 3.5 1.6 13.0 36.5 8.0 28.2 24.2 193.2 6.8
NON-METALLIC YEAR/
QUARTER TOTAL
METALLIC
Source: PHILIPPINE STATISTICS AUTHORITY 13

Table 3.3
QUARTERLY INDICES ON COMPENSATION
MINING AND QUARRYING
AT CURRENT PRICES
Total Gold Copper Nickel Chromium Other Total Crude Oil Stone, Clay
Sandpits Other
2014
Q1 567.1 314.2 41.7 565.7 710.2 171.4 33.3 1,110.9 952.4 1,016.9 357.5
Q2 638.9 393.4 161.4 271.0 472.2 547.8 154.8 1,566.1 504.1 1,881.1 1,250.5
Q3 1,273.9 436.4 46.0 849.7 399.9 84.3 16.4 1,434.6 276.4 1,130.7 1,455.7
Q4 562.5 402.2 44.7 628.4 415.4 141.9 221.7 1,532.9 392.2 1,839.1 1,166.2
2015
Q1 555.9 304.1 35.4 551.1 814.1 171.2 29.8 1,138.1 931.8 1,056.0 222.1
Q2 610.4 363.6 124.6 261.0 545.3 508.6 260.2 1,645.1 485.9 2,328.1 814.4
Q3 1,294.5 444.3 49.3 935.4 342.0 49.5 23.0 1,448.8 249.7 1,413.7 907.3
Q4 511.2 368.6 44.1 652.6 315.1 87.6 296.3 1,325.7 311.6 2,306.9 475.7
2016
Q1 470.3 259.4 36.5 469.7 575.2 206.3 30.3 942.8 905.5 1,020.0 66.4
Q2 569.4 341.7 115.6 262.8 477.7 572.4 267.9 1,495.7 357.1 2,125.3 379.4
Q3 1,292.6 454.7 61.2 823.9 336.5 37.0 21.3 1,308.9 208.2 1,453.2 396.6
Q4 519.2 379.2 50.4 658.3 329.2 60.1 198.9 1,279.0 272.0 2,432.4 240.7
2017
Q1 466.5 274.5 47.5 402.4 609.5 99.8 23.7 818.5 783.8 1,021.7 54.7
Q2 609.6 375.1 159.0 234.7 549.0 600.8 146.6 1,511.9 321.8 2,722.1 373.9
Q3 1,376.6 499.0 83.4 735.8 391.6 36.8 11.6 1,285.4 187.7 1,853.1 367.1
Q4 540.8 402.7 55.5 687.7 349.6 65.2 170.7 1,227.2 254.3 2,723.5 192.5
YEAR/
QUARTER TOTAL
METALLIC NON-METALLIC
Source: PHILIPPINE STATISTICS AUTHORITY 14

Table 3.3.1
QUARTERLY INDICES ON COMPENSATION PER EMPLOYEE
MINING AND QUARRYING
AT CURRENT PRICES
Total Gold Copper Nickel Chromium Other Total Crude Oil Stone, Clay
Sandpits Other
2014
Q1 3,004.7 2,711.7 1,595.6 2,576.0 2,896.6 95.5 270.6 2,549.6 1,249.0 866.7 20,145.2
Q2 4,600.7 9,124.7 7,048.7 1,484.2 380.1 333.5 282.1 6,883.6 2,106.4 1,011.6 56,567.0
Q3 6,419.0 2,640.9 2,024.4 4,775.6 1,345.5 57.2 416.6 5,618.0 1,471.4 1,165.9 3,133.2
Q4 4,805.1 6,787.1 1,537.3 30,269.7 2,470.1 101.1 2,357.8 5,655.4 1,146.9 1,124.0 14,309.8
2015
Q1 2,852.3 2,553.5 1,299.8 2,881.5 2,720.8 95.0 234.2 2,444.2 1,282.5 850.6 23,387.9
Q2 4,233.9 8,083.6 5,089.2 1,698.0 426.9 293.5 223.5 7,141.4 2,496.0 1,148.8 59,006.4
Q3 6,354.4 2,646.8 1,874.7 5,524.5 1,320.4 43.3 321.2 5,081.9 1,664.1 1,359.2 2,993.9
Q4 4,615.5 6,566.2 1,374.3 35,609.3 2,274.2 125.3 1,790.5 5,249.0 1,189.6 1,380.8 7,434.1
2016
Q1 2,575.8 2,361.7 1,294.9 2,537.6 2,528.5 105.1 250.2 2,014.2 1,269.1 828.6 14,303.8
Q2 4,152.3 8,004.1 4,488.5 1,849.6 444.7 255.1 219.0 6,748.1 2,052.8 1,113.4 48,677.0
Q3 6,493.5 2,800.5 2,214.9 5,861.8 1,273.5 73.6 304.7 4,438.3 1,475.4 1,316.0 2,775.3
Q4 4,869.1 7,169.3 1,465.0 41,877.5 2,599.8 154.3 1,723.4 4,684.4 1,064.6 1,336.3 3,564.5
2017
Q1 2,706.4 2,649.0 1,602.2 2,727.2 2,556.1 142.8 289.1 1,848.6 1,127.0 801.4 13,563.0
Q2 4,391.5 8,591.0 5,820.5 1,962.4 489.2 282.2 74.1 7,013.0 1,917.0 1,288.7 56,337.0
Q3 6,911.2 3,010.7 2,874.9 6,219.2 1,402.9 84.5 103.2 4,765.7 1,377.9 1,515.8 3,719.9
Q4 5,037.5 7,605.8 1,583.1 42,157.8 2,681.3 178.6 2,123.0 4,351.9 1,048.9 1,409.8 2,830.2
YEAR/
QUARTER TOTAL
METALLIC NON-METALLIC
Source: PHILIPPINE STATISTICS AUTHORITY 15

Table 3.3.2
QUARTERLY INDICES ON COMPENSATION PER EMPLOYEE
MINING AND QUARRYING
AT CONSTANT PRICES
Total Gold Copper Nickel Chromium Other Total Crude Oil Stone, Clay
Sandpits Other
2014
Q1 137.9 124.4 73.2 118.2 132.9 4.4 12.4 117.0 57.3 39.8 924.2
Q2 209.7 416.0 321.4 67.7 17.3 15.2 12.9 313.8 96.0 46.1 2,578.9
Q3 288.0 118.5 90.8 214.3 60.4 2.6 18.7 252.1 66.0 52.3 140.6
Q4 218.0 307.9 69.8 1,373.4 112.1 4.6 107.0 256.6 52.0 51.0 649.3
2015
Q1 127.8 114.4 58.2 129.1 121.9 4.3 10.5 109.5 57.4 38.1 1,047.6
Q2 189.9 362.5 228.2 76.2 19.1 13.2 10.0 320.3 111.9 51.5 2,646.3
Q3 283.4 118.1 83.6 246.4 58.9 1.9 14.3 226.7 74.2 60.6 133.5
Q4 207.4 295.0 61.7 1,599.7 102.2 5.6 80.4 235.8 53.4 62.0 334.0
2016
Q1 114.1 104.6 57.4 112.4 112.0 4.7 11.1 89.2 56.2 36.7 633.5
Q2 183.4 353.5 198.3 81.7 19.6 11.3 9.7 298.1 90.7 49.2 2,150.1
Q3 284.0 122.5 96.9 256.3 55.7 3.2 13.3 194.1 64.5 57.5 121.4
Q4 213.5 314.3 64.2 1,836.1 114.0 6.8 75.6 205.4 46.7 58.6 156.3
2017
Q1 116.2 113.7 68.8 117.1 109.8 6.1 12.4 79.4 48.4 34.4 582.4
Q2 188.2 368.1 249.4 84.1 21.0 12.1 3.2 300.5 82.1 55.2 2,413.8
Q3 293.1 127.7 121.9 263.7 59.5 3.6 4.4 202.1 58.4 64.3 157.8
Q4 213.7 322.7 67.2 1,788.7 113.8 7.6 90.1 184.6 44.5 59.8 120.1
NON-METALLIC YEAR/
QUARTER TOTAL
METALLIC
Source: PHILIPPINE STATISTICS AUTHORITY 16
MANUFACTURING
17

Table 4.1
QUARTERLY INDICES ON GROSS REVENUE
MANUFACTURING
AT CURRENT PRICES
(1978=100)
2014
Q1 4,640.8 6,968.2 5,132.3 162.0 1,376.1 3,319.9 322.2 4,309.9 249.3 3,133.2
Q2 5,187.3 7,208.3 5,476.4 137.9 1,439.9 6,585.2 531.0 3,405.4 899.3 5,451.3
Q3 4,643.2 4,765.6 8,844.8 393.5 653.6 3,287.0 369.8 2,010.6 1,046.9 2,238.6
Q4 5,694.8 7,545.7 4,793.2 189.3 1,233.6 5,853.5 731.5 5,572.9 91.5 10,556.9
2015
Q1 5,109.2 7,109.0 6,741.6 269.9 1,611.9 3,370.6 315.4 3,148.1 307.3 5,250.6
Q2 5,265.2 7,561.0 5,676.2 147.7 1,455.7 7,069.7 549.7 3,051.1 1,054.2 5,728.2
Q3 4,559.5 4,632.0 8,732.3 493.9 686.6 3,362.3 324.1 1,311.4 1,163.2 1,937.2
Q4 5,895.7 7,896.5 4,753.6 260.9 1,234.8 6,425.1 767.7 3,470.7 107.9 9,640.5
2016
Q1 5,209.5 7,569.8 7,341.4 310.6 1,364.9 3,146.9 311.1 2,503.8 315.3 5,414.1
Q2 5,570.5 8,434.8 6,605.0 166.2 1,177.9 8,112.6 670.1 2,220.4 1,138.3 6,639.3
Q3 4,838.4 4,961.3 9,970.9 546.4 642.6 3,079.9 367.5 1,152.4 1,224.9 2,044.0
Q4 6,522.3 8,715.2 5,303.3 247.9 1,272.2 6,443.0 884.2 2,946.4 117.2 8,417.6
2017
Q1 5,884.3 8,100.9 7,384.2 276.7 824.5 3,502.0 418.0 2,378.6 308.4 4,646.1
Q2 5,981.2 8,872.9 6,660.6 181.1 1,154.1 8,634.5 665.7 2,368.8 1,181.0 7,569.7
Q3 5,251.1 5,243.1 10,100.8 513.0 606.4 3,188.6 356.1 1,578.6 1,316.0 2,647.5
Q4 7,023.1 9,088.0 5,351.6 206.2 1,370.9 6,353.0 898.5 3,582.2 120.5 9,682.9
TEXTILEYEAR/
QUARTER TOTAL FOOD BEVERAGE TOBACCO
FOOTWEAR &
WEARING
APPAREL
WOOD & WOOD
PRODUCTS
FURNITURE &
FIXTURES
PAPER & PAPER
PRODUCTS
PUBLISHING &
PRINTING
Source: PHILIPPINE STATISTICS AUTHORITY 18

Table 4.1 (continued)
QUARTERLY INDICES ON GROSS REVENUE
MANUFACTURING
AT CURRENT PRICES
(1978=100)
2014
Q1 1,940.6 2,045.3 2,206.4 4,002.7 2,530.6 6,148.6 9,572.2 3,063.2 7,054.1 2,520.8
Q2 50.4 1,580.3 3,583.1 4,619.0 6,478.3 5,775.4 9,967.9 920.6 23,005.2 3,125.9
Q3 55.5 2,075.9 5,420.9 5,551.7 7,434.8 5,436.9 6,742.1 2,082.1 8,163.2 3,623.3
Q4 579.1 2,540.3 7,431.5 4,126.3 3,751.3 5,774.4 5,008.2 3,748.6 12,479.9 2,712.2
2015
Q1 2,111.1 2,306.2 2,424.2 3,386.4 2,750.8 12,148.7 10,744.1 9,854.7 6,991.9 2,843.9
Q2 56.0 1,555.1 4,208.0 3,447.6 7,132.6 5,066.8 10,244.2 502.6 24,900.5 3,157.6
Q3 56.2 2,102.1 6,357.3 4,359.8 7,508.2 3,773.0 6,715.7 704.8 9,364.5 3,775.7
Q4 643.8 2,281.5 8,682.5 3,298.9 3,824.5 6,642.1 4,468.0 4,979.4 13,452.4 3,132.3
2016
Q1 2,641.4 2,054.1 3,445.1 2,339.3 2,664.2 10,602.6 9,193.4 8,689.9 8,386.5 2,961.5
Q2 64.2 1,812.5 4,247.5 2,367.9 7,185.2 6,619.1 10,204.1 979.9 24,082.1 3,520.7
Q3 51.1 2,135.3 7,060.2 4,100.6 6,880.4 6,095.2 6,763.0 2,000.7 9,141.0 4,028.4
Q4 644.9 2,257.7 8,921.3 5,121.9 3,614.5 7,415.5 4,207.0 6,121.8 13,868.8 3,065.4
2017
Q1 2,912.7 2,319.9 3,263.0 3,836.7 2,825.3 14,353.8 9,294.4 14,743.5 8,093.7 2,768.2
Q2 73.3 1,725.3 4,241.6 3,261.1 7,451.6 6,841.5 9,308.6 1,078.0 24,665.4 3,405.7
Q3 56.4 2,005.3 7,870.6 4,554.3 7,642.6 7,538.7 8,277.7 2,488.6 9,001.6 4,321.6
Q4 661.8 2,257.8 10,029.9 5,890.8 4,059.2 8,790.9 5,311.8 6,998.5 15,091.5 3,359.7
BASIC METALS
Total ferrous non-ferrous
YEAR/
QUARTERLEATHER RUBBER
CHEMICAL &
CHEMICAL
PRODUCTS
PETROLEUM
& COAL
NON-METALLIC
MINERAL PROD.
METAL
PRODUCTS
MACHINERIES
(except elect.)
Source: PHILIPPINE STATISTICS AUTHORITY 19
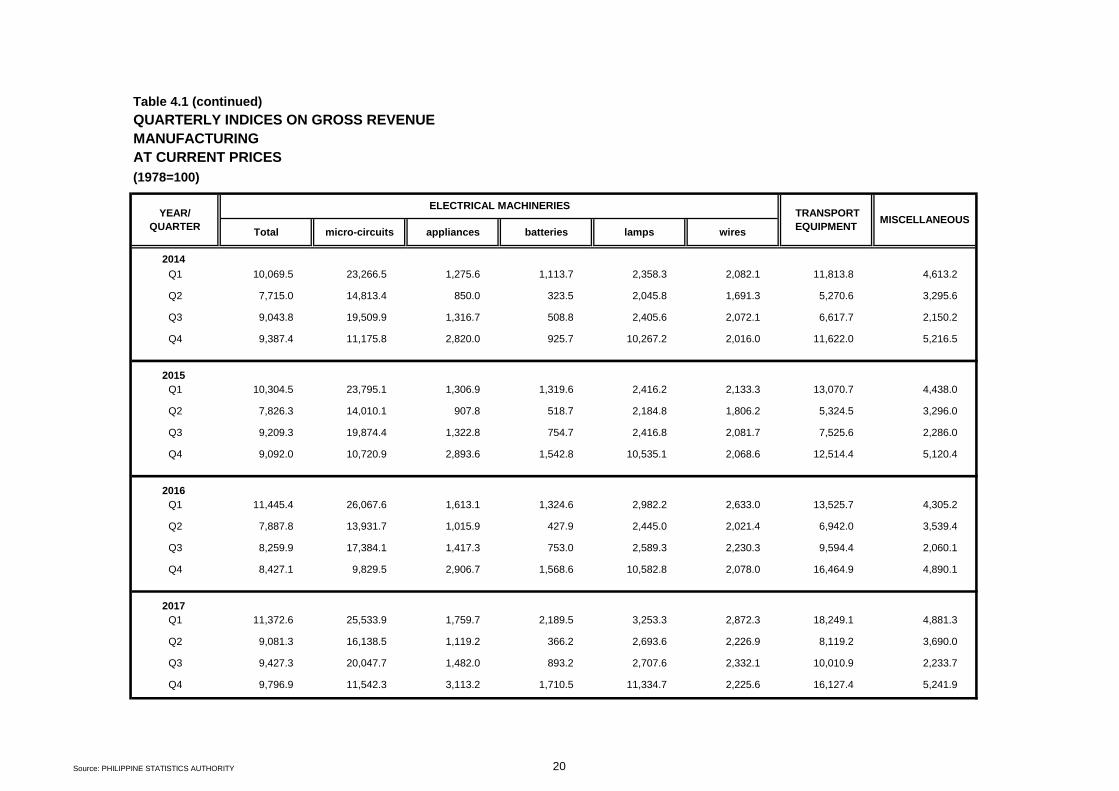
Table 4.1 (continued)
QUARTERLY INDICES ON GROSS REVENUE
MANUFACTURING
AT CURRENT PRICES
(1978=100)
2014
Q1 10,069.5 23,266.5 1,275.6 1,113.7 2,358.3 2,082.1 11,813.8 4,613.2
Q2 7,715.0 14,813.4 850.0 323.5 2,045.8 1,691.3 5,270.6 3,295.6
Q3 9,043.8 19,509.9 1,316.7 508.8 2,405.6 2,072.1 6,617.7 2,150.2
Q4 9,387.4 11,175.8 2,820.0 925.7 10,267.2 2,016.0 11,622.0 5,216.5
2015
Q1 10,304.5 23,795.1 1,306.9 1,319.6 2,416.2 2,133.3 13,070.7 4,438.0
Q2 7,826.3 14,010.1 907.8 518.7 2,184.8 1,806.2 5,324.5 3,296.0
Q3 9,209.3 19,874.4 1,322.8 754.7 2,416.8 2,081.7 7,525.6 2,286.0
Q4 9,092.0 10,720.9 2,893.6 1,542.8 10,535.1 2,068.6 12,514.4 5,120.4
2016
Q1 11,445.4 26,067.6 1,613.1 1,324.6 2,982.2 2,633.0 13,525.7 4,305.2
Q2 7,887.8 13,931.7 1,015.9 427.9 2,445.0 2,021.4 6,942.0 3,539.4
Q3 8,259.9 17,384.1 1,417.3 753.0 2,589.3 2,230.3 9,594.4 2,060.1
Q4 8,427.1 9,829.5 2,906.7 1,568.6 10,582.8 2,078.0 16,464.9 4,890.1
2017
Q1 11,372.6 25,533.9 1,759.7 2,189.5 3,253.3 2,872.3 18,249.1 4,881.3
Q2 9,081.3 16,138.5 1,119.2 366.2 2,693.6 2,226.9 8,119.2 3,690.0
Q3 9,427.3 20,047.7 1,482.0 893.2 2,707.6 2,332.1 10,010.9 2,233.7
Q4 9,796.9 11,542.3 3,113.2 1,710.5 11,334.7 2,225.6 16,127.4 5,241.9
MISCELLANEOUS
Total micro-circuits appliances batteries lamps wires
YEAR/
QUARTER
ELECTRICAL MACHINERIES TRANSPORT
EQUIPMENT
Source: PHILIPPINE STATISTICS AUTHORITY 20

Table 4.2
QUARTERLY INDICES ON EMPLOYMENT
MANUFACTURING
(1978=100)
2014
Q1 211.4 234.6 71.0 92.1 78.3 287.9 81.4 103.1 104.7 171.8
Q2 285.2 467.3 98.5 161.2 170.7 228.8 81.6 154.8 183.0 216.9
Q3 208.7 335.1 99.3 91.3 66.2 218.2 39.3 97.5 99.1 157.9
Q4 192.5 288.0 88.9 205.6 76.0 119.7 68.9 98.8 178.4 314.8
2015
Q1 219.3 213.5 95.5 109.5 82.9 293.8 69.8 99.4 111.7 194.4
Q2 293.6 444.4 132.6 123.9 184.4 226.1 72.6 159.0 193.8 205.1
Q3 216.2 343.1 119.8 83.9 67.4 225.3 37.0 94.1 101.1 161.0
Q4 200.9 302.0 104.3 108.9 80.0 124.4 68.3 96.6 181.1 336.2
2016
Q1 217.4 212.9 98.3 109.5 66.7 294.0 68.6 100.5 122.4 193.5
Q2 296.6 458.2 140.2 85.9 154.5 217.3 80.5 159.9 173.6 235.8
Q3 217.7 353.1 146.5 61.4 67.4 212.0 38.3 97.9 110.8 167.8
Q4 203.2 314.4 112.1 126.6 77.9 121.7 76.4 94.1 202.7 334.9
2017
Q1 219.5 228.1 105.5 100.8 66.5 285.6 75.6 105.7 120.6 192.8
Q2 311.7 471.7 140.8 87.0 149.6 227.7 74.0 163.1 152.4 233.6
Q3 220.0 357.1 158.0 60.8 68.6 192.1 35.5 100.7 133.0 176.0
Q4 207.6 313.6 118.8 126.0 81.2 106.4 83.1 96.5 239.8 348.2
FOOTWEAR &
WEARING
APPAREL
WOOD & WOOD
PRODUCTS
FURNITURE &
FIXTURES
PAPER & PAPER
PRODUCTS
PUBLISHING &
PRINTING
YEAR/
QUARTER TOTAL FOOD BEVERAGE TOBACCO TEXTILE
Source: PHILIPPINE STATISTICS AUTHORITY 21
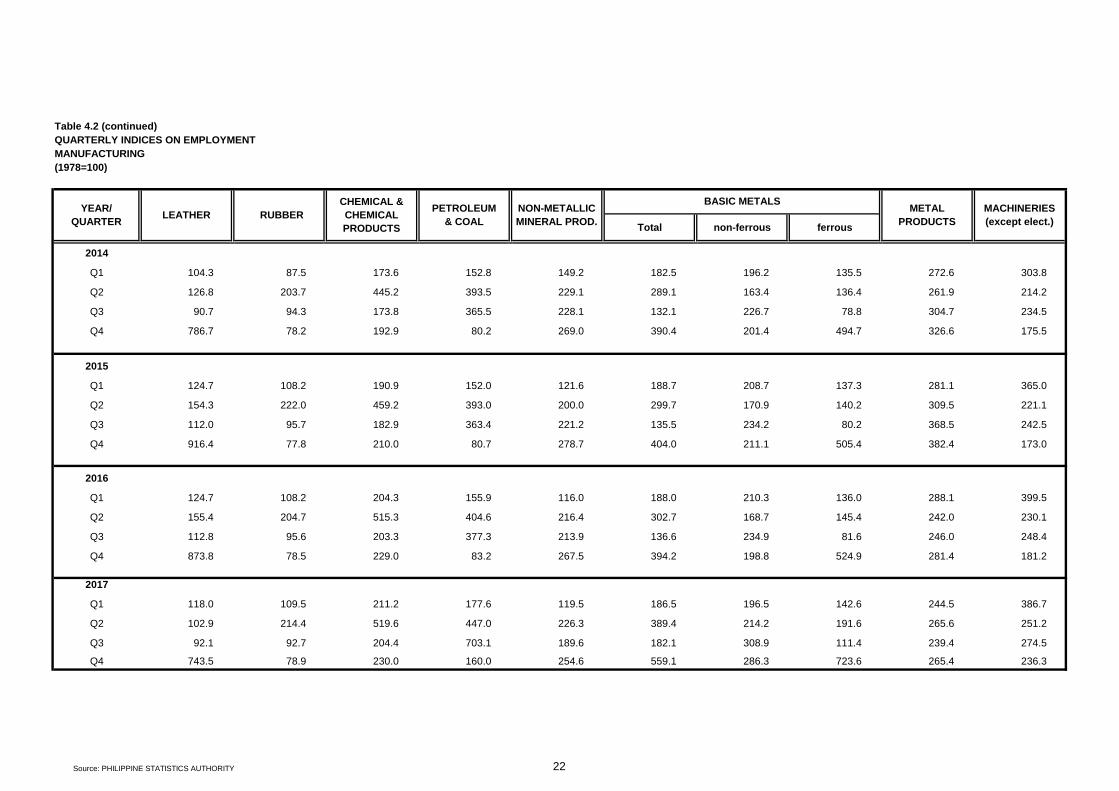
Table 4.2 (continued)
QUARTERLY INDICES ON EMPLOYMENT
MANUFACTURING
(1978=100)
2014
Q1 104.3 87.5 173.6 152.8 149.2 182.5 196.2 135.5 272.6 303.8
Q2 126.8 203.7 445.2 393.5 229.1 289.1 163.4 136.4 261.9 214.2
Q3 90.7 94.3 173.8 365.5 228.1 132.1 226.7 78.8 304.7 234.5
Q4 786.7 78.2 192.9 80.2 269.0 390.4 201.4 494.7 326.6 175.5
2015
Q1 124.7 108.2 190.9 152.0 121.6 188.7 208.7 137.3 281.1 365.0
Q2 154.3 222.0 459.2 393.0 200.0 299.7 170.9 140.2 309.5 221.1
Q3 112.0 95.7 182.9 363.4 221.2 135.5 234.2 80.2 368.5 242.5
Q4 916.4 77.8 210.0 80.7 278.7 404.0 211.1 505.4 382.4 173.0
2016
Q1 124.7 108.2 204.3 155.9 116.0 188.0 210.3 136.0 288.1 399.5
Q2 155.4 204.7 515.3 404.6 216.4 302.7 168.7 145.4 242.0 230.1
Q3 112.8 95.6 203.3 377.3 213.9 136.6 234.9 81.6 246.0 248.4
Q4 873.8 78.5 229.0 83.2 267.5 394.2 198.8 524.9 281.4 181.2
2017
Q1 118.0 109.5 211.2 177.6 119.5 186.5 196.5 142.6 244.5 386.7
Q2 102.9 214.4 519.6 447.0 226.3 389.4 214.2 191.6 265.6 251.2
Q3 92.1 92.7 204.4 703.1 189.6 182.1 308.9 111.4 239.4 274.5
Q4 743.5 78.9 230.0 160.0 254.6 559.1 286.3 723.6 265.4 236.3
YEAR/
QUARTERLEATHER RUBBER
CHEMICAL &
CHEMICAL
PRODUCTS
PETROLEUM
& COAL
NON-METALLIC
MINERAL PROD.
BASIC METALS
Total non-ferrous ferrous
METAL
PRODUCTS
MACHINERIES
(except elect.)
Source: PHILIPPINE STATISTICS AUTHORITY 22

Table 4.2 (continued)
QUARTERLY INDICES ON EMPLOYMENT
MANUFACTURING
(1978=100)
2014
Q1 430.4 472.4 245.9 193.0 546.6 354.3 609.7 154.4
Q2 417.0 435.8 187.4 103.7 142.7 305.9 724.9 202.2
Q3 453.1 435.1 206.3 218.3 134.3 254.2 415.6 115.2
Q4 390.7 402.5 181.4 203.8 268.2 595.9 385.1 105.5
2015
Q1 514.8 560.6 322.3 193.0 693.4 470.0 706.4 108.2
Q2 447.4 471.9 238.4 111.3 267.4 312.5 1,026.4 167.2
Q3 471.8 456.6 170.9 228.9 177.7 252.8 441.5 93.4
Q4 386.8 386.1 126.5 189.6 269.7 610.9 473.5 93.6
2016
Q1 491.0 534.4 415.1 217.2 634.2 632.3 697.7 103.6
Q2 422.8 451.4 348.7 133.1 236.9 461.1 1,202.7 153.9
Q3 487.2 443.4 250.7 245.5 155.7 394.6 539.1 91.1
Q4 395.5 380.2 163.8 220.3 235.7 822.2 501.9 90.1
2017
Q1 498.6 545.2 410.0 206.7 570.2 619.2 728.0 104.3
Q2 438.3 471.2 322.0 133.1 223.7 458.9 1,478.7 159.5
Q3 505.8 472.4 224.2 251.2 119.5 319.7 635.2 100.4
Q4 411.3 403.8 138.8 208.6 183.0 720.2 578.8 90.8
YEAR/
QUARTER
ELECTRICAL MACHINERIES TRANSPORT
EQUIPMENTMISCELLANEOUS
Total micro-circuits appliances batteries lamps wires
Source: PHILIPPINE STATISTICS AUTHORITY 23
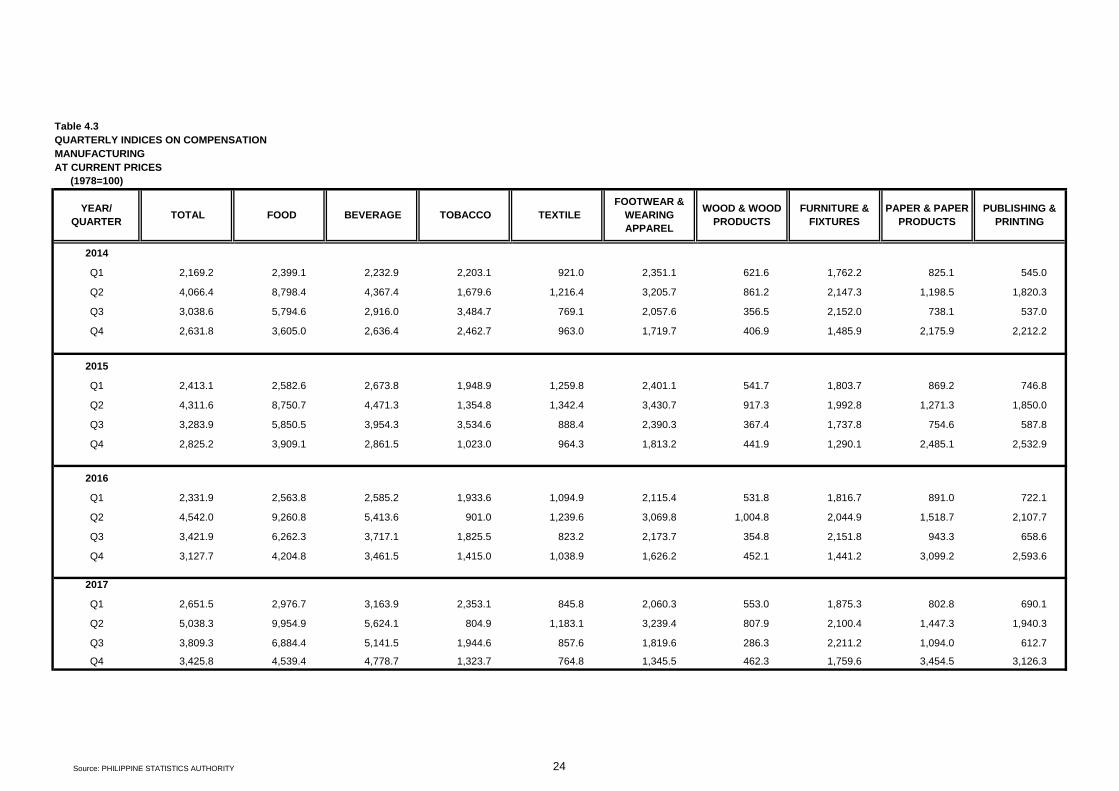
Table 4.3
QUARTERLY INDICES ON COMPENSATION
MANUFACTURING
AT CURRENT PRICES
(1978=100)
2014
Q1 2,169.2 2,399.1 2,232.9 2,203.1 921.0 2,351.1 621.6 1,762.2 825.1 545.0
Q2 4,066.4 8,798.4 4,367.4 1,679.6 1,216.4 3,205.7 861.2 2,147.3 1,198.5 1,820.3
Q3 3,038.6 5,794.6 2,916.0 3,484.7 769.1 2,057.6 356.5 2,152.0 738.1 537.0
Q4 2,631.8 3,605.0 2,636.4 2,462.7 963.0 1,719.7 406.9 1,485.9 2,175.9 2,212.2
2015
Q1 2,413.1 2,582.6 2,673.8 1,948.9 1,259.8 2,401.1 541.7 1,803.7 869.2 746.8
Q2 4,311.6 8,750.7 4,471.3 1,354.8 1,342.4 3,430.7 917.3 1,992.8 1,271.3 1,850.0
Q3 3,283.9 5,850.5 3,954.3 3,534.6 888.4 2,390.3 367.4 1,737.8 754.6 587.8
Q4 2,825.2 3,909.1 2,861.5 1,023.0 964.3 1,813.2 441.9 1,290.1 2,485.1 2,532.9
2016
Q1 2,331.9 2,563.8 2,585.2 1,933.6 1,094.9 2,115.4 531.8 1,816.7 891.0 722.1
Q2 4,542.0 9,260.8 5,413.6 901.0 1,239.6 3,069.8 1,004.8 2,044.9 1,518.7 2,107.7
Q3 3,421.9 6,262.3 3,717.1 1,825.5 823.2 2,173.7 354.8 2,151.8 943.3 658.6
Q4 3,127.7 4,204.8 3,461.5 1,415.0 1,038.9 1,626.2 452.1 1,441.2 3,099.2 2,593.6
2017
Q1 2,651.5 2,976.7 3,163.9 2,353.1 845.8 2,060.3 553.0 1,875.3 802.8 690.1
Q2 5,038.3 9,954.9 5,624.1 804.9 1,183.1 3,239.4 807.9 2,100.4 1,447.3 1,940.3
Q3 3,809.3 6,884.4 5,141.5 1,944.6 857.6 1,819.6 286.3 2,211.2 1,094.0 612.7
Q4 3,425.8 4,539.4 4,778.7 1,323.7 764.8 1,345.5 462.3 1,759.6 3,454.5 3,126.3
YEAR/
QUARTER TOTAL FOOD BEVERAGE TOBACCO TEXTILE
FOOTWEAR &
WEARING
APPAREL
WOOD & WOOD
PRODUCTS
FURNITURE &
FIXTURES
PAPER & PAPER
PRODUCTS
PUBLISHING &
PRINTING
Source: PHILIPPINE STATISTICS AUTHORITY 24
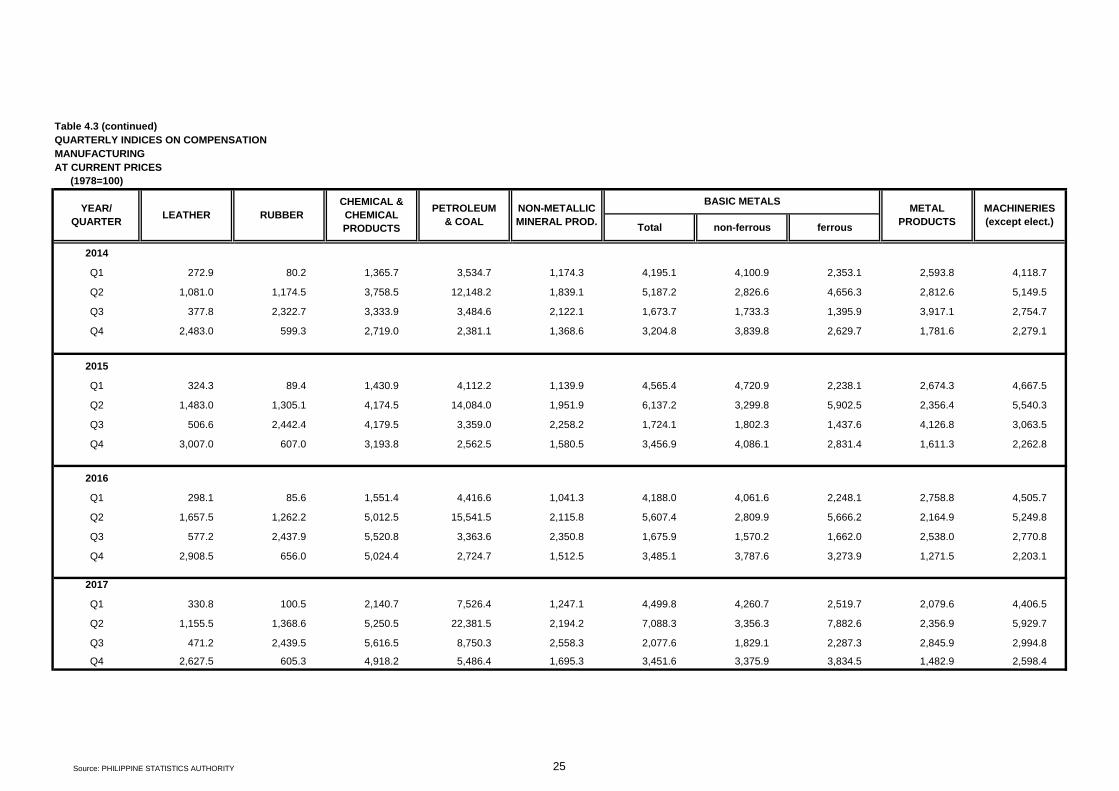
Table 4.3 (continued)
QUARTERLY INDICES ON COMPENSATION
MANUFACTURING
AT CURRENT PRICES
(1978=100)
2014
Q1 272.9 80.2 1,365.7 3,534.7 1,174.3 4,195.1 4,100.9 2,353.1 2,593.8 4,118.7
Q2 1,081.0 1,174.5 3,758.5 12,148.2 1,839.1 5,187.2 2,826.6 4,656.3 2,812.6 5,149.5
Q3 377.8 2,322.7 3,333.9 3,484.6 2,122.1 1,673.7 1,733.3 1,395.9 3,917.1 2,754.7
Q4 2,483.0 599.3 2,719.0 2,381.1 1,368.6 3,204.8 3,839.8 2,629.7 1,781.6 2,279.1
2015
Q1 324.3 89.4 1,430.9 4,112.2 1,139.9 4,565.4 4,720.9 2,238.1 2,674.3 4,667.5
Q2 1,483.0 1,305.1 4,174.5 14,084.0 1,951.9 6,137.2 3,299.8 5,902.5 2,356.4 5,540.3
Q3 506.6 2,442.4 4,179.5 3,359.0 2,258.2 1,724.1 1,802.3 1,437.6 4,126.8 3,063.5
Q4 3,007.0 607.0 3,193.8 2,562.5 1,580.5 3,456.9 4,086.1 2,831.4 1,611.3 2,262.8
2016
Q1 298.1 85.6 1,551.4 4,416.6 1,041.3 4,188.0 4,061.6 2,248.1 2,758.8 4,505.7
Q2 1,657.5 1,262.2 5,012.5 15,541.5 2,115.8 5,607.4 2,809.9 5,666.2 2,164.9 5,249.8
Q3 577.2 2,437.9 5,520.8 3,363.6 2,350.8 1,675.9 1,570.2 1,662.0 2,538.0 2,770.8
Q4 2,908.5 656.0 5,024.4 2,724.7 1,512.5 3,485.1 3,787.6 3,273.9 1,271.5 2,203.1
2017
Q1 330.8 100.5 2,140.7 7,526.4 1,247.1 4,499.8 4,260.7 2,519.7 2,079.6 4,406.5
Q2 1,155.5 1,368.6 5,250.5 22,381.5 2,194.2 7,088.3 3,356.3 7,882.6 2,356.9 5,929.7
Q3 471.2 2,439.5 5,616.5 8,750.3 2,558.3 2,077.6 1,829.1 2,287.3 2,845.9 2,994.8
Q4 2,627.5 605.3 4,918.2 5,486.4 1,695.3 3,451.6 3,375.9 3,834.5 1,482.9 2,598.4
LEATHER RUBBER
CHEMICAL &
CHEMICAL
PRODUCTS
PETROLEUM
& COAL
NON-METALLIC
MINERAL PROD.
BASIC METALSYEAR/
QUARTERTotal non-ferrous ferrous
METAL
PRODUCTS
MACHINERIES
(except elect.)
Source: PHILIPPINE STATISTICS AUTHORITY 25

Table 4.3 (continued)
QUARTERLY INDICES ON COMPENSATION
MANUFACTURING
AT CURRENT PRICES
(1978=100)
2014
Q1 5,357.9 6,328.1 8,495.8 2,038.4 2,966.2 2,978.9 3,485.7 1,919.8
Q2 5,069.9 7,096.7 2,894.5 1,490.2 5,729.2 1,253.0 2,942.5 2,808.8
Q3 7,112.6 8,764.2 2,887.8 3,869.4 1,791.6 4,108.3 2,628.9 1,563.4
Q4 8,962.9 9,732.5 1,374.9 5,219.2 4,216.0 11,162.6 3,061.6 1,477.9
2015
Q1 6,711.9 7,638.6 11,594.3 2,038.4 4,038.3 3,728.0 3,880.1 1,649.2
Q2 5,882.6 8,315.9 1,951.5 1,729.0 8,971.5 1,427.4 3,838.6 2,451.5
Q3 6,990.6 8,739.4 1,310.6 3,563.0 2,310.2 3,873.1 3,393.7 1,317.1
Q4 9,199.9 10,206.0 702.2 4,539.0 4,350.1 9,907.0 4,388.6 1,312.5
2016
Q1 6,531.7 7,431.3 16,094.1 2,378.8 3,882.9 5,015.6 3,625.1 1,675.0
Q2 6,027.4 8,592.4 2,860.3 2,046.4 8,851.4 1,782.3 4,576.1 2,451.6
Q3 7,557.1 9,080.3 2,199.8 4,327.7 2,281.7 5,318.0 4,002.8 1,388.6
Q4 9,518.1 9,798.2 1,298.6 5,603.0 4,284.3 15,867.7 4,736.2 1,323.9
2017
Q1 7,686.8 8,609.3 19,199.8 2,407.3 4,230.5 6,849.8 4,434.4 1,753.1
Q2 7,196.9 10,144.2 3,049.6 2,107.1 9,404.1 2,436.3 5,333.7 2,592.1
Q3 8,617.8 10,314.7 2,857.2 4,412.5 1,731.0 6,222.7 3,827.4 1,628.0
Q4 11,216.5 11,747.8 1,033.6 2,637.6 3,585.2 17,307.3 4,982.1 1,568.0
YEAR/
QUARTER
ELECTRICAL MACHINERIES TRANSPORT
EQUIPMENTMISCELLANEOUS
micro-circuits appliances batteries lamps wiresTotal
Source: PHILIPPINE STATISTICS AUTHORITY 26

Table 4.3.1
QUARTERLY INDICES ON COMPENSATION PER EMPLOYEE
MANUFACTURING
AT CURRENT PRICES
(1978=100)
2014
Q1 1,026.3 1,022.6 3,146.0 2,391.2 1,176.4 816.6 764.0 1,708.5 787.8 317.1
Q2 1,425.9 1,882.8 4,433.0 1,041.6 712.7 1,400.8 1,055.5 1,387.1 655.0 839.1
Q3 1,456.0 1,729.3 2,936.1 3,814.9 1,161.1 942.9 906.5 2,208.0 744.5 340.1
Q4 1,367.1 1,251.5 2,965.3 1,197.7 1,266.8 1,436.3 590.9 1,503.6 1,219.5 702.7
2015
Q1 1,100.6 1,209.8 2,800.1 1,780.1 1,519.2 817.2 775.6 1,814.9 778.3 384.1
Q2 1,468.8 1,969.0 3,372.9 1,093.6 728.1 1,517.4 1,263.5 1,253.6 655.9 901.8
Q3 1,519.3 1,704.9 3,300.9 4,212.3 1,318.4 1,061.2 992.2 1,846.6 746.4 365.0
Q4 1,406.1 1,294.6 2,742.6 939.1 1,204.9 1,458.1 646.7 1,336.2 1,372.1 753.4
2016
Q1 1,072.6 1,204.0 2,630.6 1,766.1 1,641.4 719.4 775.6 1,808.5 727.8 373.3
Q2 1,531.4 2,021.1 3,861.2 1,049.0 802.1 1,412.5 1,247.6 1,278.7 875.1 893.9
Q3 1,571.9 1,773.4 2,538.1 2,975.2 1,222.0 1,025.3 925.8 2,197.2 851.7 392.4
Q4 1,538.9 1,337.4 3,088.2 1,117.5 1,333.4 1,336.3 591.7 1,531.5 1,528.7 774.5
2017
Q1 1,208.1 1,304.9 3,000.0 2,334.8 1,272.3 721.4 731.9 1,774.6 665.6 358.0
Q2 1,616.2 2,110.5 3,994.8 925.6 791.0 1,422.5 1,092.2 1,288.1 949.8 830.4
Q3 1,731.2 1,927.8 3,255.1 3,195.9 1,249.5 947.2 807.5 2,195.2 822.8 348.2
Q4 1,650.1 1,447.5 4,022.9 1,050.6 941.9 1,264.5 556.0 1,823.4 1,440.8 897.7
YEAR/
QUARTER TOTAL FOOD BEVERAGE TOBACCO TEXTILE
FOOTWEAR &
WEARING
APPAREL
WOOD & WOOD
PRODUCTS
FURNITURE &
FIXTURES
PAPER & PAPER
PRODUCTS
PUBLISHING &
PRINTING
Source: PHILIPPINE STATISTICS AUTHORITY 27

Table 4.3.1 (continued)
QUARTERLY INDICES ON COMPENSATION PER EMPLOYEE
MANUFACTURING
AT CURRENT PRICES
(1978=100)
2014
Q1 261.6 91.6 786.5 2,313.7 787.0 2,299.1 2,090.2 1,737.0 951.7 1,355.8
Q2 852.6 576.5 844.3 3,087.6 802.6 1,794.4 1,729.5 3,413.0 1,074.1 2,403.8
Q3 416.6 2,463.6 1,917.9 953.3 930.1 1,266.8 764.7 1,770.4 1,285.5 1,174.8
Q4 315.6 766.3 1,409.2 2,968.6 508.9 821.0 1,906.6 531.6 545.4 1,298.3
2015
Q1 260.1 82.6 749.8 2,704.5 937.8 2,419.0 2,261.7 1,629.6 951.5 1,278.7
Q2 961.1 588.0 909.1 3,583.8 976.1 2,047.7 1,930.7 4,209.2 761.3 2,505.9
Q3 452.2 2,551.5 2,285.6 924.3 1,021.0 1,272.2 769.5 1,792.4 1,119.8 1,263.1
Q4 328.1 780.1 1,520.7 3,175.3 567.0 855.8 1,935.2 560.2 421.4 1,307.7
2016
Q1 239.0 79.1 759.5 2,832.7 898.0 2,227.1 1,931.3 1,652.9 957.7 1,127.9
Q2 1,066.5 616.6 972.7 3,840.8 977.7 1,852.6 1,665.6 3,895.8 894.7 2,281.7
Q3 511.8 2,549.4 2,715.8 891.6 1,098.9 1,226.9 668.5 2,036.9 1,031.8 1,115.4
Q4 332.9 835.8 2,194.2 3,275.9 565.4 884.1 1,905.5 623.7 451.8 1,215.9
2017
Q1 280.4 91.8 1,013.6 4,237.7 1,043.4 2,413.3 2,168.3 1,766.5 850.4 1,139.4
Q2 1,123.3 638.4 1,010.4 5,006.8 969.5 1,820.2 1,566.8 4,114.5 887.3 2,360.4
Q3 511.7 2,632.8 2,748.2 1,244.5 1,349.7 1,140.9 592.1 2,052.7 1,188.5 1,090.8
Q4 353.4 766.9 2,138.6 3,428.3 665.8 617.4 1,179.3 529.9 558.8 1,099.4
LEATHER RUBBER
CHEMICAL &
CHEMICAL
PRODUCTS
PETROLEUM
& COAL
NON-METALLIC
MINERAL PROD.
BASIC METALSYEAR/
QUARTERTotal non-ferrous ferrous
METAL
PRODUCTS
MACHINERIES
(except elect.)
Source: PHILIPPINE STATISTICS AUTHORITY 28
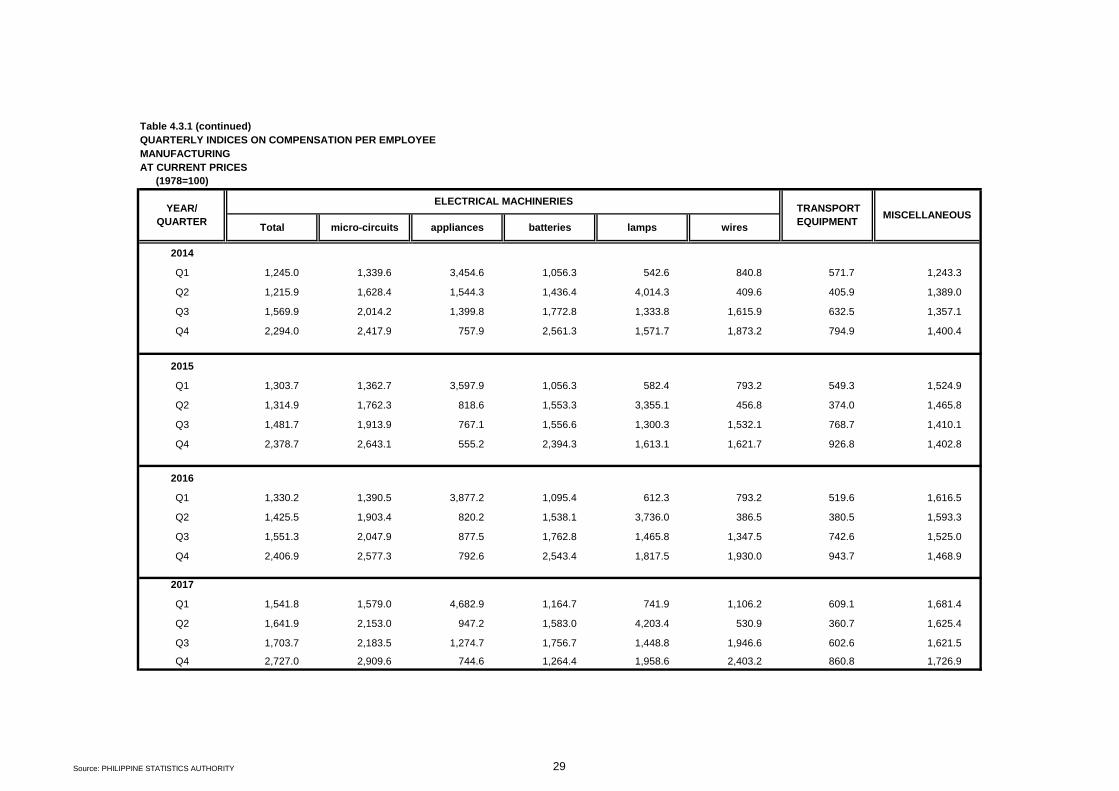
Table 4.3.1 (continued)
QUARTERLY INDICES ON COMPENSATION PER EMPLOYEE
MANUFACTURING
AT CURRENT PRICES
(1978=100)
2014
Q1 1,245.0 1,339.6 3,454.6 1,056.3 542.6 840.8 571.7 1,243.3
Q2 1,215.9 1,628.4 1,544.3 1,436.4 4,014.3 409.6 405.9 1,389.0
Q3 1,569.9 2,014.2 1,399.8 1,772.8 1,333.8 1,615.9 632.5 1,357.1
Q4 2,294.0 2,417.9 757.9 2,561.3 1,571.7 1,873.2 794.9 1,400.4
2015
Q1 1,303.7 1,362.7 3,597.9 1,056.3 582.4 793.2 549.3 1,524.9
Q2 1,314.9 1,762.3 818.6 1,553.3 3,355.1 456.8 374.0 1,465.8
Q3 1,481.7 1,913.9 767.1 1,556.6 1,300.3 1,532.1 768.7 1,410.1
Q4 2,378.7 2,643.1 555.2 2,394.3 1,613.1 1,621.7 926.8 1,402.8
2016
Q1 1,330.2 1,390.5 3,877.2 1,095.4 612.3 793.2 519.6 1,616.5
Q2 1,425.5 1,903.4 820.2 1,538.1 3,736.0 386.5 380.5 1,593.3
Q3 1,551.3 2,047.9 877.5 1,762.8 1,465.8 1,347.5 742.6 1,525.0
Q4 2,406.9 2,577.3 792.6 2,543.4 1,817.5 1,930.0 943.7 1,468.9
2017
Q1 1,541.8 1,579.0 4,682.9 1,164.7 741.9 1,106.2 609.1 1,681.4
Q2 1,641.9 2,153.0 947.2 1,583.0 4,203.4 530.9 360.7 1,625.4
Q3 1,703.7 2,183.5 1,274.7 1,756.7 1,448.8 1,946.6 602.6 1,621.5
Q4 2,727.0 2,909.6 744.6 1,264.4 1,958.6 2,403.2 860.8 1,726.9
YEAR/
QUARTER
ELECTRICAL MACHINERIES TRANSPORT
EQUIPMENTMISCELLANEOUS
appliances batteries lamps wiresTotal micro-circuits
Source: PHILIPPINE STATISTICS AUTHORITY 29

Table 4.3.2
QUARTERLY INDICES ON COMPENSATION PER EMPLOYEE
MANUFACTURING
AT CONSTANT PRICES
(1978=100)
2014
Q1 47.1 46.9 144.3 109.7 54.0 37.5 35.1 78.4 36.1 14.6
Q2 65.0 85.8 202.1 47.5 32.5 63.9 48.1 63.2 29.9 38.3
Q3 65.3 77.6 131.7 171.2 52.1 42.3 40.7 99.1 33.4 15.3
Q4 62.0 56.8 134.5 54.3 57.5 65.2 26.8 68.2 55.3 31.9
2015
Q1 49.3 54.2 125.4 79.7 68.0 36.6 34.7 81.3 34.9 17.2
Q2 65.9 88.3 151.3 49.0 32.7 68.1 56.7 56.2 29.4 40.4
Q3 67.8 76.0 147.2 187.9 58.8 47.3 44.3 82.4 33.3 16.3
Q4 63.2 58.2 123.2 42.2 54.1 65.5 29.1 60.0 61.6 33.8
2016
Q1 47.5 53.3 116.5 78.2 72.7 31.9 34.4 80.1 32.2 16.5
Q2 67.6 89.3 170.6 46.3 35.4 62.4 55.1 56.5 38.7 39.5
Q3 68.7 77.6 111.0 130.1 53.4 44.8 40.5 96.1 37.2 17.2
Q4 67.5 58.6 135.4 49.0 58.5 58.6 25.9 67.1 67.0 34.0
2017
Q1 51.9 56.0 128.8 100.3 54.6 31.0 31.4 76.2 28.6 15.4
Q2 69.2 90.4 171.2 39.7 33.9 60.9 46.8 55.2 40.7 35.6
Q3 73.4 81.8 138.0 135.5 53.0 40.2 34.2 93.1 34.9 14.8
Q4 70.0 61.4 170.7 44.6 40.0 53.7 23.6 77.4 61.1 38.1
PAPER & PAPER
PRODUCTS
PUBLISHING &
PRINTING
YEAR/
QUARTER TOTAL FOOD BEVERAGE TOBACCO TEXTILE
FOOTWEAR &
WEARING
APPAREL
WOOD & WOOD
PRODUCTS
FURNITURE &
FIXTURES
Source: PHILIPPINE STATISTICS AUTHORITY 30
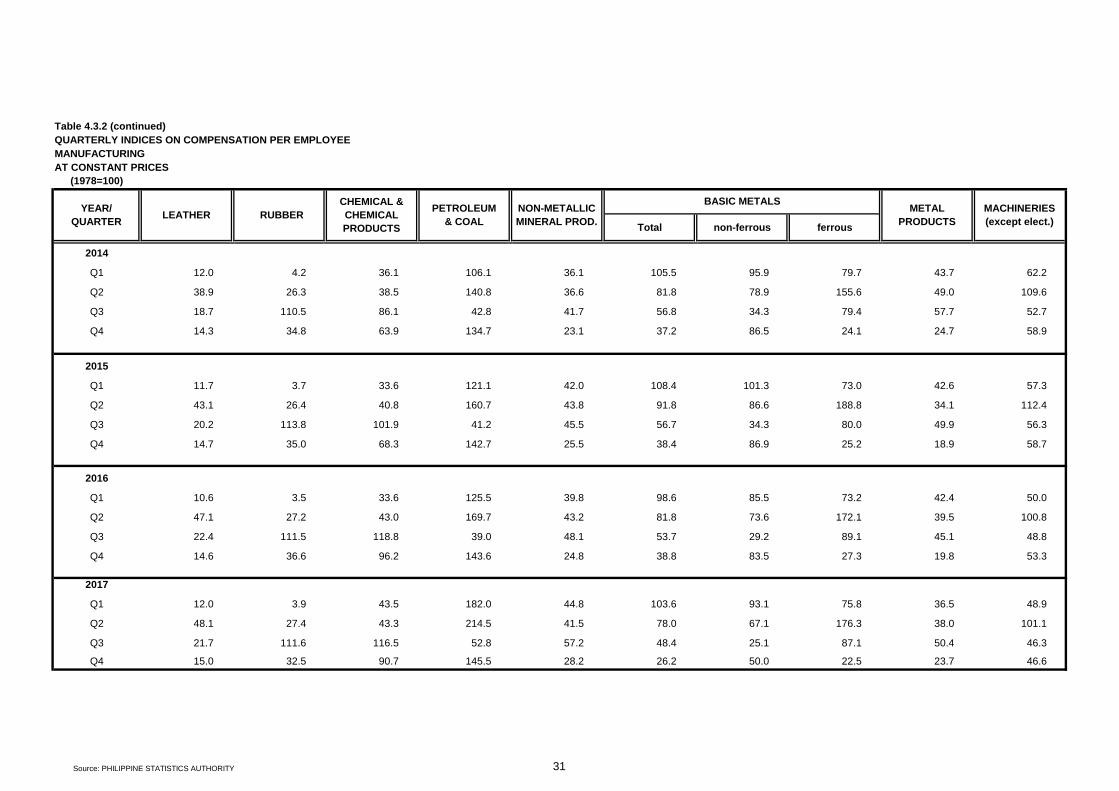
Table 4.3.2 (continued)
QUARTERLY INDICES ON COMPENSATION PER EMPLOYEE
MANUFACTURING
AT CONSTANT PRICES
(1978=100)
2014
Q1 12.0 4.2 36.1 106.1 36.1 105.5 95.9 79.7 43.7 62.2
Q2 38.9 26.3 38.5 140.8 36.6 81.8 78.9 155.6 49.0 109.6
Q3 18.7 110.5 86.1 42.8 41.7 56.8 34.3 79.4 57.7 52.7
Q4 14.3 34.8 63.9 134.7 23.1 37.2 86.5 24.1 24.7 58.9
2015
Q1 11.7 3.7 33.6 121.1 42.0 108.4 101.3 73.0 42.6 57.3
Q2 43.1 26.4 40.8 160.7 43.8 91.8 86.6 188.8 34.1 112.4
Q3 20.2 113.8 101.9 41.2 45.5 56.7 34.3 80.0 49.9 56.3
Q4 14.7 35.0 68.3 142.7 25.5 38.4 86.9 25.2 18.9 58.7
2016
Q1 10.6 3.5 33.6 125.5 39.8 98.6 85.5 73.2 42.4 50.0
Q2 47.1 27.2 43.0 169.7 43.2 81.8 73.6 172.1 39.5 100.8
Q3 22.4 111.5 118.8 39.0 48.1 53.7 29.2 89.1 45.1 48.8
Q4 14.6 36.6 96.2 143.6 24.8 38.8 83.5 27.3 19.8 53.3
2017
Q1 12.0 3.9 43.5 182.0 44.8 103.6 93.1 75.8 36.5 48.9
Q2 48.1 27.4 43.3 214.5 41.5 78.0 67.1 176.3 38.0 101.1
Q3 21.7 111.6 116.5 52.8 57.2 48.4 25.1 87.1 50.4 46.3
Q4 15.0 32.5 90.7 145.5 28.2 26.2 50.0 22.5 23.7 46.6
YEAR/
QUARTERLEATHER RUBBER
CHEMICAL &
CHEMICAL
PRODUCTS
PETROLEUM
& COAL
NON-METALLIC
MINERAL PROD.
BASIC METALS
Total non-ferrous ferrous
METAL
PRODUCTS
MACHINERIES
(except elect.)
Source: PHILIPPINE STATISTICS AUTHORITY 31

Table 4.3.2 (continued)
QUARTERLY INDICES ON COMPENSATION PER EMPLOYEE
MANUFACTURING
AT CONSTANT PRICES
(1978=100)
2014
Q1 57.1 61.5 158.5 48.5 24.9 38.6 26.2 57.0
Q2 55.4 74.2 70.4 65.5 183.0 18.7 18.5 63.3
Q3 70.4 90.4 62.8 79.5 59.8 72.5 28.4 60.9
Q4 104.1 109.7 34.4 116.2 71.3 85.0 36.1 63.5
2015
Q1 58.4 61.0 161.2 47.3 26.1 35.5 24.6 68.3
Q2 59.0 79.0 36.7 69.7 150.5 20.5 16.8 65.7
Q3 66.1 85.4 34.2 69.4 58.0 68.3 34.3 62.9
Q4 106.9 118.7 24.9 107.6 72.5 72.9 41.6 63.0
2016
Q1 58.9 61.6 171.7 48.5 27.1 35.1 23.0 71.6
Q2 63.0 84.1 36.2 67.9 165.0 17.1 16.8 70.4
Q3 67.8 89.6 38.4 77.1 64.1 58.9 32.5 66.7
Q4 105.5 113.0 34.8 111.5 79.7 84.6 41.4 64.4
2017
Q1 66.2 67.8 201.1 50.0 31.9 47.5 26.2 72.2
Q2 70.4 92.2 40.6 67.8 180.1 22.7 15.5 69.6
Q3 72.3 92.6 54.1 74.5 61.4 82.6 25.6 68.8
Q4 115.7 123.4 31.6 53.6 83.1 102.0 36.5 73.3
TRANSPORT
EQUIPMENTMISCELLANEOUS
Total micro-circuits appliances batteries lamps wires
YEAR/
QUARTER
ELECTRICAL MACHINERIES
Source: PHILIPPINE STATISTICS AUTHORITY 32

CONSTRUCTION
33

Table 5.1
QUARTERLY INDICES ON COMPENSATION PER EMPLOYEE
CONSTRUCTION
AT CURRENT PRICES
(1978=100)
2014
Q1 2,820.0
Q2 3,037.9
Q3 2,689.9
Q4 2,706.0
2015
Q1 2,786.3
Q2 2,977.7
Q3 2,751.4
Q4 2,681.0
2016
Q1 2,779.8
Q2 3,123.5
Q3 2,788.9
Q4 2,737.6
2017
Q1 2,883.1
Q2 3,431.7
Q3 2,852.3
Q4 2,799.6
YEAR/
QUARTER CONSTRUCTION
Source: PHILIPPINE STATISTICS AUTHORITY 34

ELECTRICITY AND WATER
35
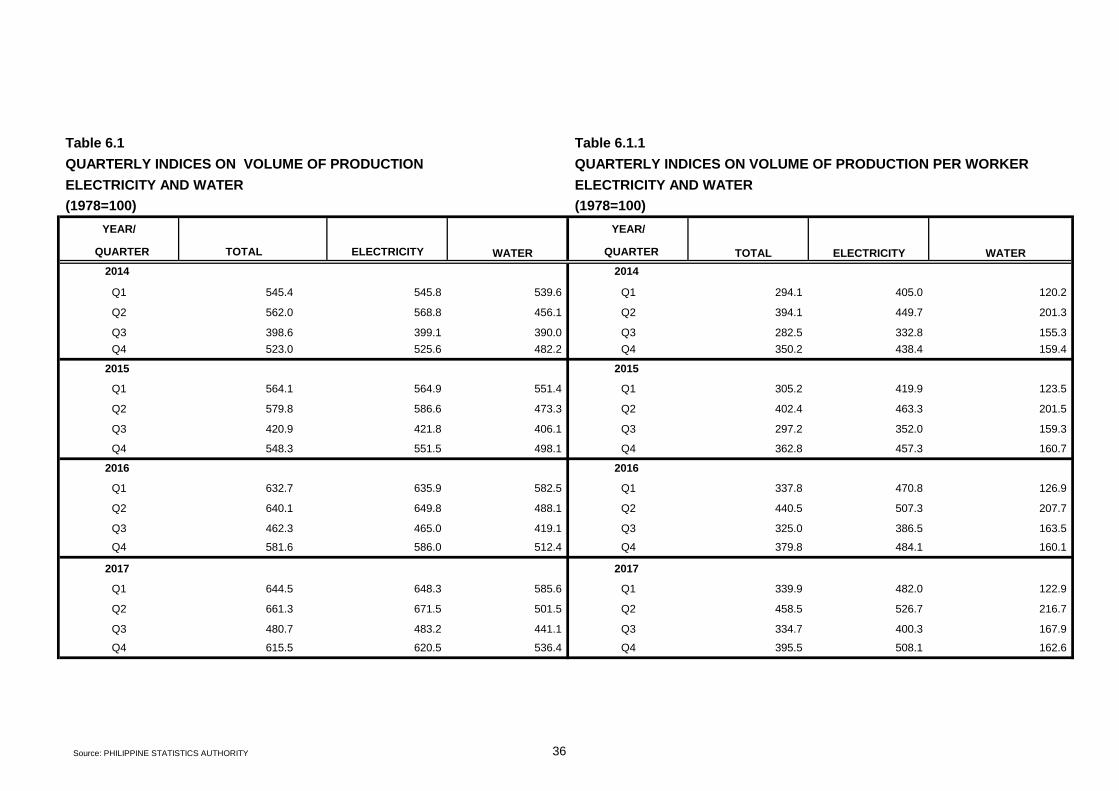
Table 6.1 Table 6.1.1
QUARTERLY INDICES ON VOLUME OF PRODUCTION QUARTERLY INDICES ON VOLUME OF PRODUCTION PER WORKER
ELECTRICITY AND WATER ELECTRICITY AND WATER
(1978=100) (1978=100)
YEAR/ YEAR/
QUARTER TOTAL ELECTRICITY QUARTER
2014 2014
Q1 545.4 545.8 539.6 Q1 294.1 405.0 120.2
Q2 562.0 568.8 456.1 Q2 394.1 449.7 201.3
Q3 398.6 399.1 390.0 Q3 282.5 332.8 155.3
Q4 523.0 525.6 482.2 Q4 350.2 438.4 159.4
2015 2015
Q1 564.1 564.9 551.4 Q1 305.2 419.9 123.5
Q2 579.8 586.6 473.3 Q2 402.4 463.3 201.5
Q3 420.9 421.8 406.1 Q3 297.2 352.0 159.3
Q4 548.3 551.5 498.1 Q4 362.8 457.3 160.7
2016 2016
Q1 632.7 635.9 582.5 Q1 337.8 470.8 126.9
Q2 640.1 649.8 488.1 Q2 440.5 507.3 207.7
Q3 462.3 465.0 419.1 Q3 325.0 386.5 163.5
Q4 581.6 586.0 512.4 Q4 379.8 484.1 160.1
2017 2017
Q1 644.5 648.3 585.6 Q1 339.9 482.0 122.9
Q2 661.3 671.5 501.5 Q2 458.5 526.7 216.7
Q3 480.7 483.2 441.1 Q3 334.7 400.3 167.9
Q4 615.5 620.5 536.4 Q4 395.5 508.1 162.6
WATER TOTAL ELECTRICITY WATER
Source: PHILIPPINE STATISTICS AUTHORITY 36
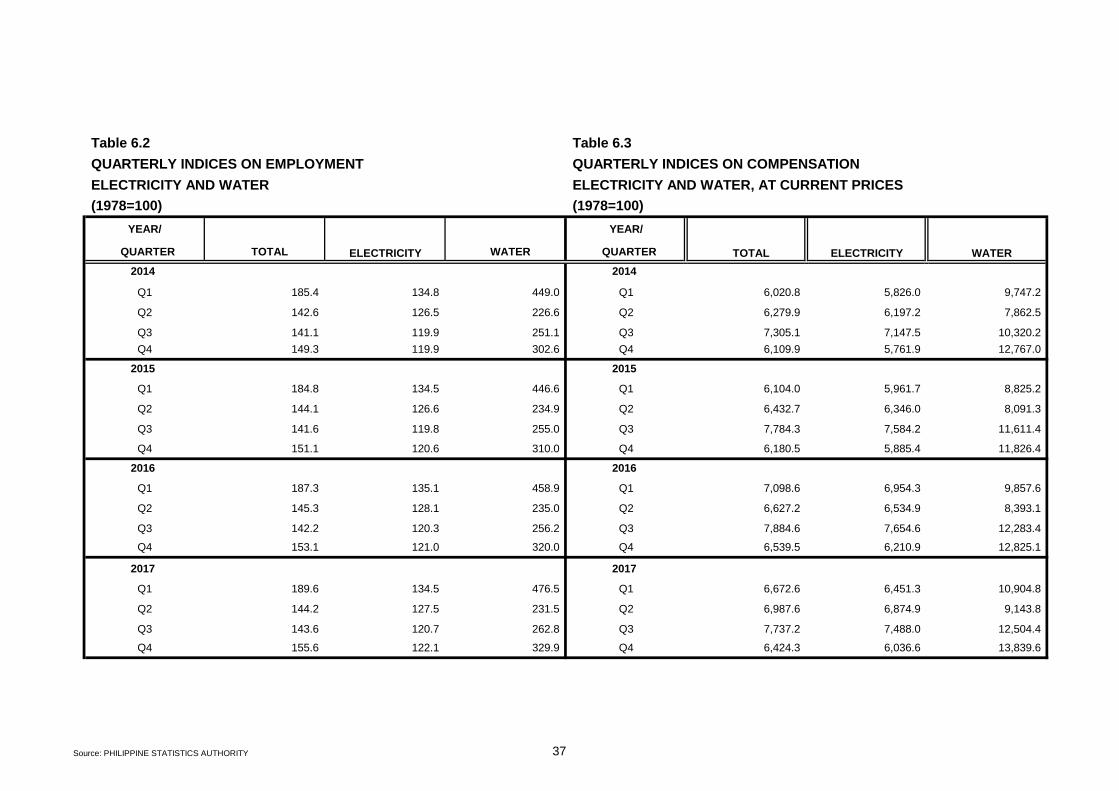
Table 6.2 Table 6.3
QUARTERLY INDICES ON EMPLOYMENT QUARTERLY INDICES ON COMPENSATION
ELECTRICITY AND WATER ELECTRICITY AND WATER, AT CURRENT PRICES
(1978=100) (1978=100)
YEAR/ YEAR/
QUARTER TOTAL WATER QUARTER
2014 2014
Q1 185.4 134.8 449.0 Q1 6,020.8 5,826.0 9,747.2
Q2 142.6 126.5 226.6 Q2 6,279.9 6,197.2 7,862.5
Q3 141.1 119.9 251.1 Q3 7,305.1 7,147.5 10,320.2
Q4 149.3 119.9 302.6 Q4 6,109.9 5,761.9 12,767.0
2015 2015
Q1 184.8 134.5 446.6 Q1 6,104.0 5,961.7 8,825.2
Q2 144.1 126.6 234.9 Q2 6,432.7 6,346.0 8,091.3
Q3 141.6 119.8 255.0 Q3 7,784.3 7,584.2 11,611.4
Q4 151.1 120.6 310.0 Q4 6,180.5 5,885.4 11,826.4
2016 2016
Q1 187.3 135.1 458.9 Q1 7,098.6 6,954.3 9,857.6
Q2 145.3 128.1 235.0 Q2 6,627.2 6,534.9 8,393.1
Q3 142.2 120.3 256.2 Q3 7,884.6 7,654.6 12,283.4
Q4 153.1 121.0 320.0 Q4 6,539.5 6,210.9 12,825.1
2017 2017
Q1 189.6 134.5 476.5 Q1 6,672.6 6,451.3 10,904.8
Q2 144.2 127.5 231.5 Q2 6,987.6 6,874.9 9,143.8
Q3 143.6 120.7 262.8 Q3 7,737.2 7,488.0 12,504.4
Q4 155.6 122.1 329.9 Q4 6,424.3 6,036.6 13,839.6
ELECTRICITY WATERELECTRICITY TOTAL
Source: PHILIPPINE STATISTICS AUTHORITY 37
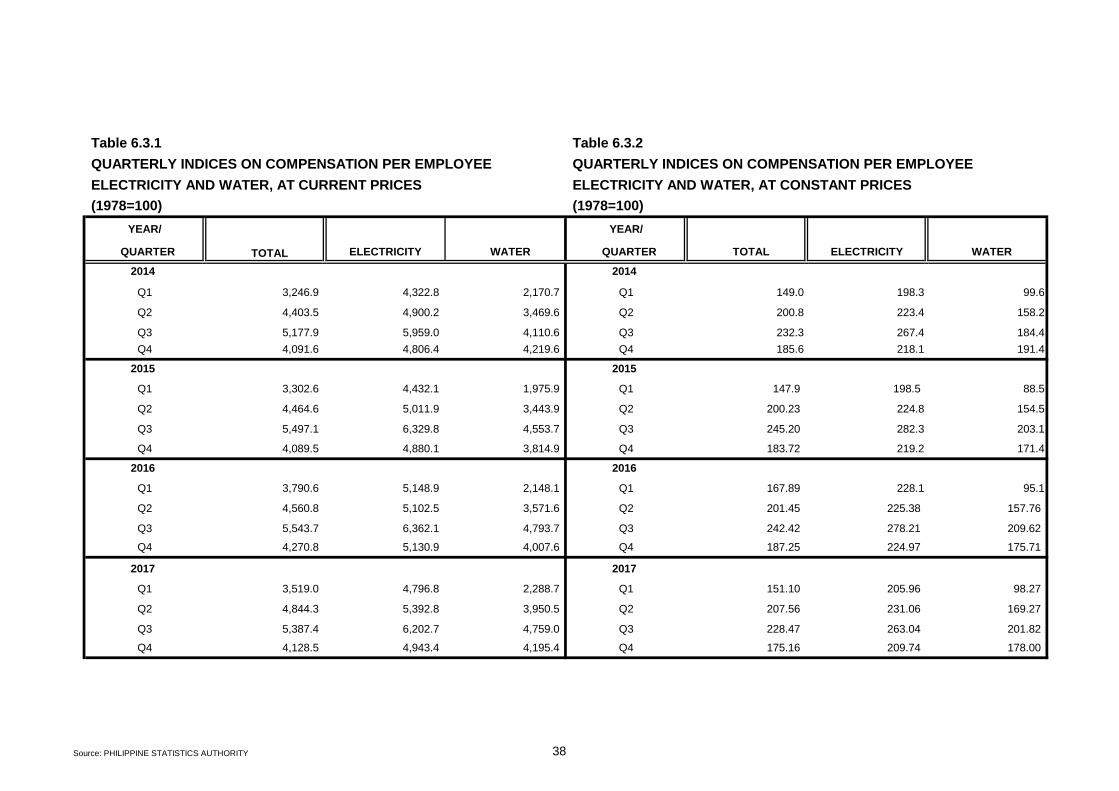
Table 6.3.1 Table 6.3.2
QUARTERLY INDICES ON COMPENSATION PER EMPLOYEE QUARTERLY INDICES ON COMPENSATION PER EMPLOYEE
ELECTRICITY AND WATER, AT CURRENT PRICES ELECTRICITY AND WATER, AT CONSTANT PRICES
(1978=100) (1978=100)
YEAR/ YEAR/
QUARTER ELECTRICITY WATER QUARTER TOTAL ELECTRICITY WATER
2014 2014
Q1 3,246.9 4,322.8 2,170.7 Q1 149.0 198.3 99.6
Q2 4,403.5 4,900.2 3,469.6 Q2 200.8 223.4 158.2
Q3 5,177.9 5,959.0 4,110.6 Q3 232.3 267.4 184.4
Q4 4,091.6 4,806.4 4,219.6 Q4 185.6 218.1 191.4
2015 2015
Q1 3,302.6 4,432.1 1,975.9 Q1 147.9 198.5 88.5
Q2 4,464.6 5,011.9 3,443.9 Q2 200.23 224.8 154.5
Q3 5,497.1 6,329.8 4,553.7 Q3 245.20 282.3 203.1
Q4 4,089.5 4,880.1 3,814.9 Q4 183.72 219.2 171.4
2016 2016
Q1 3,790.6 5,148.9 2,148.1 Q1 167.89 228.1 95.1
Q2 4,560.8 5,102.5 3,571.6 Q2 201.45 225.38 157.76
Q3 5,543.7 6,362.1 4,793.7 Q3 242.42 278.21 209.62
Q4 4,270.8 5,130.9 4,007.6 Q4 187.25 224.97 175.71
2017 2017
Q1 3,519.0 4,796.8 2,288.7 Q1 151.10 205.96 98.27
Q2 4,844.3 5,392.8 3,950.5 Q2 207.56 231.06 169.27
Q3 5,387.4 6,202.7 4,759.0 Q3 228.47 263.04 201.82
Q4 4,128.5 4,943.4 4,195.4 Q4 175.16 209.74 178.00
TOTAL
Source: PHILIPPINE STATISTICS AUTHORITY 38

TRADE, TRANSPORTATION
AND COMMUNICATION
39

Table 7.1
QUARTERLY INDICES ON GROSS REVENUE
TRADE, TRANSPORTATION AND COMMUNICATION
AT CURRENT PRICES
(1978=100)
Total Land Water Air
2014
Q1 17,247.0 9,400.3 24,650.0 7,744.0 7,599.8 1,070.8 16,906.4
Q2 18,450.8 10,831.2 25,255.3 9,264.6 8,662.7 1,655.8 21,198.9
Q3 19,066.2 10,342.6 25,842.5 8,659.2 8,335.6 1,489.0 19,077.2
Q4 20,126.8 10,202.1 26,189.2 8,465.8 8,192.4 1,345.3 18,648.3
2015
Q1 18,291.6 10,558.9 25,864.3 8,896.6 8,498.3 1,129.3 20,344.6
Q2 19,716.9 11,842.2 26,518.9 10,248.2 9,392.7 1,815.3 24,115.7
Q3 20,124.7 11,329.7 28,039.6 9,514.8 8,934.8 1,637.4 21,723.8
Q4 21,470.1 11,207.8 29,029.3 9,272.3 8,736.5 1,489.7 21,207.5
2016
Q1 19,898.5 11,550.0 27,199.7 9,850.3 8,968.1 1,175.9 24,121.9
Q2 21,492.9 12,823.6 28,073.6 11,167.4 10,023.6 1,906.6 27,090.7
Q3 21,496.3 12,145.6 28,420.7 10,378.0 9,516.8 1,844.8 24,394.9
Q4 23,449.7 12,195.4 30,430.5 10,215.0 9,492.2 1,571.0 23,905.1
2017
Q1 21,606.0 12,480.7 27,952.7 10,800.3 9,601.0 1,325.6 27,190.3
Q2 23,040.0 13,924.2 28,539.6 12,336.8 10,599.2 2,040.2 31,625.1
Q3 23,412.5 12,649.4 30,294.3 10,733.0 9,851.1 1,919.1 25,185.2
Q4 25,668.5 12,822.4 32,397.9 10,696.4 10,020.0 1,629.1 24,779.2
YEAR/
QUARTERTRADE
TRANSPORTATION
AND
COMMUNICATION
COMMUNICATION TRANSPORTATION
Source: PHILIPPINE STATISTICS AUTHORITY 40

Table 7.2
QUARTERLY INDICES ON EMPLOYMENT
TRADE, TRANSPORTATION AND COMMUNICATION
(1978=100)
Total Land Water Air
2014
Q1 139.5 96.0 160.4 87.1 94.2 30.4 108.1
Q2 141.1 97.3 160.8 88.5 95.8 30.1 110.3
Q3 141.3 95.4 163.5 86.0 92.5 32.7 111.9
Q4 145.1 95.6 165.5 85.9 92.3 33.1 113.7
2015
Q1 139.7 95.6 165.4 86.0 92.4 33.0 113.8
Q2 138.2 95.8 163.4 86.4 93.1 31.8 111.4
Q3 139.4 95.5 164.6 86.0 92.2 33.8 113.9
Q4 143.9 96.5 174.6 85.7 91.5 33.7 127.1
2016
Q1 141.2 97.4 168.3 87.7 94.0 33.4 122.7
Q2 140.8 98.6 168.3 89.0 95.5 33.1 124.8
Q3 141.8 101.8 167.8 92.7 99.4 35.2 127.2
Q4 147.3 102.6 171.4 93.1 99.9 35.3 130.7
2017
Q1 142.4 102.8 173.8 93.0 99.4 36.0 136.3
Q2 143.0 104.2 175.8 94.3 100.8 36.5 138.1
Q3 145.4 104.8 173.9 95.2 101.8 36.2 142.9
Q4 147.7 105.4 176.4 95.5 102.1 36.2 143.1
YEAR/
QUARTERTRADE
TRANSPORTATION
AND COMMUNICATIONCOMMUNICATION
TRANSPORTATION
Source: PHILIPPINE STATISTICS AUTHORITY 41
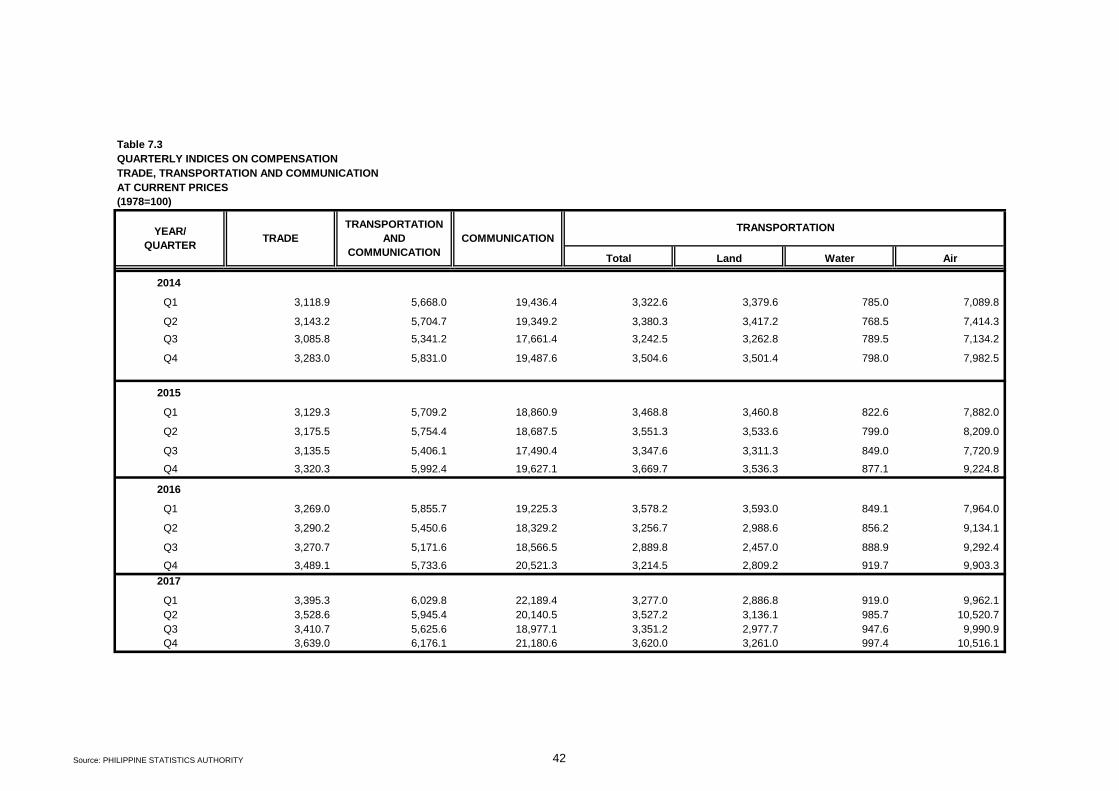
Table 7.3
QUARTERLY INDICES ON COMPENSATION
TRADE, TRANSPORTATION AND COMMUNICATION
AT CURRENT PRICES
(1978=100)
Total Land Water Air
2014
Q1 3,118.9 5,668.0 19,436.4 3,322.6 3,379.6 785.0 7,089.8
Q2 3,143.2 5,704.7 19,349.2 3,380.3 3,417.2 768.5 7,414.3
Q3 3,085.8 5,341.2 17,661.4 3,242.5 3,262.8 789.5 7,134.2
Q4 3,283.0 5,831.0 19,487.6 3,504.6 3,501.4 798.0 7,982.5
2015
Q1 3,129.3 5,709.2 18,860.9 3,468.8 3,460.8 822.6 7,882.0
Q2 3,175.5 5,754.4 18,687.5 3,551.3 3,533.6 799.0 8,209.0
Q3 3,135.5 5,406.1 17,490.4 3,347.6 3,311.3 849.0 7,720.9
Q4 3,320.3 5,992.4 19,627.1 3,669.7 3,536.3 877.1 9,224.8
2016
Q1 3,269.0 5,855.7 19,225.3 3,578.2 3,593.0 849.1 7,964.0
Q2 3,290.2 5,450.6 18,329.2 3,256.7 2,988.6 856.2 9,134.1
Q3 3,270.7 5,171.6 18,566.5 2,889.8 2,457.0 888.9 9,292.4
Q4 3,489.1 5,733.6 20,521.3 3,214.5 2,809.2 919.7 9,903.3
2017
Q1 3,395.3 6,029.8 22,189.4 3,277.0 2,886.8 919.0 9,962.1
Q2 3,528.6 5,945.4 20,140.5 3,527.2 3,136.1 985.7 10,520.7
Q3 3,410.7 5,625.6 18,977.1 3,351.2 2,977.7 947.6 9,990.9
Q4 3,639.0 6,176.1 21,180.6 3,620.0 3,261.0 997.4 10,516.1
YEAR/
QUARTERTRADE
TRANSPORTATION
AND
COMMUNICATION
COMMUNICATION TRANSPORTATION
Source: PHILIPPINE STATISTICS AUTHORITY 42

Table 7.3.1
QUARTERLY INDICES ON COMPENSATION PER EMPLOYEE
TRADE, TRANSPORTATION AND COMMUNICATION
AT CURRENT PRICES
(1978=100)
Total Land Water Air
2014
Q1 2,235.8 5,905.9 12,118.0 3,815.6 3,587.3 2,583.0 6,557.9
Q2 2,228.1 5,865.0 12,030.7 3,820.0 3,565.8 2,553.5 6,724.7
Q3 2,184.3 5,600.1 10,803.9 3,771.4 3,528.8 2,412.2 6,373.3
Q4 2,263.3 6,100.6 11,773.7 4,078.6 3,794.1 2,407.6 7,022.2
2015
Q1 2,240.7 5,969.7 11,402.5 4,033.3 3,745.8 2,493.7 6,924.5
Q2 2,296.9 6,008.5 11,438.3 4,108.4 3,793.5 2,511.0 7,365.9
Q3 2,250.0 5,659.7 10,623.4 3,893.5 3,589.5 2,513.4 6,777.7
Q4 2,307.8 6,210.3 11,243.5 4,281.4 3,865.2 2,601.6 7,257.1
2016
Q1 2,315.1 6,009.0 11,424.1 4,081.5 3,823.0 2,543.3 6,488.9
Q2 2,337.1 5,528.1 10,893.5 3,660.0 3,129.8 2,585.9 7,317.8
Q3 2,305.8 5,081.7 11,064.8 3,118.9 2,471.1 2,528.0 7,305.9
Q4 2,368.7 5,586.2 11,971.1 3,451.1 2,813.2 2,602.1 7,578.1
2017
Q1 2,385.1 5,867.3 12,770.2 3,524.8 2,904.9 2,553.5 7,311.4
Q2 2,466.8 5,706.9 11,455.2 3,740.9 3,111.8 2,697.3 7,616.7
Q3 2,345.6 5,369.1 10,909.8 3,519.1 2,925.8 2,620.1 6,993.7
Q4 2,464.4 5,862.3 12,005.4 3,789.0 3,193.2 2,753.7 7,350.4
TRANSPORTATION
AND
COMMUNICATION
YEAR/
QUARTERTRADE COMMUNICATION
TRANSPORTATION
Source: PHILIPPINE STATISTICS AUTHORITY 43

Table 7.3.2
QUARTERLY INDICES ON COMPENSATION PER EMPLOYEE
TRADE, TRANSPORTATION AND COMMUNICATION
AT CONSTANT PRICES
(1978=100)
Total Land Water Air
2014
Q1 102.6 271.0 556.0 175.1 164.6 118.5 300.9
Q2 101.6 267.4 548.5 174.2 162.6 116.4 306.6
Q3 98.0 251.3 484.8 169.2 158.3 108.2 286.0
Q4 102.7 276.8 534.2 185.1 172.1 109.2 318.6
2015
Q1 100.4 267.4 510.8 180.7 167.8 111.7 310.2
Q2 103.0 269.5 513.0 184.3 170.1 112.6 330.3
Q3 100.4 252.4 473.9 173.7 160.1 112.1 302.3
Q4 103.7 279.0 505.1 192.3 173.6 116.9 326.0
2016
Q1 102.5 266.1 506.0 180.8 169.3 112.6 287.4
Q2 103.2 244.2 481.2 161.7 138.2 114.2 323.2
Q3 100.8 222.2 483.9 136.4 108.1 110.5 319.5
Q4 103.9 244.9 524.9 151.3 123.3 114.1 332.3
2017
Q1 102.4 251.9 548.3 151.3 124.7 109.6 313.9
Q2 105.7 244.5 490.8 160.3 133.3 115.6 326.3
Q3 99.5 227.7 462.7 149.2 124.1 111.1 296.6
Q4 104.6 248.7 509.4 160.8 135.5 116.8 311.9
TRANSPORTATIONYEAR/
QUARTERTRADE
TRANSPORTATION
AND
COMMUNICATION
COMMUNICATION
Source: PHILIPPINE STATISTICS AUTHORITY 44

FINANCE
AND REAL ESTATE
45
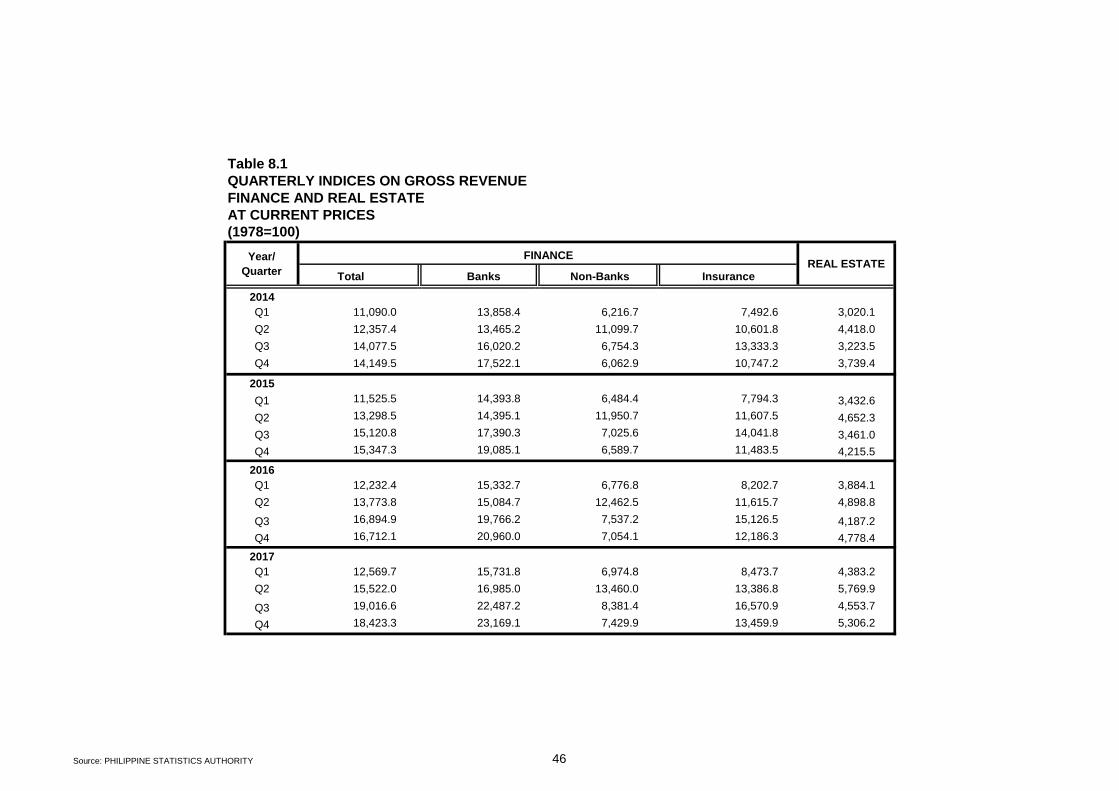
Table 8.1
QUARTERLY INDICES ON GROSS REVENUE
FINANCE AND REAL ESTATE
AT CURRENT PRICES
(1978=100)
Total
2014
Q1 11,090.0 13,858.4 6,216.7 7,492.6 3,020.1
Q2 12,357.4 13,465.2 11,099.7 10,601.8 4,418.0
Q3 14,077.5 16,020.2 6,754.3 13,333.3 3,223.5
Q4 14,149.5 17,522.1 6,062.9 10,747.2 3,739.4
2015
Q1 11,525.5 14,393.8 6,484.4 7,794.3 3,432.6
Q2 13,298.5 14,395.1 11,950.7 11,607.5 4,652.3
Q3 15,120.8 17,390.3 7,025.6 14,041.8 3,461.0
Q4 15,347.3 19,085.1 6,589.7 11,483.5 4,215.5
2016
Q1 12,232.4 15,332.7 6,776.8 8,202.7 3,884.1
Q2 13,773.8 15,084.7 12,462.5 11,615.7 4,898.8
Q3 16,894.9 19,766.2 7,537.2 15,126.5 4,187.2
Q4 16,712.1 20,960.0 7,054.1 12,186.3 4,778.4
2017
Q1 12,569.7 15,731.8 6,974.8 8,473.7 4,383.2
Q2 15,522.0 16,985.0 13,460.0 13,386.8 5,769.9
Q3 19,016.6 22,487.2 8,381.4 16,570.9 4,553.7
Q4 18,423.3 23,169.1 7,429.9 13,459.9 5,306.2
Year/
Quarter
FINANCEREAL ESTATE
Banks Non-Banks Insurance
Source: PHILIPPINE STATISTICS AUTHORITY 46
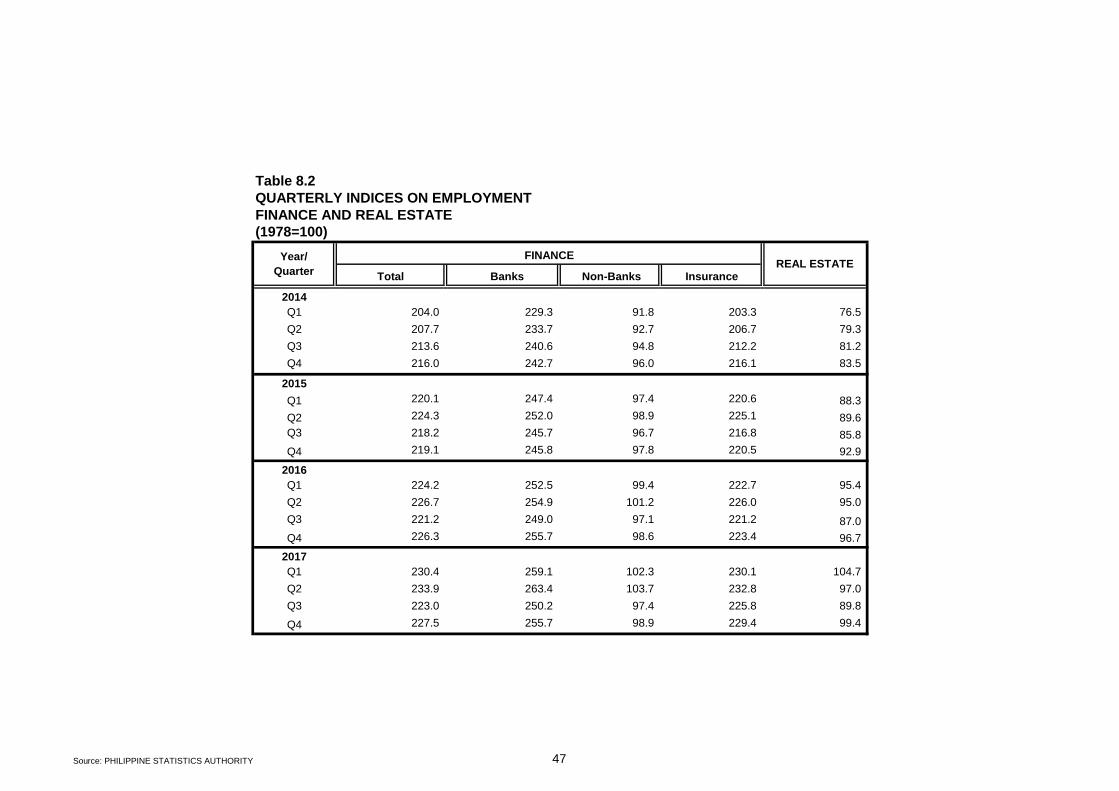
Table 8.2
QUARTERLY INDICES ON EMPLOYMENT
FINANCE AND REAL ESTATE
(1978=100)
Total Banks Non-Banks Insurance
2014
Q1 204.0 229.3 91.8 203.3 76.5
Q2 207.7 233.7 92.7 206.7 79.3
Q3 213.6 240.6 94.8 212.2 81.2
Q4 216.0 242.7 96.0 216.1 83.5
2015
Q1 220.1 247.4 97.4 220.6 88.3
Q2 224.3 252.0 98.9 225.1 89.6
Q3 218.2 245.7 96.7 216.8 85.8
Q4 219.1 245.8 97.8 220.5 92.9
2016
Q1 224.2 252.5 99.4 222.7 95.4
Q2 226.7 254.9 101.2 226.0 95.0
Q3 221.2 249.0 97.1 221.2 87.0
Q4 226.3 255.7 98.6 223.4 96.7
2017
Q1 230.4 259.1 102.3 230.1 104.7
Q2 233.9 263.4 103.7 232.8 97.0
Q3 223.0 250.2 97.4 225.8 89.8
Q4 227.5 255.7 98.9 229.4 99.4
Year/
Quarter
FINANCEREAL ESTATE
Source: PHILIPPINE STATISTICS AUTHORITY 47

Table 8.3
QUARTERLY INDICES ON COMPENSATION
FINANCE AND REAL ESTATE
AT CURRENT PRICES
(1978=100)
Total Banks Non-Banks Insurance
2014
Q1 4,237.0 4,044.6 2,031.9 6,700.4 1,161.7
Q2 4,962.3 4,753.7 2,330.0 7,812.8 1,197.4
Q3 4,509.8 4,420.8 2,142.6 6,650.7 1,159.0
Q4 4,943.8 4,789.0 2,375.1 7,516.2 1,240.3
2015
Q1 5,038.6 4,887.2 2,436.1 7,622.1 1,395.0
Q2 5,513.7 5,327.5 2,689.9 8,410.4 1,396.3
Q3 4,661.8 4,471.9 2,342.1 7,199.7 1,239.6
Q4 5,037.0 4,882.1 2,413.8 7,650.5 1,447.6
2016
Q1 5,372.9 5,215.2 2,519.9 8,169.3 1,540.0
Q2 5,628.9 5,445.8 2,760.4 8,545.4 1,551.5
Q3 4,749.5 4,555.5 2,352.1 7,362.7 1,430.6
Q4 5,098.9 4,920.0 2,412.6 7,862.0 1,565.9
2017
Q1 5,459.6 5,279.8 2,542.9 8,397.6 1,782.6
Q2 5,690.8 5,502.8 2,796.7 8,647.4 1,695.2
Q3 4,852.4 4,665.3 2,356.9 7,508.9 1,643.3
Q4 5,319.2 5,116.7 2,569.5 8,230.7 1,666.1
Year/
Quarter
FINANCEREAL ESTATE
Source: PHILIPPINE STATISTICS AUTHORITY 48

Table 8.3.1
QUARTERLY INDICES ON COMPENSATION PER EMPLOYEE
FINANCE AND REAL ESTATE
AT CURRENT PRICES
(1978=100)
Total Banks Non-Banks Insurance
2014
Q1 2,077.3 1,764.2 2,214.2 3,296.0 1,517.7
Q2 2,389.6 2,034.5 2,513.9 3,780.3 1,509.3
Q3 2,111.2 1,837.5 2,260.3 3,134.2 1,427.8
Q4 2,289.1 1,972.9 2,474.6 3,477.6 1,486.2
2015
Q1 2,288.9 1,975.2 2,500.4 3,455.3 1,580.3
Q2 2,458.4 2,113.8 2,719.2 3,735.6 1,559.1
Q3 2,136.7 1,819.7 2,421.2 3,321.0 1,445.0
Q4 2,298.7 1,986.2 2,467.1 3,469.1 1,558.0
2016
Q1 2,396.9 2,065.6 2,534.8 3,667.9 1,614.5
Q2 2,483.1 2,136.1 2,726.5 3,781.3 1,633.6
Q3 2,147.2 1,829.8 2,423.5 3,329.2 1,643.8
Q4 2,253.3 1,924.0 2,446.5 3,519.9 1,620.1
2017
Q1 2,370.1 2,038.1 2,485.4 3,649.8 1,701.9
Q2 2,432.8 2,089.4 2,697.9 3,714.0 1,747.9
Q3 2,176.4 1,865.0 2,420.3 3,325.7 1,830.8
Q4 2,337.9 2,001.1 2,599.0 3,587.7 1,675.3
Year/ QuarterFINANCE
REAL ESTATE
Source: PHILIPPINE STATISTICS AUTHORITY 49
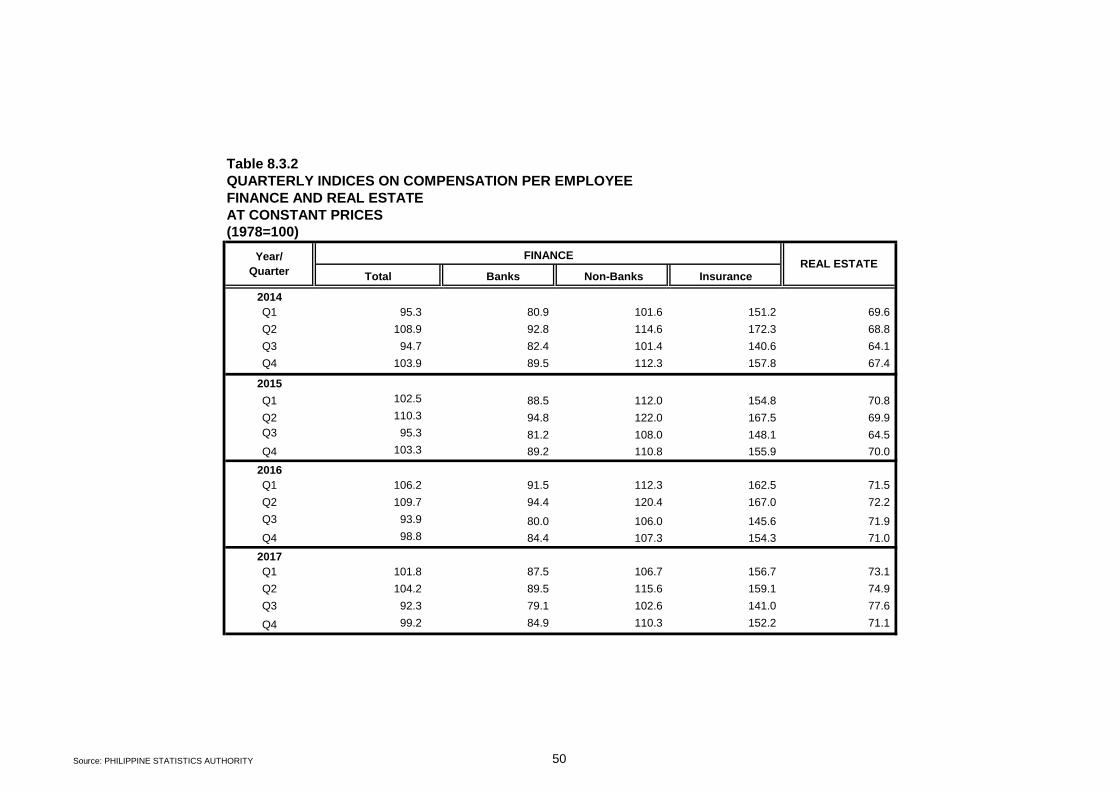
Table 8.3.2
QUARTERLY INDICES ON COMPENSATION PER EMPLOYEE
FINANCE AND REAL ESTATE
AT CONSTANT PRICES
(1978=100)
Banks Non-Banks Insurance
2014
Q1 95.3 80.9 101.6 151.2 69.6
Q2 108.9 92.8 114.6 172.3 68.8
Q3 94.7 82.4 101.4 140.6 64.1
Q4 103.9 89.5 112.3 157.8 67.4
2015
Q1 102.5 88.5 112.0 154.8 70.8
Q2 110.3 94.8 122.0 167.5 69.9
Q3 95.3 81.2 108.0 148.1 64.5
Q4 103.3 89.2 110.8 155.9 70.0
2016
Q1 106.2 91.5 112.3 162.5 71.5
Q2 109.7 94.4 120.4 167.0 72.2
Q3 93.9 80.0 106.0 145.6 71.9
Q4 98.8 84.4 107.3 154.3 71.0
2017
Q1 101.8 87.5 106.7 156.7 73.1
Q2 104.2 89.5 115.6 159.1 74.9
Q3 92.3 79.1 102.6 141.0 77.6
Q4 99.2 84.9 110.3 152.2 71.1
Year/
Quarter
FINANCEREAL ESTATE
Total
Source: PHILIPPINE STATISTICS AUTHORITY 50

PRIVATE SERVICES
51
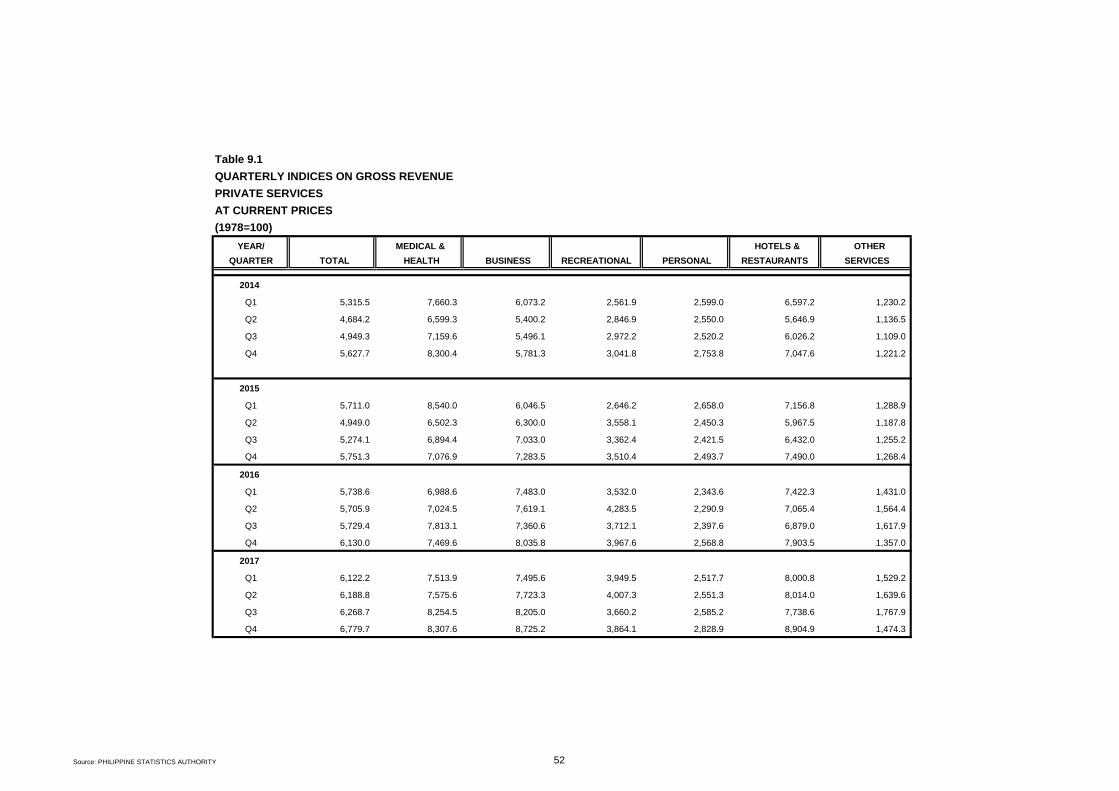
Table 9.1
QUARTERLY INDICES ON GROSS REVENUE
PRIVATE SERVICES
AT CURRENT PRICES
(1978=100)
YEAR/ MEDICAL & HOTELS & OTHER
QUARTER TOTAL HEALTH BUSINESS RECREATIONAL PERSONAL RESTAURANTS SERVICES
2014
Q1 5,315.5 7,660.3 6,073.2 2,561.9 2,599.0 6,597.2 1,230.2
Q2 4,684.2 6,599.3 5,400.2 2,846.9 2,550.0 5,646.9 1,136.5
Q3 4,949.3 7,159.6 5,496.1 2,972.2 2,520.2 6,026.2 1,109.0
Q4 5,627.7 8,300.4 5,781.3 3,041.8 2,753.8 7,047.6 1,221.2
2015
Q1 5,711.0 8,540.0 6,046.5 2,646.2 2,658.0 7,156.8 1,288.9
Q2 4,949.0 6,502.3 6,300.0 3,558.1 2,450.3 5,967.5 1,187.8
Q3 5,274.1 6,894.4 7,033.0 3,362.4 2,421.5 6,432.0 1,255.2
Q4 5,751.3 7,076.9 7,283.5 3,510.4 2,493.7 7,490.0 1,268.4
2016
Q1 5,738.6 6,988.6 7,483.0 3,532.0 2,343.6 7,422.3 1,431.0
Q2 5,705.9 7,024.5 7,619.1 4,283.5 2,290.9 7,065.4 1,564.4
Q3 5,729.4 7,813.1 7,360.6 3,712.1 2,397.6 6,879.0 1,617.9
Q4 6,130.0 7,469.6 8,035.8 3,967.6 2,568.8 7,903.5 1,357.0
2017
Q1 6,122.2 7,513.9 7,495.6 3,949.5 2,517.7 8,000.8 1,529.2
Q2 6,188.8 7,575.6 7,723.3 4,007.3 2,551.3 8,014.0 1,639.6
Q3 6,268.7 8,254.5 8,205.0 3,660.2 2,585.2 7,738.6 1,767.9
Q4 6,779.7 8,307.6 8,725.2 3,864.1 2,828.9 8,904.9 1,474.3
Source: PHILIPPINE STATISTICS AUTHORITY 52

Table 9.2
QUARTERLY INDICES ON EMPLOYMENT
PRIVATE SERVICES
(1978=100)
YEAR/ MEDICAL & HOTELS & OTHER
QUARTER TOTAL EDUCATIONAL HEALTH BUSINESS RECREATIONAL PERSONAL RESTAURANTS SERVICES
2014
Q1 158.2 115.9 345.5 106.3 139.3 160.6 89.6 107.6
Q2 163.5 104.7 355.8 114.7 138.6 181.5 90.8 103.4
Q3 165.6 114.9 360.5 119.1 142.2 177.9 90.9 106.7
Q4 167.3 114.7 364.4 124.3 141.8 182.1 92.0 103.7
2015
Q1 170.8 116.1 372.7 131.4 139.8 185.3 96.3 102.6
Q2 173.0 104.4 381.0 133.1 139.3 190.4 98.6 103.6
Q3 172.9 114.7 384.6 132.0 138.1 184.1 98.7 103.1
Q4 173.3 115.6 391.1 139.0 138.0 178.1 97.4 103.9
2016
Q1 172.9 115.5 394.1 141.3 139.6 171.9 97.0 105.2
Q2 173.5 106.4 399.0 141.8 139.8 173.4 98.3 104.2
Q3 173.5 115.5 401.9 143.9 136.8 169.6 98.1 101.8
Q4 177.7 116.0 408.0 149.6 140.3 176.9 98.9 106.7
2017
Q1 175.4 116.2 409.0 142.1 139.4 173.4 96.5 103.3
Q2 175.7 106.8 410.5 142.1 140.8 175.6 96.1 105.1
Q3 177.1 115.7 412.6 142.1 141.9 176.3 96.7 104.8
Q4 179.0 116.4 415.9 143.1 143.1 179.1 98.8 104.9
Source: PHILIPPINE STATISTICS AUTHORITY 53

Table 9.3
QUARTERLY INDICES ON COMPENSATION
PRIVATE SERVICES
AT CURRENT PRICES
(1978=100)
YEAR/ MEDICAL & HOTELS & OTHER
QUARTER TOTAL EDUCATIONAL HEALTH BUSINESS RECREATIONAL PERSONAL RESTAURANTS SERVICES
2014
Q1 10,980.9 4,016.8 38,122.7 3,385.7 6,105.6 1,768.9 6,461.4 1,002.2
Q2 10,884.4 3,830.7 38,892.7 3,576.2 5,941.9 1,847.8 5,312.8 970.3
Q3 10,893.4 4,056.9 39,536.8 3,449.9 6,110.8 1,725.4 4,731.8 915.1
Q4 11,956.2 4,373.8 41,574.3 3,895.3 6,096.6 1,874.3 7,150.7 1,022.0
2015
Q1 11,788.4 4,328.7 41,221.3 3,932.2 6,129.8 1,747.2 6,773.1 1,006.3
Q2 11,966.7 4,085.5 43,104.8 3,947.0 6,565.9 2,061.4 5,554.1 1,043.2
Q3 11,670.1 4,311.4 42,626.7 3,957.1 6,580.9 1,879.9 4,693.0 893.5
Q4 12,985.7 4,985.5 44,505.2 4,409.1 7,359.3 1,993.0 7,862.0 1,108.0
2016
Q1 12,869.3 4,619.5 45,028.7 4,117.8 6,686.8 1,867.7 7,580.4 1,050.3
Q2 13,136.9 4,410.7 45,973.5 4,208.9 7,014.2 1,916.6 7,791.7 1,081.3
Q3 13,176.5 4,781.6 46,462.3 4,480.2 6,531.6 1,926.6 7,356.5 1,084.4
Q4 14,055.8 5,165.3 48,653.2 4,969.7 8,187.6 2,045.8 8,011.9 1,212.3
2017
Q1 13,574.7 4,936.0 47,511.6 4,595.6 7,074.8 1,960.4 7,780.5 1,128.6
Q2 13,688.4 4,513.5 48,302.6 4,541.6 7,053.0 1,998.5 7,792.8 1,134.6
Q3 13,942.7 4,854.9 49,130.1 4,559.5 7,437.8 2,000.6 7,822.1 1,156.3
Q4 14,573.2 5,220.2 51,123.4 4,668.8 7,995.1 2,074.7 8,290.9 1,207.3
Source: PHILIPPINE STATISTICS AUTHORITY 54

Table 9.3.1
QUARTERLY INDICES ON COMPENSATION PER EMPLOYEE
PRIVATE SERVICES
AT CURRENT PRICES
(1978=100)
YEAR/ MEDICAL & HOTELS & OTHER
QUARTER TOTAL EDUCATIONAL HEALTH BUSINESS RECREATIONAL PERSONAL RESTAURANTS SERVICES
2014
Q1 6,941.2 3,466.6 11,032.5 3,186.5 4,381.9 1,101.5 7,211.6 931.6
Q2 6,655.2 3,659.7 10,929.5 3,118.2 4,288.0 1,017.8 5,848.4 938.1
Q3 6,579.1 3,530.6 10,967.4 2,897.5 4,297.1 969.7 5,207.9 857.4
Q4 7,145.3 3,813.1 11,408.0 3,134.5 4,299.8 1,029.5 7,774.6 985.6
2015
Q1 6,902.5 3,729.6 11,061.2 2,992.1 4,384.2 942.7 7,030.5 981.2
Q2 6,915.2 3,912.0 11,314.4 2,964.5 4,714.4 1,082.9 5,634.0 1,006.9
Q3 6,748.1 3,759.2 11,084.6 2,997.1 4,764.4 1,021.0 4,753.4 866.3
Q4 7,494.5 4,311.0 11,378.8 3,173.0 5,331.3 1,119.2 8,072.6 1,066.0
2016
Q1 7,443.3 3,998.7 11,425.4 2,913.5 4,790.6 1,086.7 7,810.9 998.7
Q2 7,572.4 4,144.6 11,523.5 2,968.0 5,015.9 1,105.4 7,928.7 1,037.8
Q3 7,595.3 4,138.5 11,559.3 3,113.1 4,773.7 1,135.7 7,497.3 1,065.6
Q4 7,908.1 4,453.4 11,925.6 3,322.6 5,835.4 1,156.5 8,103.5 1,136.7
2017
Q1 7,738.2 4,247.4 11,617.0 3,234.4 5,075.7 1,130.9 8,061.3 1,092.3
Q2 7,791.7 4,227.1 11,767.7 3,196.6 5,008.4 1,137.9 8,106.3 1,079.7
Q3 7,873.2 4,195.7 11,906.9 3,208.5 5,242.9 1,134.5 8,087.5 1,103.6
Q4 8,143.6 4,485.2 12,292.5 3,263.6 5,588.5 1,158.2 8,389.3 1,151.1
Source: PHILIPPINE STATISTICS AUTHORITY 55
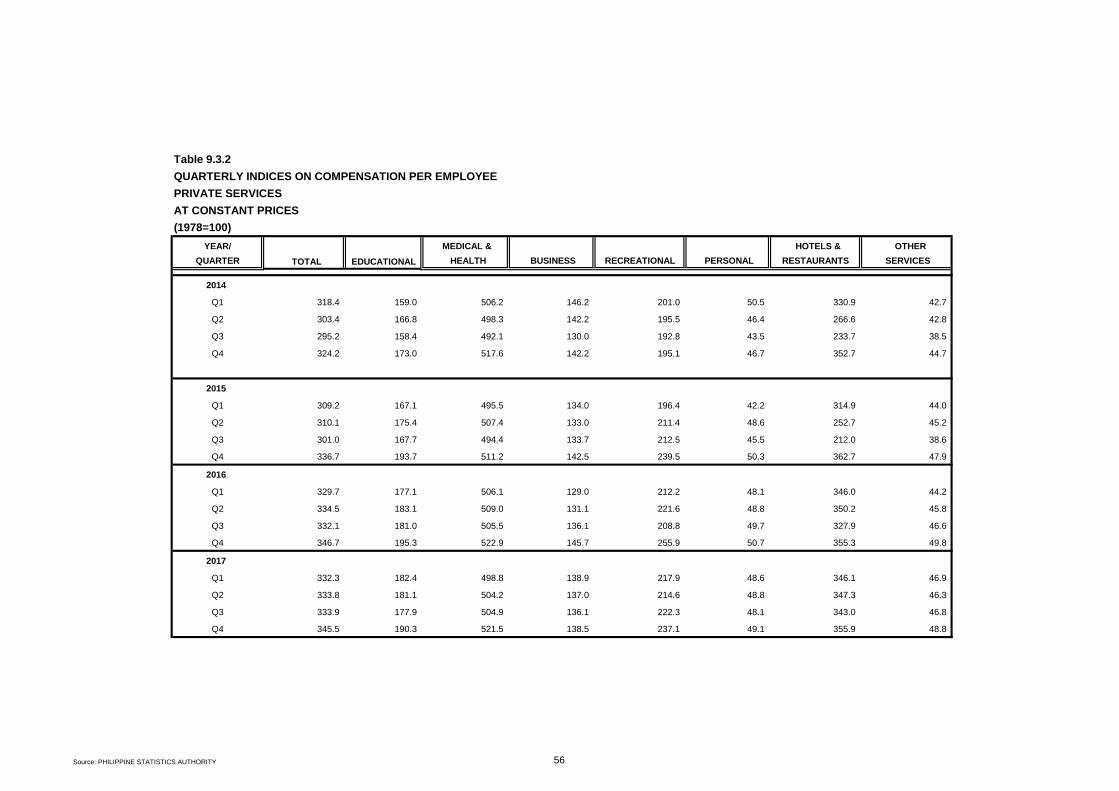
Table 9.3.2
QUARTERLY INDICES ON COMPENSATION PER EMPLOYEE
PRIVATE SERVICES
AT CONSTANT PRICES
(1978=100)
YEAR/ MEDICAL & HOTELS & OTHER
QUARTER HEALTH BUSINESS RECREATIONAL PERSONAL RESTAURANTS SERVICES
2014
Q1 318.4 159.0 506.2 146.2 201.0 50.5 330.9 42.7
Q2 303.4 166.8 498.3 142.2 195.5 46.4 266.6 42.8
Q3 295.2 158.4 492.1 130.0 192.8 43.5 233.7 38.5
Q4 324.2 173.0 517.6 142.2 195.1 46.7 352.7 44.7
2015
Q1 309.2 167.1 495.5 134.0 196.4 42.2 314.9 44.0
Q2 310.1 175.4 507.4 133.0 211.4 48.6 252.7 45.2
Q3 301.0 167.7 494.4 133.7 212.5 45.5 212.0 38.6
Q4 336.7 193.7 511.2 142.5 239.5 50.3 362.7 47.9
2016
Q1 329.7 177.1 506.1 129.0 212.2 48.1 346.0 44.2
Q2 334.5 183.1 509.0 131.1 221.6 48.8 350.2 45.8
Q3 332.1 181.0 505.5 136.1 208.8 49.7 327.9 46.6
Q4 346.7 195.3 522.9 145.7 255.9 50.7 355.3 49.8
2017
Q1 332.3 182.4 498.8 138.9 217.9 48.6 346.1 46.9
Q2 333.8 181.1 504.2 137.0 214.6 48.8 347.3 46.3
Q3 333.9 177.9 504.9 136.1 222.3 48.1 343.0 46.8
Q4 345.5 190.3 521.5 138.5 237.1 49.1 355.9 48.8
TOTAL EDUCATIONAL
Source: PHILIPPINE STATISTICS AUTHORITY 56
57
TECHNICAL NOTES
The Quarterly Economic Indices (QEI) publication is a compilation of quarterly indices on production, gross revenue, employment, compensation, production per worker, compensation per employee, and average earnings.
A. COVERAGE OF INDICES The quarterly indices are being compiled for the different sectors, which are as follows:
1. Production indices a. Agriculture, Fishery and Forestry b. Mining and Quarrying c. Electricity and Water
2. Production per worker indices a. Mining and Quarrying b. Electricity and Water
3. Gross revenue indices a. Manufacturing b. Trade c. Transportation and Communication d. Finance e. Real Estate f. Private Services
4. Employment indices a. Mining and Quarrying b. Manufacturing c. Electricity and Water d. Trade e. Transportation and Communication f. Finance g. Real Estate h. Private Services
5. Compensation indices a. Mining and Quarrying b. Manufacturing c. Electricity and Water d. Trade e. Transportation and Communication f. Finance g. Real Estate h. Private Services

58
6. Compensation per employee indices a. Mining and Quarrying b. Manufacturing c. Construction* d. Electricity and Water e. Trade f. Transportation and Communication g. Finance h. Real Estate i. Private Services
Table 1 summarizes the types of indices and the different sectors covered.
B. LIMITATIONS OF THE QEI:
The sectoral indices are computed based on data from the Quarterly Survey of Philippine Business and Industry and reports from various administrative and regulatory agencies with 1978 as base year. While quarterly data are available on a sectoral basis, not all data items are generated. Hence, indices on production are estimated only for agriculture, mining and quarrying and electricity and water, while the indices on gross revenue, employment and compensation are computed for all sectors of industry and services, except for construction. For the latter, only the indices on compensation per employee are obtained.
C. REVISION POLICY As a matter of policy, revisions on the estimates for the immediately preceding
quarter are undertaken quarterly while revisions for earlier quarters, if any, are made only during the first quarter round of estimates.
* Used to be the average earning indices.
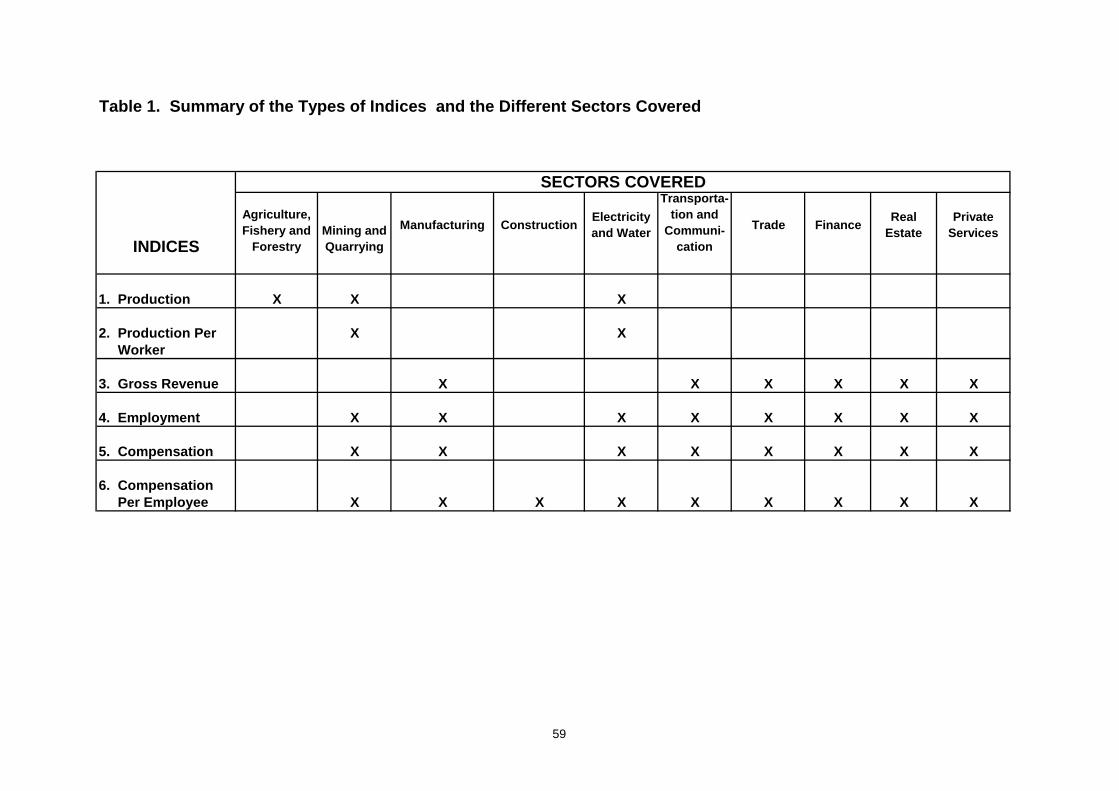
Table 1. Summary of the Types of Indices and the Different Sectors Covered
INDICES
Agriculture,
Fishery and
Forestry
Mining and
Quarrying
Manufacturing ConstructionElectricity
and Water
Transporta-
tion and
Communi-
cation
Trade FinanceReal
Estate
Private
Services
1. Production X X X
2. Production Per X X
Worker
3. Gross Revenue X X X X X X
4. Employment X X X X X X X X
5. Compensation X X X X X X X X
6. Compensation
Per Employee X X X X X X X X X
SECTORS COVERED
59

60
D. SCOPE AND COVERAGE
The sectoral classification for the compilation of the quarterly indices follows the classification of the National Accounts and represents the industry groupings based on the Philippine Standard Industrial Classification (PSIC). The following sections present the scope and coverage of the industries, the data sources for the estimation of the quarterly indices as well as the type of indices generated for each sector
1. AGRICULTURE, FISHERY, AND FORESTRY Agriculture includes the production of all agricultural crops such
as palay, corn, coconut, sugarcane, banana, and the raising of livestock and poultry including the production of milk and eggs. Services provided to agriculture on a fee or contract basis such as veterinary services, the operation of irrigation systems, and pest control are also included in this subsector.
Fishery covers fishing, fish culture, and the gathering of other
marine products such as reptile skins, seaweeds, shells, and sponges. Forestry includes logging and the gathering of minor forest
products such as firewood, bamboos, etc. and the burning of charcoal in the forest.
For this sector, production indices are estimated for total
agriculture, fishery, and forestry; total agricultural crops; palay; corn; coconut; banana; sugarcane; other crops; livestock and poultry; fishery and forestry.
2. MINING AND QUARRYING
Mining and quarrying covers the production of all metallic and
non-metallic minerals by extraction from nature and its related processes. Underground and surface mines, quarries and wells and all supplemental activities for beneficiating ores and other crude materials for marketing ores are included.
The indices of production, production per worker, employment,
compensation and compensation per employee are compiled for total mining and quarrying, total metallic with indices for the subsectors of gold, copper, nickel, chromium, and other metallic and total non-metallic with indices for the subsectors of coal, stone, clay and sandpits, and other non-metallic.
61
3. MANUFACTURING Manufacturing is the mechanical or chemical transformation of
organic or inorganic substances into new products, whether the work is performed by power driven machines or by hand, whether it is done in a factory or in the worker’s home and whether the products are sold at wholesale or retail. Activities carried out in connection with the main manufacturing activity such as the production of goods in their workshops, the operation of cafeterias or bakeries, the printing of books, pamphlets and postcards and minor own-account construction are also accounted for in the sector.
Quarterly indices on gross revenue, employment,
compensation, and compensation per employee are estimated for total manufacturing sector and for its major subsectors namely: food, beverage, tobacco, textile, footwear and wearing apparel, wood and cork products, furniture and fixtures, paper and paper products, publishing and printing, leather and leather products, rubber products, chemical and chemical products, products of petroleum and coal, non-metallic mineral products, basic metal industries (such as ferrous metals, metals and non-ferrous metals), machines except electrical, electrical machineries (such as microcircuits, household appliances, batteries, lamps, wires), transport equipment, and miscellaneous manufactures.
4. CONSTRUCTION Construction, as an industry, covers the activities of putting up
of buildings and structures and other land improvements. It may also undertake other related projects as its secondary activities such as the provision of technical and engineering services as well as the manufacture and trading of construction materials.
Only the quarterly index on compensation per employee or
average earnings is estimated for the total construction sector.
62
5. ELECTRICITY AND WATER
Electricity and water covers the generation, transmission and
distribution of electricity to households, industrial and commercial users as well as the collection, purification and distribution of water.
For the sector, quarterly indices on production, production per
worker, employment, compensation, and compensation per employee are estimated separately for electricity subsector and the water subsector.
6. TRANSPORTATION AND COMMUNICATION
Transport services consist of the transport of passenger and
freight by land, water and air including transport related operation like the operation of toll roads, terminal facilities, piers, airports and the like. It also covers services incidental to transport. Communication includes mail express service, telephone, radio and related services.
The indices for gross revenue, employment, compensation, and
compensation per employee are compiled for total transport and communication sector. The same computations are also done for the major subsectors of transportation, which include: land, water and air.
7. WHOLESALE AND RETAIL TRADE
Trading pertains to the services provided by production units
engaged in buying and reselling of goods, without transformation, either in bulk as in wholesaling, or in small quantities as in retailing.
The quarterly indices for gross revenue, employment,
compensation, and compensation per employee are estimated for the aggregate wholesale and retail trade.
8. FINANCE
Finance sector covers the activities of financial institutions such
as banks, nonbanks and insurance companies. Banks include commercial banks, savings and mortgage banks, private development banks, stock savings and loan associations and specialized government banks. Nonbanks include financing companies, fund managers, investment houses, investment companies, security dealers, security brokers, venture capital corporations, mutual building and loan associations, credit cooperatives, pawnshops and government nonbank financial intermediaries. Insurance includes
63
incorporated, mutual and other entities mainly engaged in providing life, accident, sickness, fire, casualty or other forms of insurance.
The quarterly indices on gross revenue, employment,
compensation, and compensation per employee are compiled for total finance sector and that of banks, non-banks and insurance, which are its major subsectors.
9. REAL ESTATE
Real estate covers the renting, management and operation of
residential and non-residential buildings, the subdivision and development of land into building lots, the operation of residential and industrial estates, cemetery development and sale including the activities of real estate agents, brokers and managers engaged in renting, buying, selling, managing and appraisal of real estate on a fee or contract basis.
The estimates of quarterly indices on gross revenue,
employment, compensation, and compensation per employee are done for the aggregate sector of real estate.
10. PRIVATE SERVICES
Private services sector includes educational, medical and
health, personal recreation, hotels and restaurants and other private services. Producers of these services are the profit-making industries, private non-profit organizations engaged mostly in social and community services and households and own account workers rendering social and community services to others.
For private services, quarterly indices on gross revenue,
employment, compensation, and compensation per employee are computed for the total sector and its subsectors namely: educational, medical and health, business, recreational, personal, hotels and restaurants, and other services.

64
E. DATA SOURCES
For the compilation of the quarterly QEI, the following are the main sources of data:
1. Sugar Regulatory Administration (SRA) The volume of production and price data for sugarcane are
provided by the SRA.
2. Forest Management Bureau (FMB) For forestry, data are sourced from the FMB, which generates
data on log production and other minor forest products from its field reports of logging companies and foresters.
Price data are taken from the Wholesale Price Survey
conducted by the Philippine Statistics Authority (PSA).
3. Mines and Geosciences Bureau (MGB) Data on volume of metallic mineral production by type are
sourced from the Monthly Production Reports of Mining Firms submitted to the MGB. Data on volume of coal production are provided by the Department of Energy (DoE) while data on volume of production of stone, clay and sandpits and other non-metallic are estimated using the results of the Quarterly Survey of Philippine Business and Industry (QSPBI). Price data are taken from the Wholesale Price Survey of PSA. The QSPBI also provides the basic data for the estimation of the indices on employment and compensation.
65
4. Philippine Statistics Authority (PSA)
The QSPBI of the PSA serves as the main source of data for most of the sectors including: manufacturing, construction, electricity and water, transportation and communication, trade, finance, real estate and private services. From this establishment-based survey, information on compensation, gross revenue and employment are derived. In the case of the manufacturing, results of the QSPBI are supplemented by the Monthly Integrated Survey of Selected Industries (MISSI).
The PSA is also the source of data on production and prices for
palay, corn and other crops (except coconut and sugarcane), livestock, poultry and fishery. Production data are generated based on the results of the Rice and Corn Survey, Survey of Commercial and Backyard Livestock and Poultry Farms, Survey of Commercial and Municipal Fish Landing Centers including the Survey on Aquaculture. Price data are obtained from the Farm Price Survey except for sugarcane.
Aside from the above-mentioned, the PSA produces the CPI,
which is used as deflator to calculate for the constant price estimates of the indices.
5. National Power Corporation (NPC), Manila Electric Company
(MERALCO), Manila Water Company, Inc. (MWCI), Maynilad Water
Services Inc. (MWSI)
For the production index for electricity data are taken from the
National Power Corporation (NPC). Employment and compensation data are culled from the QSPBI supplemented by data from the (NPC) and the Manila Electric Company (MERALCO).
For water, data on production are obtained from the
Metropolitan Waterworks and Sewerage System-Regulatory Office (MWSS-RO) while data on employment and compensation are sourced from the QSPBI of the PSA
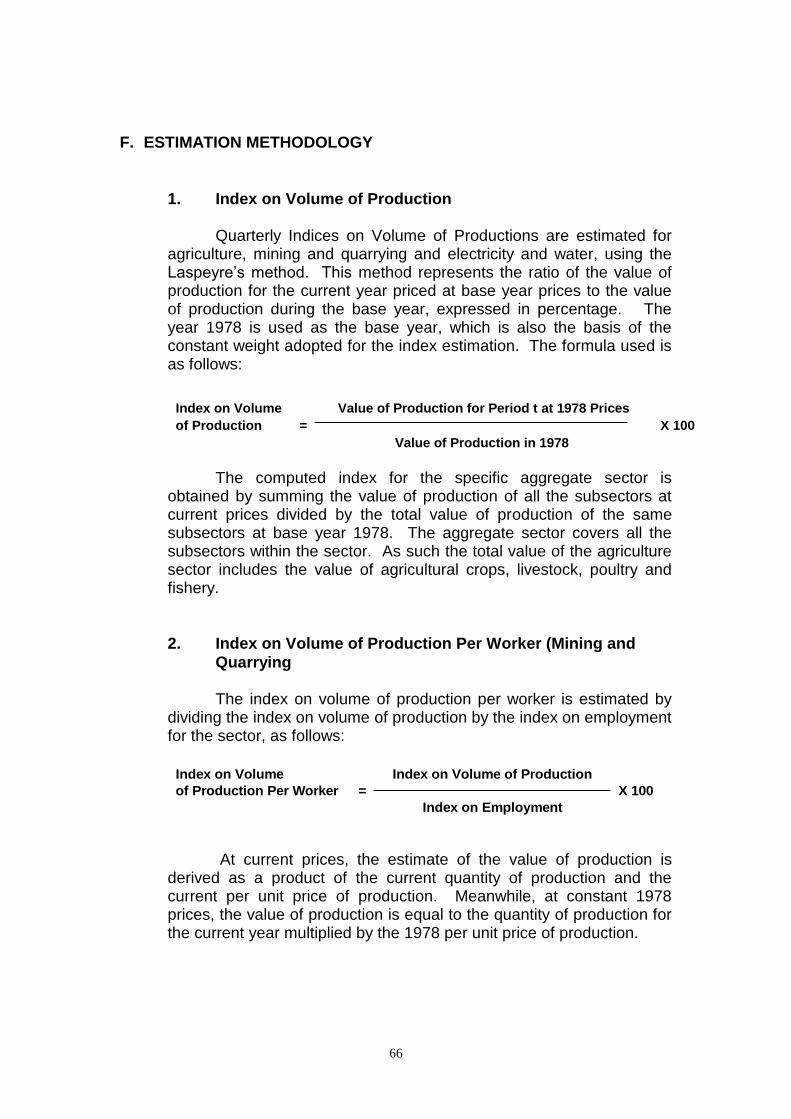
66
F. ESTIMATION METHODOLOGY
1. Index on Volume of Production Quarterly Indices on Volume of Productions are estimated for
agriculture, mining and quarrying and electricity and water, using the Laspeyre’s method. This method represents the ratio of the value of production for the current year priced at base year prices to the value of production during the base year, expressed in percentage. The year 1978 is used as the base year, which is also the basis of the constant weight adopted for the index estimation. The formula used is as follows:
The computed index for the specific aggregate sector is
obtained by summing the value of production of all the subsectors at current prices divided by the total value of production of the same subsectors at base year 1978. The aggregate sector covers all the subsectors within the sector. As such the total value of the agriculture sector includes the value of agricultural crops, livestock, poultry and fishery.
2. Index on Volume of Production Per Worker (Mining and
Quarrying The index on volume of production per worker is estimated by
dividing the index on volume of production by the index on employment for the sector, as follows:
At current prices, the estimate of the value of production is derived as a product of the current quantity of production and the current per unit price of production. Meanwhile, at constant 1978 prices, the value of production is equal to the quantity of production for the current year multiplied by the 1978 per unit price of production.
Index on Volume Value of Production for Period t at 1978 Prices
of Production = X 100
Value of Production in 1978
Index on Volume Index on Volume of Production
of Production Per Worker = X 100
Index on Employment

67
3. Index on Gross Revenue, Compensation and Employment The initial benchmark annual estimates for the aggregate
sectoral gross revenue, compensation and employment were computed for the year 1978, using the 1978 Census of Establishments (CE) as major data source. These were supplemented by available data from the National Accounts for sectoral gross value added as well as data from the 1978 Input-Output Industry Tables, which provided the 1978 structure by sector.
For estimating the quarterly indices on gross revenue,
employment, compensation, and compensation per employee, the 1978 Quarterly Survey of Establishment (QSE) (currently known as the QSPBI) were used to come up with the quarterly breakdown of the annual levels. The corresponding indices for each sector in a given quarter were computed by calculating the ratio of the quarterly levels to the average quarterly values at base year 1978. For succeeding quarterly estimates, values are derived as the product of the relatives of the matched set of data from responding establishments for the sector, which are obtained from the QSPBI and the corresponding values for the previous quarter or the same quarter in the previous year, for services and industry sectors, respectively. The indices are derived as the ratio of the estimated values to the base year levels, as follows:
3.1 Index on Gross Revenue
3.2 Index on Compensation
3.3 Index on Employment
Total values for the aggregate sector are derived as the summation of the total value estimates of subsectors covered by the sector. The computed index for the sector is then derived as the ratio to the corresponding base year level aggregates.
Gross Revenue at Current Prices for Period t
Index on Gross Revenue = X 100
Gross Revenue in 1978
Compensation at Current Prices for Period t
Index on Compensation = X 100
Compensation in 1978
Employment for Period t
Index on Employment = X 100
Employment in 1978
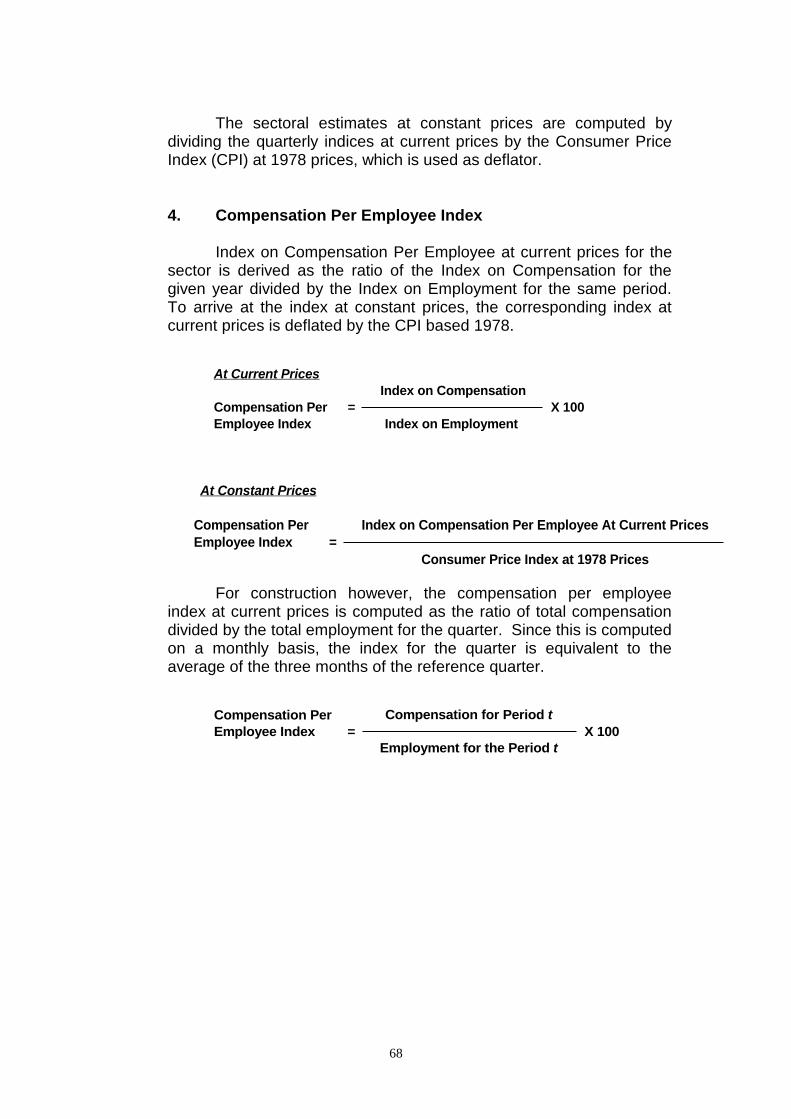
68
The sectoral estimates at constant prices are computed by dividing the quarterly indices at current prices by the Consumer Price Index (CPI) at 1978 prices, which is used as deflator.
4. Compensation Per Employee Index Index on Compensation Per Employee at current prices for the
sector is derived as the ratio of the Index on Compensation for the given year divided by the Index on Employment for the same period. To arrive at the index at constant prices, the corresponding index at current prices is deflated by the CPI based 1978.
For construction however, the compensation per employee index at current prices is computed as the ratio of total compensation divided by the total employment for the quarter. Since this is computed on a monthly basis, the index for the quarter is equivalent to the average of the three months of the reference quarter.
At Current Prices
Index on Compensation
Compensation Per = X 100
Employee Index Index on Employment
At Constant Prices
Compensation Per Index on Compensation Per Employee At Current Prices
Employee Index =
Consumer Price Index at 1978 Prices
Compensation Per Compensation for Period t
Employee Index = X 100
Employment for the Period t
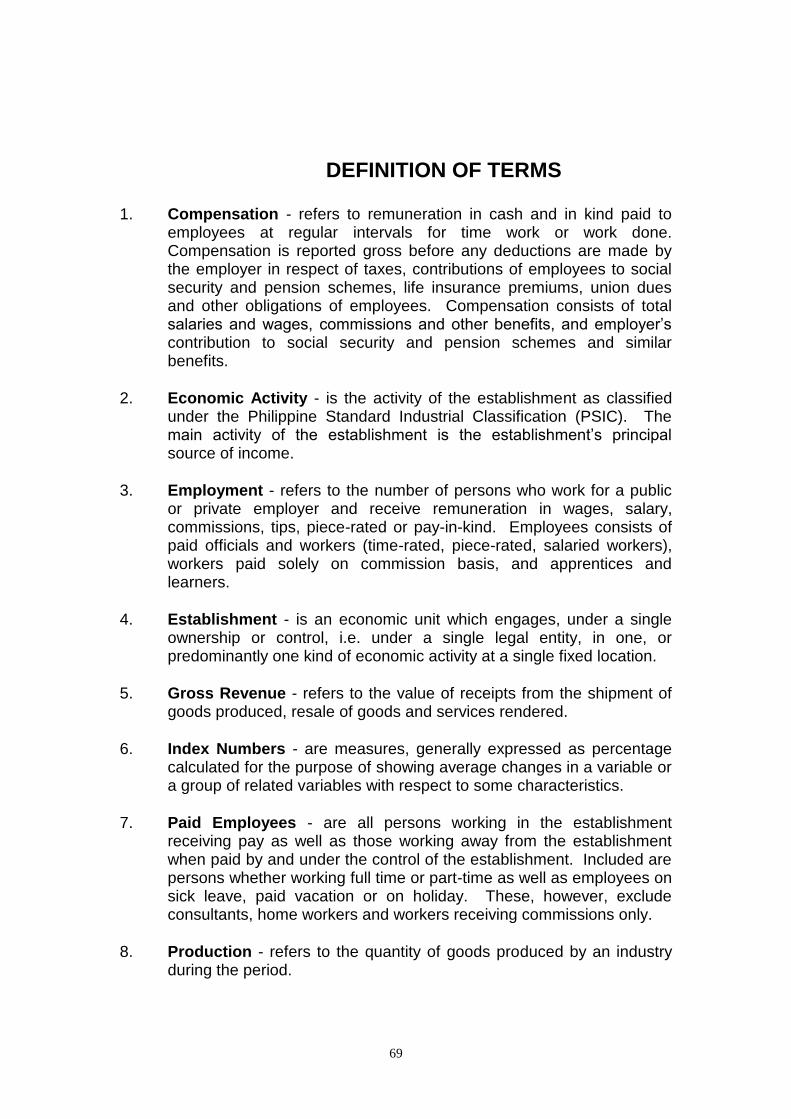
69
DEFINITION OF TERMS 1. Compensation - refers to remuneration in cash and in kind paid to
employees at regular intervals for time work or work done. Compensation is reported gross before any deductions are made by the employer in respect of taxes, contributions of employees to social security and pension schemes, life insurance premiums, union dues and other obligations of employees. Compensation consists of total salaries and wages, commissions and other benefits, and employer’s contribution to social security and pension schemes and similar benefits.
2. Economic Activity - is the activity of the establishment as classified under the Philippine Standard Industrial Classification (PSIC). The main activity of the establishment is the establishment’s principal source of income.
3. Employment - refers to the number of persons who work for a public or private employer and receive remuneration in wages, salary, commissions, tips, piece-rated or pay-in-kind. Employees consists of paid officials and workers (time-rated, piece-rated, salaried workers), workers paid solely on commission basis, and apprentices and learners.
4. Establishment - is an economic unit which engages, under a single ownership or control, i.e. under a single legal entity, in one, or predominantly one kind of economic activity at a single fixed location.
5. Gross Revenue - refers to the value of receipts from the shipment of goods produced, resale of goods and services rendered.
6. Index Numbers - are measures, generally expressed as percentage calculated for the purpose of showing average changes in a variable or a group of related variables with respect to some characteristics.
7. Paid Employees - are all persons working in the establishment receiving pay as well as those working away from the establishment when paid by and under the control of the establishment. Included are persons whether working full time or part-time as well as employees on sick leave, paid vacation or on holiday. These, however, exclude consultants, home workers and workers receiving commissions only.
8. Production - refers to the quantity of goods produced by an industry during the period.

70
Production Accounts Division Macroeconomic Accounts Service
Philippine Statistics Authority
LISA GRACE S. BERSALES, Ph.D. Undersecretary
National Statistician and Civil Registrar General
JOSIE B. PEREZ Assistant Secretary
Deputy National Statistician Census and Technical Coordination
Office
ROMEO S. RECIDE Assistant Secretary
Deputy National Statistician Sectoral Statistics Office
DANIEL A. ARIASO SR. Assistant Secretary
Deputy National Statistician Civil Registration and Central
Support Office
Vivian R. Ilarina Assistant National Statistician
Macroeconomic Accounts Service
Florande S. Polistico Division Chief, Production Accounts Division
Editorial Staff Faith Hyacinth M. Balisacan
Cynthia P. Donato Jomar S. Garachico
Anne Pauline M. Genavia Elgie A. Gulane Chelo M. Nuyda
Kristy Ann G. Meguiso Aaron Paolo B. Uy
Dean Joseph A. Villanueva
Christian Patrick E. Vinculado
Sector Specialists
Agriculture, Fishery and Forestry - Cynthia P. Donato Mining and Quarrying - Jomar S. Garachico Manufacturing - Faith Hyacinth M. Balisacan Construction - Dean Joseph A. Villanueva Electricity and Water - Chelo M. Nuyda Transportation & Communication - Elgie A. Gulane Trade - Anne Pauline M. Genavia Finance - Christian Patrick E. Vinculado Real Estate - Aaron Paolo B. Uy Private Services - Kristy Ann G. Meguiso