Embed Size (px)
Citation preview

Quarterly economic overview of the agriculture, forestry and fisheries sector: Third quarter 2015
i
Quarterly economic overview of the agriculture, forestry and fisheries sector: Third quarter 2015
ii
PREFACE
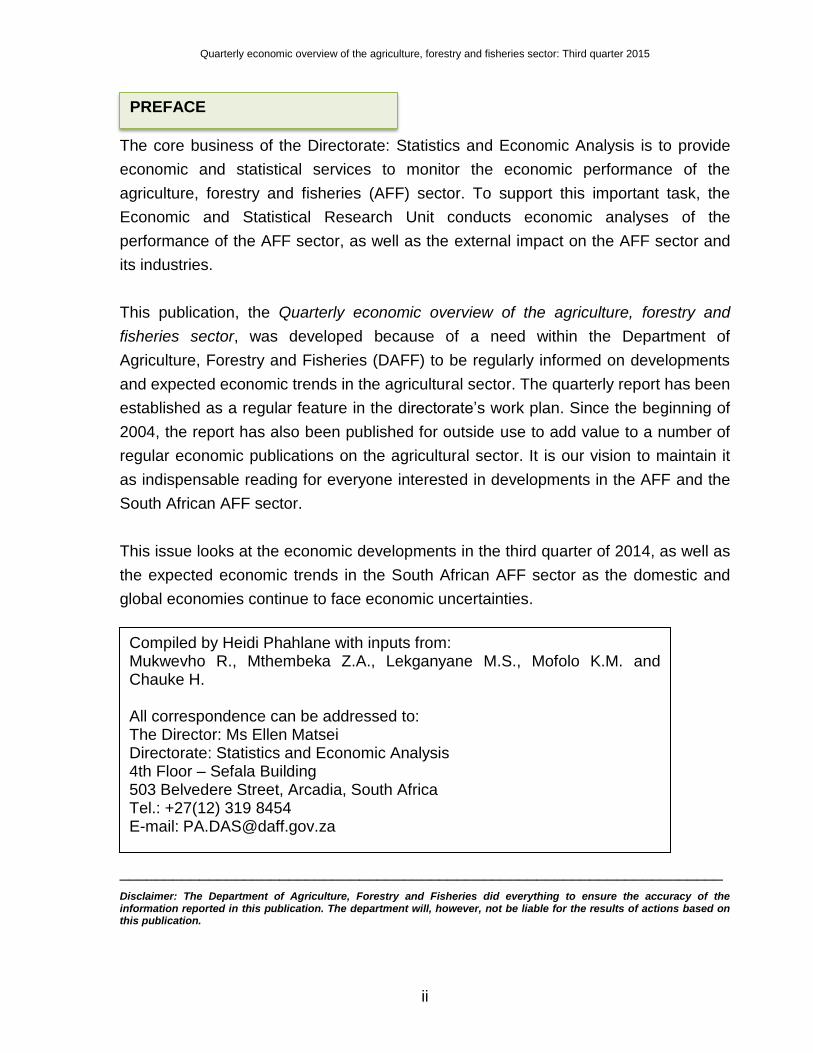
The core business of the Directorate: Statistics and Economic Analysis is to provide
economic and statistical services to monitor the economic performance of the
agriculture, forestry and fisheries (AFF) sector. To support this important task, the
Economic and Statistical Research Unit conducts economic analyses of the
performance of the AFF sector, as well as the external impact on the AFF sector and
its industries.
This publication, the Quarterly economic overview of the agriculture, forestry and
fisheries sector, was developed because of a need within the Department of
Agriculture, Forestry and Fisheries (DAFF) to be regularly informed on developments
and expected economic trends in the agricultural sector. The quarterly report has been
established as a regular feature in the directorate’s work plan. Since the beginning of
2004, the report has also been published for outside use to add value to a number of
regular economic publications on the agricultural sector. It is our vision to maintain it
as indispensable reading for everyone interested in developments in the AFF and the
South African AFF sector.
This issue looks at the economic developments in the third quarter of 2014, as well as
the expected economic trends in the South African AFF sector as the domestic and
global economies continue to face economic uncertainties.
____________________________________________________________________
Disclaimer: The Department of Agriculture, Forestry and Fisheries did everything to ensure the accuracy of the information reported in this publication. The department will, however, not be liable for the results of actions based on this publication.
Compiled by Heidi Phahlane with inputs from: Mukwevho R., Mthembeka Z.A., Lekganyane M.S., Mofolo K.M. and Chauke H. All correspondence can be addressed to: The Director: Ms Ellen Matsei Directorate: Statistics and Economic Analysis 4th Floor – Sefala Building 503 Belvedere Street, Arcadia, South Africa Tel.: +27(12) 319 8454 E-mail: [email protected]

Quarterly economic overview of the agriculture, forestry and fisheries sector: Third quarter 2015
iii
CONTENTS
Preface……………………………………………………………………………………………. i
List of figures…………………………………………………………………………………….. iii
Executive summary…………………………………………………………………………….. 1
1. Global overview of the agriculture, forestry and fisheries economy…………………5
1.1 Global growth……..…………………………………………………………………...5
1.2 Global grain forecast………………………………………………………................6
1.3 Global food prices……..……………………………………………………………....7
2. The state of the domestic economy in agriculture, forestry and fisheries.………….8
2.1 Growth…………………………………………………………………………………...8
2.2 Inflation………………………………………………………………………………....10
2.3 Employment…………………………………………………………………………....11
2.4 Expenditure on intermediate goods and services by the agricultural sector …..16
2.5 Gross farming income and net farm income from agricultural products..............17
2.6 Private consumption expenditure on agricultural products…………………….....19
3. Review of the primary agricultural markets……………………………………………….20
3.1 Grain market review……………………………………………………………………..20
3.2 Fruit and vegetable market review……………………………………………………..27
3.3 Meat industry review………………………………………………………………….....29
3.4 Poultry industry review…………………………………………………………………..30
3.5 Eggs and dairy industry review………………………………………………………...30
3.6 Trade of agricultural, forestry and fisheries…………………………………………..32
4. Conclusion……………………………………………………………………………………….41
5. Reference…………………………………………………………………………………………42
Appendix A: Review of agricultural markets …………………………………………………44

Quarterly economic overview of the agriculture, forestry and fisheries sector: Third quarter 2015
1
List of figures
Figure 1: Advanced Economies quarterly GDP rates
Figure 2: Emerging markets and developing economies quarterly GDP rates
Figure 3: Quarterly global grain supply forecast
Figure 4: Global grain products and consumption forecasts
Figure 5: Quarterly global price indices
Figure 6: Domestic real GDP growth
Figure 7: Seasonally adjusted and annualised quarterly growth in agriculture, forestry and fishing sector
Figure 8: SA headline CPI and CPI for food
Figure 9: CPI for food and selected food items
Figure 10: Total number of people employed in the agricultural sector between 2014 and 2015
Figure 11: Provincial agriculture employment between 2014 and 2015
Figure 12: Provincial number of people involved in subsistence farming between 2014 and 2015
Figure 13: Trends in the expenditure on fuel, farm feeds, fertiliser, seeds & plants and farm services between 2014 and 2015
Figure 14: Trends in nominal gross farm income between 2014 and 2015
Figure 15: Trends in the net farm income between 2014 and 2015
Figure 16: Trends in private consumption expenditure between 2014 and 2015
Figure 17: Quarterly grain price trends
Figure 18: Maize prices and Parity prices
Figure 19: Maize outlook
Figure 20: Maize futures prices
Figure 21: Winter cereals
Figure 22: Oilseeds outlook
Figure 23: Soya bean and Sunflower futures prices
Figure 24 : Sorghum future prices
Figure 25: Average price trends of various fruits traded at FPMs
Figure 26: Average price trends of various vegetables traded at FPMs
Figure 27: Quarterly beef production and prices
Figure 28: Quarterly poultry production
Figure 29: Trends in total egg production and average price per dozen of eggs

Quarterly economic overview of the agriculture, forestry and fisheries sector: Third quarter 2015
1
Figure 30: Trends in total production and the average price of milk
Figure 31: Trade balance of primary agriculture products
Figure 32 : Top three markets of primary agricultural products exported by SA
Figure 33: Top three suppliers of primary agricultural products imported by SA
Figure 34: Top five primary agricultural products imported by SA
Figure 35 : Top five primary agricultural products exported by SA
Figure 36: Trade balance of fisheries products
Figure 37: SA top five imports of fisheries products
Figure 38: SA top five exports of fisheries products
Figure 39: Trade balance of forestry products
Figure 40 : SA top five exports of forestry products
Figure 41: SA top five imports of forestry products

Quarterly economic overview of the agriculture, forestry and fisheries sector: Third quarter 2015
1
1 EXECUTIVE SUMMARY
Global economic growth has been revised downwards and is forecast at 3,1% for
2015 on the economic front, slightly lower than the 3,4% growth in 2014 and is
projected to rise slightly to 3,6% in 2016 as global activity is projected to pick up (IMF,
2015). The most notable risk at the start of 2015 was the slowdown of China’s
economy. Challenges in China were characterised by continued overproduction of oil
and saw its price fall over 2015 to record lows of about US$30 per barrel at the start of
2016. US economic growth cooled down in the third quarter despite a pick-up in
consumer spending as a glut on inventory led to businesses cutting back on
restocking warehouses. In the third quarter, US Economic growth measure increased
at a 1,5% annual rate, a significant drop from the 3,9% annual growth of the second
quarter. The main drag came from businesses stockpiling inventory, however,
economists expect growth to improve in the fourth quarter.
Globally, mineral prices have also been decreasing, combining to cause balance of
payment difficulties and macroeconomic pressures in countries dependent on exports
of these such as Nigeria, South Africa, Angola, and Zambia. These low prices will
continue to present a significant challenge for resource-based growth in these and
other African countries. Another potential cause for weakened currencies and
resultant increases in debt levels in some African countries and other emerging
economies was an interest rate hike by the US Federal Reserve. The first interest rate
hike in a decade was affected in December 2015, with a few more increases expected
during 2016. Drought conditions were experienced in most parts of the continent
towards the end of 2015 and are likely to threaten the food security and balance of
payment positions in other countries reliant on primary agricultural production and
export.
The SA economy grew by a seasonally adjusted and annualised 0,7% quarter-on-
quarter (q/q) during the third quarter of 2015, averting a technical recession following a
1,3% contraction in the second quarter of 2015. Factors such as low commodity
Quarterly economic overview of the agriculture, forestry and fisheries sector: Third quarter 2015
2
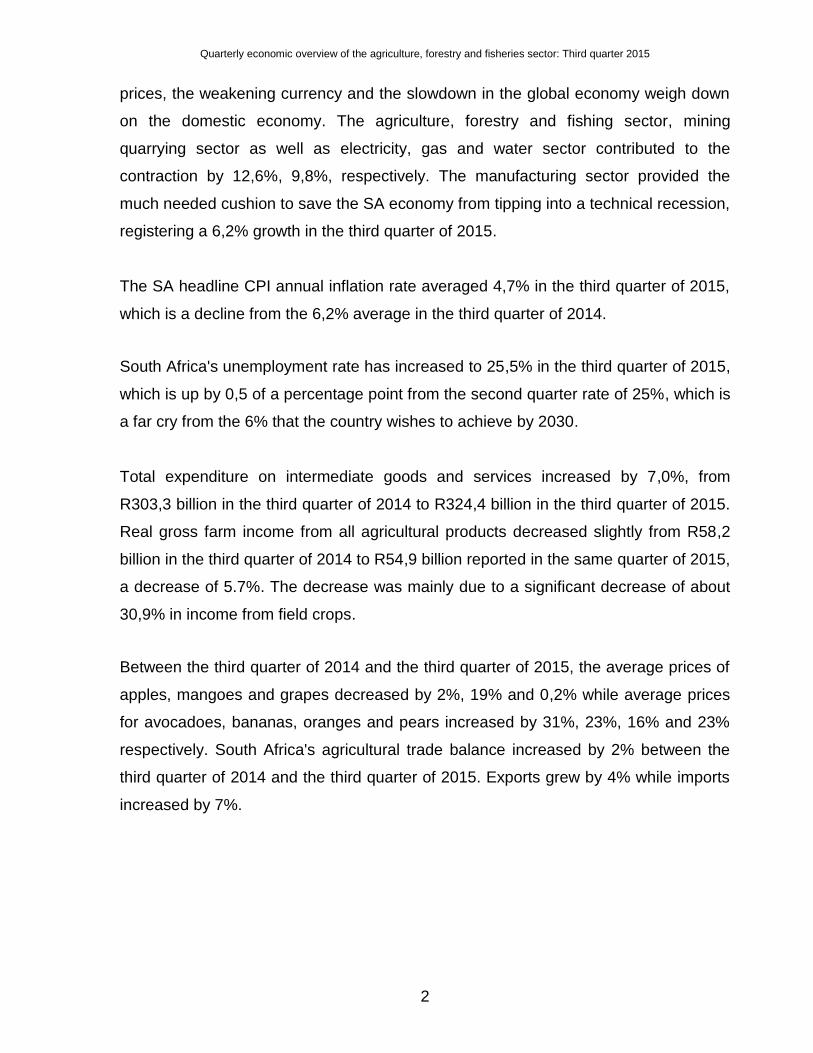
prices, the weakening currency and the slowdown in the global economy weigh down
on the domestic economy. The agriculture, forestry and fishing sector, mining
quarrying sector as well as electricity, gas and water sector contributed to the
contraction by 12,6%, 9,8%, respectively. The manufacturing sector provided the
much needed cushion to save the SA economy from tipping into a technical recession,
registering a 6,2% growth in the third quarter of 2015.
The SA headline CPI annual inflation rate averaged 4,7% in the third quarter of 2015,
which is a decline from the 6,2% average in the third quarter of 2014.
South Africa's unemployment rate has increased to 25,5% in the third quarter of 2015,
which is up by 0,5 of a percentage point from the second quarter rate of 25%, which is
a far cry from the 6% that the country wishes to achieve by 2030.
Total expenditure on intermediate goods and services increased by 7,0%, from
R303,3 billion in the third quarter of 2014 to R324,4 billion in the third quarter of 2015.
Real gross farm income from all agricultural products decreased slightly from R58,2
billion in the third quarter of 2014 to R54,9 billion reported in the same quarter of 2015,
a decrease of 5.7%. The decrease was mainly due to a significant decrease of about
30,9% in income from field crops.
Between the third quarter of 2014 and the third quarter of 2015, the average prices of
apples, mangoes and grapes decreased by 2%, 19% and 0,2% while average prices
for avocadoes, bananas, oranges and pears increased by 31%, 23%, 16% and 23%
respectively. South Africa's agricultural trade balance increased by 2% between the
third quarter of 2014 and the third quarter of 2015. Exports grew by 4% while imports
increased by 7%.

Quarterly economic overview of the agriculture, forestry and fisheries sector: Third quarter 2015
3
1. GLOBAL OVERVIEW OF THE AGRICULTURE, FORESTRY AND FISHERIES ECONOMY
1.1 Global growth
Global economic growth remains moderate as the global economy continues to face a
number of downside risks resulting in marked down forecasts for short-term growth
rates in most economies. Global growth declined in the first half of 2015, reflecting a
further slowdown in emerging markets and a weaker recovery in advanced
economies. Commodity price declines are adversely affecting a number of economies
including a few advanced economies. However, economic recovery in advanced
economies is expected to pick up slightly, with the US and the UK leading the
recovery process as output increases while unemployment drops in these economies.
The euro area and Japan remain a concern although the euro area registered a
modest recovery while Japan is forecast to return to positive economic growth.
Economic growth in the US was weaker than expected despite a strong rebound in the
second quarter, reflecting setbacks to economic activity in the first quarter. However,
the unemployment rate in the US continues to decline despite modest growth. In the
United Kingdom, GDP expanded at an annualised rate of 2,25% in the first half of
2015, while the unemployment rate is now back at near its pre-crisis average of about
5,5%. Japan’s strong rebound in the first quarter of 2015 was followed by a drop in
activity in the second quarter, with consumption and exports falling below expectations
in the first half of 2015 (IMF, 2015).
Global economic growth has been revised downwards and is forecast at 3,1% for
2015, slightly lower than the 3,4% growth in 2014 and is projected to rise slightly to
3,6% in 2016 as global activity is projected to pick up (IMF, 2015). Figure 1 depicts
selected advanced economies’ GDP rates for the third quarters of 2014 and 2015.
Quarterly economic overview of the agriculture, forestry and fisheries sector: Third quarter 2015
4
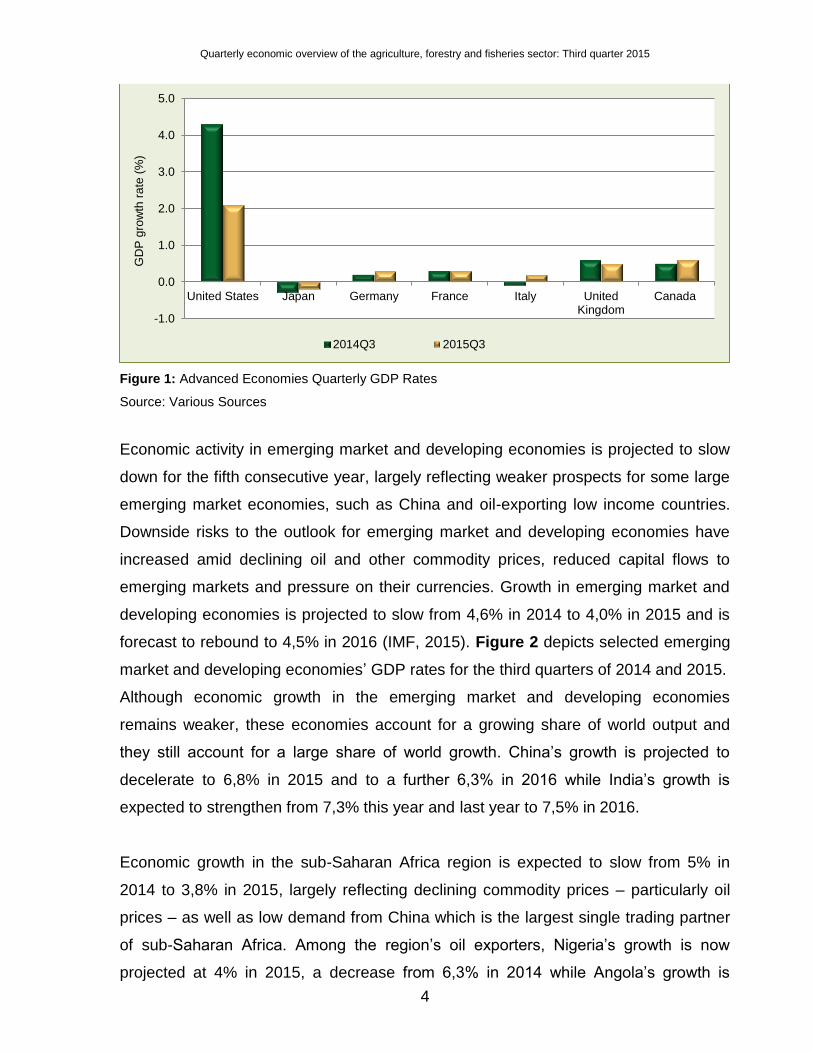
Figure 1: Advanced Economies Quarterly GDP Rates
Source: Various Sources
Economic activity in emerging market and developing economies is projected to slow
down for the fifth consecutive year, largely reflecting weaker prospects for some large
emerging market economies, such as China and oil-exporting low income countries.
Downside risks to the outlook for emerging market and developing economies have
increased amid declining oil and other commodity prices, reduced capital flows to
emerging markets and pressure on their currencies. Growth in emerging market and
developing economies is projected to slow from 4,6% in 2014 to 4,0% in 2015 and is
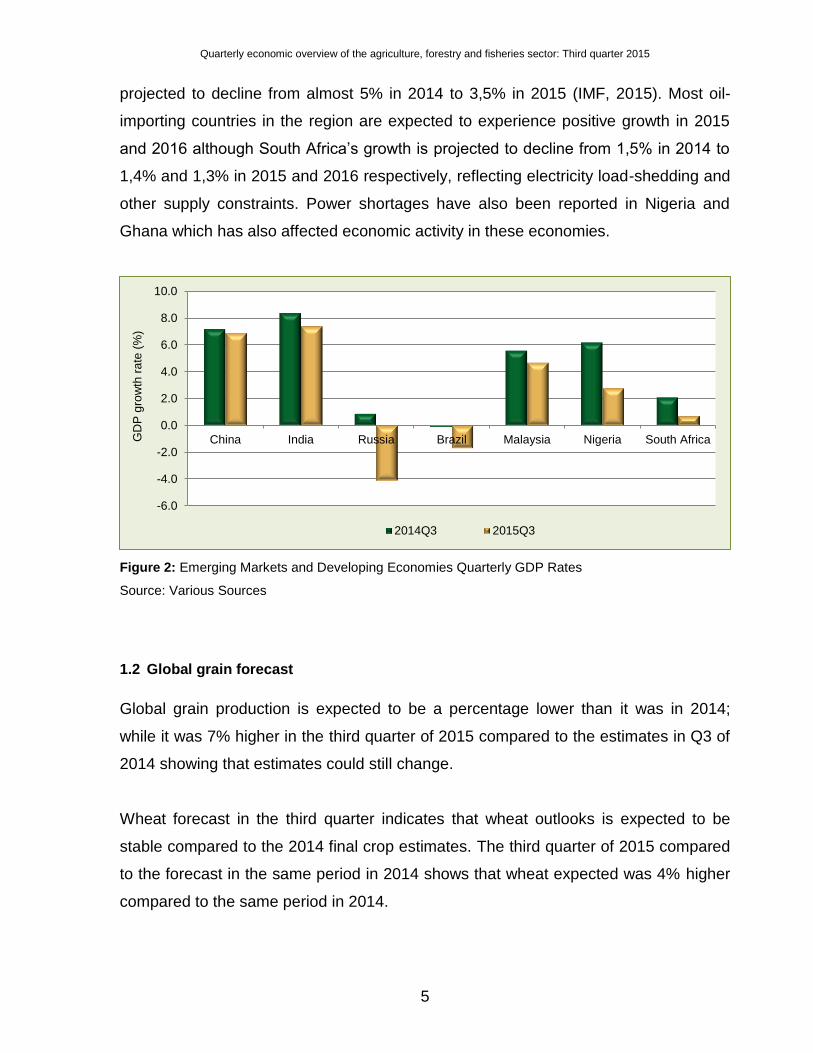
forecast to rebound to 4,5% in 2016 (IMF, 2015). Figure 2 depicts selected emerging
market and developing economies’ GDP rates for the third quarters of 2014 and 2015.
Although economic growth in the emerging market and developing economies
remains weaker, these economies account for a growing share of world output and
they still account for a large share of world growth. China’s growth is projected to
decelerate to 6,8% in 2015 and to a further 6,3% in 2016 while India’s growth is
expected to strengthen from 7,3% this year and last year to 7,5% in 2016.
Economic growth in the sub-Saharan Africa region is expected to slow from 5% in
2014 to 3,8% in 2015, largely reflecting declining commodity prices – particularly oil
prices – as well as low demand from China which is the largest single trading partner
of sub-Saharan Africa. Among the region’s oil exporters, Nigeria’s growth is now
projected at 4% in 2015, a decrease from 6,3% in 2014 while Angola’s growth is
-1.0
0.0
1.0
2.0
3.0
4.0
5.0
United States Japan Germany France Italy UnitedKingdom
Canada
GD
P g
row
th r
ate
(%
)
2014Q3 2015Q3
Quarterly economic overview of the agriculture, forestry and fisheries sector: Third quarter 2015
5
projected to decline from almost 5% in 2014 to 3,5% in 2015 (IMF, 2015). Most oil-
importing countries in the region are expected to experience positive growth in 2015
and 2016 although South Africa’s growth is projected to decline from 1,5% in 2014 to
1,4% and 1,3% in 2015 and 2016 respectively, reflecting electricity load-shedding and
other supply constraints. Power shortages have also been reported in Nigeria and
Ghana which has also affected economic activity in these economies.
Figure 2: Emerging Markets and Developing Economies Quarterly GDP Rates
Source: Various Sources
1.2 Global grain forecast
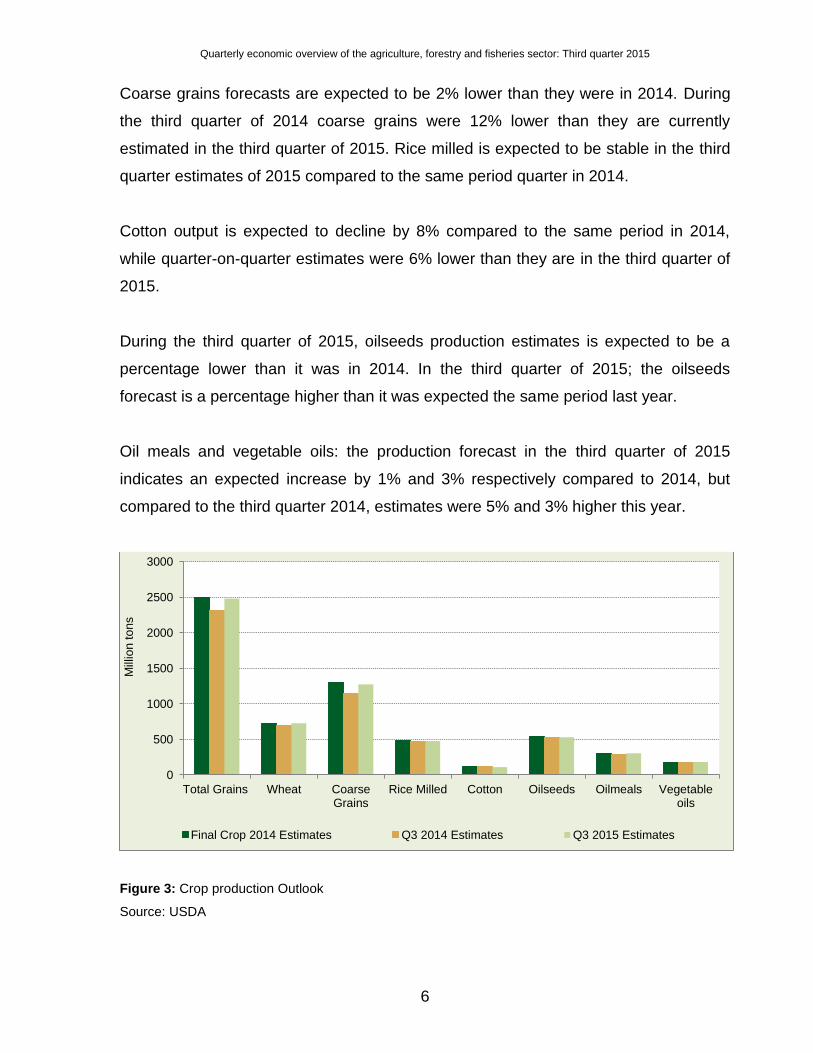
Global grain production is expected to be a percentage lower than it was in 2014;
while it was 7% higher in the third quarter of 2015 compared to the estimates in Q3 of
2014 showing that estimates could still change.
Wheat forecast in the third quarter indicates that wheat outlooks is expected to be
stable compared to the 2014 final crop estimates. The third quarter of 2015 compared
to the forecast in the same period in 2014 shows that wheat expected was 4% higher
compared to the same period in 2014.
-6.0
-4.0
-2.0
0.0
2.0
4.0
6.0
8.0
10.0
China India Russia Brazil Malaysia Nigeria South AfricaGD
P g
row
th r
ate
(%
)
2014Q3 2015Q3
Quarterly economic overview of the agriculture, forestry and fisheries sector: Third quarter 2015
6
Coarse grains forecasts are expected to be 2% lower than they were in 2014. During
the third quarter of 2014 coarse grains were 12% lower than they are currently
estimated in the third quarter of 2015. Rice milled is expected to be stable in the third
quarter estimates of 2015 compared to the same period quarter in 2014.
Cotton output is expected to decline by 8% compared to the same period in 2014,
while quarter-on-quarter estimates were 6% lower than they are in the third quarter of
2015.
During the third quarter of 2015, oilseeds production estimates is expected to be a
percentage lower than it was in 2014. In the third quarter of 2015; the oilseeds
forecast is a percentage higher than it was expected the same period last year.
Oil meals and vegetable oils: the production forecast in the third quarter of 2015
indicates an expected increase by 1% and 3% respectively compared to 2014, but
compared to the third quarter 2014, estimates were 5% and 3% higher this year.
Figure 3: Crop production Outlook
Source: USDA
0
500
1000
1500
2000
2500
3000
Total Grains Wheat CoarseGrains
Rice Milled Cotton Oilseeds Oilmeals Vegetableoils
Mill
ion
to
ns
Final Crop 2014 Estimates Q3 2014 Estimates Q3 2015 Estimates

Quarterly economic overview of the agriculture, forestry and fisheries sector: Third quarter 2015
7
1.3 Global food prices
International food commodity prices continued to decline during the third quarter of
2015 as ample supplies, a slump in energy prices and concerns over China’s
economic slowdown all contributed to the sharpest decrease of the FAO Food Price
Index (FFPI) in almost seven years (FAO, 2015). The FFPI averaged 158.4 in the third
quarter of 2015, a sharp 20,2% drop from the 198.4 average in the third quarter of
2014. Figure 4 depicts the price indices of five commodity groups.
Figure 4: Quarterly Global Food Price Indices
Source: FAO
0.0
50.0
100.0
150.0
200.0
250.0
300.0
Food PriceIndex
Meat PriceIndex
Dairy PriceIndex
Cereals PriceIndex
Oils Price Index Sugar PriceIndex
Ind
ex (
20
02
-20
04
= 1
00
)
2014/Q3 2015/Q3

Quarterly economic overview of the agriculture, forestry and fisheries sector: Third quarter 2015
8
2. THE STATE OF THE DOMESTIC ECONOMY IN AGRICULTURE, FORESTRY AND FISHERIES
2.1 Growth
The SA economy grew by a seasonally adjusted and annualised 0,7% quarter-on-
quarter (q/q) during the third quarter of 2015, averting a technical recession following a
1,3% contraction in the second quarter of 2015. The domestic economy remains
under pressure with factors such as low commodity prices, the weakening currency
and the slowdown in the global economy weighing it down. The agriculture, forestry
and fisheries sector contracted by 12,6% in the 2015, largely due to the worst drought
to hit the country in over thirty years. The 9,8% contraction in the mining and quarrying
sector as well as the 8% contraction in the electricity, gas and water sector also
contributed to the modest growth. The manufacturing sector provided the much
needed cushion to save the SA economy from tipping into a technical recession,
registering a 6,2% growth in the third quarter of 2015 following two consecutive sector
contractions in the first and second quarters. Figure 5 depicts the SA quarterly GDP
growth trend since 2011.
On a year-on-year basis, the SA GDP grew by 1,0% in the third quarter of 2015, which
is slightly less than the 1,6% growth recorded in the third quarter of 2014. The
agriculture, forestry and fishing (AFF) sector remained the worst performer on a y/y
basis, contracting by 16,2% y/y in the third quarter of 2015 while the mining and
manufacturing sectors both grew by 1,4% y/y. Looking at the first nine months of 2015
compared to the first nine months of 2014, the SA economy grew by 1,5% with the
mining sector recording the largest growth rate of 4,3% y/y.

Quarterly economic overview of the agriculture, forestry and fisheries sector: Third quarter 2015
9
Figure 5: Domestic real GDP growth
Source: Stats SA
The AFF sector remained in recession during the third quarter of 2015 following three
consecutive contractions as the country continues to battle its worst drought in recent
history which has resulted in a number of provinces being declared disaster areas.
Field crop production, particularly maize production, was the worst affected by drought
resulting in a R5,0 billion (31%) decline in gross income from field crops in the third
quarter of 2015 compared to the third quarter of 2014. Gross income from maize
declined by R4,6 billion (39%) in the third quarter of 2015 compared to the third
quarter of 2014. During the first nine months of 2015, the AFF sector contracted by
7,3% y/y compared to the first nine months of 2014. Figure 6 depicts the agriculture,
forestry and fishing sector's quarterly growth trend since the first quarter of 2011.
-2.0
-1.0
0.0
1.0
2.0
3.0
4.0
5.0
6.0
Q1
/11
Q2
/11
Q3
/11
Q4
/11
Q1
/12
Q2
/12
Q3
/12
Q4
/12
Q1
/13
Q2
/13
Q3
/13
Q4
/13
Q1
/14
Q2
/14
Q3
/14
Q4
/14
Q1
/15
Q2
/15
Q3
/15
(%
)
Q/Q Y/Y

Quarterly economic overview of the agriculture, forestry and fisheries sector: Third quarter 2015
10
Figure 6: Seasonally adjusted and annualised quarterly growth in agriculture, forestry and fishing
sector.
Source: Stats SA
2.2 Inflation
The SA inflation rate remained within the Reserve Bank’s target range for the past
fourteen months in line with the low global inflation rate which has been supported
largely by lower commodity prices. The SA headline CPI annual inflation rate
averaged 4,7% in the third quarter of 2015, which is a decline from the 6,2% average
in the third quarter of 2014. The headline CPI has been rising each month during the
second quarter of 2015 but was relatively stable during the third quarter. Lower oil
prices and the recent easing off of global food prices have largely contributed to lower
headline CPI inflation. Domestic food price inflation remained below the headline CPI
inflation since June 2015 although local food prices are expected to go up as a result
of drought that continues to adversely affect plantings in many provinces. Figure 7
-25.0
-20.0
-15.0
-10.0
-5.0
0.0
5.0
10.0
15.0
(%
)
Q/Q

Quarterly economic overview of the agriculture, forestry and fisheries sector: Third quarter 2015
11
shows the price trends in the headline CPI as well as the CPI for food since the
beginning of 2013.
Figure 7: SA headline CPI and CPI for food
Source: Stats SA
The annual CPI for food averaged 4,4% y/y in the third quarter of 2015, which is a
significant drop from the 9,1% y/y average in the third quarter of 2014. Food price
inflation remained flat at 4,4% y/y during July, August and September 2015. Prices of
bread and cereals, which have been declining monthly since December 2014, started
rising again during the third quarter of 2015, reflecting reduced plantings of field crops
due to the drought. The CPI for bread and cereal averaged 5,7% y/y in the third
quarter of 2015. The CPI inflation for oils and fats also started rising, averaging 5,1%
y/y in the third quarter of 2015, which is a significant rise from the 0,9% y/y average
during the third quarter of 2014. The prices of milk, eggs and cheese declined further
during the third quarter of 2015, averaging 3,9% y/y, a significant drop from the 12,5%
y/y average in the third quarter of 2014 in line with the sharp drop in global dairy
prices. However, there are concerns that higher maize prices due to drought may
push feed prices up which might also result in rising prices for poultry and eggs. The
-15.0
-10.0
-5.0
0.0
5.0
10.0
15.0
20.0 (
%)
Q/Q
Quarterly economic overview of the agriculture, forestry and fisheries sector: Third quarter 2015
12
CPI for fruit remained relatively low, averaging 2,7% y/y, while the CPI for vegetables
remained in negative territory throughout the third quarter of 2015, averaging -1,7%
y/y which is a sharp drop from the 12,9% y/y average in the third quarter of 2014.
Figure 8 depicts consumer price trends of selected food items since the beginning of
2014.
The producer price inflation remained fairly stable during the first three quarters of
2015, averaging 3,1% in the first quarter and 3,4% in both the second and third
quarters of 2015. The PPI for AFF on the other hand raised significantly throughout
the first three quarters of 2015, from a 1,0% y/y deflation in the first quarter, to a 4,0%
y/y average in the second quarter, increasing further to 6,4% y/y in the third quarter.
The main contributor to the rising PPI for AFF was food products which averaged
5,3% y/y in the third quarter of 2015 from 5,2% y/y average in the second quarter. The
largest contributors to rising prices for food products were meat and meat products
which averaged 7,5% y/y in the third quarter, oils and fats which averaged 7,8% y/y
and grain mill products which averaged 7,4% y/y in the third quarter of 2015.

Quarterly economic overview of the agriculture, forestry and fisheries sector: Third quarter 2015
13
Figure 8: CPI for food and selected food items
Source: Stats SA
2.3 Employment
The Quarterly Labour Force Survey (QLFS) by Statistics South Africa (Stats SA)
indicate that South Africa's unemployment rate has increased to 25,5% in the third
quarter of 2015. This is up by 0,5 of a percentage point from the second quarter rate
of 25%, but is still an improvement from the first quarter rate of 26,4%. The number of
unemployed people increased by 188 000 in the third quarter, compared to the second
quarter. Of the working age population of 36,1 million, 15,8 million were employed
while 5,4 million were unemployed and 14,9 million were not economically active,
therefore resulting in an unemployment rate of 25,5%, an absorption rate of 43,8%
and a labour force participation rate of 58,8%. The formal sector accounted for the
-4.0
-2.0
0.0
2.0
4.0
6.0
8.0
10.0
12.0
14.0
16.0P
erc
en
tag
e c
ha
ng
e (
y/y
)
Food Bread & cereals Meat
Fish Milk, eggs & cheese Oils & fats
Fruit Vegetables

Quarterly economic overview of the agriculture, forestry and fisheries sector: Third quarter 2015
14
largest share of employment at 69,1%, while agriculture accounted for the lowest
share (5,7%). Discouraged work-seekers accounted for 15% of the not economically
active population, while the share of other (not economically active) was 85%.
The results for the third quarter of 2015 reflect a quarterly decrease in the not
economically active population (200 000) and a quarterly increase in the economically
active population (359 000). South Africa's official unemployment rate increased by
0,5 of a percentage point in the third quarter of 2015. The 25,5% unemployment rate
is a far cry from the 6% that the country wishes to achieve by 2030, according to the
National Development Plan (NDP). The absorption rate is also far off the NDP goal at
43,8%, compared to its aim of 61% absorption rate. In the third quarter, the absorption
rate was lowest among youth aged between 15 and 24, while it was highest among
adults aged between 34 and 64. The highest share of the employed population with
tertiary qualifications is found among the white and Indian population groups. In the
third quarter, 48,6% of employed white people and 33,8% employed Indians had a
tertiary qualification. More than half of the black African and coloured populations had
an educational level of less than matric.
Six of South Africa's nine provinces recorded increases in unemployment. The
Northern Cape (2,1%) and Gauteng (1,8%) had the highest increases in
unemployment, on a quarter-to-quarter basis. Only the Western Cape (-1,1%),
Mpumalanga (-1%) and Limpopo (-0,1%) have recorded decreases in unemployment
in the third quarter. The decrease in the Western Cape could be due to the seasonal
agricultural activities in the province.
Figure 9 below shows that employment in agriculture sector increased in the third
quarter of 2015 compared to the third quarter of 2014.

Quarterly economic overview of the agriculture, forestry and fisheries sector: Third quarter 2015
15
Figure 9: Total number of people employed in the agriculture sector between 2013 and 2015.
Source: DAFF
The number of people employed in the agricultural sector increased by 30,8% in the
third quarter of 2015 from 686 000 persons in the third quarter of 2014 to 897 000
persons in the third quarter of 2015. Of the 211 000 jobs created in the agricultural
sector in the third quarter of 2015 compared to the same quarter of 2014, 110 000
jobs were created for men while 102 000 jobs were created for women. In total, the
agricultural sector comprised of 308 000 women and 589 000 men in the third quarter
of 2015 compared to 206 000 women and 479 000 men in the same quarter of 2014.
It is important to note that the agricultural sector unexpectedly added a significant
number of jobs even after a severe drought earlier this year sharply curbed output.
Agriculture added 211 000 jobs between the third quarter of last year and the third
quarter of this year (year-on-year), and 28 000 jobs were also added between the
second quarter of this year and the third quarter of this year (quarter on quarter). The
0
100
200
300
400
500
600
700
800
900
1000
Q12013
Q22013
Q32013
Q42013
Q12014
Q22014
Q32014
Q42014
Q12015
Q22015
Q32015
Th
ou
sa
nd
Men Women Total

Quarterly economic overview of the agriculture, forestry and fisheries sector: Third quarter 2015
16
increase may be attributed to farmers needing more workers to harvest produce and
prepare fields for planting season.
Figure 10 shows that employment increased in six provinces and decreased in other
provinces in the third quarter of 2015 compared to the same quarter of 2014.
Agriculture employment in the Western Cape, KwaZulu-Natal, North West and
Limpopo increased significantly by 83,7%, 70,5%, 43,4% and 30,6% respectively
between the two quarters. The Western Cape still remained with the highest
agricultural employment compared to other provinces in the third quarter of 2015.
During the same period the agriculture employment in the Free State and
Mpumalanga also increased by 19,5% and 16,3% respectively. However, agricultural
employment in the Eastern Cape was relatively flat between the two quarters, while
agricultural employment in Gauteng and the Northern Cape decreased by 46,4% and
6,6% respectively.
The 2015 third (QLFS) also indicated that 1,4 million people were involved in
subsistence farming in the third quarter of 2015 compared to 1,3 million in the same
quarter of 2014, an increase of 17,6%.

Quarterly economic overview of the agriculture, forestry and fisheries sector: Third quarter 2015
17
Figure 10: Provincial agriculture employment between 2014 and 2015.
Source: DAFF
Figure 11 above shows the number of people involved in subsistence farming in all
provinces in the third quarter of 2015 compared to the same quarter of 2014.
KwaZulu-Natal had the highest number of (498 000) people involved in subsistence
farming in the third quarter of 2015 compared to (310 000) in the third quarter of 2014,
an increase of 60,6%, while the Eastern Cape had (479 000) people involved in
subsistence farming in the third quarter of 2015 compared to (408 000) in the same
quarter of 2014, an increase of 17,4%. During the same period Limpopo had (186
000) people involved in subsistence farming compared to (157 000), an increase of
18,5%, while Mpumalanga had (103 000) people involved in subsistence farming
compared to 71 000. The number of people involved in subsistence farming in the
0
50
100
150
200
250
300
Th
ou
sa
nd
2014 Q3 2015 Q3

Quarterly economic overview of the agriculture, forestry and fisheries sector: Third quarter 2015
18
Northern Cape also increased from (8 000) in the third quarter of 2014 to (17 000) in
the third quarter of 2015. While the number of people involved in subsistence farming
in Gauteng decreased slightly from (43 000) to (42 000) between the two quarters.
The number of people involved in subsistence farming in Free State decreased
significantly from (65 000) in the third quarter of 2014 to (35 000) in the third quarter of
2015, a decrease of 46,2%. The number of people involved in subsistence farming in
North West also decreased significantly by 76,2% in the third quarter of 2015
compared to the same quarter of 2014. During the same period the number people
involved in subsistence farming in Western Cape decreased from (15 000) to (10 000).
Figure 11: Provincial number of people involved in subsistence farming between the Third quarters of
2014 and 2015
Source: DAFF
0
100
200
300
400
500
600
Th
ou
sa
nd
2014 Q3 2015 Q3

Quarterly economic overview of the agriculture, forestry and fisheries sector: Third quarter 2015
19
2.4 Expenditure on intermediate goods and services by the agricultural sector
The total expenditure on intermediate goods and services was reported at R324,4
billion in the third quarter of 2015 compared to R306,0 billion in the second quarter of
2015, an increase of 6,0%. Compared to a year ago the total expenditure on
intermediate goods and services increased by 7,0% from R303,3 billion in the third
quarter of 2014 to R324,4 billion in the third quarter of 2015.
Figure 12 shows the total expenditure on fuel, farm feeds, fertilisers, seeds and plants,
as well as farm services. The increase in total expenditure in the third quarter of 2015
was attributed to an increase in expenditure on seeds and plants which increased
significantly by (50,0%) compared to the previous quarter. The expenditure on fertiliser
and farm feed also increased by (18,2%) and (4,2%) respectively, while the
expenditure on farm services and fuel decreased slightly by (16,7%) and (0,1%)
respectively.
0.0
100.0
200.0
300.0
400.0
500.0
600.0
700.0
800.0
900.0
1 000.0
Q12013
Q22013
Q32013
Q42013
Q12014
Q22014
Q32014
Q42014
Q12015
Q22015
Q32015
R b
illio
n
Fuel Farm Feeds Fertiliser seeds and plants farm services

Quarterly economic overview of the agriculture, forestry and fisheries sector: Third quarter 2015
20
Figure 12: Trends in the expenditure on fuel, farm feeds, fertilisers, seeds & plants and farm services
between third quarter of 2014 and 2015
Source: DAFF
2.5 Nominal gross farm income and net farm income from agricultural products
Figure 13 below shows the gross income from field crops, horticulture and animal
products between 2014 and 2015. The nominal real gross income from all agricultural
products decrease to R54.9 billion in the third quarter of 2015 from R69.8 billion in the
second quarter of 2015, a decrease of 21.4%. This was due to a huge decrease of
56.6% in income from field crops which decreased to R11.1 billion in the third quarter
of 2015 from R25.5 billion in the second quarter of 2015. The income from horticulture
and animal products also decreased slightly between the two quarters by 2,3% and
0,4% respectively. The huge decrease in income from field crops was due to the
significant drop in income from almost all crops such as chicory root, wattle bark,
soya beans, Lucerne seed, sunflower seed, cotton, groundnuts, oats, tobacco, grain
sorghum, dry beans, barley, wheat and maize which decreased by 100,0%, 95,8%,
95,7%, 95,0%, 94,1%, 94,4%, 86,1%, 85,8%, 76,2%, 73,5%, 69,8%, 61,3%, 57,7%
and 49,1% respectively. The income from other field crops also decreased slightly by
13,9%. While gross income from canola, sugar cane and hay increased by 31% and
36.8%, 29,8% and 1,6% respectively.
According to BFAP 2015, South African maize prices increased significantly since the
beginning of 2015 as dry and hot weather during the growing season led to well below
average yield levels. The 2015 domestic maize crop is expected to reach only 9,8
million tons, which is 31% less than the 14,2 million tons harvested in 2014. The
impact of the drought early in 2015 was more severe in the western parts of the maize
production regions, where proportionally more white maize is produced compared to

Quarterly economic overview of the agriculture, forestry and fisheries sector: Third quarter 2015
21
the eastern and irrigation areas, which tend to favour yellow maize. The disappointing
yields, together with the reduced area planted to white maize, resulted in a decline of
39% in white maize production reaching merely 4,7 million tons in 2015.
Gross income from horticulture decreased slightly by 2,3% to R17,0 billion from R17,4
billion during the same period. The decrease was largely supported by a decline in
income from viticulture, deciduous fruit, dried fruit and tea which declined by 67,6%,
44,4%, 39,2% and 31,8% respectively. Compared to a year ago real gross farm
income from all agricultural products decreased slightly from R58,2 billion in the third
quarter of 2014 to R54,9 billion reported in the same quarter of 2015, a decrease of
5,7%. During this period the decrease was mainly due to a significant decrease of
about 30,9% in income from field crops, while animal and horticulture increased
slightly by 5,6% and 1,5% respectively.
Figure 13: Trends in nominal gross farm income between 32014 and 2015.
Source: DAFF
0.0
5.0
10.0
15.0
20.0
25.0
30.0
35.0
Q12013
Q22013
Q32013
Q42013
Q12014
Q22014
Q32014
Q42014
Q12015
Q22015
Q32015
R b
illio
n
Field crops Horticulture Animal products

Quarterly economic overview of the agriculture, forestry and fisheries sector: Third quarter 2015
22
Figure 14 illustrates the net farm income trends between 2014 and 2015. The net farm
income is estimated at R15,2 billion in the third quarter of 2015 compared to R21,2
billion in the third quarter of 2014, a decrease of 28,2%. The decrease in net farm
income during this period was mainly due to a decrease in income from field crops
which decreased by 30,9%. While income from animal products and horticulture
increased slightly by 5,6% and 1,5% respectively.
Figure 14: Trends in the net farm income between 32014 and 2015.
Source: DAFF
0.0
5.0
10.0
15.0
20.0
25.0
30.0
35.0
40.0
Q12013
Q22013
Q32013
Q42013
Q12014
Q22014
Q32014
Q42014
Q12015
Q22015
Q32015
R b
illio
n
Net Farm Income
Quarterly economic overview of the agriculture, forestry and fisheries sector: Third quarter 2015
23
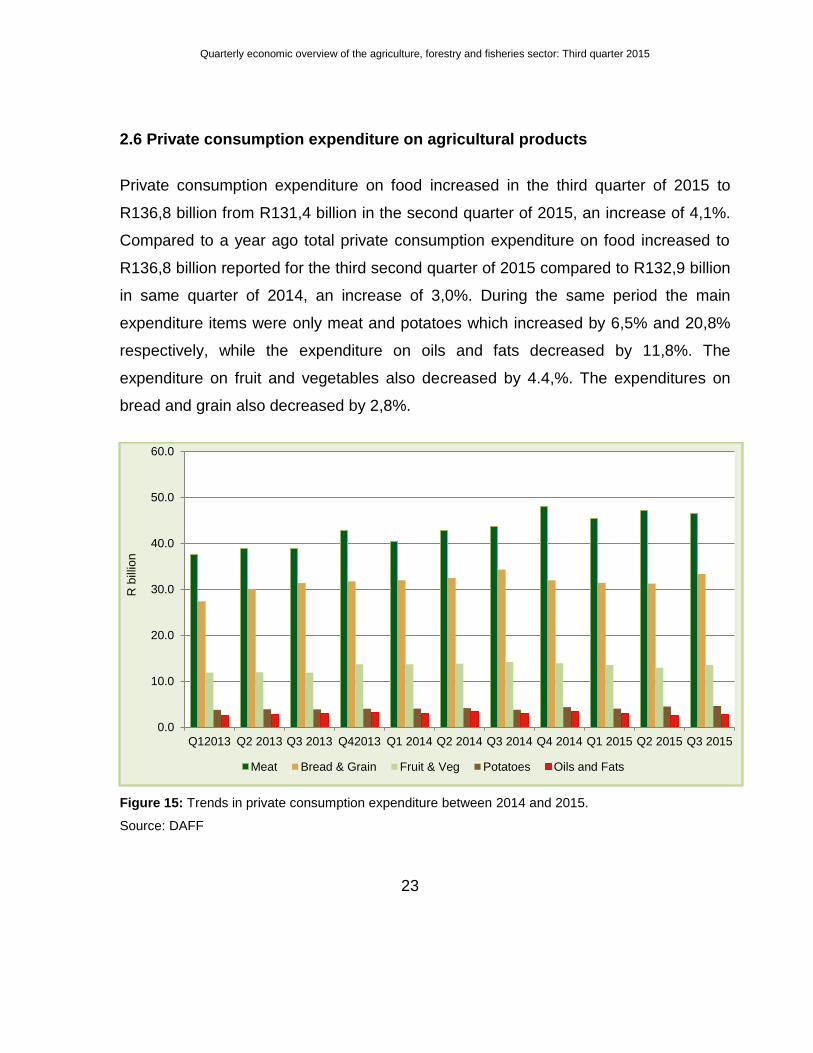
2.6 Private consumption expenditure on agricultural products
Private consumption expenditure on food increased in the third quarter of 2015 to
R136,8 billion from R131,4 billion in the second quarter of 2015, an increase of 4,1%.
Compared to a year ago total private consumption expenditure on food increased to
R136,8 billion reported for the third second quarter of 2015 compared to R132,9 billion
in same quarter of 2014, an increase of 3,0%. During the same period the main
expenditure items were only meat and potatoes which increased by 6,5% and 20,8%
respectively, while the expenditure on oils and fats decreased by 11,8%. The
expenditure on fruit and vegetables also decreased by 4.4,%. The expenditures on
bread and grain also decreased by 2,8%.
Figure 15: Trends in private consumption expenditure between 2014 and 2015.
Source: DAFF
0.0
10.0
20.0
30.0
40.0
50.0
60.0
Q12013 Q2 2013 Q3 2013 Q42013 Q1 2014 Q2 2014 Q3 2014 Q4 2014 Q1 2015 Q2 2015 Q3 2015
R b
illio
n
Meat Bread & Grain Fruit & Veg Potatoes Oils and Fats

Quarterly economic overview of the agriculture, forestry and fisheries sector: Third quarter 2015
24
3 Review of agricultural markets
3.1 Grains market review
The price of white and yellow maize has increased by 81% and 56% respectively.
Maize prices remain strong as result of the lack of rain and the weaker rand. The
erratic rainfall has delayed planting decisions with the planting period, narrowing for
other major producing areas. The price of wheat, sunflower and sorghum increased by
9%, 30% and 24%, while the price of soya beans declined by 2% in the third quarter of
2015 compared to the same period in 2014. The weaker rand and the drought
continue to have an upward effect on local prices. Soya beans’ prices have decreased
due to the rise in area under the crop.
Figure 16: Quarterly grain price trends
Source: Safex
0
1000
2000
3000
4000
5000
6000
7000
Q22012
Q32012
Q42012
Q12013
Q22013
Q32013
Q42013
Q12014
Q22014
Q32014
Q42014
Q12015
Q22015
Q32015
R/t
on
White maize Yellow maize Wheat Sunflower Soya bean Sorghum
Quarterly economic overview of the agriculture, forestry and fisheries sector: Third quarter 2015
25
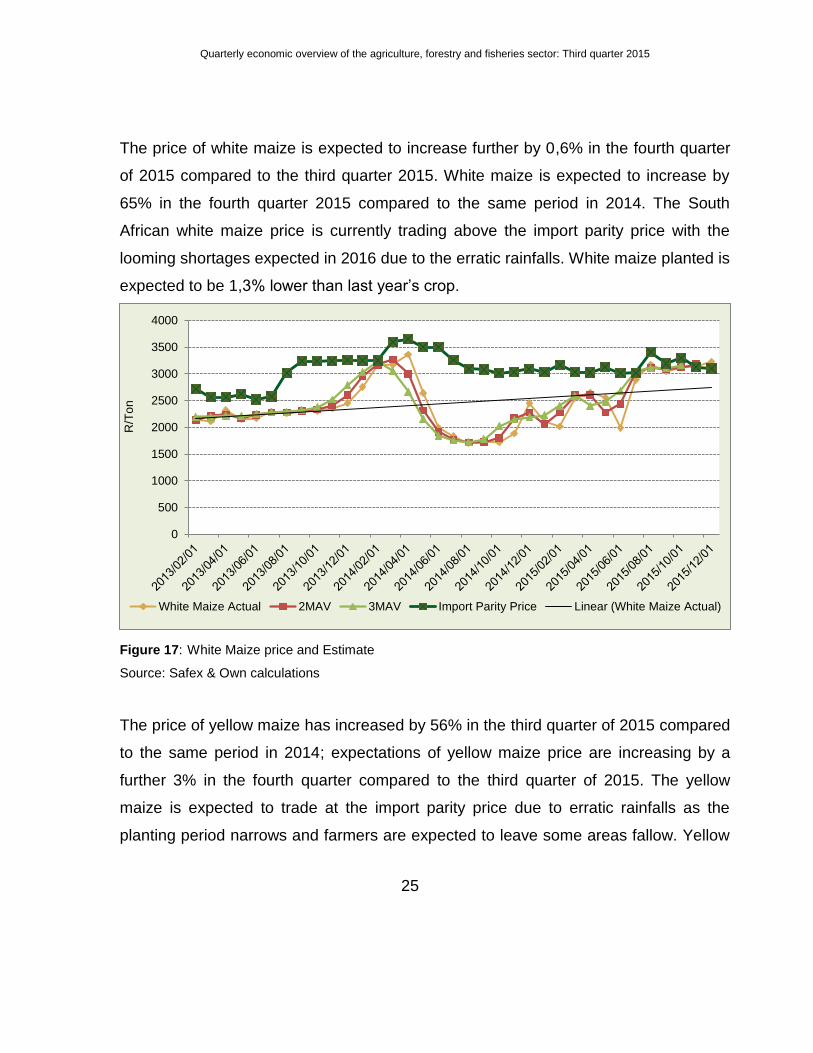
The price of white maize is expected to increase further by 0,6% in the fourth quarter
of 2015 compared to the third quarter 2015. White maize is expected to increase by
65% in the fourth quarter 2015 compared to the same period in 2014. The South
African white maize price is currently trading above the import parity price with the
looming shortages expected in 2016 due to the erratic rainfalls. White maize planted is
expected to be 1,3% lower than last year’s crop.
Figure 17: White Maize price and Estimate
Source: Safex & Own calculations
The price of yellow maize has increased by 56% in the third quarter of 2015 compared
to the same period in 2014; expectations of yellow maize price are increasing by a
further 3% in the fourth quarter compared to the third quarter of 2015. The yellow
maize is expected to trade at the import parity price due to erratic rainfalls as the
planting period narrows and farmers are expected to leave some areas fallow. Yellow
0
500
1000
1500
2000
2500
3000
3500
4000
R/T
on
White Maize Actual 2MAV 3MAV Import Parity Price Linear (White Maize Actual)

Quarterly economic overview of the agriculture, forestry and fisheries sector: Third quarter 2015
26
maize planted this year is expected to be 6,3% lower than the last year’s crop.
Figure 18: Yellow Maize price & Estimate
Source: Safex & Own Calculations
Producer deliveries have decreased by 52% for maize compared to the same period
in 2015. White and yellow maize deliveries declined by 42% and 52%. Local demand
for white maize decreased by 34%, while it increased by 66% for yellow maize. Maize
imports increased by 323 619 tons in the third quarter compared to the same period in
2015. Exports decreased by 28% and 92% for white and yellow maize respectively.
0
500
1000
1500
2000
2500
3000
3500
4000
Mill
ion
To
ns
Yellow Maize Actual 2MVA 3MVA Import Parity Price Linear (Yellow Maize Actual)

Quarterly economic overview of the agriculture, forestry and fisheries sector: Third quarter 2015
27
Figure 19: Maize futures prices
Source: Safex/Sagis
The price of wheat has increased by 9,5% in the Ms. E. Alexander third quarter of
2015 compared to the same period in 2014. The price is expected to increase by 3%
in the fourth quarter compared to the third quarter 2015. Year-on-year in the fourth
quarter of 2015 the price is expected to be 13% higher.
0
1000
2000
3000
4000
5000
6000
7000
White Yellow Total White Yellow Total
2014 Q3 Q3 2015
Th
ou
sa
nd
s T
on
s
Producer deliveries Imports Local demand Exports

Quarterly economic overview of the agriculture, forestry and fisheries sector: Third quarter 2015
28
Figure 20: Wheat prices & Estimates
Source: Safex & Own calculations
Wheat deliveries in the third quarter of 2014 were 26% lower than the same period in
2014. Local demand increased by 2%, while imports and exports decreased by 12%
and 27% respectively.
2500
3000
3500
4000
4500
5000
Mill
ion
To
ns
Wheat Import Price Wheat Actual 2MVA 3MVA

Quarterly economic overview of the agriculture, forestry and fisheries sector: Third quarter 2015
29
Figure 21: Wheat deliveries
Source: Sagis
Sunflower: the price of sunflower increased by 30% in the third quarter of 2015
compared to the same period in 2014. The price is expected to increase further by 9%
compared to the third quarter 2015 price increase. Year-on-year in the fourth quarter,
it is expected that it will be 34,6% higher than it was in 2014.
Local deliveries increased by 45%, imports 38% and local demand increased by 6,2%
compared to the same period in the third quarter of 2014.
0
100
200
300
400
500
600
700
800
900
Porudcer Deliveries Imports Local demand Exports
''00
00
' to
ns
3rd Quarter 2014 3rd Quarter 2015

Quarterly economic overview of the agriculture, forestry and fisheries sector: Third quarter 2015
30
Figure 22: Sunflower Price & Estimates
Source: Safex & Own Calculation
The price of sunflower has decreased by 1,6% in the third quarter of 2015 compared to the
same period in 2014.
3000
3500
4000
4500
5000
5500
6000
6500
7000M
illio
n T
on
s
Sunflower Actual 2MVA 3MVA

Quarterly economic overview of the agriculture, forestry and fisheries sector: Third quarter 2015
31
Figure 23: Sunflower Producer Deliveries
Source: Sagis
The decrease in the price of soya beans is a result of the expected increase in the soya beans
acreage, which is expected to increase by a further 1,3% compared to last year.
0
100
200
300
400
500
600
700
800
Q1 2013 Q2 2013 Q3 2013 Q4 2013 Q1 2014 Q2 2014 Q3 2014 Q4 2014 Q1 2015 Q2 2015 Q3 2015
Th
ou
sa
nd
s to
ns
Producer deliveries Imports Total Demand

Quarterly economic overview of the agriculture, forestry and fisheries sector: Third quarter 2015
32
Figure 24: Soya beans prices
Source: Safex & Own Calculations
Producer deliveries in the third quarter of 2015 have decreased by 42% compared to
2014, while the demand has increased 42%. Imports totalled 61 121 tons compared to
1 892 tons in the same quarter in 2014. Exports were also high during the quarter from
zero tons exported during the same period in 2014 to 2 641 tons exported during the
third quarter of 2015.
3000
3500
4000
4500
5000
5500
6000
6500
7000
Mill
ion
To
ns
Soybeans Actual 2MVA 3MVA
Quarterly economic overview of the agriculture, forestry and fisheries sector: Third quarter 2015
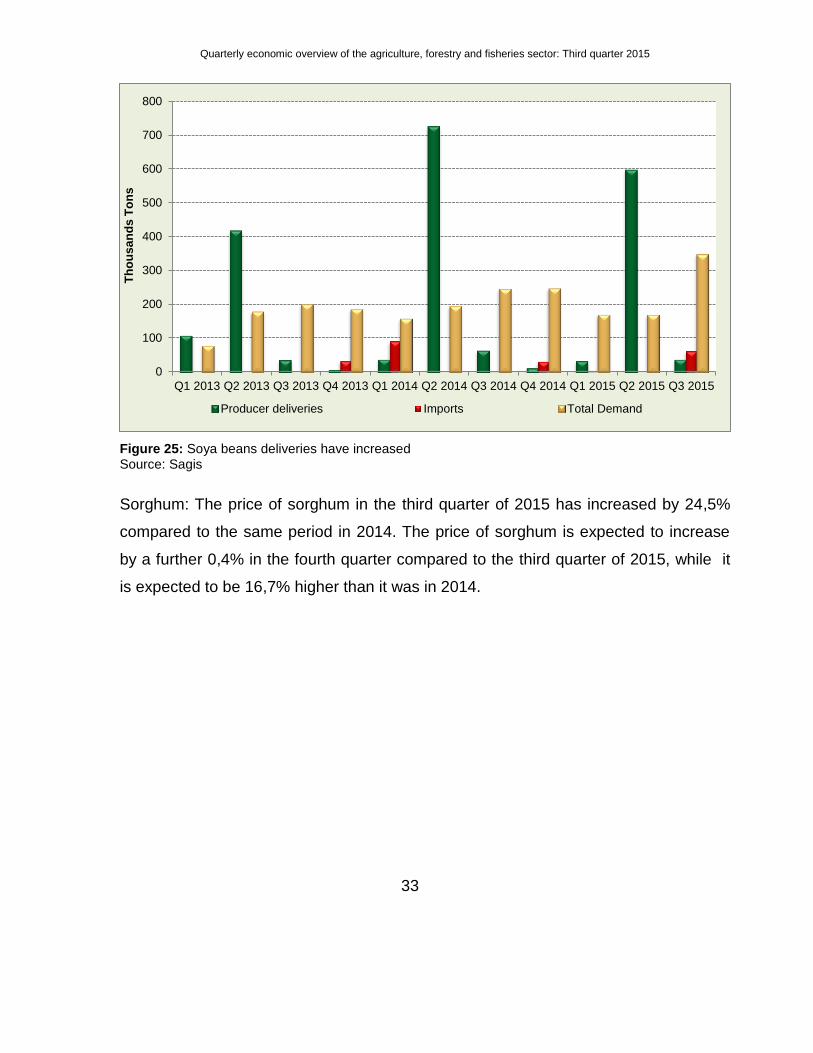
33
Figure 25: Soya beans deliveries have increased Source: Sagis
Sorghum: The price of sorghum in the third quarter of 2015 has increased by 24,5%
compared to the same period in 2014. The price of sorghum is expected to increase
by a further 0,4% in the fourth quarter compared to the third quarter of 2015, while it
is expected to be 16,7% higher than it was in 2014.
0
100
200
300
400
500
600
700
800
Q1 2013 Q2 2013 Q3 2013 Q4 2013 Q1 2014 Q2 2014 Q3 2014 Q4 2014 Q1 2015 Q2 2015 Q3 2015
Th
ou
sa
nd
s T
on
s
Producer deliveries Imports Total Demand

Quarterly economic overview of the agriculture, forestry and fisheries sector: Third quarter 2015
34
Figure 26: Sorghum prices Source: Sagis
Sorghum deliveries are expected to increase by 52%, while total demand is expected
to decrease by 8%.
1500
2000
2500
3000
3500
4000
Sorghum Actual 2MVA 3MVA
0
50 000
100 000
150 000
200 000
250 000
Q1 2013 Q2 2013 Q3 2013 Q4 2013 Q1 2014 Q2 2014 Q3 2014 Q4 2014 Q1 2015 Q2 2015 Q3 2015
To
ns
Prod deliveries Imports Total Demand

Quarterly economic overview of the agriculture, forestry and fisheries sector: Third quarter 2015
35
Figure 27: Sorghum deliveries Source: Sagis
3.2 Fruit and vegetable market review
The drought has had a crucial impact on this year's volume of fruit and vegetable
harvest in South Africa. Struggling commercial farmers are closing their businesses
while others are downsizing their operations and staff to keep afloat. Food shortages
is already starting to impact on prices while the double impact of job losses and the
decline in food production may be catastrophic for South Africa (Business Report,
2015). Figure 31 shows price trends of various fruits traded at Fresh Produce Markets
(FPMs) for the period third quarters of 2014 and 2015.
Figure 28: Average price trends of the various fruit types traded on fresh produce markets (FPMs) Source: DAFF
With the current effects of the drought, there has been a slow pace of deliveries from
0
5000
10000
15000
20000
25000
30000
35000
Q3 2014 Q4 2014 Q1 2015 Q2 2015 Q3 2015
R/t
on
Apples Avocadoes Bananas Oranges
Pears Mangoes Grapes

Quarterly economic overview of the agriculture, forestry and fisheries sector: Third quarter 2015
36
the fields to markets and most farmers would not want to waste their resources on a
harvest that would not meet production costs.
Between the third quarter of 2014 and the third quarter of 2015, the average prices of
apples, mangoes and grapes decreased by 2%, 19% and 0,2% respectively, while
average prices for avocadoes, bananas, oranges and pears increased by 31%, 23%,
16% and 23% respectively.
The volume of apples sold at local fresh produce markets has been increasing since
the 2008/09 marketing year (DAFF, 2012). South Africa's production of apples, pears
and grapes in 2015 is expected to remain flat as the rising costs of production, orchard
and vineyard establishment are expected to constrain growth in the area planted
(GAIN, 2014). Furthermore, following the unfavourable climatic conditions in the
Western Cape in November 2013 that negatively impacted on the 2014 harvest, the
effects of severe climatic occurrences remain evident in the 2015 harvest (BFAP,
2015).
South Africa's table grape season commenced in November 2014 and ran until April
2015. Variation in production may be attributed to early-season harvest and better
crop yield in the 2014/2015 season which saw the industry by February 2015 having
pushed more than 10 million cartons for the export market than 32 million cartons in
the previous season (NAMC, February 2015). Meanwhile, total mango production has
not been stable over the years and an improvement in production is mainly attributed
to favourable weather conditions and measures put in place to control diseases.
South Africa's avocado production has not been stable in past years while total
avocado production for the 2014/15 season amounts to 97 000 tons despite some
fluctuations in production mainly due to unfavourable weather conditions and

Quarterly economic overview of the agriculture, forestry and fisheries sector: Third quarter 2015
37
theoccurrence of disease in avocado producing regions (NAMC, June 2015).
A serious outbreak of a fungal disease which has been responsible for decimating
millions of hectares of banana plantations across the world could now pose a threat to
South Africa’s R1,5 billion banana industry. The outbreak in northern Mozambique
poses a risk to all neighbouring countries and major means of spreading this disease
are water, planting material, soil attached to shoes and vehicles from one farm to
another. Local banana producers are under threat of competition from their peers in
Mozambique as the neighbouring country produces bananas more cheaply (Times
Live, 2015).
Despite ongoing economic weakness in South Africa, SA's citrus exports to the EU
increased by 9,7% for the first nine months of 2015. According to the Citrus Growers
Association, production volumes are estimated at 31 577 tons more than in the
previous season. Meanwhile, the increase in the production of citrus may be attributed
to the application of food safety and quality issues to ensure a risk management
system for the black spot disease. Furthermore, about 65% of the total citrus produced
is for the export market while 30% is for processing and 5% is for domestic
consumption (NAMC, September 2015).
South Africa's 2014/15 forecast for pear production is expected to remain unchanged
at 390 000 metric tons and is 6% lower than 413 614 metric tons recorded in 2013/14
(GAIN, May 2015).
South Africa produces a variety of vegetables, namely carrots, onions, potatoes,
tomatoes and cabbage being major vegetables produced locally. Supply and demand

Quarterly economic overview of the agriculture, forestry and fisheries sector: Third quarter 2015
38
influence prices as the bulk of the produce is sold on the fresh produce markets (ARC,
2015). Market prices of vegetables decreased more in the third quarter of 2015 than in
the third quarter of 2014 while the impact of the drought is starting to show on food
shortages and prices. Figure 32 shows prices of a number of vegetables traded
through the FPMs between the third quarter of 2014 and the third quarter of 2015.
Between the third quarter of 2014 and the third quarter of 2015, the average prices of
carrots and tomatoes decreased by 21% and 9% respectively, due to seasonal supply
pressures. During the same period, the average prices of cabbage decreased by 40%
on account of weak uptake across most markets while the average prices for onions
and potatoes decreased by 22% and 31% respectively, due to abundant supplies
across major markets (FNB, 2015).
Figure 29: Average price trends of various vegetables traded on fresh produce markets (FPMs)
Source: DAFF
0
1000
2000
3000
4000
5000
6000
7000
R/t
on
Carrots Onions Potatoes Tomatoes Cabbage

Quarterly economic overview of the agriculture, forestry and fisheries sector: Third quarter 2015
39
3.3 Meat industry review
Beef Production has increased by 0.4%, grain-fed beef prices has increased by 0.3%
while weaner calf prices have increased by 4.5%. The supply of weaners has
increased due to the drought conditions in the country. Five provinces have been
declared disaster areas as a result of the water shortages. Five of the country’s nine
provinces have already been declared disaster areas and government has allocated
an estimated R220 million rands to assist farmers.
According to the Red Meat Producers Organisation (RPO). ”In KwaZulu-Natal alone,
more than 40 000 cattle have died and serious losses of livestock are currently being
experienced in the emerging sector country wide. Provision of water for livestock is
now in a crisis situation because dams, marshes, springs, fountains, rivers and
boreholes are drying up. In the heat conditions cattle are estimated to consume
between 40 and 50 litres of water per head per day, which renders the logistics of
water supply very difficult.’’
If the drought persists, further animals will be taken to the abattoirs, therefore leading
to an increase in supply in the short term. The number of herds has already
diminished following the previous drought also in 2014. The increased emergency
animal slaughters will increase production and therefore result in a downward
pressure on prices. In the long-term supply will be affected as the country will enter a
herd rebuilding face. Already, input costs are high with feed costs rising, the price of
maize currently increased by 56% in the quarter; therefore, it will lead to an upward
pressure on prices see Figure 30.

Quarterly economic overview of the agriculture, forestry and fisheries sector: Third quarter 2015
40
Figure 30: Quarterly beef production and prices
Source: DAFF/SA Feedlot Association
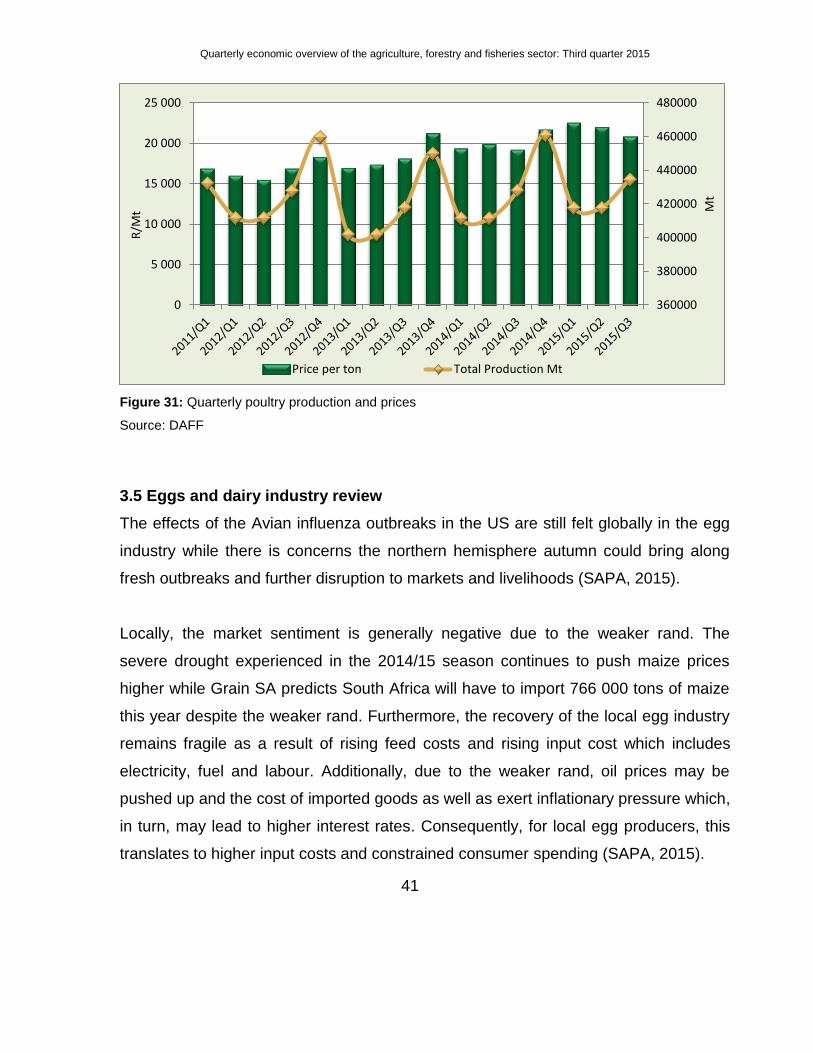
3.4 Poultry industry review
Poultry production continues to grow slowly, growing by over a percentage compared
to the same period in 2014, while prices have increased by 8,5%. The rising feed
prices have not resulted in the decline in production, though Poultry SA has stated
these will have an effect on producer margins, see Figure 31.
0
300000
600000
900000
1200000
0.0
10.0
20.0
30.0
40.0
Vo
lum
e o
f p
rod
uc
tio
n
Rc/K
g
Weaner Calf Purchases Grainfed beef carcase sales Total Production
Quarterly economic overview of the agriculture, forestry and fisheries sector: Third quarter 2015
41
Figure 31: Quarterly poultry production and prices
Source: DAFF
3.5 Eggs and dairy industry review
The effects of the Avian influenza outbreaks in the US are still felt globally in the egg
industry while there is concerns the northern hemisphere autumn could bring along
fresh outbreaks and further disruption to markets and livelihoods (SAPA, 2015).
Locally, the market sentiment is generally negative due to the weaker rand. The
severe drought experienced in the 2014/15 season continues to push maize prices
higher while Grain SA predicts South Africa will have to import 766 000 tons of maize
this year despite the weaker rand. Furthermore, the recovery of the local egg industry
remains fragile as a result of rising feed costs and rising input cost which includes
electricity, fuel and labour. Additionally, due to the weaker rand, oil prices may be
pushed up and the cost of imported goods as well as exert inflationary pressure which,
in turn, may lead to higher interest rates. Consequently, for local egg producers, this
translates to higher input costs and constrained consumer spending (SAPA, 2015).
360000
380000
400000
420000
440000
460000
480000
0
5 000
10 000
15 000
20 000
25 000
Mt
R/M
t
Price per ton Total Production Mt

Quarterly economic overview of the agriculture, forestry and fisheries sector: Third quarter 2015
42
During the third quarter of 2015, the total production of eggs totalled 215,4 million
dozens, a 3% increase in production compared to 209,2 million dozens recorded in
the third quarter of 2014. Eggs remain the most affordable source of protein. During
the third quarter of 2015, the average price per dozen of eggs increased by 2%, from
R11,27 per dozen to R11,45 per dozen between the third quarter of 2014 and the third
quarter of 2015, see Figure 32.
Figure 32: Trends in total egg production and average price per dozen of eggs. Source: DAFF
Stagnant consumer demand and low international prices combined with challenging
climatic conditions is expected to curb milk production in South Africa in 2015. The
current drought impinged on the condition of pastures in pasture-based areas across
South Africa (FAO, 2015).
South Africa's milk production during the first ten months of 2015 came in 7,7% higher
than the same period last year. Exports of milk in September 2015 totalled 300 million
9.6
9.8
10.0
10.2
10.4
10.6
10.8
11.0
11.2
11.4
11.6
190 000
195 000
200 000
205 000
210 000
215 000
220 000
225 000
Q32013
Q42013
Q12014
Q22014
Q32014
Q42014
Q12015
Q22015
Q32015
R/d
oze
n
10
00
do
ze
n
Total Egg Production Price per dozen

Quarterly economic overview of the agriculture, forestry and fisheries sector: Third quarter 2015
43
litres which was 5,3% lower than the same period in 2014. According to MPO (2015),
higher grain prices, the expected increase in electricity prices, lower quality silage and
the decrease in producer price as well as the enforcement of production quotas may
contribute to a further slowdown in production during the remaining months of the
year.
Between the third quarter of 2014 and the third quarter of 2015, total milk production
came in 6,4% higher than in the third quarter of 2014, increasing from 839,4 million to
893,5 million litres between the third quarter of 2014 and the third quarter of 2015. The
average price per litre of milk decreased by 7,4%, from R4,30/ℓ to R3,98/ℓ between the
third quarter of 2014 and the third quarter of 2015. Figure 36 shows trends in total milk
production and the average price of milk see Figure 33.
3.4
3.5
3.6
3.7
3.8
3.9
4.
4.1
4.2
4.3
4.4
4.5
200 000
400 000
600 000
800 000
1 000 000
1 200 000
Q32013
Q42013
Q12014
Q22014
Q32014
Q42014
Q12015
Q22015
Q32015
R/L
itre
10
00
Litre
Average Price received by farmers Total Milk Production
Figure 33: Trends in total production and the average price of milk Source: DAFF

Quarterly economic overview of the agriculture, forestry and fisheries sector: Third quarter 2015
44
3.6 Trade of agricultural, forestry and fisheries
Internationally, the year 2014 and 2015 has been volatile for the global economy, with
erratic swings in output in many of the world’s major economies. The distribution of
risks to global economic activity is still tilted to the downside (Absa, 2015). Near-term
risks include increased financial market volatility and disruptive asset price shifts.
Lower potential output growth remains an important medium-term risk in both
advanced and emerging market economies while lower commodity prices poses risks
to the outlook in low-income developing economies (WEO, 2015). Furthermore, one
particular risk to the global outlook is how policymakers manage divergent monetary
policy imperatives in the quarters ahead. As with each year since the onset of the
global financial crisis, there are substantial downside risks as economies attempt to
address these issues that led to the financial crisis (Absa, 2015).
Domestically, the rand has come under pressure while concerns over its monetary
anchor are growing. Agriculture and processed food exports have been impressive,
though elsewhere, the country’s export performance continues to lag. Electricity and
bulk transport constraints are expected to continue to hinder volume growth in other
parts of the export economy while import growth has remained stubbornly high (Absa,
2015).
South Africa's agricultural trade balance has increased by 2% between the third
quarter of 2014 and the third quarter of 2015. Exports grew by 4% while imports grew
by 7%. See Figure 34.

Quarterly economic overview of the agriculture, forestry and fisheries sector: Third quarter 2015
45
Figure 34: Trade balance of primary agricultural products
Source: GTA, 2015. Figure 35 illustrates South Africa gained most of its agricultural export revenue from
products exported to the Netherlands, which was the leading export destination,
followed by Namibia and the United Kingdom, each accounting for a percentage share
of 8%, 7%, and 7% respectively to the total export revenue.
0
5
10
15
20
25
30
35
3rd/14 4th/14 1st/15 2nd/15 3rd/15
R b
illio
ns
Trade Balance SA Exports SA Imports

Quarterly economic overview of the agriculture, forestry and fisheries sector: Third quarter 2015
46
Figure 35: Top three markets of primary agricultural products exported by SA Source: GTA, 2015
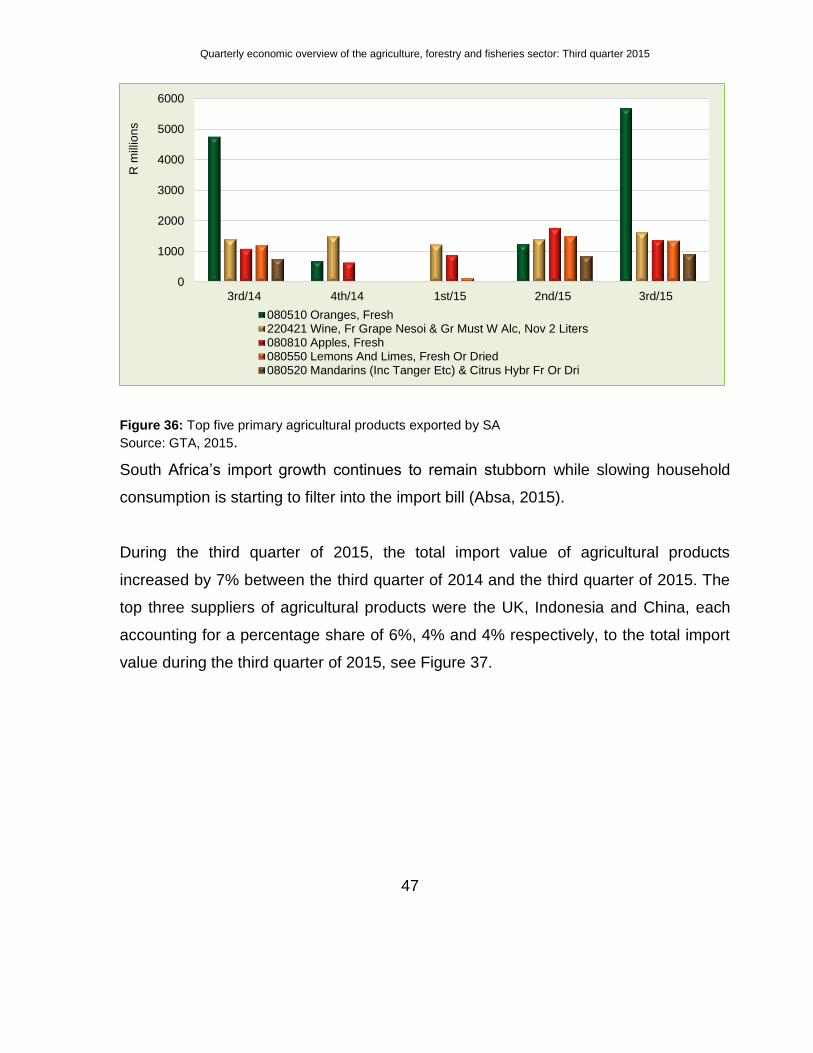
During the same period, the top three agricultural products which contributed a
considerable amount to the total export value include fresh oranges (18%), wine (5%)
and fresh apples (4%) respectively, see Figure 36.
0
500
1000
1500
2000
2500
3000
3rd/14 4th/14 1st/15 2nd/15 3rd/15
R m
illio
ns
Netherlands Namibia United Kingdom
Quarterly economic overview of the agriculture, forestry and fisheries sector: Third quarter 2015
47
Figure 36: Top five primary agricultural products exported by SA
Source: GTA, 2015.
South Africa’s import growth continues to remain stubborn while slowing household
consumption is starting to filter into the import bill (Absa, 2015).
During the third quarter of 2015, the total import value of agricultural products
increased by 7% between the third quarter of 2014 and the third quarter of 2015. The
top three suppliers of agricultural products were the UK, Indonesia and China, each
accounting for a percentage share of 6%, 4% and 4% respectively, to the total import
value during the third quarter of 2015, see Figure 37.
0
1000
2000
3000
4000
5000
6000
3rd/14 4th/14 1st/15 2nd/15 3rd/15
R m
illio
ns
080510 Oranges, Fresh220421 Wine, Fr Grape Nesoi & Gr Must W Alc, Nov 2 Liters080810 Apples, Fresh080550 Lemons And Limes, Fresh Or Dried080520 Mandarins (Inc Tanger Etc) & Citrus Hybr Fr Or Dri

Quarterly economic overview of the agriculture, forestry and fisheries sector: Third quarter 2015
48
Figure 37: Top three market suppliers of primary agricultural products to SA
Source: GTA, 2015.
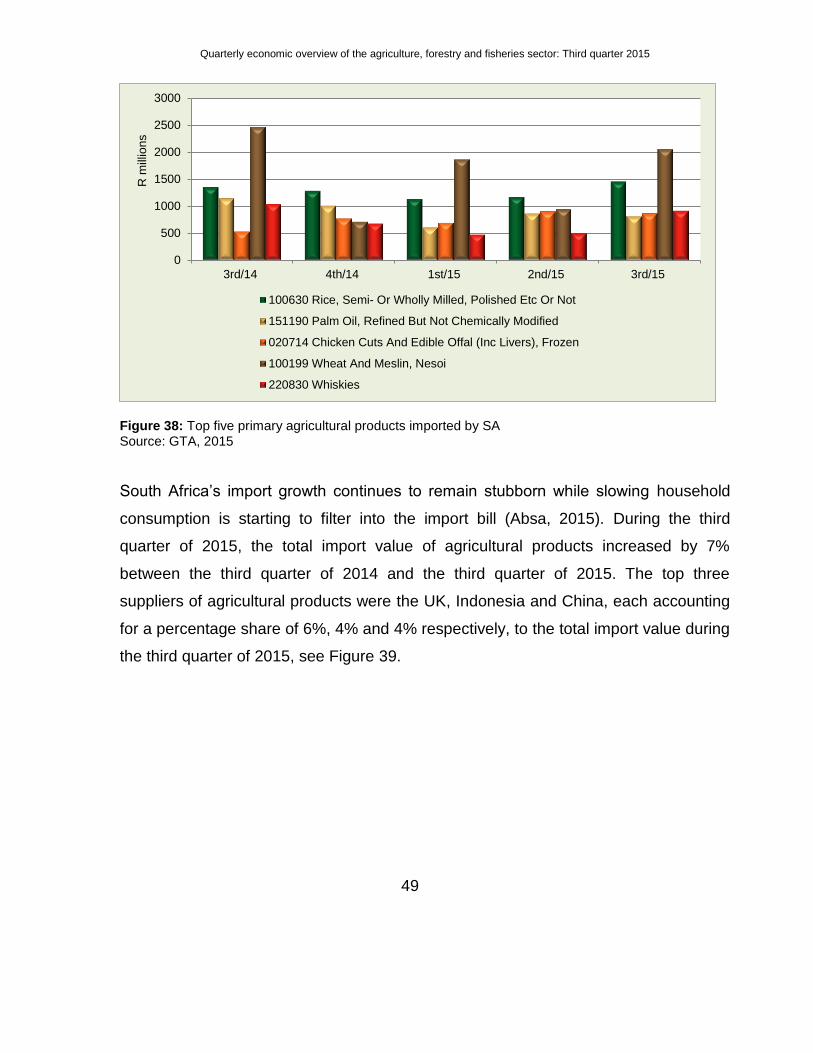
The top three agricultural products which contributed a considerable amount to the
total import value included rice (7%), palm oil (4%) and chicken cuts (4%), see Figure
38.
0
200
400
600
800
1000
1200
1400
1600
3rd/14 4th/14 1st/15 2nd/15 3rd/15
R m
illio
ns
United Kingdom Indonesia China
Quarterly economic overview of the agriculture, forestry and fisheries sector: Third quarter 2015
49
Figure 38: Top five primary agricultural products imported by SA
Source: GTA, 2015
South Africa’s import growth continues to remain stubborn while slowing household
consumption is starting to filter into the import bill (Absa, 2015). During the third
quarter of 2015, the total import value of agricultural products increased by 7%
between the third quarter of 2014 and the third quarter of 2015. The top three
suppliers of agricultural products were the UK, Indonesia and China, each accounting
for a percentage share of 6%, 4% and 4% respectively, to the total import value during
the third quarter of 2015, see Figure 39.
0
500
1000
1500
2000
2500
3000
3rd/14 4th/14 1st/15 2nd/15 3rd/15
R m
illio
ns
100630 Rice, Semi- Or Wholly Milled, Polished Etc Or Not
151190 Palm Oil, Refined But Not Chemically Modified
020714 Chicken Cuts And Edible Offal (Inc Livers), Frozen
100199 Wheat And Meslin, Nesoi
220830 Whiskies

Quarterly economic overview of the agriculture, forestry and fisheries sector: Third quarter 2015
50
Figure 39: Top five primary agricultural products exported by SA
Source: GTA, 2015.
3.6.1 Fisheries trade
Growth in global fish production continues to be driven by aquaculture however; El
Niño remains a key factor influencing prices of fishmeal and fish oil. The overall
outlook for fisheries trade volumes remains positive, though El Niño is expected to
influence global fish production levels negatively. Low production levels are expected
for some species in specific regions (FAO, 2015).
South Africa has a well-established fishery sector and is a net exporter of fishery
products. Historically, South Africa focused on high value species such as abalone,
mussels and oysters; however, the South African government has recently identified
aquaculture as an area for expansion. It is estimated that South Africa contributes
about 21% to global abalone production while in 2008, South Africa's mariculture was
comprised of abalone (1 037 tons), oysters (227 tons), mussels (737 tons), prawn (11
tons), finfish (3 tons) and seaweeds (1 834 tons), (WFF, 2011). Sadly, many of SA's
0
1000
2000
3000
4000
5000
6000
3rd/14 4th/14 1st/15 2nd/15 3rd/15
R m
illio
ns
080510 Oranges, Fresh
220421 Wine, Fr Grape Nesoi & Gr Must W Alc, Nov 2 Liters
080810 Apples, Fresh
080550 Lemons And Limes, Fresh Or Dried
080520 Mandarins (Inc Tanger Etc) & Citrus Hybr Fr Or Dri
Quarterly economic overview of the agriculture, forestry and fisheries sector: Third quarter 2015
51
inshore marine resources are considered overexploited or collapsed with a few being
fully exploited. This is mainly due to the accessibility of the resources to a wide range
of marine user groups, which includes traditional line fishers, recreational fishers,
inshore trawl and longline fisheries. Illegal harvesting or poaching, which targets many
of the same inshore resources, appear to be on the rise in South Africa and will have
dramatic impacts on the economic well-being of traditional, commercial and
recreational fishers and on the environment (WWF, 2011)
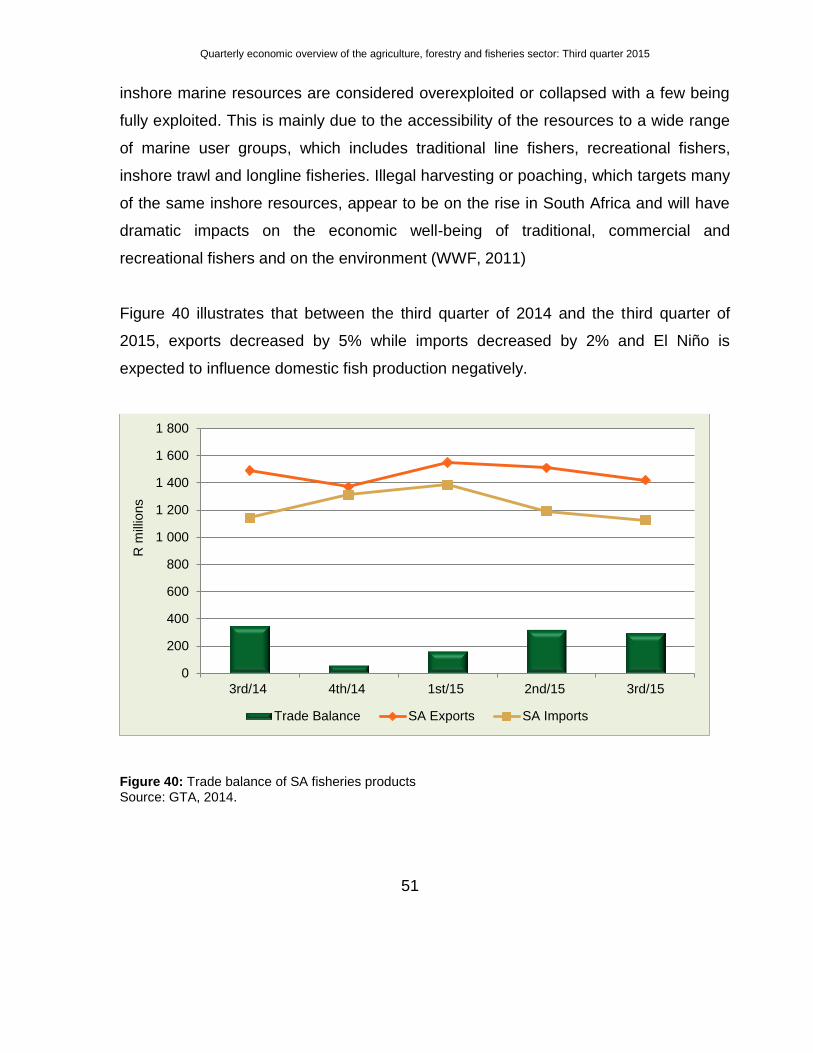
Figure 40 illustrates that between the third quarter of 2014 and the third quarter of
2015, exports decreased by 5% while imports decreased by 2% and El Niño is
expected to influence domestic fish production negatively.
Figure 40: Trade balance of SA fisheries products
Source: GTA, 2014.
0
200
400
600
800
1 000
1 200
1 400
1 600
1 800
3rd/14 4th/14 1st/15 2nd/15 3rd/15
R m
illio
ns
Trade Balance SA Exports SA Imports
Quarterly economic overview of the agriculture, forestry and fisheries sector: Third quarter 2015
52
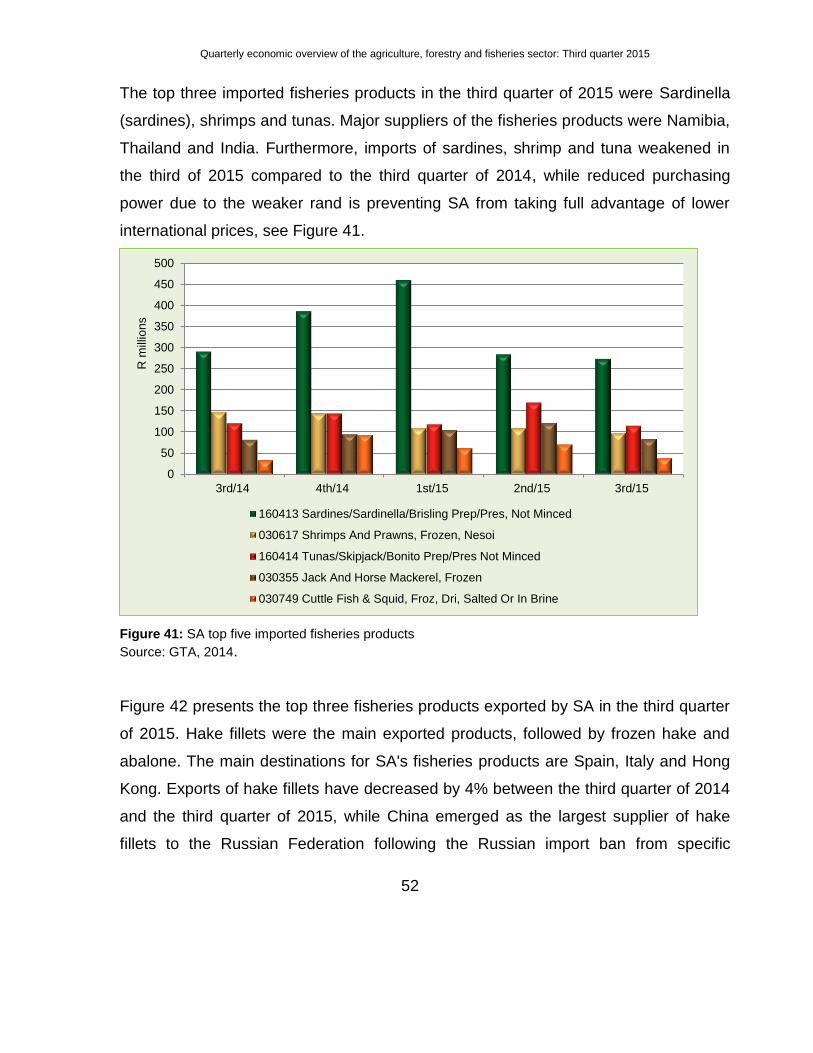
The top three imported fisheries products in the third quarter of 2015 were Sardinella
(sardines), shrimps and tunas. Major suppliers of the fisheries products were Namibia,
Thailand and India. Furthermore, imports of sardines, shrimp and tuna weakened in
the third of 2015 compared to the third quarter of 2014, while reduced purchasing
power due to the weaker rand is preventing SA from taking full advantage of lower
international prices, see Figure 41.
Figure 41: SA top five imported fisheries products
Source: GTA, 2014.
Figure 42 presents the top three fisheries products exported by SA in the third quarter
of 2015. Hake fillets were the main exported products, followed by frozen hake and
abalone. The main destinations for SA's fisheries products are Spain, Italy and Hong
Kong. Exports of hake fillets have decreased by 4% between the third quarter of 2014
and the third quarter of 2015, while China emerged as the largest supplier of hake
fillets to the Russian Federation following the Russian import ban from specific
0
50
100
150
200
250
300
350
400
450
500
3rd/14 4th/14 1st/15 2nd/15 3rd/15
R m
illio
ns
160413 Sardines/Sardinella/Brisling Prep/Pres, Not Minced
030617 Shrimps And Prawns, Frozen, Nesoi
160414 Tunas/Skipjack/Bonito Prep/Pres Not Minced
030355 Jack And Horse Mackerel, Frozen
030749 Cuttle Fish & Squid, Froz, Dri, Salted Or In Brine

Quarterly economic overview of the agriculture, forestry and fisheries sector: Third quarter 2015
53
countries (FAO, 2015).
Figure 42: SA top five exports of fisheries products Source: GTA, 2014.
3.6.2 Forestry trade With the low rate of timber establishment and the current shortage of softwood
plantations, saw mill and treating plant owners are experiencing a problem with the
procurement of plantations. The softwood industry is highly dependent on the housing
and building industry, which keeps undergoing cyclical fluctuations. With the current
economic instability, this had a disruptive impact on both producers and consumers.
Furthermore, the softwood sawn timber sector is expected to face increasing
competition from steel and engineered wood products such as laminated veneer
timber, strand timber and plastic wood composites. There is also an increasing threat
of low cost imports of softwood from South America and higher quality softwood from
Europe. Meanwhile, the demand for pulpwood exported from South Africa remained
flat while the harder wattle and some eucalyptus species have lately been preferred.
The export of treated poles to African and some Eastern markets is on the rise
0
50
100
150
200
250
300
350
3rd/14 4th/14 1st/15 2nd/15 3rd/15
R m
illio
ns
030474 Hake Fillets, Frozen
030366 Hake, Frozen
030789 Abalone, Nesoi
030621 Rock Lobster, Other Sea Crawfish Lv/Ch/Drd/Salted
030389 Fish, Frozen, Nesoi
Quarterly economic overview of the agriculture, forestry and fisheries sector: Third quarter 2015
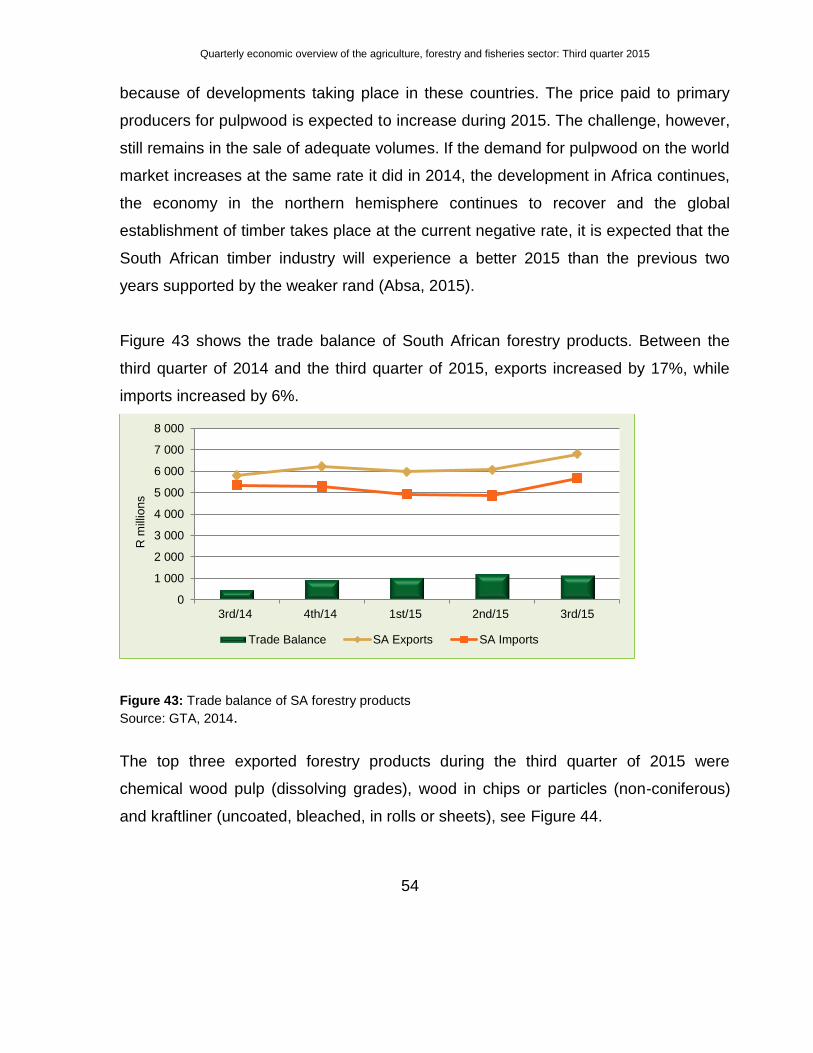
54
because of developments taking place in these countries. The price paid to primary
producers for pulpwood is expected to increase during 2015. The challenge, however,
still remains in the sale of adequate volumes. If the demand for pulpwood on the world
market increases at the same rate it did in 2014, the development in Africa continues,
the economy in the northern hemisphere continues to recover and the global
establishment of timber takes place at the current negative rate, it is expected that the
South African timber industry will experience a better 2015 than the previous two
years supported by the weaker rand (Absa, 2015).
Figure 43 shows the trade balance of South African forestry products. Between the
third quarter of 2014 and the third quarter of 2015, exports increased by 17%, while
imports increased by 6%.
Figure 43: Trade balance of SA forestry products
Source: GTA, 2014.
The top three exported forestry products during the third quarter of 2015 were
chemical wood pulp (dissolving grades), wood in chips or particles (non-coniferous)
and kraftliner (uncoated, bleached, in rolls or sheets), see Figure 44.
0
1 000
2 000
3 000
4 000
5 000
6 000
7 000
8 000
3rd/14 4th/14 1st/15 2nd/15 3rd/15
R m
illio
ns
Trade Balance SA Exports SA Imports

Quarterly economic overview of the agriculture, forestry and fisheries sector: Third quarter 2015
55
Figure 44: SA top five exports of forestry products
Source: GTA, 2014.
The total import values of forestry products increased by 6% between the third quarter
of 2014 and the third quarter of 2015. SA’s major forestry import suppliers include
China, Germany, and the US. The most important forestry products imported in the
third quarter of 2015 include printed books, paper or paperboard and
paper/paperboard (cellulose wads), see Figure 45.
0
500
1000
1500
2000
2500
3000
3rd/14 4th/14 1st/15 2nd/15 3rd/15
R m
illio
ns
470200 Chemical Woodpulp, Dissolving Grades
440122 Wood In Chips Or Particles, Nonconiferous
480419 Kraftliner, Uncoated, Bleached, In Rolls Or Sheets
470329 Chem Woodpulp, Soda Etc, N Dis S Bl & Bl Nonconif
481910 Cartons, Boxes & Cases Corrugated Paper & Paperbd

Quarterly economic overview of the agriculture, forestry and fisheries sector: Third quarter 2015
56
Figure 45: SA top five imports of forestry products
Source: GTA, 2014.
0
100
200
300
400
500
600
3rd/14 4th/14 1st/15 2nd/15 3rd/15
R m
illio
ns
490199 Printed Books, Brochures, Etc., Nesoi
481159 Ppr/Pbrd Coat/Impg/Cvr W/ Plastic, Nesoi
481190 Paper, Paperbd, Cellulose Wadd Etc, Coat Etc Nesoi
470321 Chemical Woodpulp, Soda Etc. N Dis S Bl & Bl Conif
481141 Gummed/Adhesive Ppr & Ppboard,Pressure-Sensitive
Quarterly economic overview of the agriculture, forestry and fisheries sector: Third quarter 2015
57
4. CONCLUSION
The global economic growth remains moderate as the global economy continues to
face a number of downside risks resulting in marked down forecasts for short-term
growth rates in most economies. Commodity price declines are adversely affecting a
number of economies including a few advanced economies. However, economic
recovery in advanced economies is expected to pick up slightly, with the US and the
UK leading the recovery process as output increases while unemployment drops in
these economies.
Growth in emerging market and developing economies is projected to slow down from
4,6% in 2014 to 4,0% in 2015 and is forecast to rebound to 4,5% in 2016. Economic
growth in the sub-Saharan Africa region is expected to slow from 5% in 2014 to 3,8%
in 2015, largely reflecting declining commodity prices—particularly oil prices. The SA
economy grew by a seasonally adjusted and annualised 0,7% quarter-on-quarter (q/q)
during the third quarter of 2015, averting a technical recession following a 1,3%
contraction in the second quarter of 2015. The manufacturing sector provided the
much needed cushion to save the SA economy from tipping into a technical recession,
registering a 6,2% growth in the third quarter of 2015.
The SA headline CPI annual inflation rate averaged 4,7% in the third quarter of 2015,
which is a decline from the 6,2% average in the third quarter of 2014. South Africa's
unemployment rate has increased to 25,5% in the third quarter of 2015, which is up by
0,5 of a percentage point from the second quarter rate of 25%, of which is a far cry
from the 6% that the country wishes to achieve by 2030. Global grain production is
expected to be a percentage lower than they were in 2014; while it was 7% higher in
the third quarter of 2015 compared to the estimates in Q3 of 2014 showing that
estimates could still change. South Africa's agricultural trade balance has increased
by 2% between the third quarter of 2014 and the third quarter of 2015. Exports
increased by 4% while imports rose by 7%.
Quarterly economic overview of the agriculture, forestry and fisheries sector: Third quarter 2015
58
5. References
Absa, (2015): Agricultural Outlook 2015: Available online: http://www.agrisa.co.za
Bureau for Food and Agricultural Policy (BFAP) (2015): BFAP Baseline Agricultural Outlook 2015- 2024. Available online: http://www.bfap.cp.za
Business Report, (2015): Drought to hike SA food prices: Available online: http://www.iol.co.za
Department of Agriculture Forestry and Fisheries (DAFF), 2012: A profile of the South African apple market value chain. Available online: http://www.daff.gov.za
Department of Agriculture Forestry and Fisheries (2015): Production Accounts, Third Quarter 2015: Available online: http://www.daff.gov.za
Department of Agriculture Forestry and Fisheries, (2015) Available online: http://www.daff.gov.za
Department of Agriculture Forestry and Fisheries (2015): Production Accounts, Third Quarter 2015: Available online: http://www.daff.gov.za
Food and Agricultural Organization, (2015): Food Price Index. Available online: http://www.fao.org.
Food and Agricultural Organization, (2015): Food Price Monitoring and Analysis, September 2015. Available online: http://www.fao.org
Food and Agricultural Organization, (2015): Food Price Index. Available online: http://www.fao.org
Food and Agricultural Organization, (2015): Food Price Monitoring and Analysis, September 2015. Available online: http://www.fao.org
First National Bank (FNB), (02, 09, 16, 23 and 30 October 2015): Agri-weekly. Available online: http://www.fnbagricomms.co.za
Food and Agricultural Organization (FAO), October 2015: Food outlook: Bi annual report on global food markets. Available online: http://www.fao.org
Global Agricultural Information Network (GAIN), May 2014: Fresh Deciduous Fruit Semi-annual. Available online: http://gain.fas.usda.gov
Global Trade Atlas information service (2015): Available online: www.worldtradestatistics.com/gta/

Quarterly economic overview of the agriculture, forestry and fisheries sector: Third quarter 2015
59
International Monetary Fund, (2015): World Economic Outlook, October 2015. Available online: http://www.imf.org.
Milk Producers’ Organisation, (2015): Key Market Signals, November 2013. Available online: http://www.mpo.co.za
National Agricultural Marketing Council (NAMC), (May 2014 and February 2015): South African fruit trade flow, Issue no 14 (May 2014), issue no 17 (February 2015) and Issue no 19 (September 2015). Available online: http://www.namc.co.za
South African Poultry Association (SAPA), 2015: Key Market Signals in the egg industry. Available online: http://www.sapoultry.co.za
Statistics South Africa (Stats SA) (2015): Consumer Price Index (CPI), July, August and September 2015: Available at http://www.statssa.gov.za
Statistics South Africa (Stats SA) (2015): Gross Domestic Product (GDP), Third Quarter 2015: Available at http://www.statssa.gov.za
Statistics South Africa (Stats SA), (2015): Producer Price Index (PPI), July, August and September 2015: Available at http://www.statssa.gov.za
Statistics South Africa (Stats SA), (2015): Quarterly Labour Force Survey, Quarter 3, 2015:
Available at http://www.statssa.gov.za
South African Futures Exchange (SAFEX), 2015: www.grainsa.co.za/pages/industry-
reports/Safex-feeds.
Times Live, (10 November 2015): Outbreak-of-fungal-disease-could-threaten-SA-bananas. Available online: http://www.timeslive.co.za
Trading Economics, (2015): Available online: http://www.tradingeconomics.com
United State Department of Agriculture (2015) www.fas.usda.gov/psdonline/psdQuery.aspx
World Economic Outlook (WEO), July 2015: An update of key WEO projections. Slower Growth in Emerging Markets, a Gradual Pickup in Advanced Economies. Available online: http://www.imf.org/external/pubs/ft/weo/2015/update/02
WWF South Africa (2011): Fisheries: Facts and Trends South Africa. Available online:
http://awsassets.wwf.org.za

Quarterly economic overview of the agriculture, forestry and fisheries sector: Third quarter 2015
60