Embed Size (px)
Citation preview


1
Contents Context of the Quarterly Financial Report .................................................................................................................... 2 Managing the Balance Sheet ......................................................................................................................................... 2 Financial Position ........................................................................................................................................................... 3 Results of Operations .................................................................................................................................................... 6 2017 Outlook ................................................................................................................................................................. 9 Operational Highlights and Changes ........................................................................................................................... 10 Risk Analysis ................................................................................................................................................................. 10
2
Context of the Quarterly Financial Report The Bank of Canada (the Bank) is the nation’s central bank. Its mandate, as defined in the Bank of Canada Act, is “to promote the economic and financial welfare of Canada.” The Bank is committed to keeping Canadians in-formed about its policies, operations and activities.
This discussion has been prepared in accordance with section 131.1 of the Financial Administration Act and follows the guidance outlined in the Standard on Quarterly Financial Reports for Crown Corporations issued by the Treas-ury Board of Canada Secretariat.
Management is responsible for the preparation of this report, which was approved on November 8, 2017, by the Audit and Finance Committee of the Board of Directors.
The Quarterly Financial Report should be read in conjunction with the condensed interim financial statements in-cluded in this report and with the Bank’s Annual Report for 2016. The Annual Report includes a Management Dis-cussion and Analysis (MD&A) for the year ended December 31, 2016. Disclosures and information in the 2016 An-nual Report and the MD&A apply to the current quarter unless otherwise updated in this quarterly report.
Managing the Balance Sheet The Bank’s holdings of financial assets are generally driven by its role as the exclusive issuer of Canadian bank notes. The Bank invests the proceeds from the issuance of notes primarily into Government of Canada securities that are acquired on a non-competitive basis.
The Bank’s investments broadly mirror the structure of the federal government’s nominal domestic debt out-standing. This makes the Bank’s balance sheet a neutral factor in the government’s debt-management and fiscal- planning activities and limits the impact of the Bank’s purchases on market prices.

3
Financial Position
As at
(Millions of Canadian dollars) September 30,
2017 December 31,
2016 Assets Cash and foreign deposits 16.3 19.3 Loans and receivables 7,009.2 8,282.2 Investments 102,077.1 97,032.7 Capital assetsa 606.9 606.9 Other assets 188.6 164.9 Total assets 109,898.1 106,106.0
Liabilities and equity Bank notes in circulation 82,091.9 80,478.6 Deposits 25,355.9 22,831.5 All other liabilitiesb 1,958.8 2,308.9 Equity 491.5 487.0 Total liabilities and equity 109,898.1 106,106.0 a Includes Property and equipment and Intangible assets b Includes Securities sold under repurchase agreements and Other liabilities
Assets Overall, the Bank’s investments have increased by $5,044.4 million (or 5 per cent) since December 31, 2016, gen-erally driven by increases in Deposits and increases in Bank notes in circulation (as described in the discussion on Liabilities). Government of Canada bonds increased by $389.6 million (or 0.5 per cent) because higher volumes of bonds auc-tioned on behalf of the Government of Canada were partially offset by a lower minimum purchase amount of nominal bonds at auctions. The minimum purchase amount of nominal bonds at auctions was reduced from 20 to 15 per cent in 2016 and further reduced to 14 per cent during the first quarter of 2017. Government of Canada treasury bills increased by $4,650.3 million (or 28 per cent) primarily as a result of higher volumes of purchases over maturities. Purchases of Government of Canada treasury bills are based on the Bank’s balance sheet needs. The balance of the change in investments resulted from an increase of $4.5 million (or 1 per cent) in the fair value of the Bank’s investment in shares of the Bank for International Settlements (BIS). In line with the Bank’s framework for financial market operations, Loans and receivables were $7,009.2 million at September 30, 2017, representing a decrease of $1,273.0 million (or 15 per cent) from December 31, 2016. The decrease was primarily due to more term repos outstanding at December 31, 2016, used to offset the increased demand for bank notes during the holiday season. Overall, the Bank’s Capital assets remained consistent with December 31, 2016, following the completion of the Head Office Renewal Program during the fourth quarter of 2016. Additions to capital assets for the nine-month period ended September 30, 2017, primarily consist of finishing work and purchases of remaining equipment re-

4
lated to the Bank’s head office location as well as fit up of the Bank of Canada Museum that re-opened on July 1, 2017, after a four-year closure.
Other assets include the net defined-benefit asset related to the Bank’s registered pension plan. The net defined-benefit asset increased by $34.4 million (or 26 per cent) compared with December 31, 2016 primarily due to positive asset returns during the period. This increase was partially offset by the actuarial impact on the de-fined-benefit obligation following the Bank’s renewed approach to total compensation. The discount rate used to measure the related defined-benefit obligation was 3.9 per cent at both measurement dates.1
Liabilities The Bank notes in circulation liability represents approximately 75 per cent of the Bank’s Total liabilities and equity. Currency remains an essential means of undertaking transactions in Canada. The value of Bank notes in circulation has increased by $1,613.3 million (or 2 per cent) since December 31, 2016, driven by growth in demand for bank notes and seasonal variations in demand.2
The second-largest liability on the balance sheet consists of deposits held for the Government of Canada and other financial institutions. The main components of the Deposits liability are $20,000.0 million held for the government’s prudential liquidity-management plan and $2,516.9 million held for the government’s operational balance. The Government of Canada operational balance3 increased by $2,288.5 million compared with December 31, 2016. Also included in Deposits is $499.7 million held for members of Payments Canada to support the smooth operation of the Canadian payments system.
All other liabilities consist mainly of Securities sold under repurchase agreements, the surplus payable to the Re-ceiver General for Canada and the net defined-benefit liabilities for the Bank’s deferred employee benefit plans (which include the liability for the Supplementary Pension Arrangement and unfunded post-employment de-fined-benefit plans).
Securities sold under repurchase agreements outstanding as at September 30, 2017, decreased by $200.0 million (or 13 per cent) from December 31, 2016. Those overnight operations are conducted to support the Bank’s mone-tary policy function and aim to withdraw intraday liquidity from the market.
Changes in the surplus payable to the Receiver General for Canada are the result of the timing of cash payments to the Receiver General for Canada. Net income earned on the Bank’s assets, after deductions for operating expenses and allocations to reserves, is paid each year to the Receiver General for Canada. For the nine-month period ended September 30, 2017, the Bank transferred cash payments of $843.8 million. At September 30, 2017, the surplus payable was $360.4 million ($468.8 million at December 31, 2016).
Increases in the liabilities related to the Bank’s defined-benefit plans primarily reflect the actuarial impact of the Bank’s renewed approach to total compensation.
1 The net defined-benefit asset is measured using the discount rate in effect as at the period-end. The rate as at September 30, 2017, was 3.9 per cent (3.9 per cent at December 31, 2016). 2 Demand for bank notes typically reaches its lowest level at the end of the first quarter and peaks in the second and fourth quarters around holiday periods. 3 The operating portion of the deposit is dependent on the cash needs of the Government of Canada, and fluctuations that occur are a result of
decisions related to cash-flow management.

5
Managing Equity The Bank of Canada operates safely with a low capital base relative to its assets. The Bank’s primary equity includes $5 million of authorized share capital and a $25 million statutory reserve. In accordance with the Bank of Canada Act, the Bank remits its surplus, after funding operations, to the Receiver General for Canada and does not hold retained earnings.
One reason it can safely operate with a low capital base is because the Bank’s balance sheet is not exposed to significant foreign currency risk or fluctuations in the price of gold holdings that are often held by other central banks. Canada’s foreign reserves are held by the Exchange Fund Account and not by the Bank. The Bank’s exposure to currency risk is primarily through its holdings of shares in the BIS. Given the small size of the Bank’s exposure to currency risk relative to its total assets, currency risk is not considered significant.
The Bank’s asset portfolio also has a low credit risk, since it consists primarily of bonds and treasury bills issued by the Government of Canada. Furthermore, the holdings in Government of Canada bonds are not subject to fair-value accounting, since they are acquired with the intention to hold until maturity and are accounted for using the amortized cost method. Other financial assets, such as advances and loans related to repurchase agreements, are transacted on a fully collateralized basis (see note 4 to the condensed interim financial statements for further information on the quality of collateral held).
The Bank also holds a special reserve of $100 million to offset valuation losses arising from changes in the fair val-ue of available-for-sale (AFS) assets (see note 11 to the condensed interim financial statements). There has been no change in the reserve since its inception.
The largest reserve held by the Bank is the AFS reserve, which represents the net unrealized fair-value gains in the Bank’s investment in the BIS and the portfolio of Government of Canada treasury bills. Fair-value changes are re-ported in Other comprehensive income and net unrealized fair-value gains are accumulated in the AFS reserve within Equity. As at September 30, 2017, this reserve totalled $361.5 million ($357.0 million at December 31, 2016) and consisted of the net unrealized fair-value gains in the Bank’s investment in the BIS. There were no remaining net unrealized fair-value gains on the Government of Canada treasury bills within the reserve at September 30, 2017, and December 31, 2016.

6
Results of Operations For the three-month
period ended For the nine-month
period ended September 30, September 30, September 30, September 30, (Millions of Canadian dollars) 2017 2016 2017 2016
Total income 359.3 375.9 1,097.9 1,155.5
Total expenses 125.1 111.4 362.1 331.7
Net income 234.2 264.5 735.8 823.8
Other comprehensive income (loss) 87.3 (6.3) 4.1 (164.2)
Comprehensive income 321.5 258.2 739.9 659.6
Income Total income for the third quarter of 2017 was $359.3 million, a decrease of $16.6 million (or 4 per cent) compared with the same period in the previous year. On a year-to-date basis, Total income was $1,097.9 million, a decrease of $57.6 million (or 5 per cent) relative to 2016.
The income generated from the assets backing the bank notes in circulation (net of bank note production and dis-tribution costs) is referred to as “seigniorage”; this generates a stable source of funding for the Bank’s operations.
The Bank’s primary source of revenue is Interest earned on investments, which is derived from investments in Government of Canada securities and fluctuates with market conditions. During the third quarter of 2017, the Bank recorded $401.8 million in interest revenue from treasury bills and bonds — an increase of $6.0 million (or 2 per cent) from the same period in the previous year. In addition to higher overall average holdings of investments, the increase during the quarter is further supplemented by higher yields on newly acquired treasury bills which were partially offset by lower yields on newly acquired bonds. On a year-to-date basis, Interest earned on invest-ments was $1,178.1 million, which is a decrease of $32.8 million (or 3 per cent) relative to 2016. Despite higher overall average holdings of investments, the decrease during the period is a result of lower yields on newly ac-quired bonds, which were partially offset by higher yields on newly acquired treasury bills. Acquisitions of treasury bills and bonds are made at current market rates and affect the yield profile of the portfolio as older instruments reach maturity.
Interest earned on securities purchased under resale agreements increased by $3.3 million (or 33 per cent) for the three-month period, and $4.9 million (or 18 per cent) for the nine-month period over the comparable periods in the prior year. These increases were driven primarily by higher overall yields during the periods.
Income is reported net of the interest paid on deposits held at the Bank by the Government of Canada and other clients. Interest rates paid on deposits are based on market-related rates, which increased over the comparable period in 2016, resulting in an increase of expense on deposits of $24.8 million (or 77 per cent) and $29.9 million (or 33 per cent) for the three and nine-month periods ended September 30, 2017, respectively. Income earned on investments backing these deposits is included within Interest earned on investments.
The Bank’s revenues from its remaining sources4 was $1.1 million and $3.9 million for the three and nine-month periods ended September 30, 2017, respectively.
4 Other sources of revenue primarily include safekeeping and custodial fees.

7
0 50 100 150 200
Other operatingexpenses
Depreciationand amortization
Technology andtelecommunications
Premisescosts
Bank note research,production, processing
Staffcosts
Expenses(Millions of Canadian dollars)For the nine-month period endedSeptember 30
2017 2016
Expenses Operating expenses were in line with expectations for the first three quarters of 2017. The increases over the comparable three- and nine-month prior-year periods of $13.7 million (or 12 per cent) and $30.4 million (or 9 per cent) primarily reflect increases in staffing costs planned to maintain the market competitiveness of the Bank’s approach to total compensation and to support the Bank’s medium-term plan (MTP) initiatives.
Staff costs increased by $3.3 million (or 6 per cent) in the third quarter and by $16.8 million (or 10 per cent) for the first nine months of 2017 compared with same periods in 2016. The increase is the result of the Bank’s renewed approach to total compensation, increased staffing to support MTP initiatives and higher benefit costs associated with the Bank’s defined-benefit plans.
Costs associated with bank note production were $6.7 million (or 65 per cent) higher in the quarter, and $1.7 million (or 5 per cent) higher year-to-date, compared with the same periods in the previous year. Due to dif-ferences in the timing of the bank note production plan from the prior year, 46 million more notes were re-ceived in the quarter compared with the same period in 2016. During the first nine months of 2017, 115 mil-lion polymer notes were received compared with 105 million notes received in the same period in 2016.
Consistent with 2016, the remaining expenses (Prem-ises costs, Technology and telecommunications, Depre-ciation and amortization and Other operating expens-
es) represent 38 per cent of the Bank’s total operating expenses in the first nine months of 2017. These costs in-creased by $3.7 million (or 8 per cent) in the three-month period and by $11.9 million (or 9 per cent) in the nine-month period ended September 30, 2017, compared with the same periods in 2016. The increase was primar-ily driven by the depreciation on the newly renovated building, which began in the first quarter of 2017, and ex-penditures on MTP resiliency initiatives, including cyber security and business recovery enhancements, which were partially offset by a decrease in premises costs as the temporary locations used through the head office renova-tions were no longer required.

8
Other Comprehensive Income
Other comprehensive income for the quarter is $87.3 million, and consists of remeasurement gains of $103.6 mil-lion on the Bank’s net defined-benefit plan asset and liabilities and a decrease of $16.3 million in the fair values of AFS assets. On a year-to-date basis, Other comprehensive income is $4.1 million and comprises remeasurement gains of $19.8 million on the Bank’s net defined-benefit plan asset and liabilities, partially offset by a decrease of $15.7 million of AFS assets.
Remeasurements pertaining to the Bank’s defined benefit plans are primarily affected by the return on plan assets, where funded, and by changes in the discount rate used to determine the related defined-benefit obligations. The remeasurement gain recorded in the third quarter of 2017 is mostly the result of a 50-basis-point increase in the discount rate used to value the Bank’s registered pension plan defined-benefit obligation.5 This gain was partially offset by negative returns on plan assets and the actuarial impact on the defined-benefit obligation following the Bank’s renewed approach to total compensation. The remeasurements recorded in the nine-month period are primarily driven by positive asset returns of the Bank’s registered pension plan, partially offset by the actuarial impact on the defined-benefit obligation following the Bank’s renewed approach to total compensation. The dis-count rate used to measure the related defined-benefit obligation remained consistent at both measurement dates.6
AFS assets are composed of Government of Canada treasury bills and the Bank’s investment in the BIS. Fair-value changes are accumulated in the reserve for AFS assets within the Bank’s Equity (see note 11 of the condensed in-terim financial statements). At September 30, 2017, the fair value of the Bank’s investment in the BIS was $399.5 million, representing a decrease of $9.1 million for the three-month period, and an increase of $4.5 million for the nine-month period. Despite the growth of the BIS’s balance sheet during first nine months of 2017, there was an unfavourable foreign currency impact during the third quarter, resulting in a fair value decrease at the end of the period. The remainder of the decrease in fair value of AFS assets is related to fair value changes in the Bank’s portfolio of Government of Canada treasury bills for which remeasurement losses of $7.2 million and $20.2 million were recognized for the three- and nine-month periods, respectively.
Surplus for the Receiver General for Canada The Bank’s operations are not constrained by its cash flow or by its holdings of liquid assets, since income is predictable and exceeds expenses. The net income of the Bank, less any allocation to reserves, is considered as-certained surplus (surplus), which was $330.6 million for the third quarter of 2017 and $735.4 million for the nine-month period ended September 30, 2017. In accordance with the requirements of the Bank of Canada Act, the Bank remits its surplus to the Receiver General for Canada and does not hold retained earnings.
The remittance agreement with the Minister of Finance allows the Bank to deduct from its remittances to the Re-ceiver General for Canada and withhold an amount equal to unrealized losses on AFS assets, unrealized remeas-urement losses on post-employment defined-benefit plans, and other unrealized or non-cash losses. Subsequently, amounts held back are reimbursed upon the recognition of unrealized gains.
During the quarter, the Bank reimbursed $96.4 million from its previously withheld remittances of surplus to the Receiver General for Canada, resulting primarily from the remeasurement gains recorded on the Bank’s net de-fined-benefit plan assets and liabilities. On a year-to-date basis, the Bank withheld $0.4 million from its remittanc-es of surplus to the Receiver General for Canada and at September 30, 2017, $109.8 million in withheld remittanc-es was outstanding ($109.4 million outstanding at December 31, 2016).
5 The increase in the discount rate reflects the change in AA-corporate-bond yields during the quarter. The rate in effect at September 30, 2017, was 3.9 per cent (3.4 per cent at June 30, 2017). 6 The net defined-benefit asset is based on the discount rate as at the period-end. The rate in effect at September 30, 2017, was 3.9 per cent (3.9 per cent at December 31, 2016).

9
2017 Outlook The Bank's 2017 Plan (Millions of Canadian dollars) 2017 budget 2016 actual $ % $ % MTP expenditures 412 66 390 61 Bank note production 57 9 49 8 Non-current deferred employee benefits 16 3 13 2 Head Office Renewal and strategic investment programs 137 22 188 29
Total expendituresa 622 100 640 100 a Includes operational and capital expenditures
The Bank’s forecasts for its operations do not include projections of net income and financial position. Such projections would require assumptions about interest rates, which could be interpreted as a signal of future mon-etary policy.
The Bank’s MTP, now in its second year, is based on a commitment of 2 per cent growth of MTP expenditures be-tween 2015 and 2018. This represents zero real growth, consistent with the Bank’s 2 per cent inflation target.
The initiatives launched in 2016 will continue in 2017 for implementation over the duration of the current and the next MTP. The projected cumulative average growth over the life of the MTP remains aligned with our commit-ment of 2 per cent.
The Bank continues to expect bank note production costs to be higher in 2017 to reflect the costs associated with the production of the commemorative $10 bank note marking the 150th anniversary of Confederation, which en-tered circulation on June 1, 2017.
As of September 30, 2017, the Bank expects to see capital expenditures for the year drop to $61.9 million from $172.0 million in 2016, reflecting the completion of several key capital projects, including the Head Office Renewal Program and the design and building of the Bank of Canada Museum. The Bank will remain focused on strength-ening its business continuity posture by continuing work on cyber security and business resiliency initiatives.

10
Operational Highlights and Changes
The following describes any significant changes in personnel, operations and programs that have occurred since June 30, 2017.
Governing Council and Board of Directors There were no changes to members of the Governing Council or Board of Directors during the quarter.
Operations and Programs During the third quarter, the Bank made the following announcements with respect to its target for the overnight rate:
- On July 12, 2017, the Bank announced that it was raising its target for the overnight rate to ¾ per cent. The Bank Rate was correspondingly raised to 1 per cent and the deposit rate to ½ per cent.
- On September 6, 2017, the Bank announced that it was raising its target for the overnight rate to 1 per
cent. The Bank Rate was correspondingly raised to 1 ¼ per cent and the deposit rate to ¾ per cent.
Risk Analysis The Risk Management section of the Management Discussion and Analysis (MD&A) for the year ended December 31, 2016, outlines the Bank’s risk-management framework and risk profile and reviews the key areas of risk— strategic risk, financial risk and operational risk.
The financial risks are discussed further in the notes to the December 31, 2016, Financial Statements, which are included in the Bank’s Annual Report for 2016.
The risks identified in the MD&A remain the key risks for the Bank.

Financial Statements
September 30, 2017

Management Responsibility Management of the Bank of Canada (the Bank) is responsible for the preparation and fair presentation of these condensed interim financial statements in accordance with the requirements of International Accounting Standard 34, Interim Financial Reporting (IAS 34), and for such internal controls as management determines are necessary to enable the preparation of condensed interim financial statements that are free from material misstatement. Management is also responsible for ensuring that all other information in the Quarterly Financial Report is consistent, where appropriate, with the condensed interim financial statements. Based on our knowledge, these unaudited condensed interim financial statements present fairly, in all material respects, the financial position, financial performance and cash flows of the Bank, as at the date of and for the periods presented in the condensed interim financial statements.
Stephen S. Poloz, Governor
Carmen Vierula, CPA, CA, Chief Financial Officer and Chief Accountant
Ottawa, Canada November 8, 2017

Condensed interim financial statements of the Bank of Canada as at September 30, 2017 (Unaudited)| 2
Condensed Interim Statement of Financial Position (Unaudited)(Millions of Canadian dollars)
As atSeptember 30, December 31,
2017 2016
AssetsCash and foreign deposits 16.3 19.3 Loans and receivables
Securities purchased under resale agreements (note 4) 7,001.0 8,277.0 Other receivables 8.2 5.2
7,009.2 8,282.2 Investments (note 4)
Government of Canada treasury bills 21,442.1 16,791.8 Government of Canada bonds 80,235.5 79,845.9 Other investments 399.5 395.0
102,077.1 97,032.7 Property and equipment (note 5) 566.8 570.7 Intangible assets (note 6) 40.1 36.2 Other assets (note 7) 188.6 164.9 Total assets 109,898.1 106,106.0
Liabilities and equityBank notes in circulation 82,091.9 80,478.6 Deposits (note 8)
Government of Canada 22,516.9 20,228.4 Members of Payments Canada 499.7 499.7 Other deposits 2,339.3 2,103.4
25,355.9 22,831.5 Securities sold under repurchase agreements (note 9) 1,300.0 1,500.0 Other liabilities (note 9) 658.8 808.9 Total liabilities 109,406.6 105,619.0 Equity (note 11) 491.5 487.0 Total liabilities and equity 109,898.1 106,106.0 109931.8
Stephen S. Poloz, Governor
Carmen Vierula, CPA, CA, Chief Financial Officer and Chief Accountant
(See accompanying notes to the condensed interim financial statements.)

Condensed interim financial statements of the Bank of Canada as at September 30, 2017 (Unaudited)| 3
Condensed Interim Statement of Net Income and Comprehensive Income (Unaudited)(Millions of Canadian dollars)
September 30, September 30, September 30, September 30,2017 2016 2017 2016
Income
Interest revenueInterest earned on investments 401.8 395.8 1,178.1 1,210.9 Dividend revenue - - 5.1 3.6 Interest earned on securities purchased under resale
agreements 13.5 10.2 32.4 27.5 Other interest revenue 0.1 - 0.2 0.1
415.4 406.0 1,215.8 1,242.1 Interest expense
Interest expense on deposits (57.2) (32.4) (121.8) (91.9)
Net interest income 358.2 373.6 1,094.0 1,150.2
Other revenue 1.1 2.3 3.9 5.3 Total income 359.3 375.9 1,097.9 1,155.5
ExpensesStaff costs 60.3 57.0 189.8 173.0 Bank note research, production and processing 17.0 10.3 34.4 32.7 Premises costs 6.5 8.4 14.9 25.4 Technology and telecommunications 12.1 10.3 30.7 26.1 Depreciation and amortization 11.7 8.8 38.1 25.5 Other operating expenses 17.5 16.6 54.2 49.0
Total expenses 125.1 111.4 362.1 331.7
Net income 234.2 264.5 735.8 823.8
Other comprehensive income (loss)Items that will not be reclassified to net income
Remeasurements of the net defined-benefit liability/asset 103.6 (15.4) 19.8 (165.2) Items that may be reclassified subsequently to net income
Change in fair value of available-for-sale financial assets (16.3) 9.1 (15.7) 1.0 Other comprehensive income (loss) 87.3 (6.3) 4.1 (164.2)
Comprehensive income 321.5 258.2 739.9 659.6
For the three-month
period ended
For the nine-month
period ended
(See accompanying notes to the condensed interim financial statements.)

Condensed interim financial statements of the Bank of Canada as at September 30, 2017 (Unaudited)| 4
Condensed Interim Statement of Changes in Equity (Unaudited)
(Millions of Canadian dollars)
For the three-month period ended September 30, 2017
Available-Share Statutory Special for-sale Retained
capital reserve reserve reserve earnings Total
As at July 1, 2017 5.0 25.0 100.0 370.6 - 500.6
Comprehensive income for the periodNet income - - - - 234.2 234.2 Remeasurements of the net
defined-benefit liability/asset - - - - 103.6 103.6 Change in fair value of BIS shares - - - (9.1) - (9.1) Change in fair value of Government of
Canada treasury bills - - - - (7.2) (7.2) - - - (9.1) 330.6 321.5
Surplus for the Receiver General
for Canada - - - - (330.6) (330.6)
As at September 30, 2017 5.0 25.0 100.0 361.5 - 491.5
For the nine-month period ended September 30, 2017Available-
Share Statutory Special for-sale Retainedcapital reserve reserve reserve earnings Total
As at January 1, 2017 5.0 25.0 100.0 357.0 - 487.0
Comprehensive income for the periodNet income - - - - 735.8 735.8
Remeasurements of the net
defined-benefit liability/asset - - - - 19.8 19.8 Change in fair value of BIS shares - - - 4.5 - 4.5 Change in fair value of Government of
Canada treasury bills - - - - (20.2) (20.2) - - - 4.5 735.4 739.9
Surplus for the Receiver General
for Canada - - - - (735.4) (735.4)
As at September 30, 2017 5.0 25.0 100.0 361.5 - 491.5
(See accompanying notes to the condensed interim financial statements.)

Condensed interim financial statements of the Bank of Canada as at September 30, 2017 (Unaudited)| 5
Condensed Interim Statement of Changes in Equity (Unaudited)
(Millions of Canadian dollars)
For the three-month period ended September 30, 2016
Available-Share Statutory Special for-sale Retained
capital reserve reserve reserve earnings Total
As at July 1, 2016 5.0 25.0 100.0 360.1 - 490.1
Comprehensive income for the periodNet income - - - - 264.5 264.5 Remeasurements of the net
defined-benefit liability/asset - - - - (15.4) (15.4) Change in fair value of BIS shares - - - 9.4 - 9.4 Change in fair value of Government of
Canada treasury bills - - - (0.3) - (0.3) - - - 9.1 249.1 258.2
Surplus for the Receiver General
for Canada - - - - (249.1) (249.1)
As at September 30, 2016 5.0 25.0 100.0 369.2 - 499.2
For the nine-month period ended September 30, 2016Available-
Share Statutory Special for-sale Retainedcapital reserve reserve reserve earnings Total
As at January 1, 2016 5.0 25.0 100.0 368.2 - 498.2
Comprehensive income for the periodNet income - - - - 823.8 823.8
Remeasurements of the net
defined-benefit liability/asset - - - - (165.2) (165.2) Change in fair value of BIS shares - - - 0.7 - 0.7 Change in fair value of Government of
Canada treasury bills - - - 0.3 - 0.3 - - - 1.0 658.6 659.6
Surplus for the Receiver General
for Canada - - - - (658.6) (658.6)
As at September 30, 2016 5.0 25.0 100.0 369.2 - 499.2
(See accompanying notes to the condensed interim financial statements.)

Condensed interim financial statements of the Bank of Canada as at September 30, 2017 (Unaudited)| 6
Condensed Interim Statement of Cash Flows (Unaudited)(Millions of Canadian dollars)
September 30, September 30, September 30, September 30,2017 2016 2017 2016
Cash flows from operating activitiesInterest received 258.0 284.2 1,100.9 1,169.8 Dividends received - 3.6 5.1 3.6 Other revenue received 0.3 1.3 4.2 7.0 Interest paid (57.1) (32.4) (121.9) (91.9) Payments to or on behalf of employees/suppliers and to
members of Payments Canada (147.0) (80.9) (371.0) (281.6) Net increase (decrease) in deposits (1,123.5) 367.9 2,524.4 2,283.4 Proceeds from maturity of securities purchased under resale
agreements – overnight repo 4,500.0 26,413.4 13,090.2 52,888.9 Acquisition of securities purchased under resale
agreements – overnight repo (4,500.0) (26,413.4) (13,090.2) (53,388.9) Repayments of securities sold under repurchase agreements (2,200.1) - (6,500.1) - Proceeds from securities sold under repurchase agreements 3,500.1 - 6,300.1 - Net cash provided by operating activities 230.7 543.7 2,941.7 2,590.3
Cash flows from investing activitiesNet decrease in Government of Canada treasury bills (845.9) (221.4) (4,654.4) (380.7) Purchases of Government of Canada bonds (4,736.7) (5,515.5) (14,561.4) (13,324.1) Proceeds from maturity of Government of Canada bonds 5,860.0 4,995.0 14,265.0 12,290.0 Proceeds from maturity of securities purchased under resale
agreements – term repo 19,736.1 19,751.9 55,045.0 48,593.4 Acquisition of securities purchased under resale
agreements – term repo (19,764.9) (19,782.0) (53,768.7) (50,505.0) Additions of property and equipment (7.7) (48.9) (29.5) (120.4) Additions of intangible assets (3.3) (1.1) (8.6) (3.8) Net cash provided by (used in) investing activities 237.6 (822.0) (3,712.6) (3,450.6)
Cash flows from financing activitiesNet increase (decrease) in bank notes in circulation (329.3) 424.0 1,613.3 1,461.9 Remittance of surplus to the Receiver General for Canada (150.1) (150.0) (843.8) (599.5) Net cash provided by (used in) financing activities (479.4) 274.0 769.5 862.4
Effect of exchange rate changes on foreign currency (0.9) 0.2 (1.6) (0.6)
Net increase (decrease) in cash and foreign deposits (12.0) (4.1) (3.0) 1.5
Cash and foreign deposits, beginning of period 28.3 16.8 19.3 11.2
Cash and foreign deposits, end of period 16.3 12.7 16.3 12.7
For the three-month
period ended
For the nine-month
period ended
(See accompanying notes to the condensed interim financial statements.)

Condensed interim financial statements of the Bank of Canada as at September 30, 2017 (Unaudited)| 7
Notes to the condensed interim financial statements of the Bank of Canada (Unaudited) For the period ended September 30, 2017
1. The business of the Bank of Canada
The Bank of Canada (the Bank) is the nation’s central bank. The Bank is a corporation established under the Bank of Canada Act, is wholly owned by the Government of Canada and is exempt from income taxes. The Bank does not offer banking services to the public.
The Bank is a Government Business Enterprise as defined by the Canadian Public Sector Accounting Standards and, as such, adheres to the standards applicable to publicly accountable enterprises as outlined by the Chartered Professional Accountants of Canada (CPA Canada). In compliance with this requirement, the Bank has developed accounting policies in accordance with International Financial Reporting Standards (IFRS).
The address of the Bank registered head office is 234 Wellington Street, Ottawa, Ontario.
The Bank’s mandate under the Bank of Canada Act is “to promote the economic and financial welfare of Canada.” The Bank’s activities and operations are undertaken in support of this mandate and not with the objective of generating revenue or profits. The Bank’s four core areas of responsibility are the following:
Monetary policy: The objective of monetary policy is to preserve the value of money by keeping inflation low, stable and predictable.
Financial system: The Bank promotes safe, sound and efficient financial systems, within Canada and internationally, and conducts transactions in financial markets in support of these objectives.
Funds management: The Bank provides funds-management services for the Government of Canada, the Bank itself and other clients. For the government, the Bank provides treasury-management services and administers and advises on the public debt and foreign exchange reserves.
Currency: The Bank designs, issues and distributes Canada’s bank notes, oversees the note distribution system and ensures a supply of quality bank notes that are readily accepted and secure against counterfeiting.
The Corporate Administration function supports the management of the Bank’s human resources, operations and strategic initiatives, as well as the stewardship of financial, physical, information and technology assets.
The Bank has the exclusive right to issue Canadian bank notes, and the face value of these bank notes is the most significant liability on the Bank’s statement of financial position. The Bank invests the proceeds from the issuance of bank notes into Government of Canada securities, which are acquired on a non-competitive basis. These assets enable the Bank to execute its responsibilities for the monetary policy and financial system functions.
Interest income derived from Government of Canada securities is the Bank’s primary source of revenue each year. The income generated from the assets backing the bank notes in circulation (net of bank note production and distribution costs) is referred to as “seigniorage,” which provides a stable and constant source of funding for the Bank’s operations, enabling it to function independently of government appropriations. A portion of this revenue is used to fund the Bank’s operations and reserves; the remaining net income is remitted to the Receiver General for Canada in accordance with the requirements of the Bank of Canada Act.

Condensed interim financial statements of the Bank of Canada as at September 30, 2017 (Unaudited)| 8
2. Basis of preparation
These condensed interim financial statements have been prepared in accordance with International Accounting Standard 34 Interim Financial Reporting (IAS 34), as issued by the International Accounting Standards Board (IASB). These condensed interim financial statements do not include all of the information and disclosures required for full annual financial statements and should be read in conjunction with the Bank’s audited financial statements for the year ended December 31, 2016. When necessary, the condensed interim financial statements include amounts based on informed estimates and the judgment of management. The results of operations for the interim period reported are not necessarily indicative of results expected for the year.
The Audit and Finance Committee of the Board of Directors approved the condensed interim financial statements on November 8, 2017.
Measurement base
The condensed interim financial statements have been prepared on a historical cost basis, except for the available-for-sale (AFS) financial assets, which are measured at fair value, and the net defined-benefit liability/asset of employee benefit plans, which is recognized as the net of the fair value of plan assets and the present value of the defined-benefit obligation.
Significant accounting estimates and judgments in applying accounting policies
The preparation of the condensed interim financial statements requires management to make judgments, estimates and assumptions based on information available at the reporting date that affect the application of accounting policies and the reported amounts of assets, liabilities, income and expenses, as well as related information. The Bank based its assumptions and estimates on information that was available when these financial statements were prepared. Existing circumstances and assumptions about future developments may change, however, in response to market fluctuations or circumstances that are beyond the control of the Bank. In such cases, the impact will be recognized in the financial statements of a future period.
Estimates and underlying assumptions are reviewed on an ongoing basis. Revisions to accounting estimates are recognized in the period in which the estimates are revised and in any future periods affected. Significant estimates are primarily in the area of the fair value of the shares in the Bank for International Settlements (BIS) (note 4), collateral (note 4) and employee benefits (note 10).
Seasonality
The total value of bank notes in circulation fluctuates throughout the year as a function of the seasonal demand for bank notes. Bank notes in circulation are at their lowest level at the end of the first quarter, while demand peaks in the second and fourth quarters around holiday periods. In addition to the regular term repo program, the Bank may issue term purchase under resale agreements to offset the increased bank note liability during periods of high seasonal demand.
Functional and presentation currency
The Bank’s functional and presentation currency is the Canadian dollar. The amounts in the notes to the condensed interim financial statements of the Bank are in millions of Canadian dollars, unless otherwise stated.
Fiscal-agent and custodial activities
Responsibility for the operational management of the Government of Canada’s financial assets and liabilities is borne jointly by the Bank (as fiscal agent for the Government of Canada) and the Department of Finance. In this fiscal-agent role, the Bank provides transactional and administrative support to the Government of Canada in certain areas, consistent with the requirement of section 24 of the Bank of Canada Act. The Bank does not bear the risks and rewards as part of its role as fiscal agent. The assets, liabilities, expenditures and revenues that this support relates to are those of the Government of Canada and are not included in the
Condensed interim financial statements of the Bank of Canada as at September 30, 2017 (Unaudited)| 9
financial statements of the Bank.
Securities safekeeping and other custodial activities are provided to foreign central banks, international organizations and other government-related entities. The assets, and income arising therefrom, are excluded from these financial statements since they are not assets or income of the Bank.
3. Significant accounting policies
The accounting policies used in the preparation of the condensed interim financial statements are consistent with those disclosed in the Bank of Canada’s financial statements for the year ended December 31, 2016.
There were no new or amended standards adopted by the Bank during the nine-month period ended September 30, 2017, that had a material impact on the condensed interim financial statements.
4. Financial instruments
The Bank’s financial instruments consist of cash and foreign deposits, securities purchased under resale agreements, advances to members of Payments Canada, other receivables, investments (consisting of Government of Canada treasury bills, Government of Canada bonds and other investments), bank notes in circulation, deposits, securities sold under repurchase agreements and other liabilities (excluding the net defined-benefit liability for the pension benefit plan and other employee benefit plans, and lease contracts).
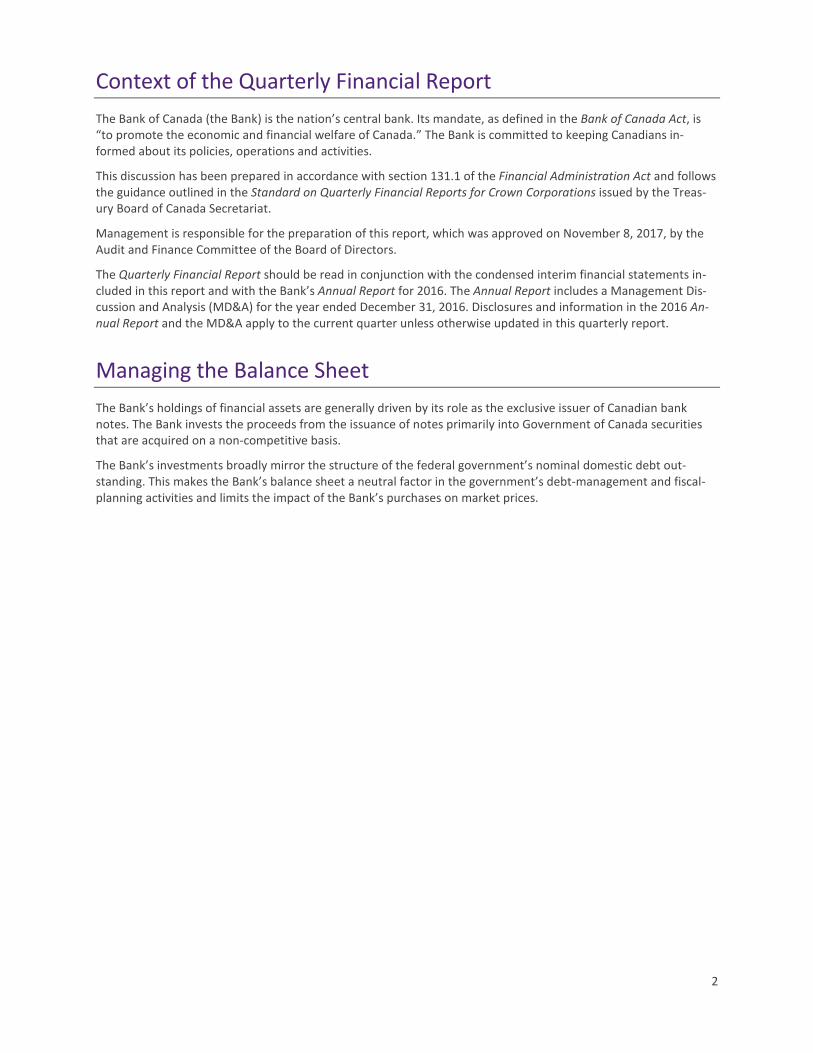
Securities purchased under resale agreements are fully collateralized in accordance with publicly disclosed collateral eligibility and margin requirements. The duration of securities purchased under resale agreements generally ranges between 1 and 90 business days.
The fair value of collateral held against securities purchased under resale agreements at the end of the reporting period is presented below.
The Bank’s securities sold under repurchase agreements, totalling $1,300.0 million ($1,500.0 at December 31, 2016), are collateralized obligations of the Bank guaranteed by Government of Canada securities. The fair value of collateral pledged by the Bank against securities sold under resale agreements at the end of the reporting period is $1,300.2 million ($1,500.5 at December 31, 2016). As at September 30, 2017, there were no advances to members of Payments Canada ($Nil at December 31, 2016). The Bank operates a Securities-Lending Program to support the liquidity of Government of Canada securities by providing the market with a secondary and temporary source of these securities. These securities-lending transactions are fully collateralized by securities and are generally one business day in duration. As at September 30, 2017, there were no loaned securities in the Bank’s investments ($Nil at December 31, 2016). Measurement of financial instruments
Cash and foreign deposits, Government of Canada treasury bills, and BIS shares are measured at fair value. All other financial instruments are measured at amortized cost using the effective interest method, with the exception of bank notes in circulation, which are measured at face value.
$ % $ %
Securities issued or guaranteed by the
Government of Canada 1,276.0 17.4 878.4 10.1
Securities issued or guaranteed by a
provincial government 6,042.7 82.6 7,796.4 89.9
Total fair value of collateral pledged 7,318.6 100.0 8,674.8 100.0
As a percentage of amortized cost 105% 105%
September 30,
2017
December 31,
2016

Condensed interim financial statements of the Bank of Canada as at September 30, 2017 (Unaudited)| 10
Financial instruments measured at fair value
Financial instruments measured at fair value are classified using a fair-value hierarchy that reflects the significance of the inputs used in making the measurements:
Level 1—quoted prices (unadjusted) in active markets for identical assets or liabilities;
Level 2—inputs other than quoted prices included in Level 1 that are observable for the assets or liabilities, either directly (i.e., as prices) or indirectly (i.e., derived from prices); and
Level 3—inputs for the assets or liabilities that are not based on observable market data (unobservable inputs).
The fair-value hierarchy requires the use of observable market inputs wherever such inputs exist. In measuring fair value, a financial instrument is classified at the lowest level of the hierarchy for which a significant input has been considered.
Level 1 Level 2 Level 3 Total
Financial assets at fair value as at September 30, 2017Government of Canada treasury bills 21,442.1 - - 21,442.1 BIS shares - - 399.5 399.5
21,442.1 - 399.5 21,841.6
Financial assets at fair value as at December 31, 2016Government of Canada treasury bills 16,791.8 - - 16,791.8 BIS shares - - 395.0 395.0
16,791.8 - 395.0 17,186.8
There were no transfers of amounts between levels during the nine-month period ended September 30, 2017.
The fair value of the BIS shares is estimated to be 70 per cent of the Bank’s interest in the net asset value of the BIS at the reporting date. The 30 per cent discount to the net asset value is equivalent to the methodology applied by the BIS for all share repurchases since the 1970s and was further endorsed in a decision by the International Court at the Hague relating to a share repurchase by the BIS in 2001 (the last share repurchase conducted by the BIS). The Bank considers the 30 per cent discount against the net asset value of the BIS to be the appropriate basis for valuation. The Bank expects the value of the BIS shares to fluctuate over time in conjunction with the strength of the BIS balance sheet and exchange rates. There were no changes to the valuation technique during the nine-month period ended September 30, 2017.
The following table reconciles the estimated fair value of the BIS shares determined using Level 3 fair-value measurements:
September 30, September 30, September 30, September 30,
2017 2016 2017 2016
Opening balance at beginning of period 408.6 396.5 395.0 405.2
Change in fair value recorded
through Other comprehensive income (9.1) 9.4 4.5 0.7
Closing balance at period-end 399.5 405.9 399.5 405.9
For the three-month
period ended
For the nine-month
period endedBank of Canada key management personnel compensationYear ended 31 December 2008 2007Short=-term employee benefits 2,109.1 2,358.9Post-employment benefits (4.9) (4.1)Other long-term benefits (125.9) (76.1)Termination benefits 21,633.6 (257.7)Total compensation (39,480.3) (42,662.2)
Bank of Canada key management personnel compensationYear ended 31 December 2008 2007Short=-term employee benefits 2,109.1 2,358.9Post-employment benefits (4.9) (4.1)Other long-term benefits (125.9) (76.1)Termination benefits 21,633.6 (257.7)Total compensation (39,480.3) (42,662.2)
Bank of Canada key management personnel compensationYear ended 31 December 2008 2007Short=-term employee benefits 2,109.1 2,358.9Post-employment benefits (4.9) (4.1)Other long-term benefits (125.9) (76.1)Termination benefits 21,633.6 (257.7)Total compensation (39,480.3) (42,662.2)
Bank of Canada key management personnel compensationYear ended 31 December 2008 2007Short=-term employee benefits 2,109.1 2,358.9Post-employment benefits (4.9) (4.1)Other long-term benefits (125.9) (76.1)Termination benefits 21,633.6 (257.7)Total compensation (39,480.3) (42,662.2)
Condensed interim financial statements of the Bank of Canada as at September 30, 2017 (Unaudited)| 11
Financial instruments not measured at fair value The fair value of Government of Canada bonds is determined based on unadjusted quoted market prices in an active market (Level 1). The fair value of Government of Canada bonds was $82,156.0 million at September 30, 2017 ($83,528.5 million at December 31, 2016). The fair value of all other financial instruments approximates their carrying value.
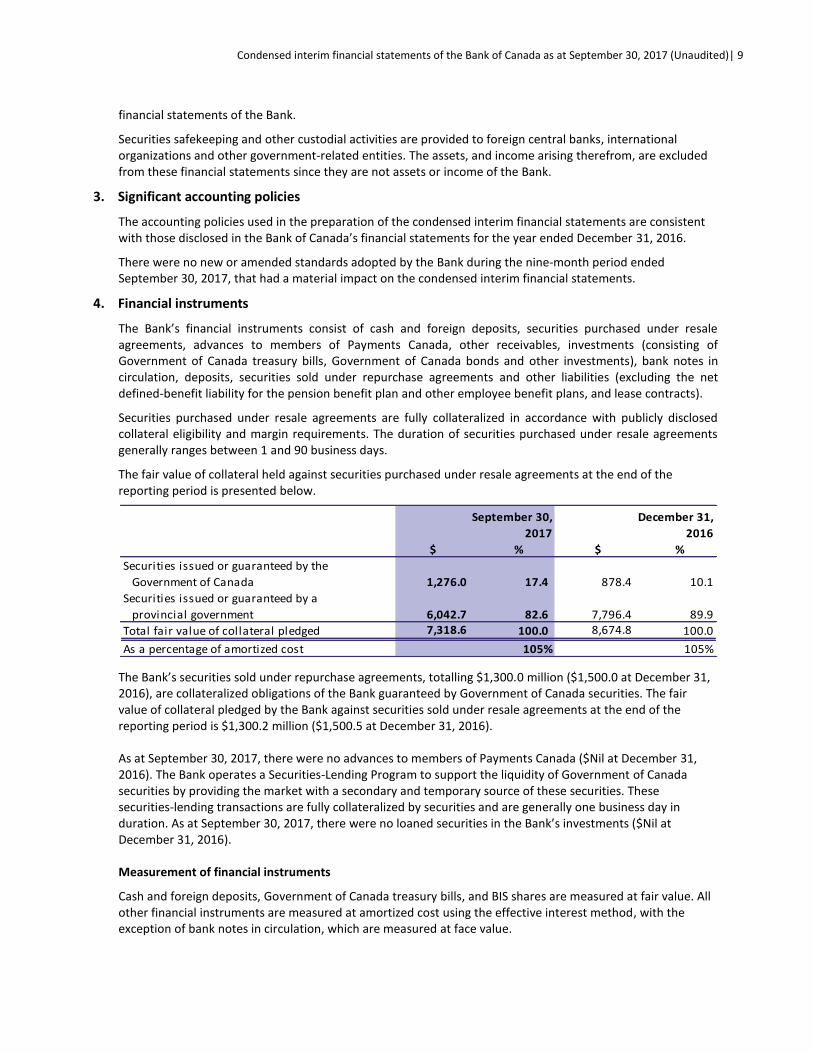
5. Property and equipment
Land and
buildings
Computer
equipment
Other
equipment Total2017Cost
As at December 31, 2016 560.8 68.8 113.8 743.4 Additions 13.6 9.1 6.8 29.5 Disposals (0.5) (1.0) (37.0) (38.5) Transfers to other asset categories (0.6) 3.2 (5.3) (2.7) As at September 30, 2017 573.3 80.1 78.3 731.7
DepreciationAs at December 31, 2016 (90.3) (23.1) (59.3) (172.7) Depreciation expense (12.3) (8.5) (9.5) (30.3) Disposals 0.5 0.7 36.9 38.1 Transfers to other asset categories - - - - As at September 30, 2017 (102.1) (30.9) (31.9) (164.9)
Carrying amountsAs at December 31, 2016 470.5 45.7 54.5 570.7
As at September 30, 2017 471.2 49.2 46.4 566.8

Condensed interim financial statements of the Bank of Canada as at September 30, 2017 (Unaudited)| 12
Land and
buildings
Computer
equipment
Other
equipment Total
2016
Cost
As at December 31, 2015 457.4 41.0 82.9 581.3
Additions 139.8 18.9 6.6 165.3
Disposals - (3.2) - (3.2)
Transfers to other asset categories (36.4) 12.1 24.3 -
As at December 31, 2016 560.8 68.8 113.8 743.4
Depreciation
As at December 31, 2015 (84.4) (20.9) (44.6) (149.9)
Depreciation expense (5.9) (5.4) (14.7) (26.0)
Disposals - 3.2 - 3.2
Transfers to other asset categories - - - -
As at December 31, 2016 (90.3) (23.1) (59.3) (172.7)
Carrying amounts
As at December 31, 2015 373.0 20.1 38.3 431.4
As at December 31, 2016 470.5 45.7 54.5 570.7
Land and
buildings
Computer
equipment
Other
equipment Total
Projects in progress 2017Included in Carrying amounts at September 30, 2017 2.0 8.3 0.5 10.8 Commitments at September 30, 2017 4.0 0.1 - 4.1
Projects in progress 2016Included in Carrying amounts at December 31, 2016 0.5 11.0 6.5 18.0 Commitments at December 31, 2016 17.1 0.1 16.4 33.6

Condensed interim financial statements of the Bank of Canada as at September 30, 2017 (Unaudited)| 13
6. Intangible assets
Internally generated
software
Other
software Total2017Cost
As at December 31, 2016 53.4 63.1 116.5Additions 4.2 4.4 8.6Disposals - - - Transfers to other asset categories - 2.7 2.7As at September 30, 2017 57.6 70.2 127.8
AmortizationAs at December 31, 2016 (42.5) (37.8) (80.3)Amortization expense (1.7) (5.7) (7.4)Disposals - - - Transfers to other asset categories - - - As at September 30, 2017 (44.2) (43.5) (87.7)
Carrying amounts
As at December 31, 2016 10.9 25.3 36.2
As at September 30, 2017 13.4 26.7 40.1

Condensed interim financial statements of the Bank of Canada as at September 30, 2017 (Unaudited)| 14
Internally generated
software
Other
software Total2016Cost
As at December 31, 2015 49.1 64.1 113.2Additions 4.3 3.6 7.9Disposals - (4.6) (4.6)Transfers to other asset categories - - - As at December 31, 2016 53.4 63.1 116.5
Accumulated amortizationAs at December 31, 2015 (41.0) (34.3) (75.3)Amortization expense (1.5) (8.1) (9.6)Disposals - 4.6 4.6Transfers to other asset categories - - - As at December 31, 2016 (42.5) (37.8) (80.3)
Carrying amounts
As at December 31, 2015 8.1 29.8 37.9
As at December 31, 2016 10.9 25.3 36.2
Internally
generated
software
Other
software Total
Projects in progress 2017Included in Carrying amounts at September 30, 2017 8.4 6.8 15.2 Commitments at September 30, 2017 - - -
Projects in progress 2016Included in Carrying amounts at December 31, 2016 4.6 2.5 7.1 Commitments at December 31, 2016 - - -

Condensed interim financial statements of the Bank of Canada as at September 30, 2017 (Unaudited)| 15
7. Other assets
September 30,
2017
December 31,
2016
Bank note inventory 5.4 3.0Net defined-benefit asset (note 10) 165.6 131.2All other assets 17.6 30.7Total other assets 188.6 164.9
8. Deposits
The liabilities within Deposits consist of $25,355.9 million in Canadian-dollar demand deposits ($22,831.5 million at December 31, 2016). The Bank pays interest on the deposits for the Government of Canada, members of Payments Canada and other financial institutions at short-term market rates.
Deposits from the Government of Canada consist of $2,516.9 million for operational balances and $20,000.0 million held for the prudential liquidity-management plan ($228.4 million and $20,000.0 million, respectively, at December 31, 2016).
9. Securities sold under repurchase agreements and other liabilities
Securities sold under repurchase agreements
Balances outstanding of $1,300.0 million at September 30, 2017 ($1,500.0 million at December 31, 2016) consist of agreements with original terms to maturity of one business day and are collateralized obligations of the Bank guaranteed by Government of Canada securities as described in note 4.
Composition of other liabilities
September 30,
2017
December 31,
2016
Surplus payable to the Receiver General for Canada 360.4 468.8Net defined-benefit liability (note 10) Pension benefit plan 54.2 38.2 Other benefit plans 182.4 172.0All other liabilities and provisions 61.8 129.9Total other liabilities 658.8 808.9

Condensed interim financial statements of the Bank of Canada as at September 30, 2017 (Unaudited)| 16
Surplus payable to the Receiver General for Canada
The following table reconciles the opening and closing balances of the surplus payable to the Receiver General for Canada:
September 30,
2017
September 30,
2016
September 30,
2017
September 30,
2016
Opening balance at beginning of period 179.8 209.5 468.8 249.5Remittance of surplus to the
Receiver General for Canada (150.0) (150.0) (843.8) (599.5)Surplus for the Receiver General for Canada 330.6 249.1 735.4 658.6Closing balance at period-end 360.4 308.6 360.4 308.6
For the three-month
period ended
For the nine-month
period ended
All other liabilities and provisions
All other liabilities and provisions consists mainly of accounts payable, accrued liabilities, and provisions.
10. Employee benefits
The changes in the net defined-benefit asset (liability) for the period are as follows:
Pension benefit plans Other benefit plans
September 30,
2017
December 31,
2016
September 30,
2017
December 31,
2016
Opening balance at beginning of period 93.0 97.7 (172.0) (168.2)
Bank contributions 23.5 27.5 - -
Current service cost (32.0) (37.5) (4.0) (5.3)
Net interest cost 2.1 3.1 (5.5) (6.8)
Administration costs (1.6) (2.0) - -
Net benefit payments and transfers - (0.1) 5.6 7.9
Net remeasurement gains (losses) 26.4 4.3 (6.5) 0.4
Closing balance at period-end 111.4 93.0 (182.4) (172.0)
Net defined-benefit asset 165.6 131.2 - -
Net defined-benefit l iability (54.2) (38.2) (182.4) (172.0)
Net defined-benefit asset (liability) 111.4 93.0 (182.4) (172.0)

Condensed interim financial statements of the Bank of Canada as at September 30, 2017 (Unaudited)| 17
Expenses and contributions for the employee benefit plans for the three- and nine-month periods ended September 30, 2017, are presented in the tables below:
September 30,
2017
September 30,
2016
September 30,
2017
September 30,
2016
ExpensesPension benefit plans 11.2 10.0 31.5 27.7Other benefit plans 3.4 3.4 9.5 9.4Total benefit plan expenses 14.6 13.4 41.0 37.1
For the three-month
period ended
For the nine-month
period ended
September 30,
2017
September 30,
2016
September 30,
2017
September 30,
2016
Contributions for the three-month
Xperiod endedEmployer contributions 7.9 7.4 - - Employee contributions 3.6 2.9 - - Total contributions 11.5 10.3 - -
Contributions for the nine-month
Xperiod endedEmployer contributions 23.5 21.9 - - Employee contributions 10.0 8.6 - - Total contributions 33.5 30.5 - -
Other benefit plans
(unfunded)
Pension plans
(funded)
The Bank remeasures its defined-benefit obligations and the fair value of plan assets at interim periods. The discount rate is determined by reference to Canadian AA-rated corporate bonds with terms to maturity approximating the duration of the obligation according to guidance issued by the Canadian Institute of Actuaries. The net defined-benefit liability/asset is measured using the discount rates in effect as at the period-end, which are shown in the table below:
September 30,
2017
December 31,
2016
Discount ratePension benefit plans 3.9% 3.9%Other benefit plans 3.3 - 3.9% 3.2 - 4.0%
The Bank recorded remeasurement gains on the net defined-benefit liability/asset during the three and nine-month periods ended September 30, 2017, of $103.6 million and $19.8 million, respectively (remeasurement losses of $15.4 million and $165.2 million, respectively, for the three- and nine-month periods ended September 30, 2016). The remeasurement gain recorded during the three-month period ended September 30, 2017, is mainly the result of an increase in the discount rate used to value the obligation from the previous quarter. The remeasurement gain recorded during the nine-month period ended September 30, 2017, is mainly the result of positive asset returns.

Condensed interim financial statements of the Bank of Canada as at September 30, 2017 (Unaudited)| 18
11. Equity
The Bank manages its capital to ensure compliance with the Bank of Canada Act. There were no other externally imposed capital requirements at the end of the reporting period.
The elements of equity are shown in the table below:
September 30,
2017
December 31,
2016
Share capital 5.0 5.0Statutory reserve 25.0 25.0Special reserve 100.0 100.0Available-for-sale reserve 361.5 357.0Retained earnings - - Total equity 491.5 487.0
Share capital
The authorized capital of the Bank is $5.0 million divided into 100,000 shares with a par value of $50 each. The shares are fully paid and have been issued to the Minister of Finance, who holds them on behalf of the Government of Canada.
Statutory reserve
The statutory reserve was accumulated out of net income until it reached the stipulated maximum amount of $25.0 million in 1955, consistent with the requirement of section 27 of the Bank of Canada Act.
Special reserve
The special reserve was created in 2007 further to an amendment to the Bank of Canada Act to offset potential unrealized valuation losses due to changes in the fair value of the Bank’s available-for-sale portfolio. The amount held in the special reserve is reviewed regularly for appropriateness using value-at-risk analysis and scenario-based stress tests and may be amended, pursuant to a resolution passed by the Board of Directors. This reserve is subject to a ceiling of $400 million; an initial amount of $100 million was established in September 2007, consistent with the requirement of section 27.1 of the Bank of Canada Act.
Available-for-sale reserve
The available-for-sale reserve represents the net unrealized fair-value gains of each of the Bank’s AFS financial assets, as shown below:
September 30,
2017
December 31,
2016
Government of Canada treasury bills - - BIS shares 361.5 357.0Available-for-sale reserve 361.5 357.0
Retained earnings
The net income of the Bank, less any allocation to reserves, is considered to be ascertained surplus (surplus) and is transferred to the Receiver General for Canada, consistent with the requirement of section 27 of the Bank of Canada Act.

Condensed interim financial statements of the Bank of Canada as at September 30, 2017 (Unaudited)| 19
The Bank’s remittance agreement with the Minister of Finance was designed to enable the Bank to manage its equity requirements with consideration for the volatility arising from fair-value changes and remeasurements (which are recorded in Other comprehensive income). This agreement allows the Bank to withhold any increase in cumulative net unrealized losses on AFS financial assets, unrealized remeasurements of the net defined-benefit liability/asset on defined-benefit plans and other unrealized or non-cash losses arising as a result of changes in accounting standards or legislation from its remittance to the Receiver General for Canada. Any decrease in withheld cumulative net unrealized non-cash losses is added to the remittance.
During the nine-month period ended September 30, 2017, the Bank withheld $0.4 million from its remittances ($165.2 million withheld in 2016) and, as at September 30, 2017, $109.8 million in withheld remittances was outstanding ($109.4 million as at December 31, 2016).
12. Related parties
The Bank is related in terms of common ownership to all Government of Canada departments, agencies and Crown corporations. To achieve its monetary policy objectives, the Bank maintains a position of structural and functional independence from the Government of Canada through its ability to fund its own operations without external assistance and through its management and governance.
In the normal course of its operations, the Bank enters into transactions with related parties, and material transactions and balances are presented in these financial statements. Not all transactions between the Bank and government-related entities have been disclosed, as permitted by the partial exemption available to wholly owned government entities in International Accounting Standard 24 Related Party Disclosures (IAS 24).
The Bank provides funds-management, fiscal-agent and banking services to the Government of Canada, as mandated by the Bank of Canada Act, and does not recover the costs of these services.
The Bank provides management, investment and administrative support to the Bank of Canada Pension Plan, for which costs are fully recovered.
13. Comparative figures
Certain comparative figures have been reclassified to conform to the current period’s presentation, which distinguishes the nature of overnight repo operations from term repo operations in the Condensed Interim Statement of Cash Flows.
For the comparative Condensed Interim Statement of Cash Flows, amounts related to the acquisition and proceeds from the maturity of term repo operations were reclassified from operating activities to investing activities. As a result, cash flows from operating activities increased by $30.1 million for the three-month period and increased by $1,911.6 million for the nine-month period ended September 30, 2016, for which the offsetting impact was seen in cash flows from investing activities.