Embed Size (px)
Citation preview
Oxford Quarterly Gas Review: 2
Thierry Bros
June 2018
Quarterly Gas Review Analysis of Prices and Recent Events
Analysis of Prices and Recent Events
Thanks to Argus Media, we have updated and improved our “LNG tightness” metric that measures the spread
between the US Gulf Coast LNG FOB and the Henry Hub price. The higher the level of the metric the tighter
the market, with LNG needing to be attracted to tight gas markets (in recent weeks in Asia or Europe).
On a regional basis we discuss the EU 2030 unknowns at a time when some kind of agreement is expected
to be made between the EU Parliament, the EU Commission and the EU Council. We show that the biggest
reductions in CO2 emissions occur when primary energy consumption is decreased. The change in energy
mix towards greener fuels has so far been much less important. One of the main EU 2020 targets was to
achieve its CO2 reduction by being more energy efficient. This worked well in 2006-2014, when for the first
time ever the EU managed to grow its GDP while decreasing its energy consumption. This then seemed to
be a major achievement but, since 2014, the usual positive coupling between GDP and primary energy
consumption has restarted. We argue that if the 2006-2014 energy efficiency boost is a non-repeatable
event, the EU will not be on track to meet the increased energy savings being discussed to enable the
implementation of its 2030 Energy Strategy and it would therefore need to move out of coal and oil much
faster than anticipated, as the UK example shows.
The irony of this is that as mainstream research and policymakers are now using the 2006-2014 efficiency
boost as a theory, making it a conventional long-term assumption, this assumption is now already wrong and
may not survive until the end of this decade! This could also further negatively impact the business models
of European utilities that have diversified away from generating energy (away from nuclear in Germany and
coal in the UK) into energy efficiency. If efficiency is no longer easily achievable, their new business models
are going to suffer again in the future. We could even see energy management becoming more important
than energy efficiency in a world where energy demand is growing.
Quarterly Focus: A review of IOC production, reserves & strategy
After providing a detailed analysis of hydrocarbon production and reserves for major oil & gas companies,
we look at the major challenges IOCs are now facing in a fast energy transition post-COP21 world and find
5 major challenges:
Moral challenge
Financial challenge
Challenge to build a long term business model
Challenge of “new” entrants that better master big data and customer service
Chinese challenge
The world has never been addicted to oil but to cheap energy. With renewable energy cheaper, the world
addiction to energy is moving into renewables. Hence, we doubt that fossil-based companies that are
dependent on resource prices could continue to thrive when the world moves away from this resource. In
our quest for a net-zero carbon emission world, the power of influence is shifting away from energy
producers. But who is going to get it in the future? Consumers? Google? Tesla? or someone else? And,
more importantly, who will retain the margin if we move to a zero marginal cost renewable world?
2 The contents of this paper are the author’s sole responsibility. They do not necessarily represent the views of
the Oxford Institute for Energy Studies or any of its Members.
Analysis of Prices and Recent Events
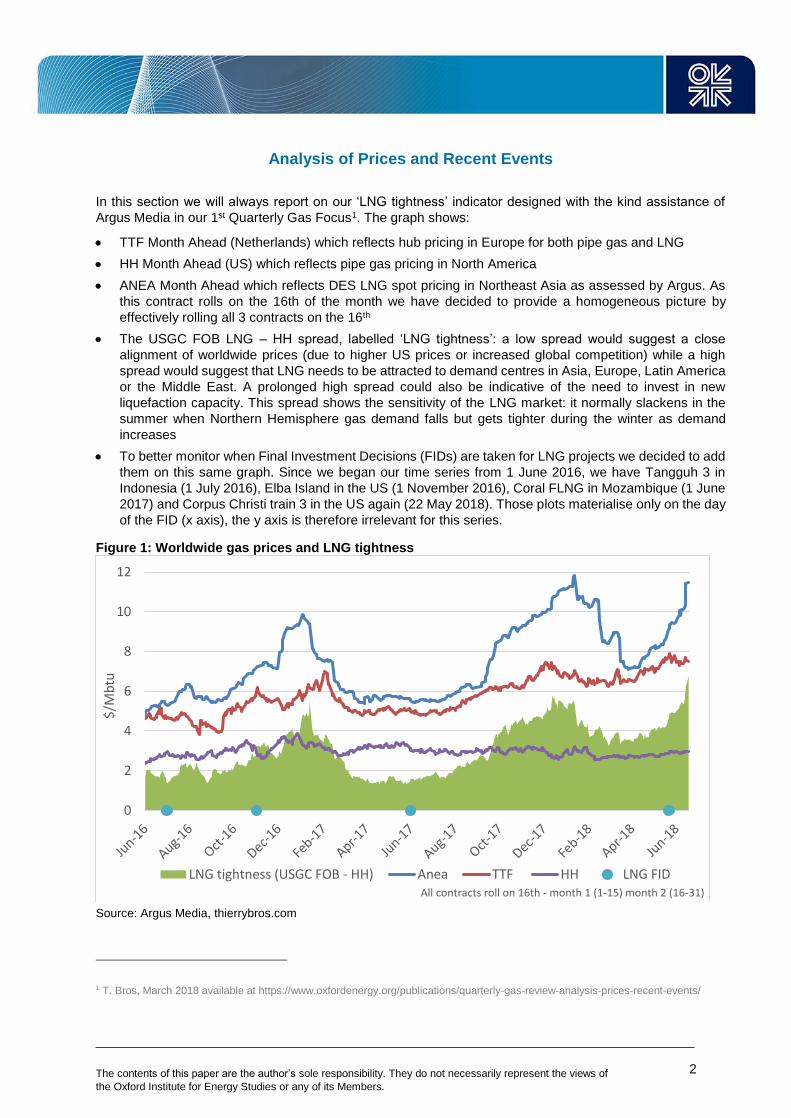
In this section we will always report on our ‘LNG tightness’ indicator designed with the kind assistance of
Argus Media in our 1st Quarterly Gas Focus1. The graph shows:
TTF Month Ahead (Netherlands) which reflects hub pricing in Europe for both pipe gas and LNG
HH Month Ahead (US) which reflects pipe gas pricing in North America
ANEA Month Ahead which reflects DES LNG spot pricing in Northeast Asia as assessed by Argus. As
this contract rolls on the 16th of the month we have decided to provide a homogeneous picture by
effectively rolling all 3 contracts on the 16th
The USGC FOB LNG – HH spread, labelled ‘LNG tightness’: a low spread would suggest a close
alignment of worldwide prices (due to higher US prices or increased global competition) while a high
spread would suggest that LNG needs to be attracted to demand centres in Asia, Europe, Latin America
or the Middle East. A prolonged high spread could also be indicative of the need to invest in new
liquefaction capacity. This spread shows the sensitivity of the LNG market: it normally slackens in the
summer when Northern Hemisphere gas demand falls but gets tighter during the winter as demand
increases
To better monitor when Final Investment Decisions (FIDs) are taken for LNG projects we decided to add
them on this same graph. Since we began our time series from 1 June 2016, we have Tangguh 3 in
Indonesia (1 July 2016), Elba Island in the US (1 November 2016), Coral FLNG in Mozambique (1 June
2017) and Corpus Christi train 3 in the US again (22 May 2018). Those plots materialise only on the day
of the FID (x axis), the y axis is therefore irrelevant for this series.
Figure 1: Worldwide gas prices and LNG tightness
Source: Argus Media, thierrybros.com
1 T. Bros, March 2018 available at https://www.oxfordenergy.org/publications/quarterly-gas-review-analysis-prices-recent-events/
0
2
4
6
8
10
12
$/M
btu
All contracts roll on 16th - month 1 (1-15) month 2 (16-31)
LNG tightness (USGC FOB - HH) Anea TTF HH LNG FID
3 The contents of this paper are the author’s sole responsibility. They do not necessarily represent the views of
the Oxford Institute for Energy Studies or any of its Members.
The Australian Competition and Consumer Commission (ACCC)2 decided on 27 April to publish monthly
LNG netback3 prices on its website soon. The ACCC says it has found that LNG netback prices are a key
factor in influencing domestic Australian gas prices, and that improved transparency should improve the
competitive bargaining process. The LNG netback prices will be derived using a monthly average of the daily
prices published by a commodity price reporting agency and will be netted back using estimates of the cost
of shipping, liquefaction and transportation. The monthly price series will extend back to the beginning of
2016. This is more or less the same rationale we used in our Q1 Gas Review when we designed our ‘LNG
tightness’ indicator with the idea of providing the market with information about:
Seasonality, with typically higher tightness during the northern hemisphere winter
Short-term volatility, with prices having changed rapidly over short periods
Structural changes, with general price levels reflecting the supply and demand dynamics of the
international LNG market
US LNG only became available in February 2016, hence our graph dates from June 2016.
We have taken the Argus Media FOB LNG price from the US Gulf of Mexico (ie the highest netback available
in the US). To avoid using estimates for cost of liquefaction we used the USGC FOB LNG – HH spread. ‘The
ACCC’s publication will clearly set out the step-by-step calculations used in its published series and provide
information about the underlying assumptions. This would provide market participants with additional
relevant and consistent information on which to base their negotiations and discussions, as well as the
opportunity to perform calculations by substituting their own assumptions about particular inputs.’4 Hopefully
when this is published we will be able to better understand the Australians estimates. While the Australian
figure is a conceptual figure that can only be applied to the domestic market5, our ‘LNG tightness’ is much
more actual (and we expect USGC FOB LNG with a future curve to be traded sooner rather than later) and
represents a worldwide view, as we do not have to estimate transport and liquefaction costs, which are both
rather opaque, particularly in Australia.
It is interesting to keep track of this ‘LNG tightness’ in a fast growing and changing LNG world. In April we
witnessed on the supply side the commercial start-up of Dominion Cove Point LNG, the second US exporter.
During its Q1 18 results presentation, on 26 April, Total stated that the Yamal LNG train in Russia was
running at 6.4 mtpa, significantly higher than its design capacity of 5.5 mtpa. Finally, Cameroon FLNG (1.2
mtpa) exported its first cargo in May; it is the 19th exporter country operating. And on the demand side,
Bangladesh joined the ranks of LNG importing countries with an FSRU, in April 2018. There are now 41
countries importing LNG.
While the US HH price seems to never move from its c. 3$/Mbtu range, European gas prices slumped in
2016 and for part of 2017 due to relatively mild weather impacting demand. But they recovered towards the
end of 2017 due to some market tightness and soared in Q1 18 on back-to-back cold weather systems that
took hold across Europe in late February and March. In addition, the cold winter in Europe didn’t allow TTF
to drop significantly during the shoulder months, as depleted storage had to be refilled. With UK’s major
storage facility at Rough out of action, combining with a rebound in gas demand (in particular in winter),
traders are realising that European storage needs to be filled to a higher level this coming winter. We should
therefore expect the overall storage level to be above the 949 TWh (89.2% full) reached on 29 October
2 Press release available at https://www.accc.gov.au/media-release/more-transparency-on-gas-pricing and full report at
https://www.accc.gov.au/system/files/Gas%20inquiry%20April%202018%20interim%20report.pdf 3 The ‘LNG netback price’ is an export parity price that represents a domestic supplier’s opportunity cost of supplying gas to the
domestic market, when the alternative is exporting the gas as additional LNG, above the long-term contractual obligations. It is
calculated by taking the Asian spot price that could be received and subtracting or ‘netting back’ the costs incurred by the supplier to
transport, convert the gas to LNG and ship it to the point of delivery. 4 Page 37 of the report 5 ‘Further, given the possibility of LNG import facilities being introduced on the east coast, import parity prices may also become a
relevant pricing marker for domestic gas prices. The ACCC will consider publishing an import parity price based on an appropriate
measure of LNG spot or contract prices.’ (Page 45)
4 The contents of this paper are the author’s sole responsibility. They do not necessarily represent the views of
the Oxford Institute for Energy Studies or any of its Members.
20176. With a low of 192.2 TWh (18% full) reached on 30 March 2018, this means that before next winter,
above 757 TWh should be injected in European storage vs 673 TWh injected between 28 March and 29
October 2017, a minimal growth of 12.5%! Unexpectedly, the future curve went up as we were heading to
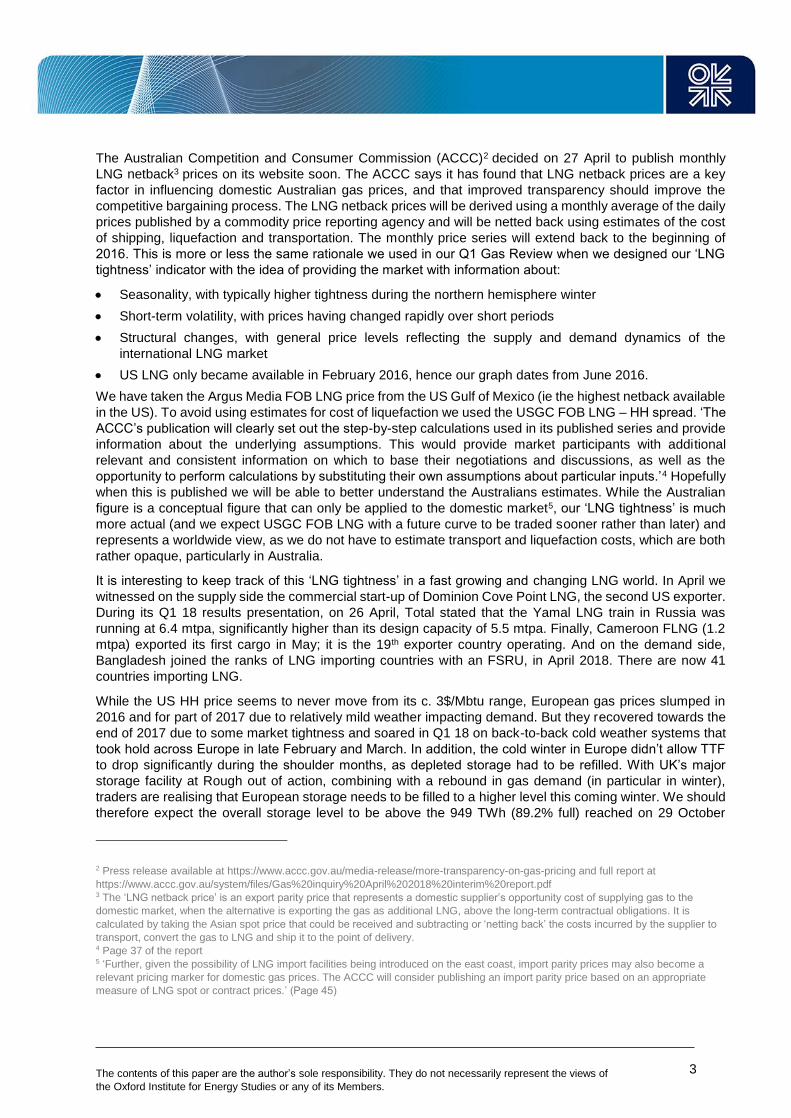
summer and our ‘LNG tightness’ indicator reflects this. Finally, in its FY 2017 results, Gazprom mentioned
that its Europe realised prices are going up from 176$/1,000cm in 2016 to 200$/1,000cm in 2017 and expects
220$/1,000cm in 2018e7 as its sales are split: 32% oil indexed, 25% linked to gas prices, 17% indexed to a
hybrid of oil, oil products and gas and 26% priced according to fixed, bilateral contracts. At least for Far
Abroad, with the smallest spread between Gazprom realised price and NBP since 2008, it is now possible
to conclude that the vast majority of Gazprom sales are under some kind of spot gas pricing.
Figure 2: Yearly averages of Gazprom Far Abroad Prices vs NBP Month-Ahead
Source: Gazprom, Argus Media, thierrybros.com
Both the oil and gas price increases are contributing to this expected 2018 price increase. Importantly, the
re-imposition of US economic sanctions against Iran on 8 May had a bullish impact on oil prices, with Brent
rising to a 3.5-year high above 80$/b, a move that had a knock-on effect on European spot gas and LNG
pricing.
In China, the 2017 surge in imports is continuing with a 68% growth in Q1 2018 vs the same period last
year8. This means that growth in Chinese LNG imports was again behind the high ANEA numbers in Q1 18.
Spot demand from China and South Korea continued to be robust and persistent strength in crude oil prices
fuelled the bullish sentiment for ANEA prices during Q2 2018, pushing our LNG tightness indicator above
6$/Mbtu. Our ‘LNG tightness’ shows very well that so far, this summer, gas markets have not been relaxed.
According to the ACCC, ‘The LNG netback prices based on measures of recent and historic LNG prices are
not likely to be the most relevant price marker for negotiations between a supplier and a buyer concerning
gas supply that commences at some time in the future. It would be more relevant to calculate the LNG
netback prices based on measures of LNG spot prices that are expected to prevail in the market during the
supply period.’9 This is exactly why in our last Gas Quarterly Review we focused our work on calculating the
6 From gie.eu transparency platform 7 After reporting 232$/1,000cm for Q1 2018 on 30 May 2018, Gazprom deputy CEO Alexander Medvedev provided this guidance in
June 2018. 8 According to Cedigaz, disclosed at the Flame conference in May 2018 9 Page 43 of the ACCC Gas inquiry April 2018 interim report available at https://www.accc.gov.au/publications/serial-publications/gas-
inquiry-2017-2020/gas-inquiry-april-2018-interim-report
-40%
-20%
0%
20%
40%
60%
80%
0
2
4
6
8
10
12
2005 2007 2009 2011 2013 2015 2017
$/M
btu
Gazprom ($/Mbtu) NBP ($/Mbtu) Spread (%)
5 The contents of this paper are the author’s sole responsibility. They do not necessarily represent the views of
the Oxford Institute for Energy Studies or any of its Members.
spare capacity in the global gas market in 2021e. The Australian government is very worried about the
negative impact of LNG exports (higher domestic prices and much lower taxes than expected) but seems
not to understand that the law curbing gas export and oil-indexed LNG contract prices are affecting
Australia’s competitive position in the pecking order of LNG suppliers.
Following our spare capacity calculations provided in our focus in the latest gas quarterly review 10 the
industry is starting to solve this investment problem to satisfy growing demand with Cheniere11 on 22 May
taking FID on Corpus Christi LNG expansion12 (the first new liquefied natural gas project to go ahead in the
United States since 2015). It is interesting that there is no timeline for this third train, though the builds
generally take about four years each, meaning that this doesn’t change our 2021 spare capacity analysis.
On this day our ‘LNG tightness’ was at 4.71$/Mbtu, showing that if this present situation persisted for the
long term13, the project would be profitable for both Cheniere and its clients. On the other hand, recent news
that Schlumberger14 ended its participation in the Fortuna FLNG will not make financing of this project any
easier. This proves once again that, before 2022, we can't expect new LNG supply on top of the already
FIDed projects. But with an LNG tightness that hasn’t displaced any low summer indication yet, we are now
even more confident that other FIDs are going to be taken sooner rather than later.
In addition, if Qatar’s self-imposed moratorium (2005-2017) on the North Field was linked to the impossibility
of Iran monetising its part of the same field, the renewed Iranian sanctions may deter Qatar from taking FID
on any LNG expansion, leaving the LNG market even tighter post-2021e unless more additional FIDs are
taken very soon. Qatar has never produced more gas than Iran 15 ; the removing of the self-imposed
moratorium in 2017 was perhaps done on the basis that Iran would, without sanctions, be able to grow its
gas production. If this is the hidden agenda, then it is highly possible that Qatar will, from now, put its
expansion project on the back burner to avoid increased geopolitical tensions with its neighbour because it
would then produce more gas from their shared field16.
Finally, with the BP Statistical Review June 2018 report out, it is also interesting to note that thanks to the
resumption of higher growth in LNG (+10.3% YoY) than in pipeline gas, LNG represented in 2017 35% of
globally traded gas and is now accounting for 11% of the total gas market for the first time ever. As we
showed in our last quarterly review, with LNG on a capacity basis making up 39% of the total for major FID
projects that are planned to provide extra capacity between now and 2021e, LNG should continue to increase
its current market share in gas supply, as its optionality is preferred by the industry compared to the more
inflexible pipe business.
EU unknowns
What are the main issues the next EU Commission will have to deal with when it comes into power in a
year’s 17 time shortly after Brexit?
What kind of competitive gas market to expect going forward?
On 9 May, the Polish Office of Competition and Consumer Protection (UOKiK) reiterated its position against
Nord Stream 218. In August 2016, the 5 European companies withdrew their merger control notification in
light of UOKiK objections. The Polish position is that the new structure (the companies are not in a JV
10 T. Bros, March 2018 available at https://www.oxfordenergy.org/publications/quarterly-gas-review-analysis-prices-recent-events/ 11 http://phx.corporate-ir.net/phoenix.zhtml?c=101667&p=irol-newsArticle&ID=2350302 12 The first contracts for this train 3 were signed back in 2014 with EDP (0.77 mtpa) and then Trafigura (1 mtpa) and CNPC (1.2 mtpa)
in 2018. 66 % of the capacity has been contracted indexed to the Henry Hub price plus a fixed component. 13 Contrary to most companies’ publications, we believe that long term scenarios are mostly based on short-term data, hence why we
plot on our daily LNG tightness graph FID decisions that will not bring new LNG for several years. 14 Information provided during Golar Q1 2018 results on 31 May available at http://www.golarlng.com/investors/press-releases/pr-
story.aspx?ResultPageURL=http://cws.huginonline.com/G/133076/PR/201805/2196480.xml 15 According to the BP Statistical Review, Qatar produced slightly more than Iran only in 1980 and 2013. 16 In 2017, according to the BP Statistical Review, Iran production grew by 10.5% (vs 2016) and produced 48 bcm more than Qatar. 17 The next Elections to the European Parliament are expected to be held in 23–26 May 2019. 18 https://www.uokik.gov.pl/news.php?news_id=14323
6 The contents of this paper are the author’s sole responsibility. They do not necessarily represent the views of
the Oxford Institute for Energy Studies or any of its Members.
anymore) doesn’t change the fact that the Nord Stream 2 project is still problematic regarding competition
rules. So, the questions unanswered in July 2016 are still to be answered by Gazprom and its 5 partners.
We discussed the EU gas competition issues back in January 201819, when we said: “EU Member States
simply need to ensure that the diversification metric is enforced! Without enforcing this regulation, Member
States allow companies to choose the cheapest supplier so as to maximize short-term profits, exposing the
system to unexpected shocks, with negative economic impact if EU gas prices spike for more than just a few
hours! If this entails too much work for energy regulators20, perhaps competition authorities should take a
more active role: either the diversification of supply rule is relevant and must be enforced, or the rule is
irrelevant and must be cancelled.” UOKiK is now doing exactly this. The jury is still out but, as underlined in
our previous work, having an un-enforced Gas Target Model is going to generate unknowns and increase
risks for the operators.
What kind of transport regulation?
On another level, the enlarged EU-wide gas market will need further fixing after the Gazprom-Naftogaz
arbitration in February 2018 and the settlement of the EU-Gazprom antitrust case in May. With the Stockholm
tribunal ruling that Gazprom’s sales in Ukraine should be priced at the level quoted on the German gas
exchange NetConnect Germany (NCG),21 and the EU DG Competition requesting22 swaps of deliveries of
Gazprom gas in Eastern Europe, the transportation fee question will come back onto the political agenda.
The pancaking of entry/exit fees inside the EU and in Ukraine makes those 2 rulings difficult to enforce23.
The obvious solution: one enlarged EU single zone with a single wholesale price, an entry fee and 2 exit
fees to differentiate customers needing Security of Supply and others. But how long will it take for the EU
(that foresaw this by launching the Quo Vadis study in November 2016) to implement it?
EU ETS: a rising trend or a spike?
Carbon prices have nearly quadrupled since May 2017, rising from 4.40€/mt to over 16€/mt in May 2018, as
market participants anticipate cuts through the Market Stability Reserve to the supply of allowances to be
auctioned in 2019, linked to recently passed legislation that overhauls the market’s rules. In addition, the
Commission is now working on a long-term strategy to align EU emissions targets with the Paris deal, at the
request of the European Council in March. But the Brexit uncertainty about the UK remaining or not in the
EU ETS post-2020 poses a threat to the necessity to make this price increase sustainable. Increased
renewable production and higher EU ETS prices should result in coal-fired power plants closing down. But if
the UK leaves the EU ETS on 31 December 2020 without the EU having implemented a strategy to cut
further permit allowances, the EU ETS will nose dive again. If the EU wants to be stronger and united, it is
perhaps the perfect time to sit down and think of a more robust system able to deliver what citizens want: a
greener world.
19 T. Bros, Reflection on the Baumgarten Gas Explosion: Markets are Working available at https://www.oxfordenergy.org/wpcms/wp-
content/uploads/2018/01/Reflection-on-the-Baumgarten-Gas-Explosion-Comment.pdf 20 So far, except for measuring the non-compliance with the ACER Gas Target Model, nothing has been done in any country not
meeting the recommendation. 21 S. Pirani, After the Gazprom-Naftogaz arbitration: commerce still entangled in politics, March 2018 at
https://www.oxfordenergy.org/wpcms/wp-content/uploads/2018/03/After-the-Gazprom-Naftogaz-arbitration-commerce-still-entangled-
with-politics-Insight-31.pdf 22 http://europa.eu/rapid/press-release_IP-18-3921_en.htm 23 The spread between markets should reflect the cost of transportation. If the spread is set at 0 as in the Naftogaz-Gazprom
arbitration, then the cost between those 2 markets should be 0…
7 The contents of this paper are the author’s sole responsibility. They do not necessarily represent the views of
the Oxford Institute for Energy Studies or any of its Members.
Can the EU be even more energy efficient?
The EU has been at the forefront of fighting climate change with its 20-20-20 agenda for 2020. As 2017 data
are now out, we can check the exact achievements and see how this can be further improved for the 2030
Energy Strategy.24 The proposed first targets were:
1. a 40% cut in greenhouse gas emissions compared to 1990 levels
2. a renewable energy share of at least 27% of consumption and
3. at least 27% energy savings compared with the business-as-usual scenario.
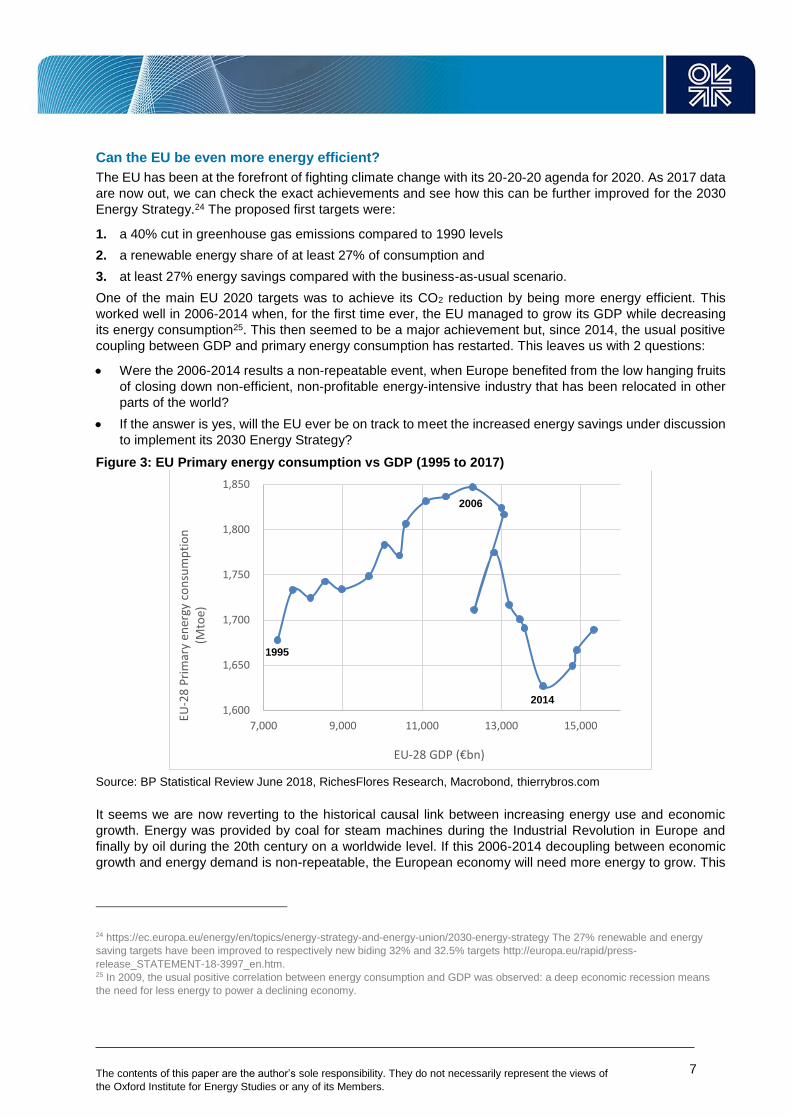
One of the main EU 2020 targets was to achieve its CO2 reduction by being more energy efficient. This
worked well in 2006-2014 when, for the first time ever, the EU managed to grow its GDP while decreasing
its energy consumption25. This then seemed to be a major achievement but, since 2014, the usual positive
coupling between GDP and primary energy consumption has restarted. This leaves us with 2 questions:
Were the 2006-2014 results a non-repeatable event, when Europe benefited from the low hanging fruits
of closing down non-efficient, non-profitable energy-intensive industry that has been relocated in other
parts of the world?
If the answer is yes, will the EU ever be on track to meet the increased energy savings under discussion
to implement its 2030 Energy Strategy?
Figure 3: EU Primary energy consumption vs GDP (1995 to 2017)
Source: BP Statistical Review June 2018, RichesFlores Research, Macrobond, thierrybros.com
It seems we are now reverting to the historical causal link between increasing energy use and economic
growth. Energy was provided by coal for steam machines during the Industrial Revolution in Europe and
finally by oil during the 20th century on a worldwide level. If this 2006-2014 decoupling between economic
growth and energy demand is non-repeatable, the European economy will need more energy to grow. This
24 https://ec.europa.eu/energy/en/topics/energy-strategy-and-energy-union/2030-energy-strategy The 27% renewable and energy
saving targets have been improved to respectively new biding 32% and 32.5% targets http://europa.eu/rapid/press-
release_STATEMENT-18-3997_en.htm. 25 In 2009, the usual positive correlation between energy consumption and GDP was observed: a deep economic recession means
the need for less energy to power a declining economy.
1,600
1,650
1,700
1,750
1,800
1,850
7,000 9,000 11,000 13,000 15,000
EU-2
8 P
rim
ary
ener
gy c
on
sum
pti
on
(M
toe)
EU-28 GDP (€bn)
2006
2014
1995
8 The contents of this paper are the author’s sole responsibility. They do not necessarily represent the views of
the Oxford Institute for Energy Studies or any of its Members.
means that the next EU Commission cannot bet on reduced energy needs but will have to look at other
alternatives to achieve a net-zero carbon emission without compromising on growth and jobs.
The irony of this is that as mainstream research and policymakers are now using the 2006-2014 efficiency
boost as a theory, making it a conventional long-term assumption, this assumption is now already wrong and
may not survive until the end of this decade! We could witness exactly the same mistake as was made by
the IEA when it said that we were about to enter a golden age of gas in 2011, just when gas demand growth
was negative in Europe. The IEA then turned away from gas in the WEO 2017 with the lowest long-term
demand growth (1.6% CAGR in 2016-2040 in the central New Policies Scenario) just when world gas
demand witnessed a robust rebound (+3% in 2017 vs 2016 following a 1.5% in 2016 vs 2015)26.
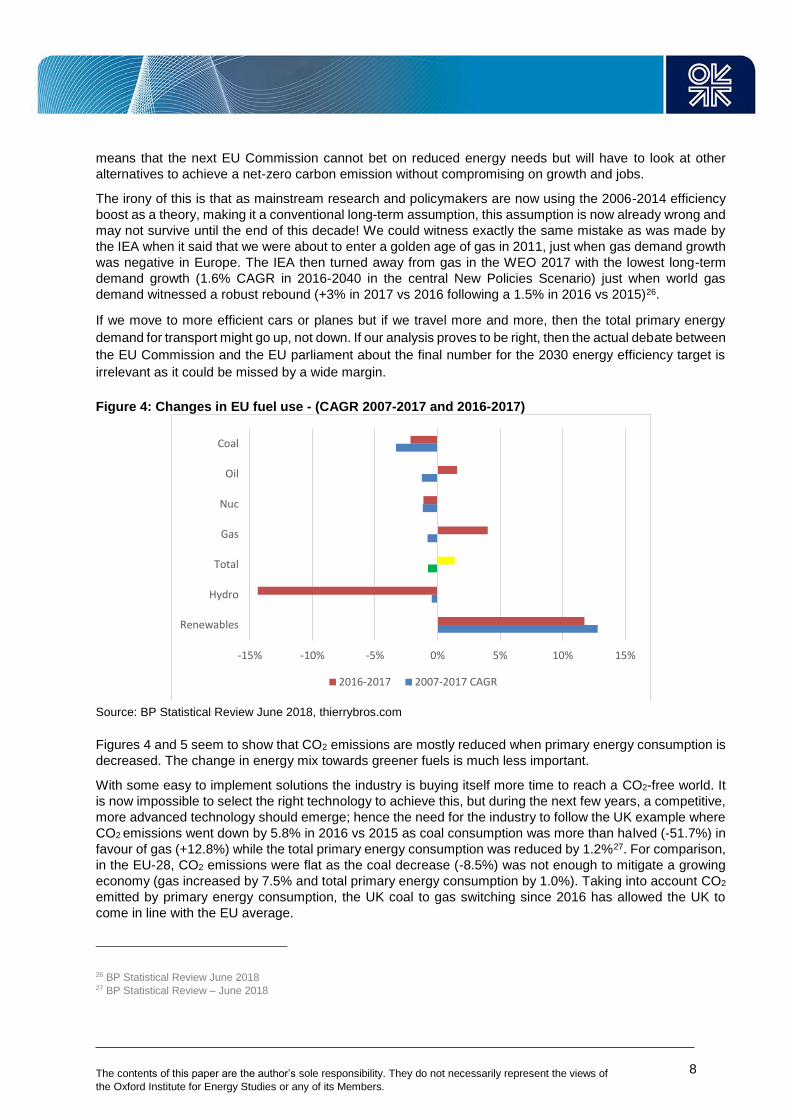
If we move to more efficient cars or planes but if we travel more and more, then the total primary energy
demand for transport might go up, not down. If our analysis proves to be right, then the actual debate between
the EU Commission and the EU parliament about the final number for the 2030 energy efficiency target is
irrelevant as it could be missed by a wide margin.
Figure 4: Changes in EU fuel use - (CAGR 2007-2017 and 2016-2017)
Source: BP Statistical Review June 2018, thierrybros.com
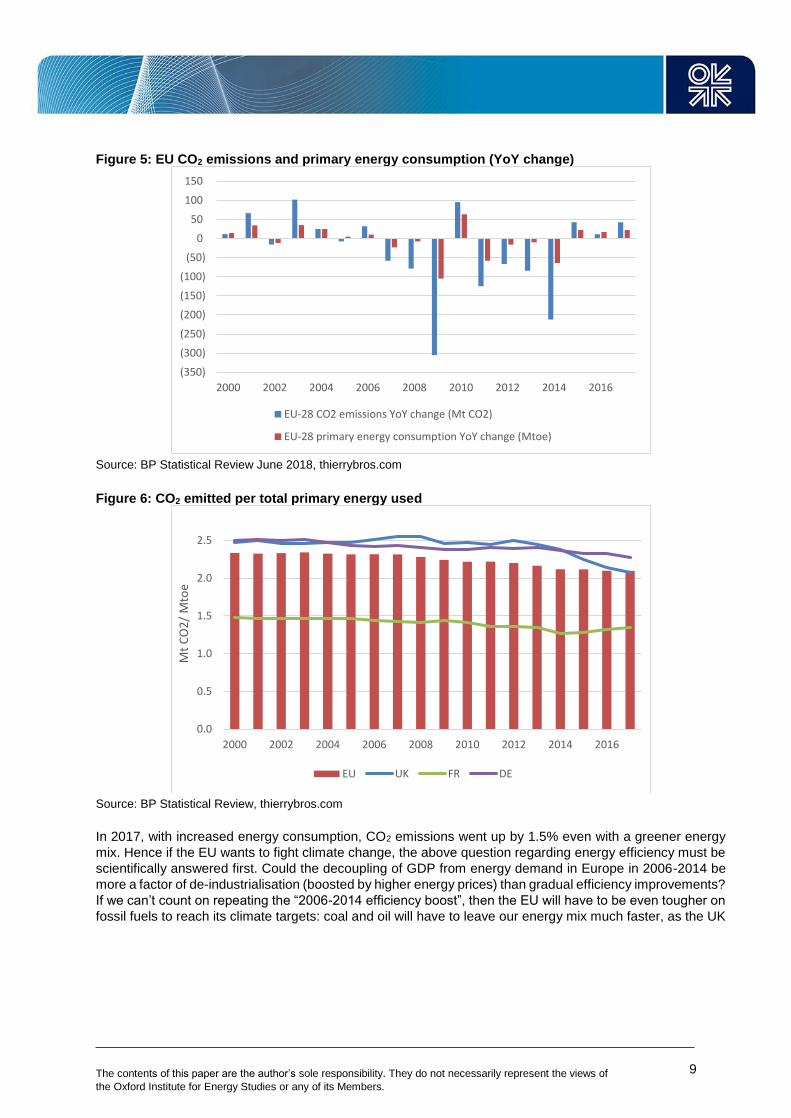
Figures 4 and 5 seem to show that CO2 emissions are mostly reduced when primary energy consumption is
decreased. The change in energy mix towards greener fuels is much less important.
With some easy to implement solutions the industry is buying itself more time to reach a CO2-free world. It
is now impossible to select the right technology to achieve this, but during the next few years, a competitive,
more advanced technology should emerge; hence the need for the industry to follow the UK example where
CO2 emissions went down by 5.8% in 2016 vs 2015 as coal consumption was more than halved (-51.7%) in
favour of gas (+12.8%) while the total primary energy consumption was reduced by 1.2%27. For comparison,
in the EU-28, CO2 emissions were flat as the coal decrease (-8.5%) was not enough to mitigate a growing
economy (gas increased by 7.5% and total primary energy consumption by 1.0%). Taking into account CO2
emitted by primary energy consumption, the UK coal to gas switching since 2016 has allowed the UK to
come in line with the EU average.
26 BP Statistical Review June 2018 27 BP Statistical Review – June 2018
-15% -10% -5% 0% 5% 10% 15%
Renewables
Hydro
Total
Gas
Nuc
Oil
Coal
2016-2017 2007-2017 CAGR
9 The contents of this paper are the author’s sole responsibility. They do not necessarily represent the views of
the Oxford Institute for Energy Studies or any of its Members.
Figure 5: EU CO2 emissions and primary energy consumption (YoY change)
Source: BP Statistical Review June 2018, thierrybros.com
Figure 6: CO2 emitted per total primary energy used
Source: BP Statistical Review, thierrybros.com
In 2017, with increased energy consumption, CO2 emissions went up by 1.5% even with a greener energy
mix. Hence if the EU wants to fight climate change, the above question regarding energy efficiency must be
scientifically answered first. Could the decoupling of GDP from energy demand in Europe in 2006-2014 be
more a factor of de-industrialisation (boosted by higher energy prices) than gradual efficiency improvements?
If we can’t count on repeating the “2006-2014 efficiency boost”, then the EU will have to be even tougher on
fossil fuels to reach its climate targets: coal and oil will have to leave our energy mix much faster, as the UK
(350)
(300)
(250)
(200)
(150)
(100)
(50)
0
50
100
150
2000 2002 2004 2006 2008 2010 2012 2014 2016
EU-28 CO2 emissions YoY change (Mt CO2)
EU-28 primary energy consumption YoY change (Mtoe)
0.0
0.5
1.0
1.5
2.0
2.5
2000 2002 2004 2006 2008 2010 2012 2014 2016
Mt
CO
2/
Mto
e
EU UK FR DE

10 The contents of this paper are the author’s sole responsibility. They do not necessarily represent the views of
the Oxford Institute for Energy Studies or any of its Members.
2016 example demonstrates. Unless Germany decides to miss its own 2020 CO2 target widely - by 100 Mt -
and blames28 it on ‘faster-growing population than forecast’ ie because of migration!
This also could further negatively impact the business models of European utilities that have diversified away
from generating energy (away from nuclear in Germany and coal in the UK) into energy efficiency. If
efficiency is no longer easily achievable, their new business models are going to suffer again in the future.
We could even see energy management becoming more important than energy efficiency in a world where
energy demand is growing.
28 https://www.afp.com/en/news/2265/germany-admits-will-fall-far-short-2020-climate-target-doc-15w2r41
11 The contents of this paper are the author’s sole responsibility. They do not necessarily represent the views of
the Oxford Institute for Energy Studies or any of its Members.
2017 review of IOC production, reserves & strategy
As International Oil Companies (IOC) have now all published their FY2017 results, let's compare their levels
of oil and gas production29 to see which one is best positioned if our world has to move away from oil (and
coal) to gas, the cleanest fossil fuel (and renewable).
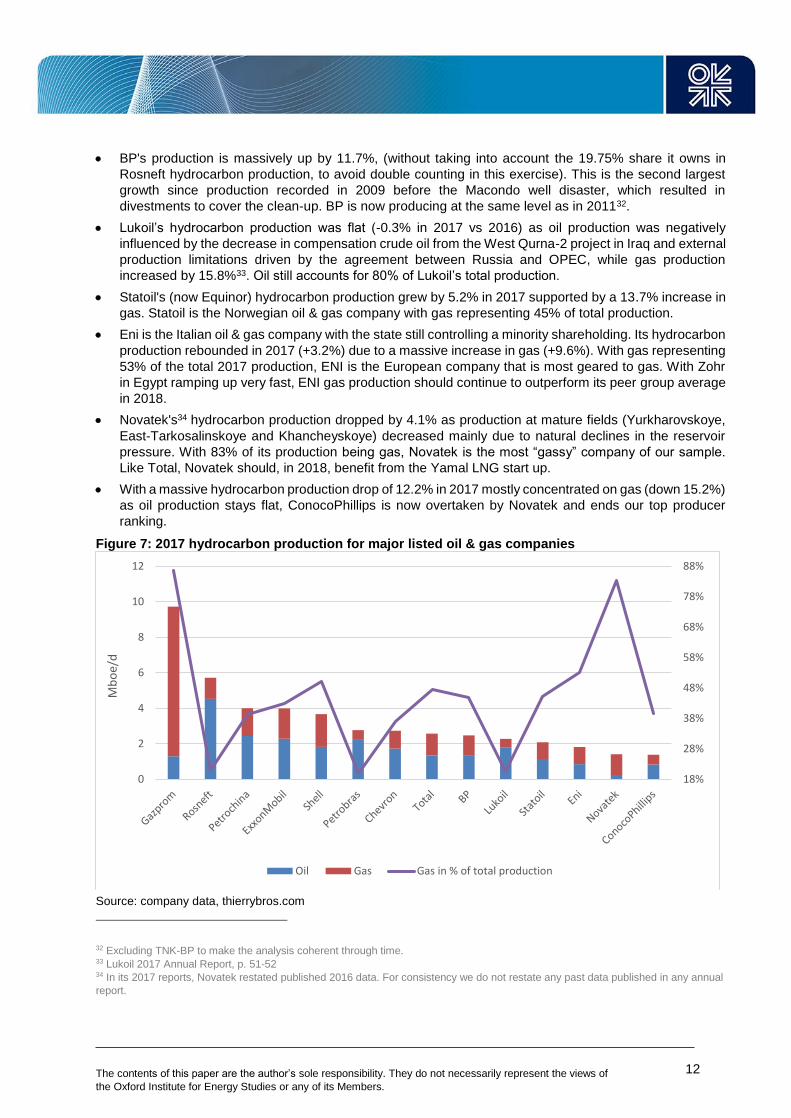
Gazprom’s hydrocarbon production increased by 10.9% thanks to a 12.4% growth in gas. Gazprom is
the biggest listed hydrocarbon producer but more importantly, with gas representing 87% of its total
production, it is the biggest worldwide gas producer.
Rosneft’s hydrocarbon production grew by 6.5% in 2017 vs 2016 thanks to its acquisition of the Russian
Government stake (50.08%) in Bashneft in October 2016. The liquid hydrocarbon production of the
combined company grew by 7.3%. Gas production increased by 2% in 2017 vs 2016 thanks to continued
organic growth. In Russia, Rosneft is a former oil company that is now looking to label itself also as an
Independent Gas Producer as it wants to adapt to a greener world. (Between 2012 and 2017, gas
production jumped by 33% CAGR). In 2017, due to the acquisition of Bashneft (mostly an oil company),
Rosneft gas production represented 21% of total production.
PetroChina hydrocarbon production decreased by 0.6% as compared with last year (-3.7% for oil and
+4.5% for gas). With domestic production increasing by 4.8% for gas and decreasing by 2.7% for oil,
PetroChina is fully implementing Beijing’s strategy to move away from dirty oil into cleaner gas.
PetroChina’s gas production now represents 39% of its total hydrocarbon production. In 2017 PetroChina
has overtaken ExxonMobil as the third biggest listed hydrocarbon producer.
ExxonMobil’s hydrocarbon production was down again in 2017 (-1.7% in 2017 vs 2016 after -1.1% in
2016 vs 2015) mostly due to liquids (-3.5%). Despite further regulatory restrictions in the Netherlands30
gas production was slightly up (+0.8%) thanks mainly to PNGLNG, which reached the production
equivalent of 8.3mtpa, a 20% increase over the facility’s original design. But further decrease in Q1 18
due to lower entitlements with higher prices should put pressure on ExxonMobil to avoid slipping further
down the ranking below Shell before the end of the decade.
Shell’s hydrocarbon production was stable in 2017 (-0.2%). Shell production is evenly split between oil
and gas and, following the acquisition of BG, Shell should continue to target more gas than oil plays.
Shell is now the second largest gas producing company, up from number 4 in 2015.
Petrobras’ hydrocarbon production was flat again in 2017 (-0.8%). With gas representing only 20%,
Petrobras, the Brazilian national state oil company 31 is a relatively small gas company.
Chevron's hydrocarbon production increased in 2017 by 5.2% due to new gas field start ups (+14.9%).
Chevron is the most "oily" big American oil & gas company with gas representing only 37%. With first
gas from Gorgon train 3 and Wheatstone train 1 LNG in Australia in 2017, Chevron gas should continue
to grow in the mix in 2018 even if the company is mainly targeting oil at the expense of gas in the US.
Total’s hydrocarbon production was up by 4.6% vs 2016 with oil up more than gas (+5.9% and +3.3%
respectively). With Yamal LNG now operating since the end of 2017 and hopefully Ichthys LNG in
production later this year, Total could move its gas share from 48% in 2017 to above 50% in 2019e and
expects its hydrocarbon production to increase more than 6% in 2018e thanks also to the purchase of
Maersk Oil.
29 Not all companies provide the exact same units for their reporting; the data here are as “raw” as possible vs those provided directly
by the companies. The fact that 2016 was a leap year can also change some numbers if produced in yearly or daily format. 30 ExxonMobil owns 50% of the biggest onshore European gas field, Groningen, where the Dutch state has decided to reduce the
production cap following tremours). 31 The state has managed to achieve a majority voting right while only retaining 28.7% of the capital thanks to common shares, with
voting rights, and preferred shares without voting rights.
12 The contents of this paper are the author’s sole responsibility. They do not necessarily represent the views of
the Oxford Institute for Energy Studies or any of its Members.
BP's production is massively up by 11.7%, (without taking into account the 19.75% share it owns in
Rosneft hydrocarbon production, to avoid double counting in this exercise). This is the second largest
growth since production recorded in 2009 before the Macondo well disaster, which resulted in
divestments to cover the clean-up. BP is now producing at the same level as in 201132.
Lukoil’s hydrocarbon production was flat (-0.3% in 2017 vs 2016) as oil production was negatively
influenced by the decrease in compensation crude oil from the West Qurna-2 project in Iraq and external
production limitations driven by the agreement between Russia and OPEC, while gas production
increased by 15.8%33. Oil still accounts for 80% of Lukoil’s total production.
Statoil's (now Equinor) hydrocarbon production grew by 5.2% in 2017 supported by a 13.7% increase in
gas. Statoil is the Norwegian oil & gas company with gas representing 45% of total production.
Eni is the Italian oil & gas company with the state still controlling a minority shareholding. Its hydrocarbon
production rebounded in 2017 (+3.2%) due to a massive increase in gas (+9.6%). With gas representing
53% of the total 2017 production, ENI is the European company that is most geared to gas. With Zohr
in Egypt ramping up very fast, ENI gas production should continue to outperform its peer group average
in 2018.
Novatek's34 hydrocarbon production dropped by 4.1% as production at mature fields (Yurkharovskoye,
East-Tarkosalinskoye and Khancheyskoye) decreased mainly due to natural declines in the reservoir
pressure. With 83% of its production being gas, Novatek is the most “gassy” company of our sample.
Like Total, Novatek should, in 2018, benefit from the Yamal LNG start up.
With a massive hydrocarbon production drop of 12.2% in 2017 mostly concentrated on gas (down 15.2%)
as oil production stays flat, ConocoPhillips is now overtaken by Novatek and ends our top producer
ranking.
Figure 7: 2017 hydrocarbon production for major listed oil & gas companies
Source: company data, thierrybros.com
32 Excluding TNK-BP to make the analysis coherent through time. 33 Lukoil 2017 Annual Report, p. 51-52 34 In its 2017 reports, Novatek restated published 2016 data. For consistency we do not restate any past data published in any annual
report.
18%
28%
38%
48%
58%
68%
78%
88%
0
2
4
6
8
10
12
Mb
oe/
d
Oil Gas Gas in % of total production
13 The contents of this paper are the author’s sole responsibility. They do not necessarily represent the views of
the Oxford Institute for Energy Studies or any of its Members.
It is interesting to note that the top 3 listed companies in terms of hydrocarbon production are all state owned
(two Russian and one Chinese) with ExxonMobil only coming in fourth position.
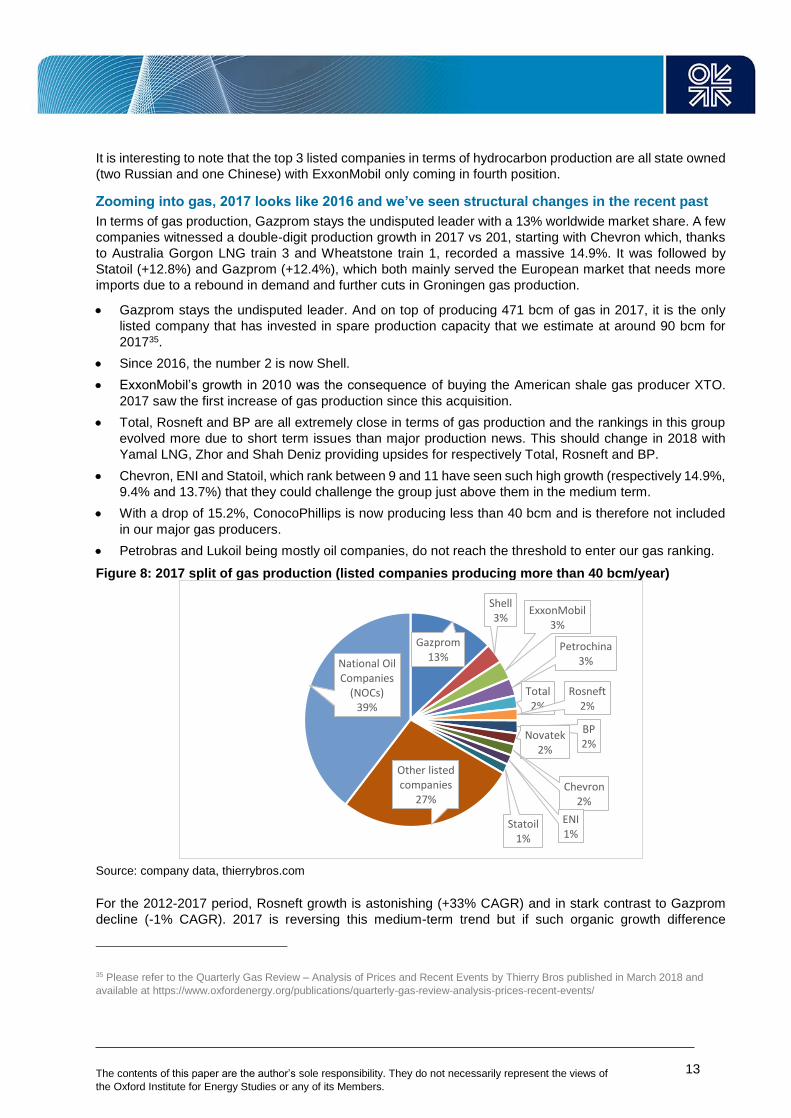
Zooming into gas, 2017 looks like 2016 and we’ve seen structural changes in the recent past
In terms of gas production, Gazprom stays the undisputed leader with a 13% worldwide market share. A few
companies witnessed a double-digit production growth in 2017 vs 201, starting with Chevron which, thanks
to Australia Gorgon LNG train 3 and Wheatstone train 1, recorded a massive 14.9%. It was followed by
Statoil (+12.8%) and Gazprom (+12.4%), which both mainly served the European market that needs more
imports due to a rebound in demand and further cuts in Groningen gas production.
Gazprom stays the undisputed leader. And on top of producing 471 bcm of gas in 2017, it is the only
listed company that has invested in spare production capacity that we estimate at around 90 bcm for
201735.
Since 2016, the number 2 is now Shell.
ExxonMobil’s growth in 2010 was the consequence of buying the American shale gas producer XTO.
2017 saw the first increase of gas production since this acquisition.
Total, Rosneft and BP are all extremely close in terms of gas production and the rankings in this group
evolved more due to short term issues than major production news. This should change in 2018 with
Yamal LNG, Zhor and Shah Deniz providing upsides for respectively Total, Rosneft and BP.
Chevron, ENI and Statoil, which rank between 9 and 11 have seen such high growth (respectively 14.9%,
9.4% and 13.7%) that they could challenge the group just above them in the medium term.
With a drop of 15.2%, ConocoPhillips is now producing less than 40 bcm and is therefore not included
in our major gas producers.
Petrobras and Lukoil being mostly oil companies, do not reach the threshold to enter our gas ranking.
Figure 8: 2017 split of gas production (listed companies producing more than 40 bcm/year)
Source: company data, thierrybros.com
For the 2012-2017 period, Rosneft growth is astonishing (+33% CAGR) and in stark contrast to Gazprom
decline (-1% CAGR). 2017 is reversing this medium-term trend but if such organic growth difference
35 Please refer to the Quarterly Gas Review – Analysis of Prices and Recent Events by Thierry Bros published in March 2018 and
available at https://www.oxfordenergy.org/publications/quarterly-gas-review-analysis-prices-recent-events/
Gazprom13%
Shell3%
ExxonMobil3%
Petrochina3%
Total2%
Rosneft2%
BP2%
Novatek2%
Chevron2%
ENI1%
Statoil1%
Other listed companies
27%
National Oil Companies
(NOCs)39%
14 The contents of this paper are the author’s sole responsibility. They do not necessarily represent the views of
the Oxford Institute for Energy Studies or any of its Members.
continues in the future, Rosneft could become a threat to Gazprom. And it seems the Russian state is so far
happy to have 2 national companies, each formerly dealing with a specific hydrocarbon (oil for Rosneft and
gas for Gazprom), now competing both in oil & gas. This is unique in history as states normally believe
monopolies are better positioned to reap an economic rent. But as monopolies are less efficient this
competition is perhaps a state idea to force efficiency improvements in both companies!
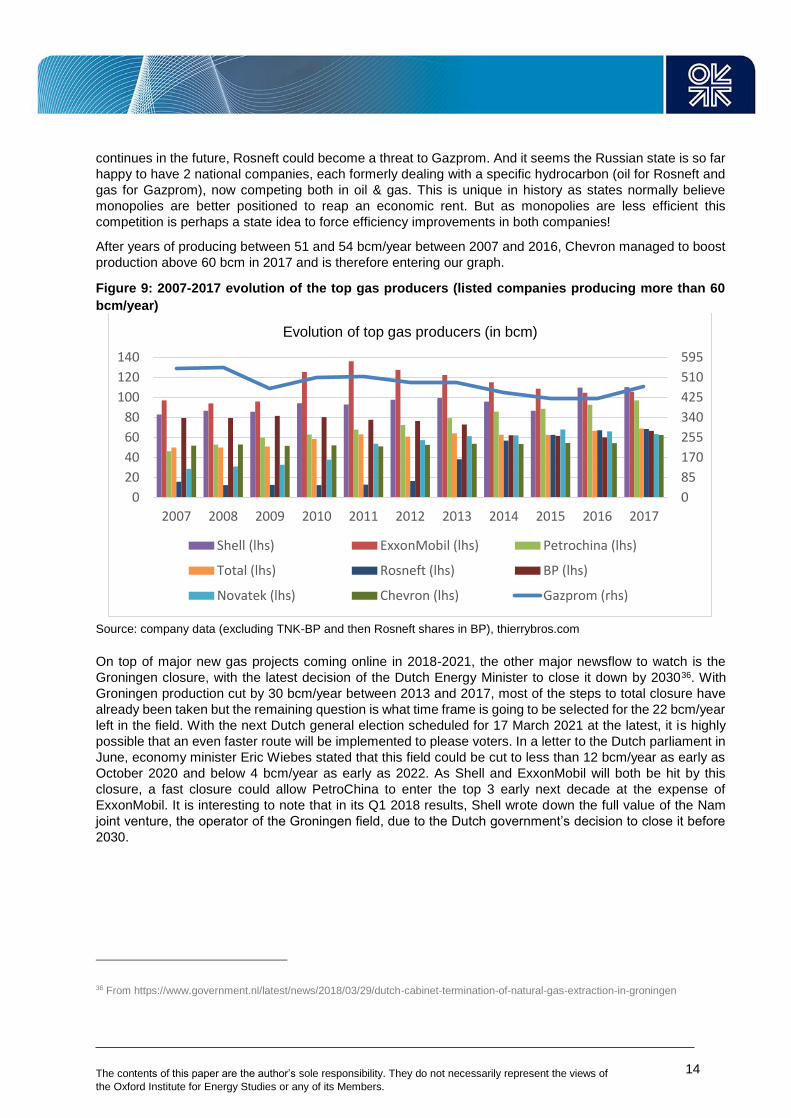
After years of producing between 51 and 54 bcm/year between 2007 and 2016, Chevron managed to boost
production above 60 bcm in 2017 and is therefore entering our graph.
Figure 9: 2007-2017 evolution of the top gas producers (listed companies producing more than 60
bcm/year)
Source: company data (excluding TNK-BP and then Rosneft shares in BP), thierrybros.com
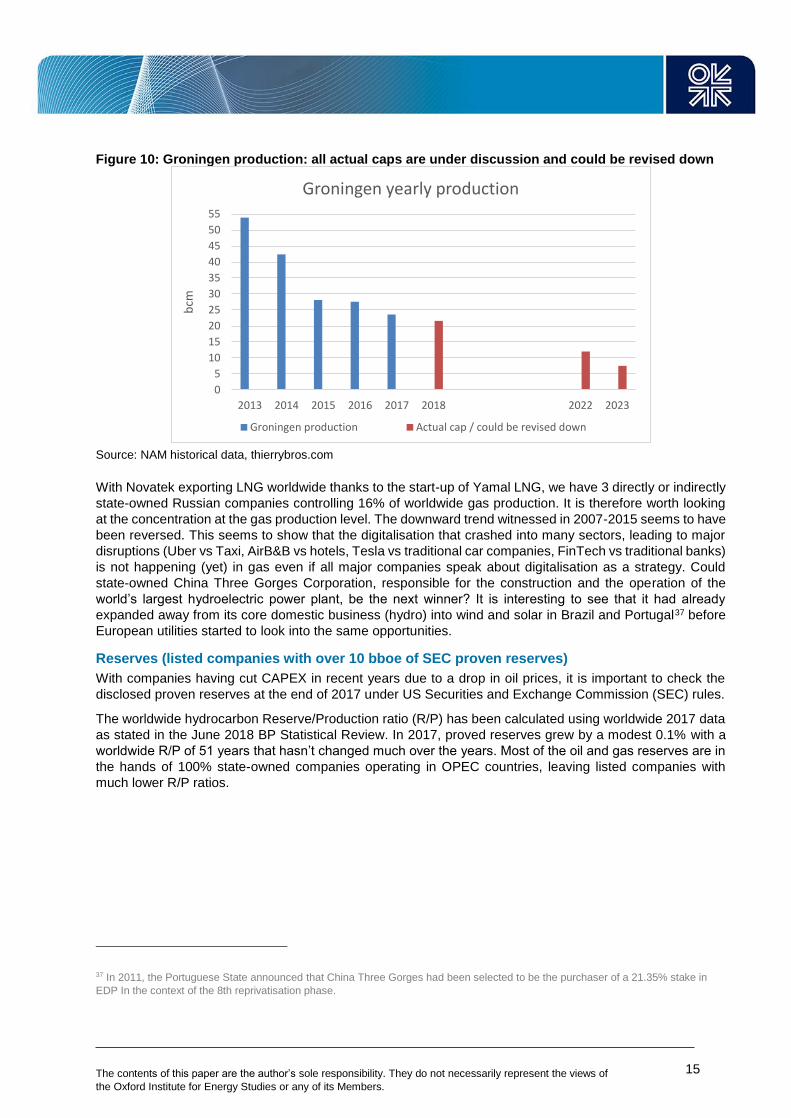
On top of major new gas projects coming online in 2018-2021, the other major newsflow to watch is the
Groningen closure, with the latest decision of the Dutch Energy Minister to close it down by 203036. With
Groningen production cut by 30 bcm/year between 2013 and 2017, most of the steps to total closure have
already been taken but the remaining question is what time frame is going to be selected for the 22 bcm/year
left in the field. With the next Dutch general election scheduled for 17 March 2021 at the latest, it is highly
possible that an even faster route will be implemented to please voters. In a letter to the Dutch parliament in
June, economy minister Eric Wiebes stated that this field could be cut to less than 12 bcm/year as early as
October 2020 and below 4 bcm/year as early as 2022. As Shell and ExxonMobil will both be hit by this
closure, a fast closure could allow PetroChina to enter the top 3 early next decade at the expense of
ExxonMobil. It is interesting to note that in its Q1 2018 results, Shell wrote down the full value of the Nam
joint venture, the operator of the Groningen field, due to the Dutch government’s decision to close it before
2030.
36 From https://www.government.nl/latest/news/2018/03/29/dutch-cabinet-termination-of-natural-gas-extraction-in-groningen
0
85
170
255
340
425
510
595
0
20
40
60
80
100
120
140
2007 2008 2009 2010 2011 2012 2013 2014 2015 2016 2017
Evolution of top gas producers (in bcm)
Shell (lhs) ExxonMobil (lhs) Petrochina (lhs)
Total (lhs) Rosneft (lhs) BP (lhs)
Novatek (lhs) Chevron (lhs) Gazprom (rhs)
15 The contents of this paper are the author’s sole responsibility. They do not necessarily represent the views of
the Oxford Institute for Energy Studies or any of its Members.
Figure 10: Groningen production: all actual caps are under discussion and could be revised down
Source: NAM historical data, thierrybros.com
With Novatek exporting LNG worldwide thanks to the start-up of Yamal LNG, we have 3 directly or indirectly
state-owned Russian companies controlling 16% of worldwide gas production. It is therefore worth looking
at the concentration at the gas production level. The downward trend witnessed in 2007-2015 seems to have
been reversed. This seems to show that the digitalisation that crashed into many sectors, leading to major
disruptions (Uber vs Taxi, AirB&B vs hotels, Tesla vs traditional car companies, FinTech vs traditional banks)
is not happening (yet) in gas even if all major companies speak about digitalisation as a strategy. Could
state-owned China Three Gorges Corporation, responsible for the construction and the operation of the
world’s largest hydroelectric power plant, be the next winner? It is interesting to see that it had already
expanded away from its core domestic business (hydro) into wind and solar in Brazil and Portugal37 before
European utilities started to look into the same opportunities.
Reserves (listed companies with over 10 bboe of SEC proven reserves)
With companies having cut CAPEX in recent years due to a drop in oil prices, it is important to check the
disclosed proven reserves at the end of 2017 under US Securities and Exchange Commission (SEC) rules.
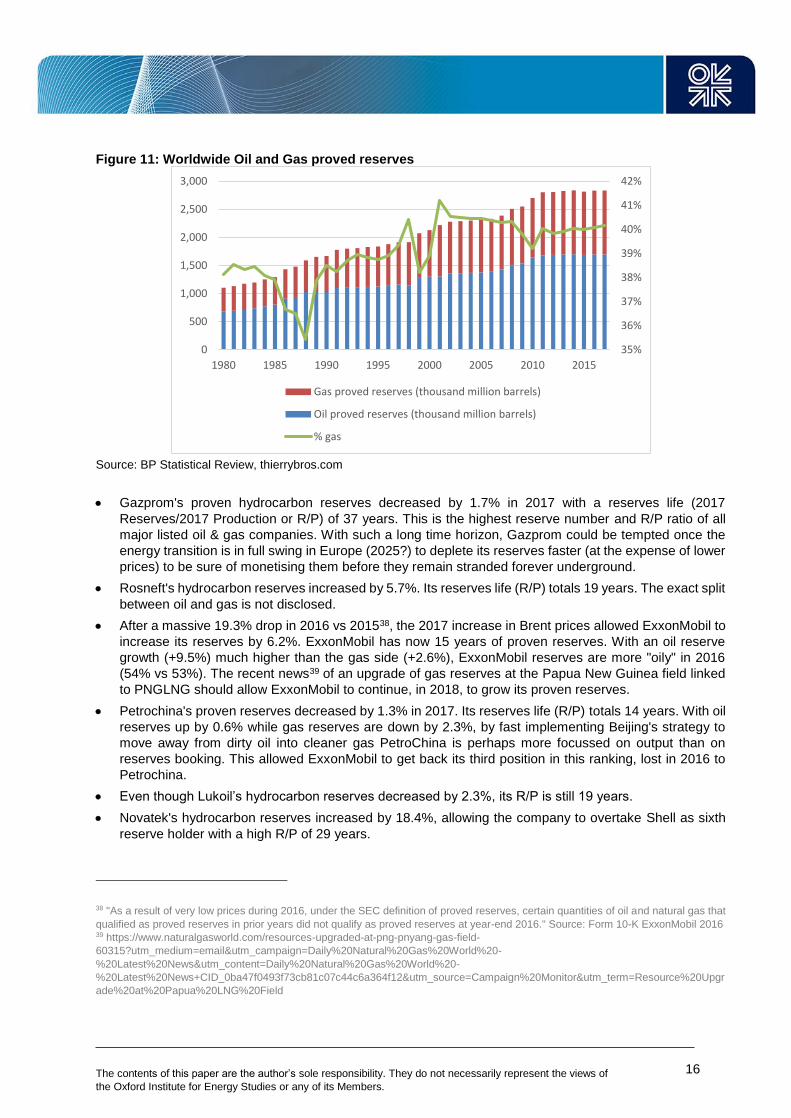
The worldwide hydrocarbon Reserve/Production ratio (R/P) has been calculated using worldwide 2017 data
as stated in the June 2018 BP Statistical Review. In 2017, proved reserves grew by a modest 0.1% with a
worldwide R/P of 51 years that hasn’t changed much over the years. Most of the oil and gas reserves are in
the hands of 100% state-owned companies operating in OPEC countries, leaving listed companies with
much lower R/P ratios.
37 In 2011, the Portuguese State announced that China Three Gorges had been selected to be the purchaser of a 21.35% stake in
EDP In the context of the 8th reprivatisation phase.
0
5
10
15
20
25
30
35
40
45
50
55
2013 2014 2015 2016 2017 2018 2022 2023
bcm
Groningen yearly production
Groningen production Actual cap / could be revised down
16 The contents of this paper are the author’s sole responsibility. They do not necessarily represent the views of
the Oxford Institute for Energy Studies or any of its Members.
Figure 11: Worldwide Oil and Gas proved reserves
Source: BP Statistical Review, thierrybros.com
Gazprom's proven hydrocarbon reserves decreased by 1.7% in 2017 with a reserves life (2017
Reserves/2017 Production or R/P) of 37 years. This is the highest reserve number and R/P ratio of all
major listed oil & gas companies. With such a long time horizon, Gazprom could be tempted once the
energy transition is in full swing in Europe (2025?) to deplete its reserves faster (at the expense of lower
prices) to be sure of monetising them before they remain stranded forever underground.
Rosneft's hydrocarbon reserves increased by 5.7%. Its reserves life (R/P) totals 19 years. The exact split
between oil and gas is not disclosed.
After a massive 19.3% drop in 2016 vs 201538, the 2017 increase in Brent prices allowed ExxonMobil to
increase its reserves by 6.2%. ExxonMobil has now 15 years of proven reserves. With an oil reserve
growth (+9.5%) much higher than the gas side (+2.6%), ExxonMobil reserves are more "oily" in 2016
(54% vs 53%). The recent news39 of an upgrade of gas reserves at the Papua New Guinea field linked
to PNGLNG should allow ExxonMobil to continue, in 2018, to grow its proven reserves.
Petrochina's proven reserves decreased by 1.3% in 2017. Its reserves life (R/P) totals 14 years. With oil
reserves up by 0.6% while gas reserves are down by 2.3%, by fast implementing Beijing's strategy to
move away from dirty oil into cleaner gas PetroChina is perhaps more focussed on output than on
reserves booking. This allowed ExxonMobil to get back its third position in this ranking, lost in 2016 to
Petrochina.
Even though Lukoil’s hydrocarbon reserves decreased by 2.3%, its R/P is still 19 years.
Novatek's hydrocarbon reserves increased by 18.4%, allowing the company to overtake Shell as sixth
reserve holder with a high R/P of 29 years.
38 "As a result of very low prices during 2016, under the SEC definition of proved reserves, certain quantities of oil and natural gas that
qualified as proved reserves in prior years did not qualify as proved reserves at year-end 2016." Source: Form 10-K ExxonMobil 2016 39 https://www.naturalgasworld.com/resources-upgraded-at-png-pnyang-gas-field-
60315?utm_medium=email&utm_campaign=Daily%20Natural%20Gas%20World%20-
%20Latest%20News&utm_content=Daily%20Natural%20Gas%20World%20-
%20Latest%20News+CID_0ba47f0493f73cb81c07c44c6a364f12&utm_source=Campaign%20Monitor&utm_term=Resource%20Upgr
ade%20at%20Papua%20LNG%20Field
35%
36%
37%
38%
39%
40%
41%
42%
0
500
1,000
1,500
2,000
2,500
3,000
1980 1985 1990 1995 2000 2005 2010 2015
Gas proved reserves (thousand million barrels)
Oil proved reserves (thousand million barrels)
% gas
17 The contents of this paper are the author’s sole responsibility. They do not necessarily represent the views of
the Oxford Institute for Energy Studies or any of its Members.
Even though Petrobras's hydrocarbon reserves decreased again (-0.8%) with a reserves life of 12 years,
it still managed to overtake Shell. It has the lowest gas mix in its reserves (15%) and as the state-owned
company with the smallest R/P it appears to be the least prepared to operate in a greener world where
gas is growing faster than oil.
With a drop of its hydrocarbon reserves by 7.7% in 2017, Shell moved down 2 places. After consolidation
with BG in 2016 Shell divested away from synthetic crude. It has the lowest R/P ratio of our sample with
only 9 years. Its proven reserves should also be reduced by 0.5-0.65 boe in 2018 (-5% vs 2017 level)
following the Dutch decision to close Groningen. In its energy transition report, Shell estimates that
around 80% of its current proved oil and gas reserves will be produced by 2030 and only around 20%
after that time. Production that is already on stream will continue as long as it covers marginal costs40.
But Shell should need either to boost upstream spending to book reserves or to continue to buy already
booked reserves to avoid reporting an R/P below 9 years that could be viewed as too low by analysts.
Chevron's hydrocarbon reserves increased by 5.4% with a reserves life of 12 years, allowing it to exceed
Total whose hydrocarbon reserves decreased again by 0.4% with the same reserves life. It is interesting
to see that the American companies (ExxonMobil and Chevron) are the least gassy in terms of reserves
with respectively 46% and 44%, only exceeding Petrobras (15%). In a world where gas demand is
expected to grow faster than oil, these companies may have to adapt their strategy sooner rather than
later.
BP's hydrocarbon reserves (excluding its 19.75% share in Rosneft) increased by 1.6% with a reserves
life of 12 years. By including Rosneft’s share the reserve life is boosted by 2 years. This shows the
importance for oil & gas companies of operating in fossil rich countries if they want to access reserves.
Statoil, ENI and ConocoPhillips don’t reach our 10 bboe target to enter our reserves ranking.
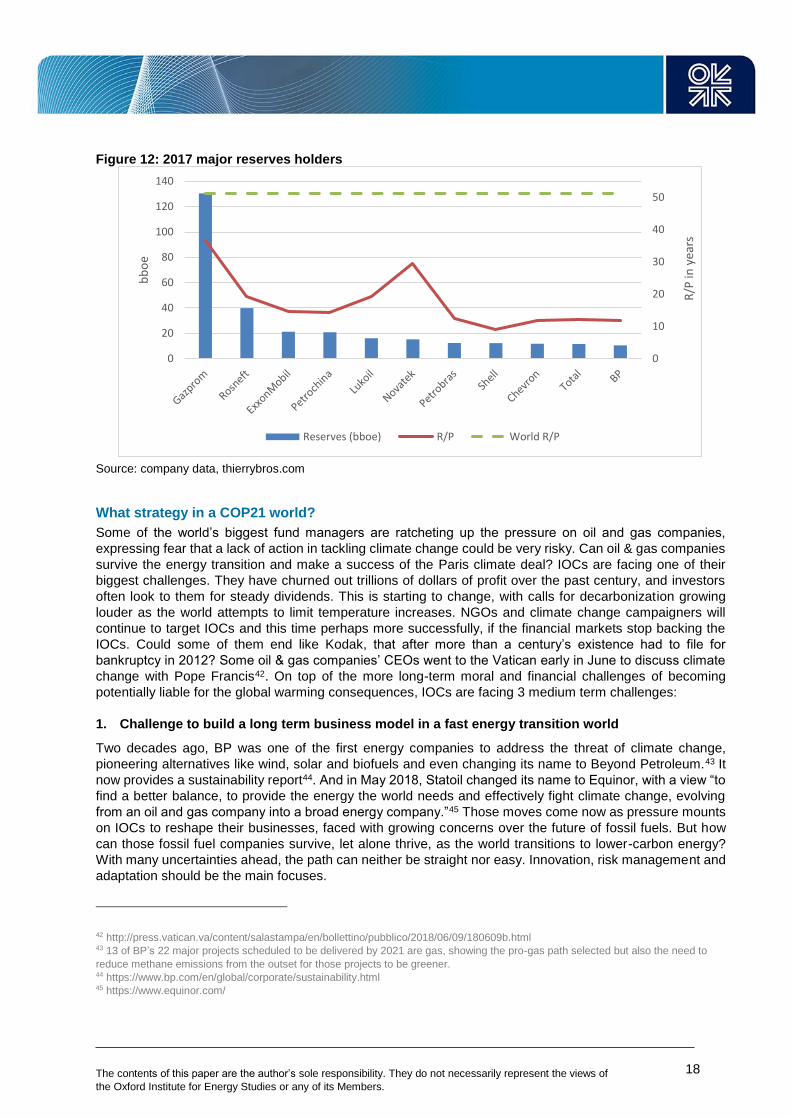
Most hydrocarbon resources are in the hands of state-owned companies. The top four listed companies that
have the largest resources include two Russian and one Chinese (all three partially state-owned). But having
vast hydrocarbon resources in a world facing an energy transition could become problematic in terms of
valuation. This is perhaps the idea behind the Saudi Aramco IPO. It is always better for a State that needs
cash to privatize one of its companies before the market realizes its business model is no longer suitable.
The best examples can be seen in France where the State privatized both its utilities (EDF & Engie) a few
years before their valuation crashed because they were not able to adapt.
International Oil Companies (IOCs) have a reserves life of around 941 to 15 years. But in a world where oil &
gas prices are not expected to go north as major resource holders try to fast-track monetization of their
assets before we move to a de-carbonised world, all energy companies need to re-invent themselves. Failure
to re-invent will impact companies’ long-term ability to operate. In an energy transition world, oil & gas
companies need to invent and fast-track a "low cost" model if they want to avoid being "lost in transition" in
front of renewables that are getting cheaper and cheaper.
40 Page 37 41 The minimum R/P is 7 for Statoil but Statoil doesn’t fully qualify as an IOC as it is majority owned by the Norwegian state.
18 The contents of this paper are the author’s sole responsibility. They do not necessarily represent the views of
the Oxford Institute for Energy Studies or any of its Members.
Figure 12: 2017 major reserves holders
Source: company data, thierrybros.com
What strategy in a COP21 world?
Some of the world’s biggest fund managers are ratcheting up the pressure on oil and gas companies,
expressing fear that a lack of action in tackling climate change could be very risky. Can oil & gas companies
survive the energy transition and make a success of the Paris climate deal? IOCs are facing one of their
biggest challenges. They have churned out trillions of dollars of profit over the past century, and investors
often look to them for steady dividends. This is starting to change, with calls for decarbonization growing
louder as the world attempts to limit temperature increases. NGOs and climate change campaigners will
continue to target IOCs and this time perhaps more successfully, if the financial markets stop backing the
IOCs. Could some of them end like Kodak, that after more than a century’s existence had to file for
bankruptcy in 2012? Some oil & gas companies’ CEOs went to the Vatican early in June to discuss climate
change with Pope Francis42. On top of the more long-term moral and financial challenges of becoming
potentially liable for the global warming consequences, IOCs are facing 3 medium term challenges:
1. Challenge to build a long term business model in a fast energy transition world
Two decades ago, BP was one of the first energy companies to address the threat of climate change,
pioneering alternatives like wind, solar and biofuels and even changing its name to Beyond Petroleum.43 It
now provides a sustainability report44. And in May 2018, Statoil changed its name to Equinor, with a view “to
find a better balance, to provide the energy the world needs and effectively fight climate change, evolving
from an oil and gas company into a broad energy company.”45 Those moves come now as pressure mounts
on IOCs to reshape their businesses, faced with growing concerns over the future of fossil fuels. But how
can those fossil fuel companies survive, let alone thrive, as the world transitions to lower-carbon energy?
With many uncertainties ahead, the path can neither be straight nor easy. Innovation, risk management and
adaptation should be the main focuses.
42 http://press.vatican.va/content/salastampa/en/bollettino/pubblico/2018/06/09/180609b.html 43 13 of BP’s 22 major projects scheduled to be delivered by 2021 are gas, showing the pro-gas path selected but also the need to
reduce methane emissions from the outset for those projects to be greener. 44 https://www.bp.com/en/global/corporate/sustainability.html 45 https://www.equinor.com/
0
10
20
30
40
50
0
20
40
60
80
100
120
140
R/P
in y
ears
bb
oe
Reserves (bboe) R/P World R/P
19 The contents of this paper are the author’s sole responsibility. They do not necessarily represent the views of
the Oxford Institute for Energy Studies or any of its Members.
Shell’s new Energy Transition report46, published in March 2018, shows how the company expects to adapt
during the transition to low carbon energy systems. It says that it wants electricity “including from renewable
sources to become the fourth pillar of its business, alongside oil, gas and chemicals.” It expects that its own
production of oil and gas will shift in favour of the latter, cleaner-burning fuel, stating that it expects a move
from a current 50/50 ratio to 75% gas and 25% oil production by 2050. The overall aim outlined in the report
is to halve the net carbon footprint of the company’s energy products by 2050, with an interim target of a
20% reduction by 2035. Most of the emissions reductions will result from changes in Shell’s products portfolio
after 2030. Shell sees little risk that some of its oil and gas reserves will be left in the ground because the
life of its reserve base is below the industry average. The risk of Shell’s proven oil and gas reserves becoming
stranded assets is low as it estimates that some 80% of its current reserves will be produced by 2030.
The path to the electrification of vehicles will dictate the timing of the peak in oil demand with gas to remain
the only growing fossil fuel in the coming decades. The Statoil CEO has stated that some oil will have to be
left in the ground. But he believes that this is not a threat to his company’s gas production47. On oil demand
in 2040, the Total CEO stated48 that the range was very large, from “80mb/d if we were to achieve the 2°C
scenario (but we are still lacking the technology to achieve this) to 125mb/d if we wanted to provide cheap
energy to a growing population”. But gas demand was, for him, expected to grow in all scenarios, hence he
labelled Total not an ‘oil & gas’ company but a ‘gas & oil’ company.
This raises the question not only of the value of long term reserves that could be stranded but also of medium
term reserves. An interesting timely indicator to watch could be if Shell’s market capitalisation overtakes
ExxonMobil’s, because the market may favour Shell more now thanks to its gas business being ahead of
ExxonMobil in an energy transition path.
Innovation is most likely to take place in the electricity sector and most IOCs are looking into it. Total bought
battery maker Saft in 2016, and Shell bought Dutch recharging network company New Motion in 2017, and
is introducing charging points in the UK. In May 2018, BP49 invested $20m in StoreDot, an Israeli technology
start-up developing a next-gen vehicle battery, marking the oil major’s third excursion into electric power this
year. It had also bought FreeWire Technologies, a manufacturer of mobile rapid charging systems for electric
vehicles and China’s NIO Capital to explore opportunities in advanced mobility, including electric vehicles
and batteries. The same day, BP announced a fresh round of staff cuts in its upstream division. In an update
to its strategy through 2020, Repsol said on 6 June50 it would invest €4bn in new initiatives downstream and
in the low emissions businesses in the period, meaning capex will be more balanced between upstream and
other businesses, with upstream representing 53% of capex.
IOCs will also have to integrate blockchain technology sooner rather than later. Blockchain is not user friendly
by construction as it needs not to be corrupted and hence could not replace trusted operating organizations
(banks and utilities in OECD) but could provide an answer to selling energy in developed countries due to
the extreme low cost of the transactions involved and the fact that organizations there are not trusted by the
public. It is very early days and the standards for this technology are not in place and face further challenges
(legal, compliance and the fact that full transparency is not a concept some organizations are particular
happy with!). The challenge is to develop a more user-friendly, not as transparent but still resilient blockchain
that could serve specific purposes/clients (selling solar energy inside a local community). But like the internet
20 years ago, it is highly likely that blockchain will impact consumers’ behaviour.
2. Challenge of “new” entrants that better master big data and customer service
Even if IOCs have a huge number of clients it is obvious that they didn’t invest much in the past either in
customer service or in understanding clients’ needs. With big data becoming strategic everywhere, IOCs
46 https://www.shell.com/energy-and-innovation/the-energy-future/shell-energy-transition-report.html 47 Norway’s gassier future in Natural Gas World Vol 3, Issue 7, April 2018 48 At the Paris Oil Summit on 20 April 2018 49 https://www.bp.com/en/global/corporate/media/press-releases/bp-invests-in-ultra-fast-charging-battery-company-storedot.html 50 https://www.repsol.com/en/press-room/press-releases/repsol-updates-2018-2020-strategic-plan.cshtml
20 The contents of this paper are the author’s sole responsibility. They do not necessarily represent the views of
the Oxford Institute for Energy Studies or any of its Members.
need to adapt as, for instance, Google and Repsol have teamed up to boost oil refinery efficiency51. Google’s
technology and artificial intelligence will be used to analyse hundreds of variables like pressure, temperature,
flows and processing rates with the hope of boosting refining margins by 0.30$/b. Could IOCs be also
threatened by the GAFA companies52 for big data as well as from start-ups for providing a customer friendly
way of selling energy? If this materializes, IOCs will be marginalized at the upstream level and the GAFA
companies and start-ups could access not only final customers but could also aim to make sure that the
margin historically at the upstream level would migrate to them.
3. Chinese challenge
Finally, the biggest worldwide hydro producer, China Three Gorges (CTG) Corporation53 could be best
positioned to invest in renewables. On top of operating in China and engaging with neighbouring countries
and regions that have a favourable geopolitical environment and an ability to transmit power back to China,
CTG is expanding worldwide.
CTG invested over $5bn in a 7.87 GW portfolio, thus becoming one of the major private power companies
in Brazil. In 2014, it invested in three medium-sized hydropower stations in partnership with Energias de
Portugal (EDP) and acquired a 49% stake in a Brazilian wind power management company (11 wind
farms in total). In 2015, CTG acquired a 100% stake in Garibaldi and Salto Hydropower Stations. In
2015, CTG won the bid for a 30-year concession for Hydropower Stations in Brazil. In 2016, CTG
acquired 10 hydropower stations from the American firm Duke Energy in Brazil with a total installed
capacity of 2.27 GW.
In Europe, in 2012, CTG took a 23.3% equity stake in EDP for €2.7bn, becoming the utility’s single
largest shareholder. In 2016, CTG acquired an 80% stake in the German WindMW Offshore Wind Farm
and a 49% stake in Polish and Italian onshore wind assets. Finally, on 11 May 2018, CTG launched a
hostile €9bn offer to acquire the 76.7% it doesn't already own in EDP. In short, CTG could become the
only renewable global company.
This challenge for Western companies is compounded by the fact that Chinese state capitalism is not the
same as market capitalism and when acquiring international assets state-controlled CTG is ultimately an
instrument of the Chinese Communist Party, which has to deal with energy and economic transition at home.
Can fossil-based companies that are dependent on resource prices continue to thrive when the world moves away from this resource?
In the last 2 decades, IOC strategy has not really changed that much regarding climate change as fossil fuel
consumption was growing and there was no credible alternative. But we are now all aware of global warming,
with April 2018 marking the 400th consecutive month with global temperatures exceeding the 20th century
average54. So, the faster the world moves into a greener world, the better a 100% green company like CTG
should perform while the major oil companies will face greater challenges. In addition, if the next EU
Commission wants to achieve a net-zero carbon emission world, how could those fossil fuels businesses
evolve? The world has never been addicted to oil but to cheap energy. With renewables becoming cheaper,
it is arguable that the world addiction to energy is now moving into renewables.
The power of influence is shifting away from energy producers. But who is going to get it in the future?
Consumers, Google, Tesla or someone else? And, more importantly, who will retain the margin if we move
to a zero marginal cost renewable world?
51 https://www.repsol.com/en/press-room/press-releases/repsol-and-google-cloud-optimize-refinery-management.cshtml 52 The four big tech companies are referred to as GAFA, an acronym for Google, Apple, Facebook, and Amazon. 53 CGT produced 263 TWh in 2016 (CGT 2016 Annual report – 2017 not yet available) – For comparison, EDF the nuclear leader
produced 449 TWh. 54 According to the US National Centers for Environmental Information, information available
https://www.ncdc.noaa.gov/sotc/global/201804