Embed Size (px)
Citation preview

Lisa Emsbo-Mattingly Director of Asset Allocation Research
Dirk Hofschire, CFA SVP, Asset Allocation Research
Austin Litvak Senior Analyst, Asset Allocation Research
Jake Weinstein, CFA Senior Analyst, Asset Allocation Research
Caitlin Dourney Analyst, Asset Allocation Research
Quarterly Market Update PRIMARY CONTRIBUTORS
SECOND QUARTER 2016
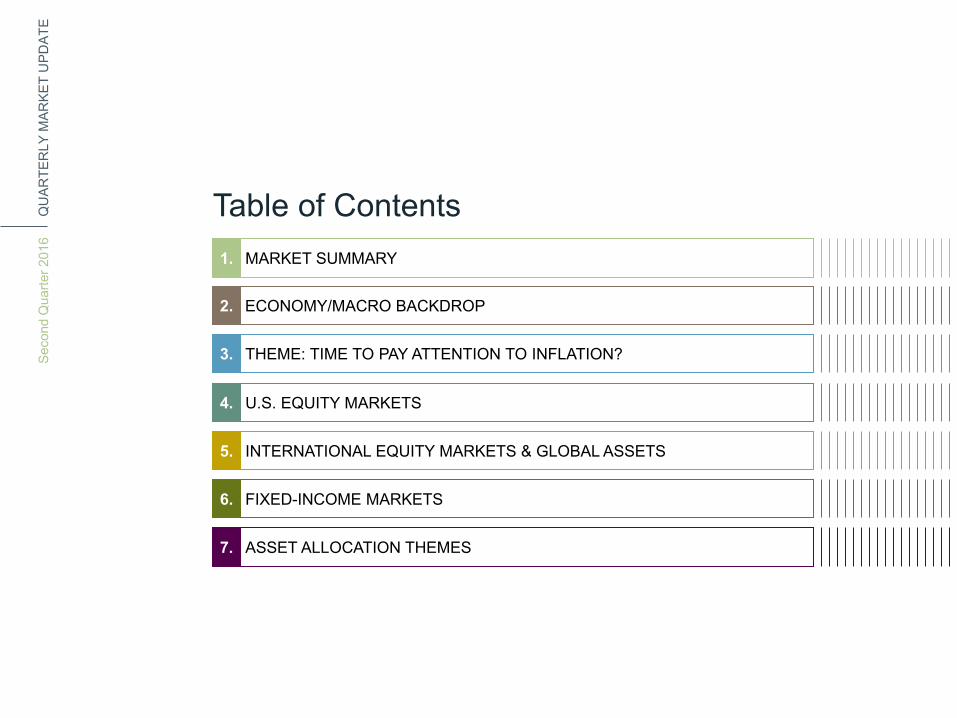
THEME: TIME TO PAY ATTENTION TO INFLATION? 3.
Table of Contents
Seco
nd Q
uarte
r 201
6 Q
UAR
TER
LY M
ARKE
T U
PDAT
E
MARKET SUMMARY 1.
ECONOMY/MACRO BACKDROP 2.
U.S. EQUITY MARKETS 4.
INTERNATIONAL EQUITY MARKETS & GLOBAL ASSETS 5.
FIXED-INCOME MARKETS 6.
ASSET ALLOCATION THEMES 7.
Market Summary
Seco
nd Q
uarte
r 201
6 Q
UAR
TER
LY M
ARKE
T U
PDAT
E
S
UM
MAR
Y
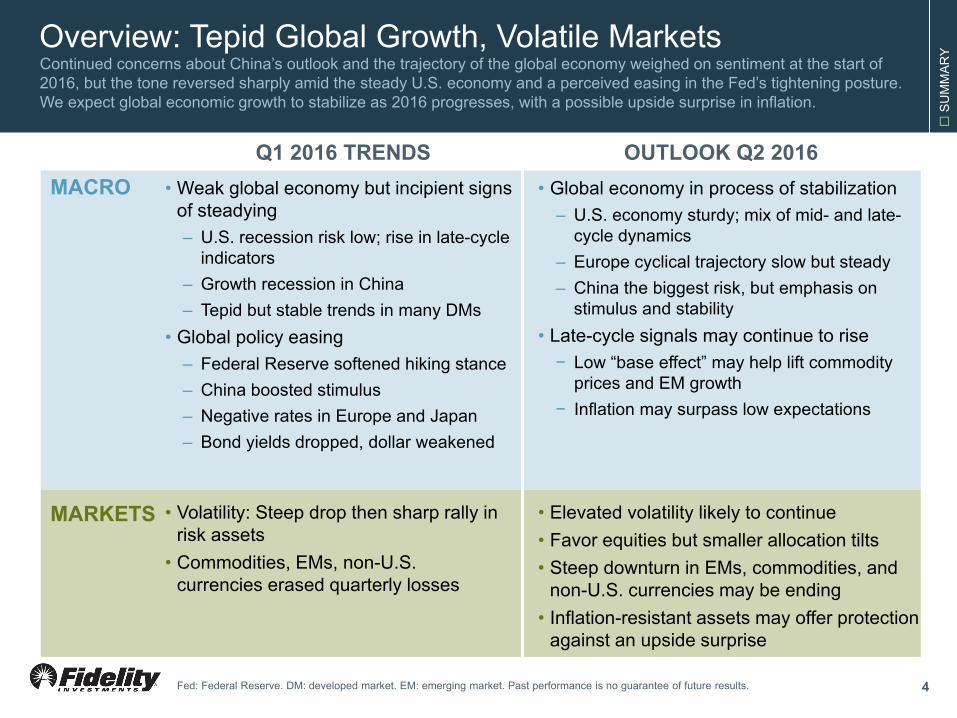
Overview: Tepid Global Growth, Volatile Markets Continued concerns about China’s outlook and the trajectory of the global economy weighed on sentiment at the start of 2016, but the tone reversed sharply amid the steady U.S. economy and a perceived easing in the Fed’s tightening posture. We expect global economic growth to stabilize as 2016 progresses, with a possible upside surprise in inflation.
Fed: Federal Reserve. DM: developed market. EM: emerging market. Past performance is no guarantee of future results.
• Weak global economy but incipient signs of steadying – U.S. recession risk low; rise in late-cycle
indicators – Growth recession in China – Tepid but stable trends in many DMs
• Global policy easing – Federal Reserve softened hiking stance – China boosted stimulus – Negative rates in Europe and Japan – Bond yields dropped, dollar weakened
• Global economy in process of stabilization – U.S. economy sturdy; mix of mid- and late-
cycle dynamics – Europe cyclical trajectory slow but steady – China the biggest risk, but emphasis on
stimulus and stability • Late-cycle signals may continue to rise
− Low “base effect” may help lift commodity prices and EM growth
− Inflation may surpass low expectations
Q1 2016 TRENDS OUTLOOK Q2 2016 MACRO
MARKETS
4
• Volatility: Steep drop then sharp rally in risk assets
• Commodities, EMs, non-U.S. currencies erased quarterly losses
• Elevated volatility likely to continue • Favor equities but smaller allocation tilts • Steep downturn in EMs, commodities, and
non-U.S. currencies may be ending • Inflation-resistant assets may offer protection
against an upside surprise
S
UM
MAR
Y
-40-30-20-10
0102030
Dec
-08
Sep-
02Se
p-01
Jun-
10Se
p-90
Mar
-08
Sep-
08Se
p-86
Dec
-07
Jun-
12Ju
n-00
Sep-
00Ju
n-11
Jun-
92M
ar-1
6D
ec-8
9M
ar-9
0M
ar-0
0M
ar-0
4M
ar-0
7M
ar-9
2Se
p-93
Dec
-12
Dec
-94
Mar
-93
Jun-
89Se
p-14
Dec
-05
Sep-
96Ju
n-15
Dec
-88
Dec
-93
Jun-
90D
ec-1
4D
ec-9
0Se
p-03
Jun-
96M
ar-1
0Ju
n-86
Jun-
13M
ar-9
5Se
p-13
Dec
-96
Sep-
12D
ec-0
6Se
p-95
Mar
-99
Jun-
87M
ar-9
6D
ec-1
5Se
p-10
Sep-
87M
ar-1
3D
ec-1
3M
ar-9
1Ju
n-03
Dec
-10
Mar
-12
Dec
-99
Mar
-87
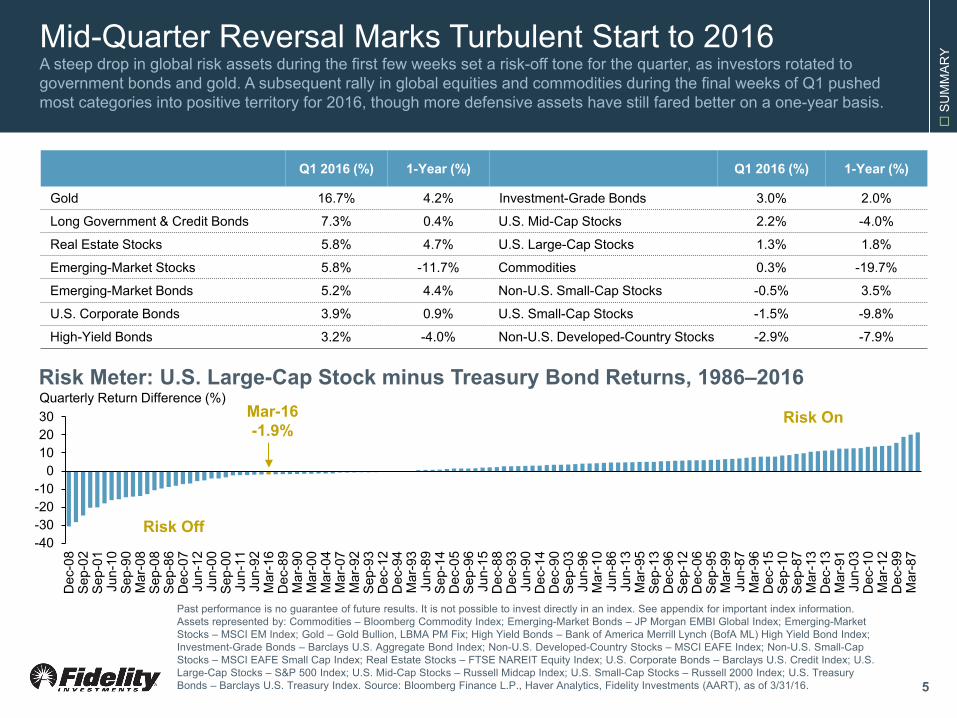
Mid-Quarter Reversal Marks Turbulent Start to 2016 A steep drop in global risk assets during the first few weeks set a risk-off tone for the quarter, as investors rotated to government bonds and gold. A subsequent rally in global equities and commodities during the final weeks of Q1 pushed most categories into positive territory for 2016, though more defensive assets have still fared better on a one-year basis.
5
Q1 2016 (%) 1-Year (%) Q1 2016 (%) 1-Year (%)
Gold 16.7% 4.2% Investment-Grade Bonds 3.0% 2.0%
Long Government & Credit Bonds 7.3% 0.4% U.S. Mid-Cap Stocks 2.2% -4.0%
Real Estate Stocks 5.8% 4.7% U.S. Large-Cap Stocks 1.3% 1.8%
Emerging-Market Stocks 5.8% -11.7% Commodities 0.3% -19.7%
Emerging-Market Bonds 5.2% 4.4% Non-U.S. Small-Cap Stocks -0.5% 3.5%
U.S. Corporate Bonds 3.9% 0.9% U.S. Small-Cap Stocks -1.5% -9.8%
High-Yield Bonds 3.2% -4.0% Non-U.S. Developed-Country Stocks -2.9% -7.9%
Risk Meter: U.S. Large-Cap Stock minus Treasury Bond Returns, 1986–2016 Quarterly Return Difference (%)
Risk Off
Risk On Mar-16 -1.9%
Past performance is no guarantee of future results. It is not possible to invest directly in an index. See appendix for important index information. Assets represented by: Commodities – Bloomberg Commodity Index; Emerging-Market Bonds – JP Morgan EMBI Global Index; Emerging-Market Stocks – MSCI EM Index; Gold – Gold Bullion, LBMA PM Fix; High Yield Bonds – Bank of America Merrill Lynch (BofA ML) High Yield Bond Index; Investment-Grade Bonds – Barclays U.S. Aggregate Bond Index; Non-U.S. Developed-Country Stocks – MSCI EAFE Index; Non-U.S. Small-Cap Stocks – MSCI EAFE Small Cap Index; Real Estate Stocks – FTSE NAREIT Equity Index; U.S. Corporate Bonds – Barclays U.S. Credit Index; U.S. Large-Cap Stocks – S&P 500 Index; U.S. Mid-Cap Stocks – Russell Midcap Index; U.S. Small-Cap Stocks – Russell 2000 Index; U.S. Treasury Bonds – Barclays U.S. Treasury Index. Source: Bloomberg Finance L.P., Haver Analytics, Fidelity Investments (AART), as of 3/31/16.
S
UM
MAR
Y
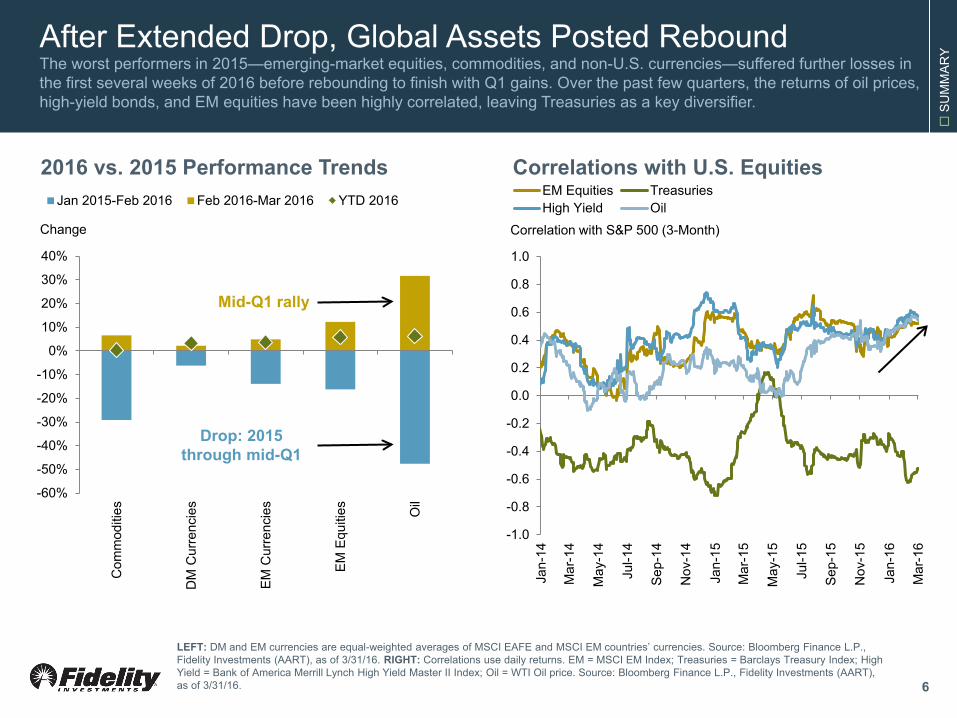
After Extended Drop, Global Assets Posted Rebound The worst performers in 2015—emerging-market equities, commodities, and non-U.S. currencies—suffered further losses in the first several weeks of 2016 before rebounding to finish with Q1 gains. Over the past few quarters, the returns of oil prices, high-yield bonds, and EM equities have been highly correlated, leaving Treasuries as a key diversifier.
6
-60%
-50%
-40%
-30%
-20%
-10%
0%
10%
20%
30%
40%
Com
mod
ities
DM
Cur
renc
ies
EM C
urre
ncie
s
EM E
quiti
es Oil
Jan 2015-Feb 2016 Feb 2016-Mar 2016 YTD 2016
2016 vs. 2015 Performance Trends
LEFT: DM and EM currencies are equal-weighted averages of MSCI EAFE and MSCI EM countries’ currencies. Source: Bloomberg Finance L.P., Fidelity Investments (AART), as of 3/31/16. RIGHT: Correlations use daily returns. EM = MSCI EM Index; Treasuries = Barclays Treasury Index; High Yield = Bank of America Merrill Lynch High Yield Master II Index; Oil = WTI Oil price. Source: Bloomberg Finance L.P., Fidelity Investments (AART), as of 3/31/16.
-1.0
-0.8
-0.6
-0.4
-0.2
0.0
0.2
0.4
0.6
0.8
1.0
Jan-
14
Mar
-14
May
-14
Jul-1
4
Sep-
14
Nov
-14
Jan-
15
Mar
-15
May
-15
Jul-1
5
Sep-
15
Nov
-15
Jan-
16
Mar
-16
EM Equities TreasuriesHigh Yield Oil
Correlations with U.S. Equities
Correlation with S&P 500 (3-Month)
Mid-Q1 rally
Drop: 2015 through mid-Q1
Change
S
UM
MAR
Y
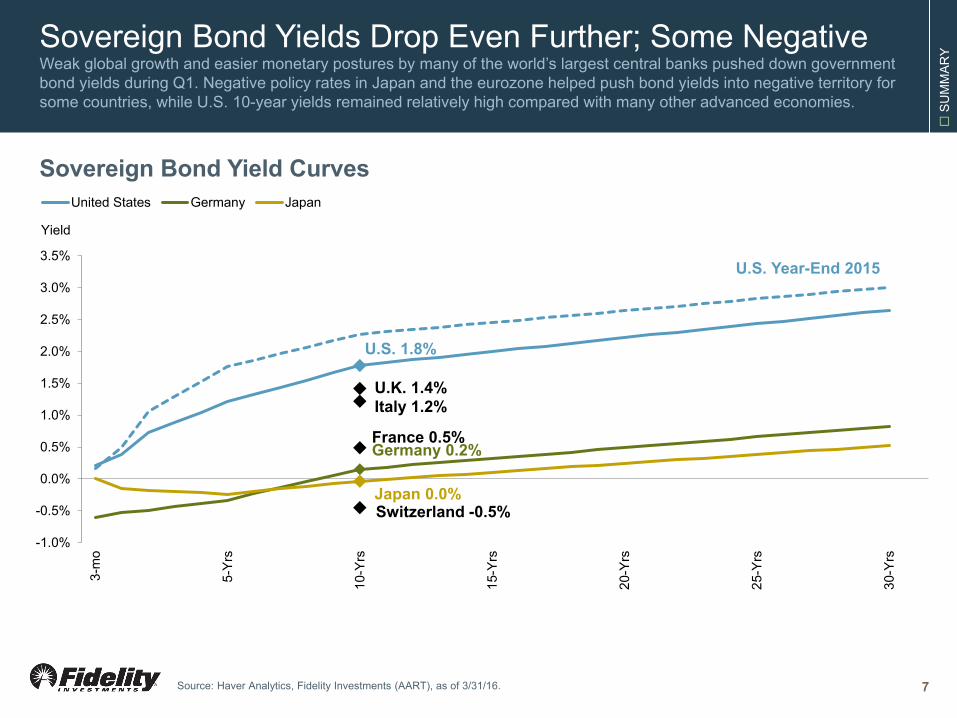
U.S. 1.8%
Germany 0.2%
Japan 0.0% Switzerland -0.5%
Italy 1.2% U.K. 1.4%
France 0.5%
-1.0%
-0.5%
0.0%
0.5%
1.0%
1.5%
2.0%
2.5%
3.0%
3.5%
3-m
o
5-Yr
s
10-Y
rs
15-Y
rs
20-Y
rs
25-Y
rs
30-Y
rs
United States Germany Japan
Sovereign Bond Yields Drop Even Further; Some Negative Weak global growth and easier monetary postures by many of the world’s largest central banks pushed down government bond yields during Q1. Negative policy rates in Japan and the eurozone helped push bond yields into negative territory for some countries, while U.S. 10-year yields remained relatively high compared with many other advanced economies.
7 Source: Haver Analytics, Fidelity Investments (AART), as of 3/31/16.
Sovereign Bond Yield Curves
Yield
U.S. Year-End 2015
Seco
nd Q
uarte
r 201
6 Q
UAR
TER
LY M
ARKE
T U
PDAT
E
Economy/Macro Backdrop
E
CO
NO
MY
DYNAMIC ASSET ALLOCATION TIMELINE
Business Cycle (10–30 years)
Secular HORIZONS
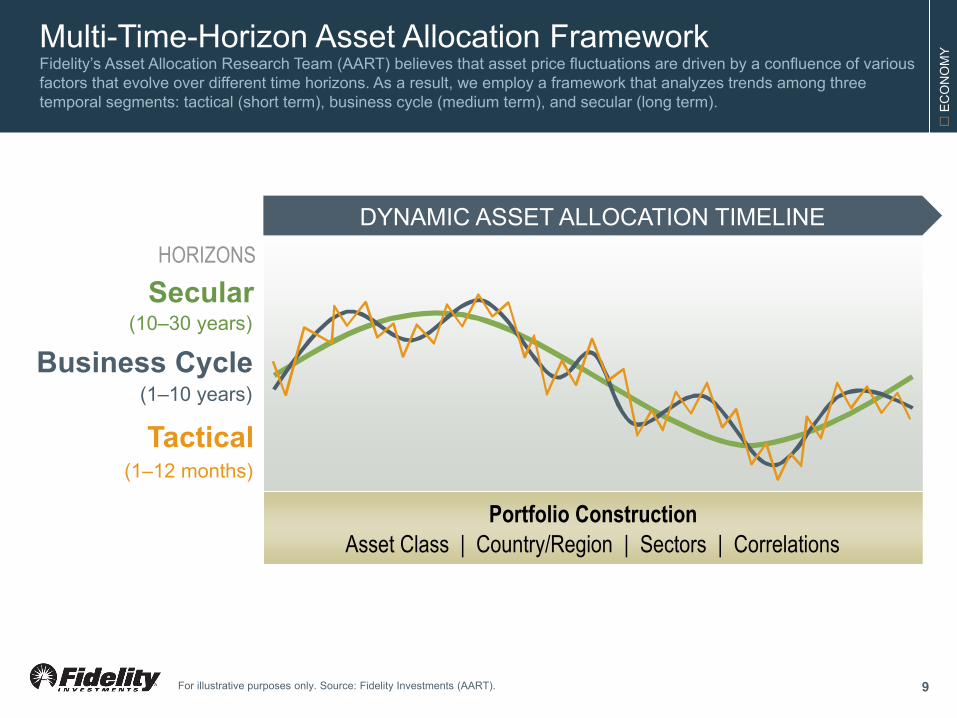
Multi-Time-Horizon Asset Allocation Framework Fidelity’s Asset Allocation Research Team (AART) believes that asset price fluctuations are driven by a confluence of various factors that evolve over different time horizons. As a result, we employ a framework that analyzes trends among three temporal segments: tactical (short term), business cycle (medium term), and secular (long term).
9
(1–10 years)
Tactical (1–12 months)
Portfolio Construction Asset Class | Country/Region | Sectors | Correlations
For illustrative purposes only. Source: Fidelity Investments (AART).
E
CO
NO
MY
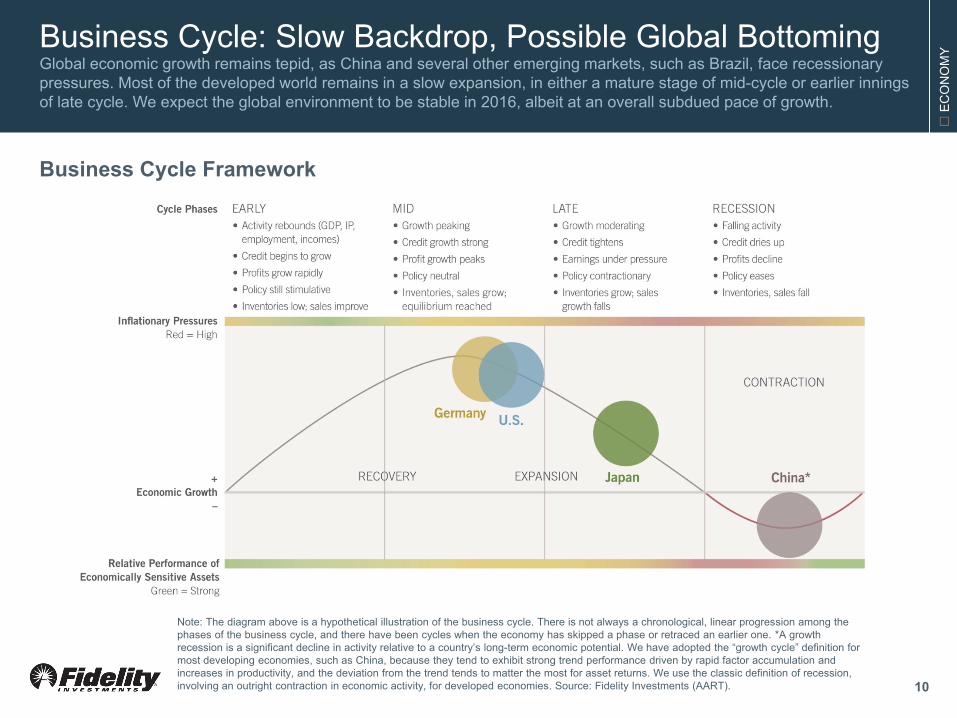
Note: The diagram above is a hypothetical illustration of the business cycle. There is not always a chronological, linear progression among the phases of the business cycle, and there have been cycles when the economy has skipped a phase or retraced an earlier one. *A growth recession is a significant decline in activity relative to a country’s long-term economic potential. We have adopted the “growth cycle” definition for most developing economies, such as China, because they tend to exhibit strong trend performance driven by rapid factor accumulation and increases in productivity, and the deviation from the trend tends to matter the most for asset returns. We use the classic definition of recession, involving an outright contraction in economic activity, for developed economies. Source: Fidelity Investments (AART).
Business Cycle: Slow Backdrop, Possible Global Bottoming Global economic growth remains tepid, as China and several other emerging markets, such as Brazil, face recessionary pressures. Most of the developed world remains in a slow expansion, in either a mature stage of mid-cycle or earlier innings of late cycle. We expect the global environment to be stable in 2016, albeit at an overall subdued pace of growth.
10
Business Cycle Framework
E
CO
NO
MY Global Trade and Industrial Recession May Be Ebbing
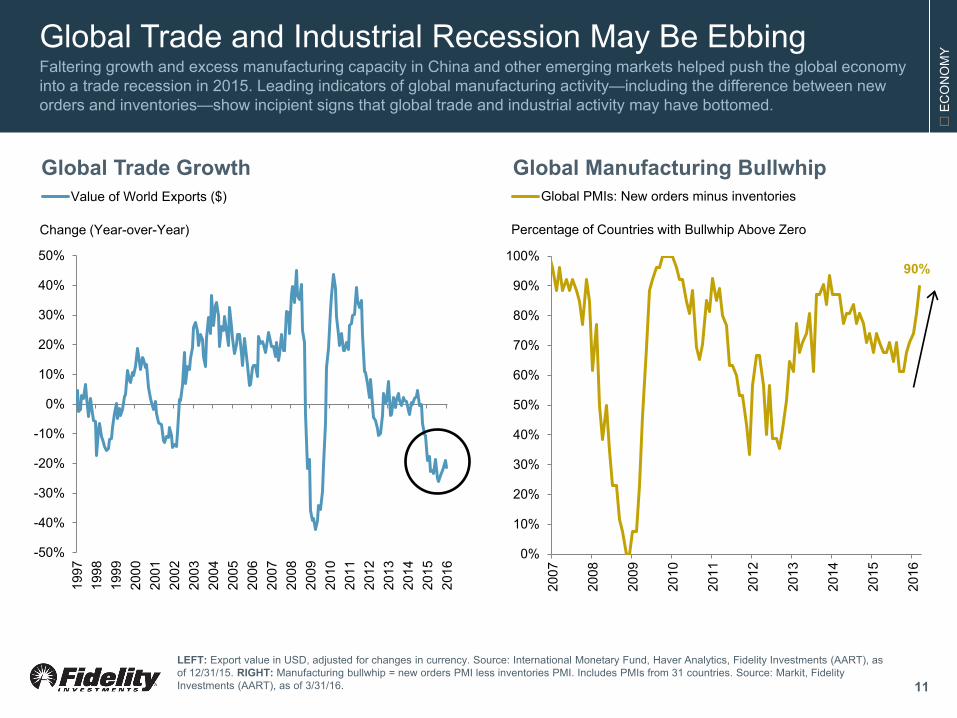
Faltering growth and excess manufacturing capacity in China and other emerging markets helped push the global economy into a trade recession in 2015. Leading indicators of global manufacturing activity—including the difference between new orders and inventories—show incipient signs that global trade and industrial activity may have bottomed.
11
Global Trade Growth
90%
0%
10%
20%
30%
40%
50%
60%
70%
80%
90%
100%
2007
2008
2009
2010
2011
2012
2013
2014
2015
2016
Global PMIs: New orders minus inventories
Global Manufacturing Bullwhip
-50%
-40%
-30%
-20%
-10%
0%
10%
20%
30%
40%
50%
1997
1998
1999
2000
2001
2002
2003
2004
2005
2006
2007
2008
2009
2010
2011
2012
2013
2014
2015
2016
Value of World Exports ($)
LEFT: Export value in USD, adjusted for changes in currency. Source: International Monetary Fund, Haver Analytics, Fidelity Investments (AART), as of 12/31/15. RIGHT: Manufacturing bullwhip = new orders PMI less inventories PMI. Includes PMIs from 31 countries. Source: Markit, Fidelity Investments (AART), as of 3/31/16.
Change (Year-over-Year) Percentage of Countries with Bullwhip Above Zero
E
CO
NO
MY
-3.5% -4.0%
-3.5%
-3.0%
-2.5%
-2.0%
-1.5%
-1.0%
-0.5%
0.0%
0.5%
1.0%
1.5%
2007
2008
2009
2010
2011
2012
2013
2014
2015
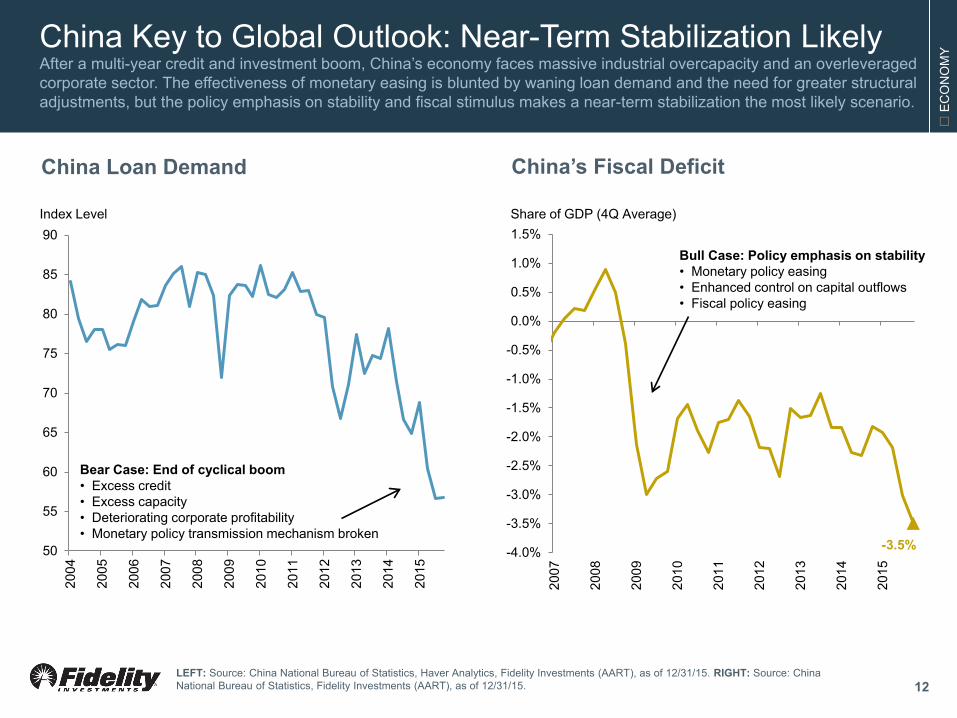
China Key to Global Outlook: Near-Term Stabilization Likely After a multi-year credit and investment boom, China’s economy faces massive industrial overcapacity and an overleveraged corporate sector. The effectiveness of monetary easing is blunted by waning loan demand and the need for greater structural adjustments, but the policy emphasis on stability and fiscal stimulus makes a near-term stabilization the most likely scenario.
12
50
55
60
65
70
75
80
85
90
2004
2005
2006
2007
2008
2009
2010
2011
2012
2013
2014
2015
Bear Case: End of cyclical boom • Excess credit • Excess capacity • Deteriorating corporate profitability • Monetary policy transmission mechanism broken
China Loan Demand
Index Level
China’s Fiscal Deficit
Share of GDP (4Q Average)
Bull Case: Policy emphasis on stability • Monetary policy easing • Enhanced control on capital outflows • Fiscal policy easing
LEFT: Source: China National Bureau of Statistics, Haver Analytics, Fidelity Investments (AART), as of 12/31/15. RIGHT: Source: China National Bureau of Statistics, Fidelity Investments (AART), as of 12/31/15.
E
CO
NO
MY
Australia
Brazil
Canada
Chile
China
Colombia
France
Germany
Greece
India
Indonesia
Italy
Japan
South Korea
Malaysia
Mexico
New Zealand Norway
Peru
Philippines
Russia
South Africa
Spain
Thailand U.K. U.S.
0%
25%
50%
75%
100%
0% 2% 4% 6% 8% 10%Exports to EM Asia/GDP
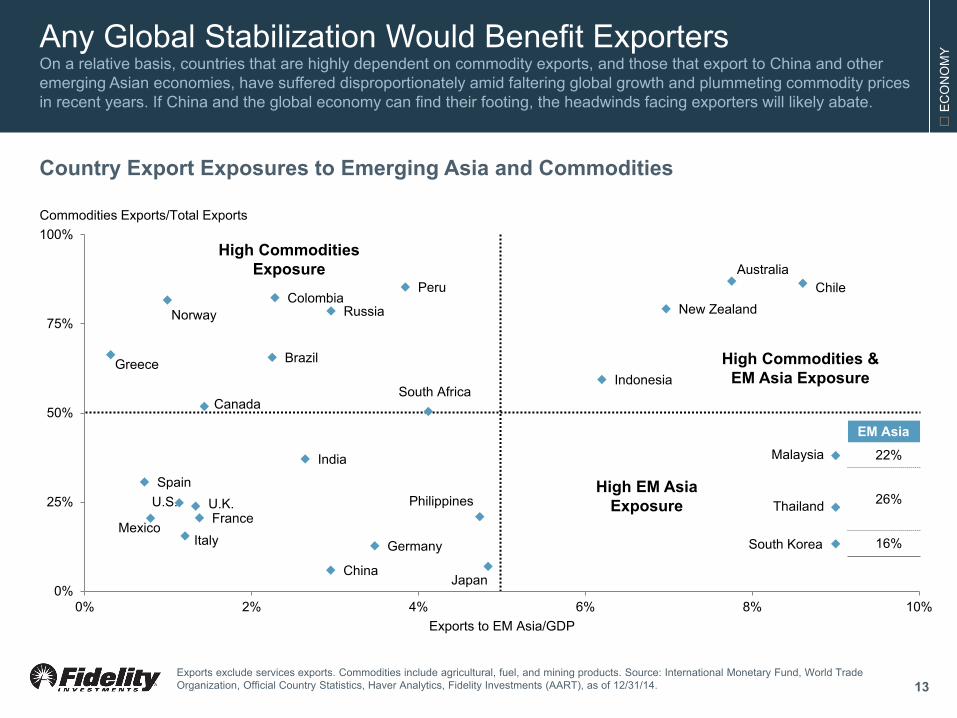
Any Global Stabilization Would Benefit Exporters On a relative basis, countries that are highly dependent on commodity exports, and those that export to China and other emerging Asian economies, have suffered disproportionately amid faltering global growth and plummeting commodity prices in recent years. If China and the global economy can find their footing, the headwinds facing exporters will likely abate.
13
Country Export Exposures to Emerging Asia and Commodities
High Commodities & EM Asia Exposure
High EM Asia Exposure
EM Asia
22%
26%
16%
Exports exclude services exports. Commodities include agricultural, fuel, and mining products. Source: International Monetary Fund, World Trade Organization, Official Country Statistics, Haver Analytics, Fidelity Investments (AART), as of 12/31/14.
Commodities Exports/Total Exports
High Commodities Exposure
E
CO
NO
MY
200
250
300
350
400
450
500
550
600
650
700
55
60
65
70
75
80
85
90
95
100
1996
1997
1998
1999
2000
2001
2002
2003
2004
2005
2006
2007
2008
2009
2010
2011
2012
2013
2014
2015
2016
Consumer 1-Year Real Wage Expectations Initial Unemployment Claims
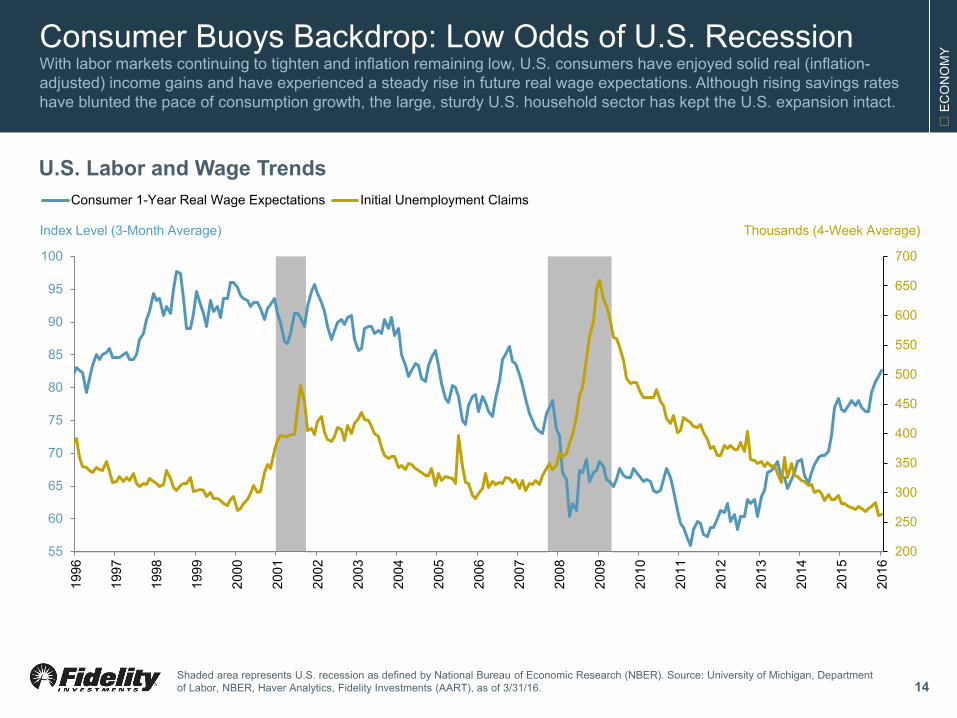
Consumer Buoys Backdrop: Low Odds of U.S. Recession With labor markets continuing to tighten and inflation remaining low, U.S. consumers have enjoyed solid real (inflation-adjusted) income gains and have experienced a steady rise in future real wage expectations. Although rising savings rates have blunted the pace of consumption growth, the large, sturdy U.S. household sector has kept the U.S. expansion intact.
14
Index Level (3-Month Average)
U.S. Labor and Wage Trends
Shaded area represents U.S. recession as defined by National Bureau of Economic Research (NBER). Source: University of Michigan, Department of Labor, NBER, Haver Analytics, Fidelity Investments (AART), as of 3/31/16.
Thousands (4-Week Average)
E
CO
NO
MY
-40%
-20%
0%
20%
40%
60%
80%
100%
2007
2008
2009
2010
2011
2012
2013
2014
2015
2016
Business Loans Mortgage Loans
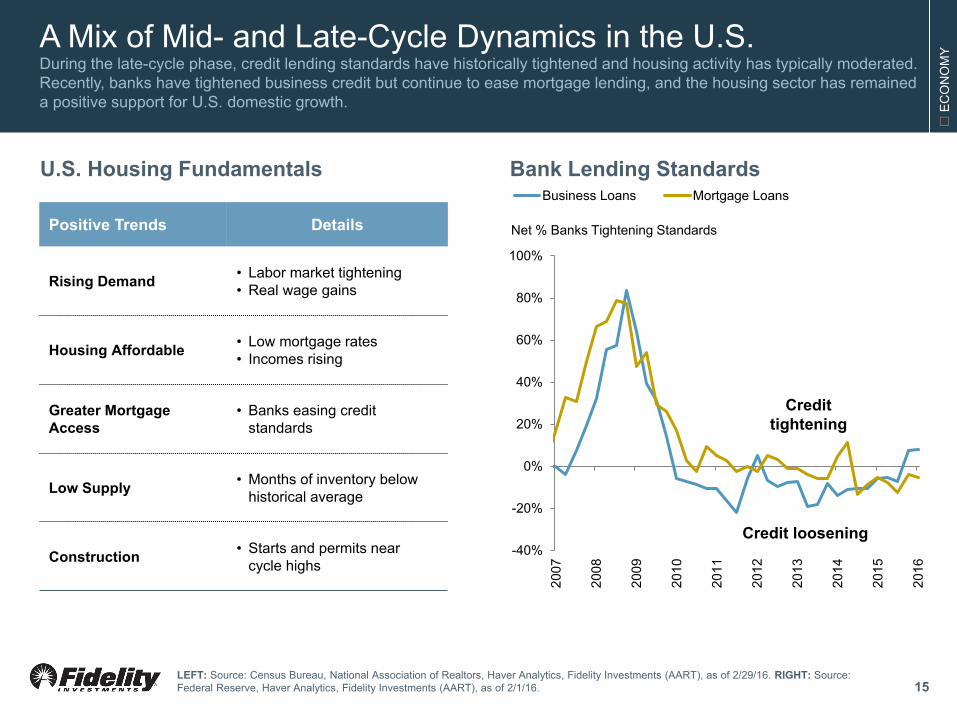
A Mix of Mid- and Late-Cycle Dynamics in the U.S. During the late-cycle phase, credit lending standards have historically tightened and housing activity has typically moderated. Recently, banks have tightened business credit but continue to ease mortgage lending, and the housing sector has remained a positive support for U.S. domestic growth.
15
Positive Trends Details
Rising Demand • Labor market tightening • Real wage gains
Housing Affordable • Low mortgage rates • Incomes rising
Greater Mortgage Access
• Banks easing credit standards
Low Supply • Months of inventory below historical average
Construction • Starts and permits near cycle highs
Net % Banks Tightening Standards
Bank Lending Standards
LEFT: Source: Census Bureau, National Association of Realtors, Haver Analytics, Fidelity Investments (AART), as of 2/29/16. RIGHT: Source: Federal Reserve, Haver Analytics, Fidelity Investments (AART), as of 2/1/16.
U.S. Housing Fundamentals
Credit tightening
Credit loosening
E
CO
NO
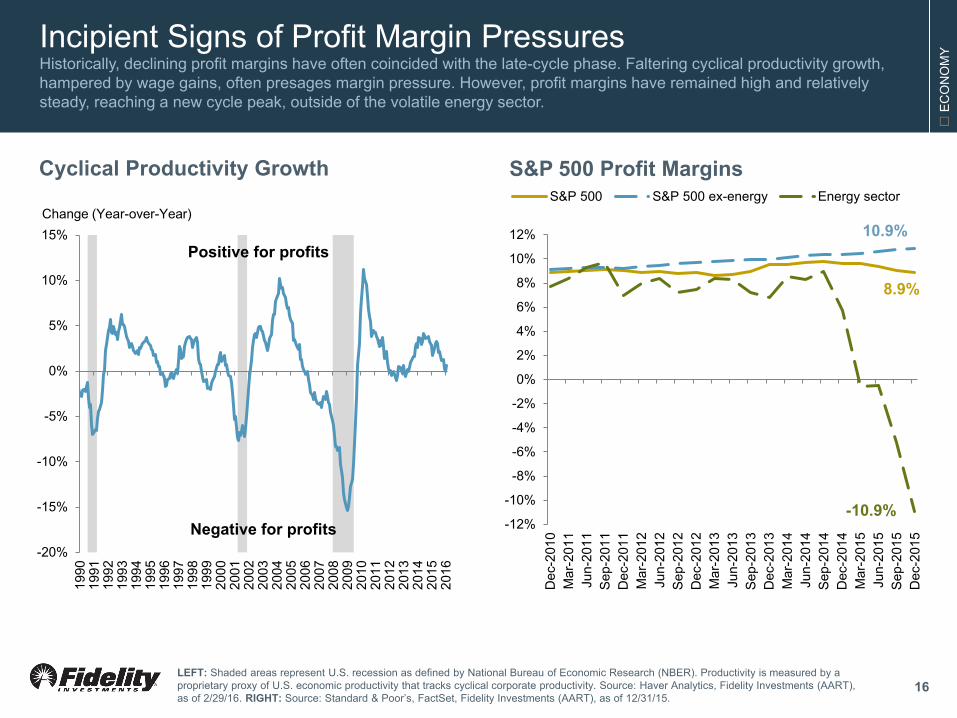
MY Incipient Signs of Profit Margin Pressures
Historically, declining profit margins have often coincided with the late-cycle phase. Faltering cyclical productivity growth, hampered by wage gains, often presages margin pressure. However, profit margins have remained high and relatively steady, reaching a new cycle peak, outside of the volatile energy sector.
16 LEFT: Shaded areas represent U.S. recession as defined by National Bureau of Economic Research (NBER). Productivity is measured by a proprietary proxy of U.S. economic productivity that tracks cyclical corporate productivity. Source: Haver Analytics, Fidelity Investments (AART), as of 2/29/16. RIGHT: Source: Standard & Poor’s, FactSet, Fidelity Investments (AART), as of 12/31/15.
8.9%
10.9%
-10.9% -12%
-10%
-8%
-6%
-4%
-2%
0%
2%
4%
6%
8%
10%
12%
Dec
-201
0M
ar-2
011
Jun-
2011
Sep-
2011
Dec
-201
1M
ar-2
012
Jun-
2012
Sep-
2012
Dec
-201
2M
ar-2
013
Jun-
2013
Sep-
2013
Dec
-201
3M
ar-2
014
Jun-
2014
Sep-
2014
Dec
-201
4M
ar-2
015
Jun-
2015
Sep-
2015
Dec
-201
5
S&P 500 S&P 500 ex-energy Energy sector
S&P 500 Profit Margins
-20%
-15%
-10%
-5%
0%
5%
10%
15%
1990
1991
1992
1993
1994
1995
1996
1997
1998
1999
2000
2001
2002
2003
2004
2005
2006
2007
2008
2009
2010
2011
2012
2013
2014
2015
2016
Cyclical Productivity Growth
Change (Year-over-Year)
Positive for profits
Negative for profits
E
CO
NO
MY
0
1
2
3
4
0%
25%
50%
75%
100%
Mar
-15
Apr-1
5
May
-15
Jun-
15
Jul-1
5
Aug-
15
Sep-
15
Oct
-15
Nov
-15
Dec
-15
Jan-
16
Feb-
16
Mar
-16
Expectation of 0.50%–0.75% Policy Rate by June 2016 AART China Stress Index (FX Component)
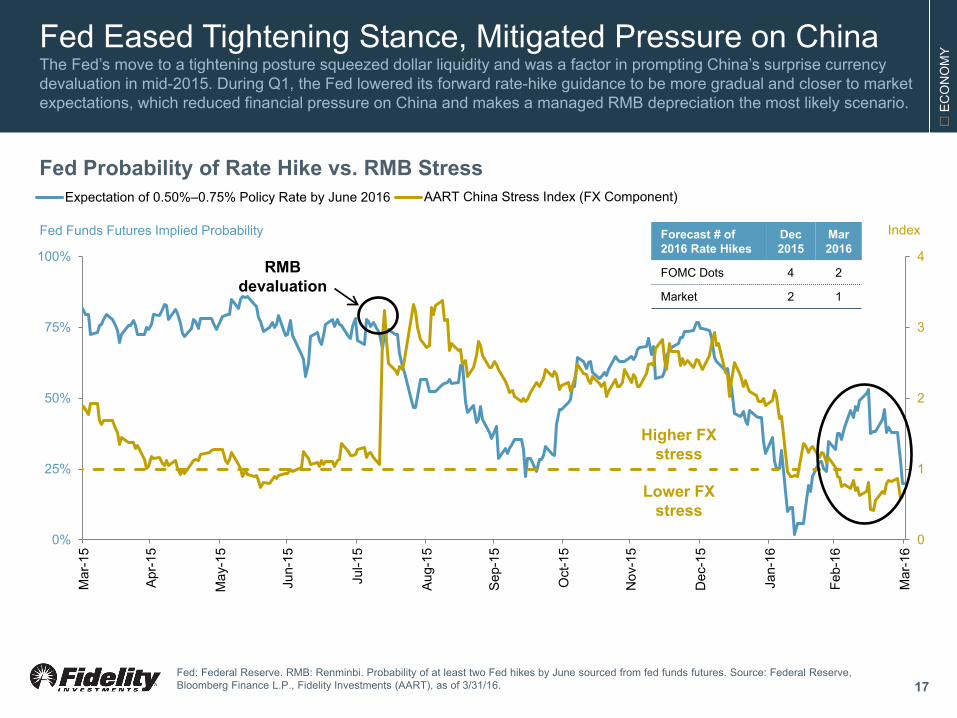
Fed Eased Tightening Stance, Mitigated Pressure on China The Fed’s move to a tightening posture squeezed dollar liquidity and was a factor in prompting China’s surprise currency devaluation in mid-2015. During Q1, the Fed lowered its forward rate-hike guidance to be more gradual and closer to market expectations, which reduced financial pressure on China and makes a managed RMB depreciation the most likely scenario.
17
Fed Probability of Rate Hike vs. RMB Stress
Fed Funds Futures Implied Probability Index
Fed: Federal Reserve. RMB: Renminbi. Probability of at least two Fed hikes by June sourced from fed funds futures. Source: Federal Reserve, Bloomberg Finance L.P., Fidelity Investments (AART), as of 3/31/16.
RMB devaluation
Lower FX stress
Higher FX stress
Forecast # of 2016 Rate Hikes
Dec 2015
Mar 2016
FOMC Dots 4 2
Market 2 1
E
CO
NO
MY
94
96
98
100
102
104
106
108
Apr-1
5
May
-15
Jun-
15
Jul-1
5
Aug-
15
Sep-
15
Oct
-15
Nov
-15
Dec
-15
Jan-
16
Feb-
16
Mar
-16
Apr-1
6
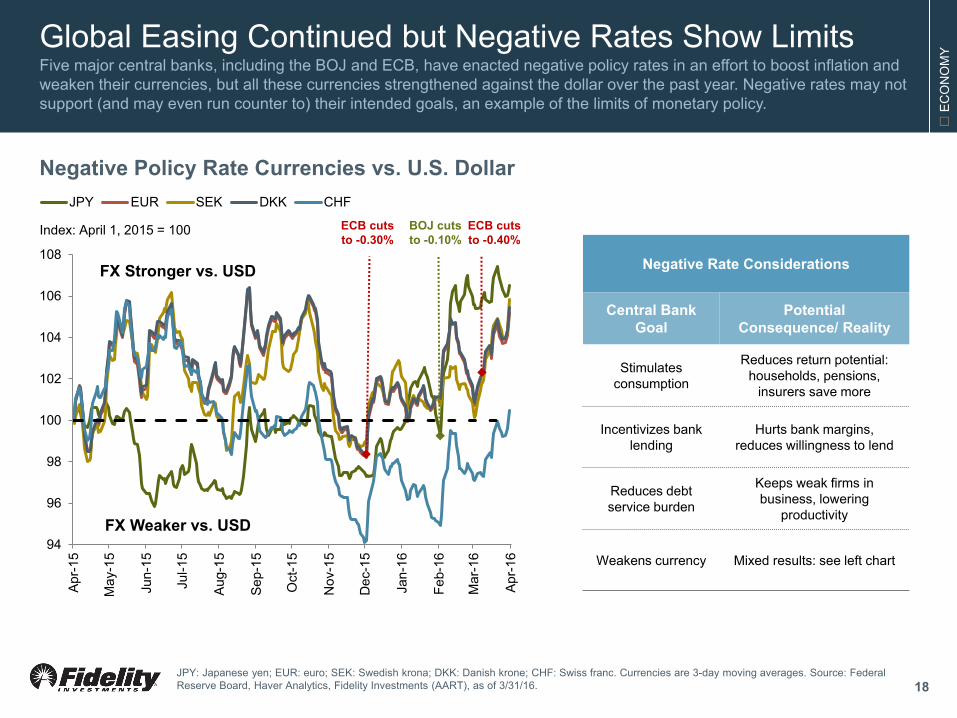
JPY EUR SEK DKK CHF
BOJ cuts to -0.10%
ECB cuts to -0.30%
ECB cuts to -0.40%
Global Easing Continued but Negative Rates Show Limits Five major central banks, including the BOJ and ECB, have enacted negative policy rates in an effort to boost inflation and weaken their currencies, but all these currencies strengthened against the dollar over the past year. Negative rates may not support (and may even run counter to) their intended goals, an example of the limits of monetary policy.
18
FX Stronger vs. USD
FX Weaker vs. USD
Negative Rate Considerations
Central Bank Goal
Potential Consequence/ Reality
Stimulates consumption
Reduces return potential: households, pensions,
insurers save more
Incentivizes bank lending
Hurts bank margins, reduces willingness to lend
Reduces debt service burden
Keeps weak firms in business, lowering
productivity
Weakens currency Mixed results: see left chart
Index: April 1, 2015 = 100
Negative Policy Rate Currencies vs. U.S. Dollar
JPY: Japanese yen; EUR: euro; SEK: Swedish krona; DKK: Danish krone; CHF: Swiss franc. Currencies are 3-day moving averages. Source: Federal Reserve Board, Haver Analytics, Fidelity Investments (AART), as of 3/31/16.
E
CO
NO
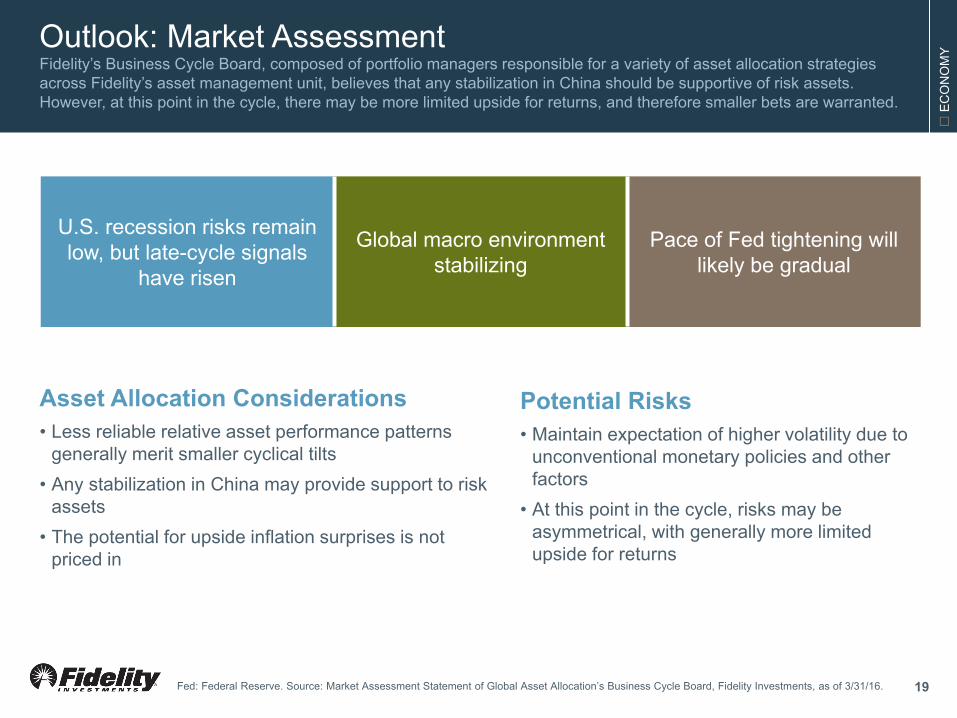
MY Outlook: Market Assessment
Fidelity’s Business Cycle Board, composed of portfolio managers responsible for a variety of asset allocation strategies across Fidelity’s asset management unit, believes that any stabilization in China should be supportive of risk assets. However, at this point in the cycle, there may be more limited upside for returns, and therefore smaller bets are warranted.
Potential Risks • Maintain expectation of higher volatility due to
unconventional monetary policies and other factors
• At this point in the cycle, risks may be asymmetrical, with generally more limited upside for returns
Asset Allocation Considerations • Less reliable relative asset performance patterns
generally merit smaller cyclical tilts • Any stabilization in China may provide support to risk
assets • The potential for upside inflation surprises is not
priced in
U.S. recession risks remain low, but late-cycle signals
have risen
Global macro environment stabilizing
Pace of Fed tightening will likely be gradual
Fed: Federal Reserve. Source: Market Assessment Statement of Global Asset Allocation’s Business Cycle Board, Fidelity Investments, as of 3/31/16. 19
Seco
nd Q
uarte
r 201
6 Q
UAR
TER
LY M
ARKE
T U
PDAT
E
Theme: Time to Pay Attention to Inflation?
T
HEM
E
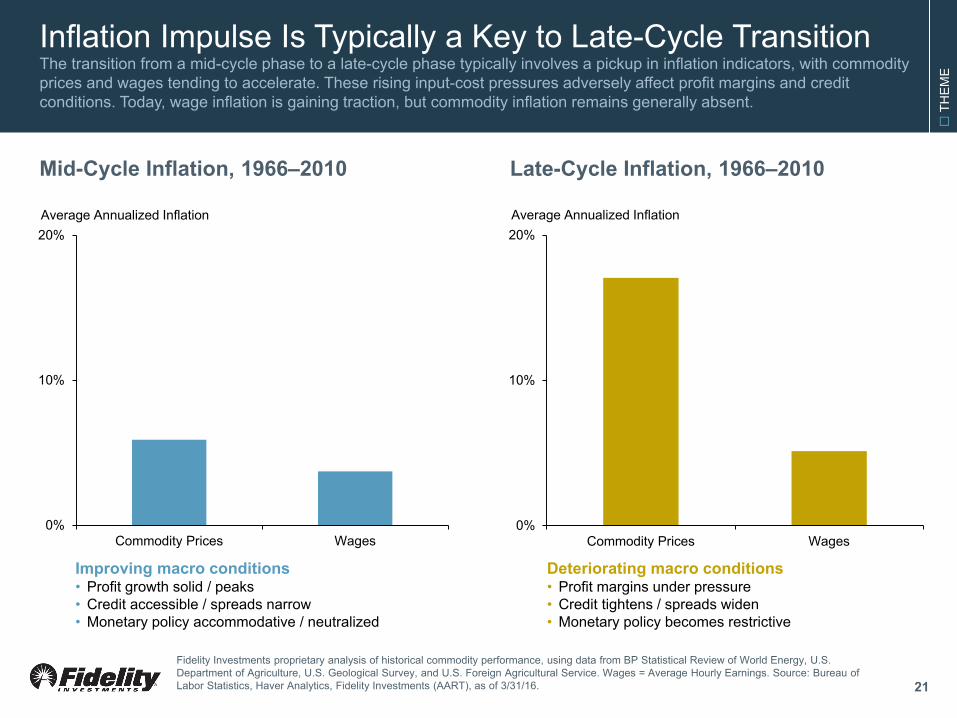
Inflation Impulse Is Typically a Key to Late-Cycle Transition The transition from a mid-cycle phase to a late-cycle phase typically involves a pickup in inflation indicators, with commodity prices and wages tending to accelerate. These rising input-cost pressures adversely affect profit margins and credit conditions. Today, wage inflation is gaining traction, but commodity inflation remains generally absent.
21
Mid-Cycle Inflation, 1966–2010
Improving macro conditions • Profit growth solid / peaks • Credit accessible / spreads narrow • Monetary policy accommodative / neutralized
Late-Cycle Inflation, 1966–2010
Deteriorating macro conditions • Profit margins under pressure • Credit tightens / spreads widen • Monetary policy becomes restrictive
Fidelity Investments proprietary analysis of historical commodity performance, using data from BP Statistical Review of World Energy, U.S. Department of Agriculture, U.S. Geological Survey, and U.S. Foreign Agricultural Service. Wages = Average Hourly Earnings. Source: Bureau of Labor Statistics, Haver Analytics, Fidelity Investments (AART), as of 3/31/16.
Average Annualized Inflation Average Annualized Inflation
0%
10%
20%
Commodity Prices Wages0%
10%
20%
Commodity Prices Wages
T
HEM
E
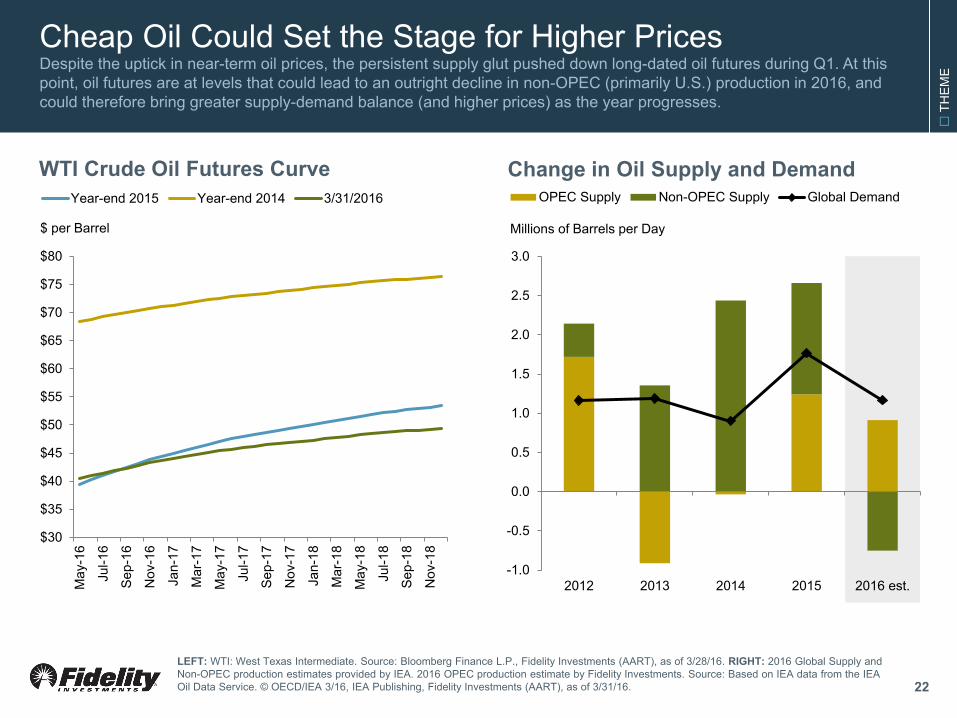
Cheap Oil Could Set the Stage for Higher Prices Despite the uptick in near-term oil prices, the persistent supply glut pushed down long-dated oil futures during Q1. At this point, oil futures are at levels that could lead to an outright decline in non-OPEC (primarily U.S.) production in 2016, and could therefore bring greater supply-demand balance (and higher prices) as the year progresses.
22
$30
$35
$40
$45
$50
$55
$60
$65
$70
$75
$80
May
-16
Jul-1
6
Sep-
16
Nov
-16
Jan-
17
Mar
-17
May
-17
Jul-1
7
Sep-
17
Nov
-17
Jan-
18
Mar
-18
May
-18
Jul-1
8
Sep-
18
Nov
-18
Year-end 2015 Year-end 2014 3/31/2016
$ per Barrel
Change in Oil Supply and Demand WTI Crude Oil Futures Curve
LEFT: WTI: West Texas Intermediate. Source: Bloomberg Finance L.P., Fidelity Investments (AART), as of 3/28/16. RIGHT: 2016 Global Supply and Non-OPEC production estimates provided by IEA. 2016 OPEC production estimate by Fidelity Investments. Source: Based on IEA data from the IEA Oil Data Service. © OECD/IEA 3/16, IEA Publishing, Fidelity Investments (AART), as of 3/31/16.
-1.0
-0.5
0.0
0.5
1.0
1.5
2.0
2.5
3.0
2012 2013 2014 2015 2016 est.
OPEC Supply Non-OPEC Supply Global Demand
Millions of Barrels per Day
T
HEM
E
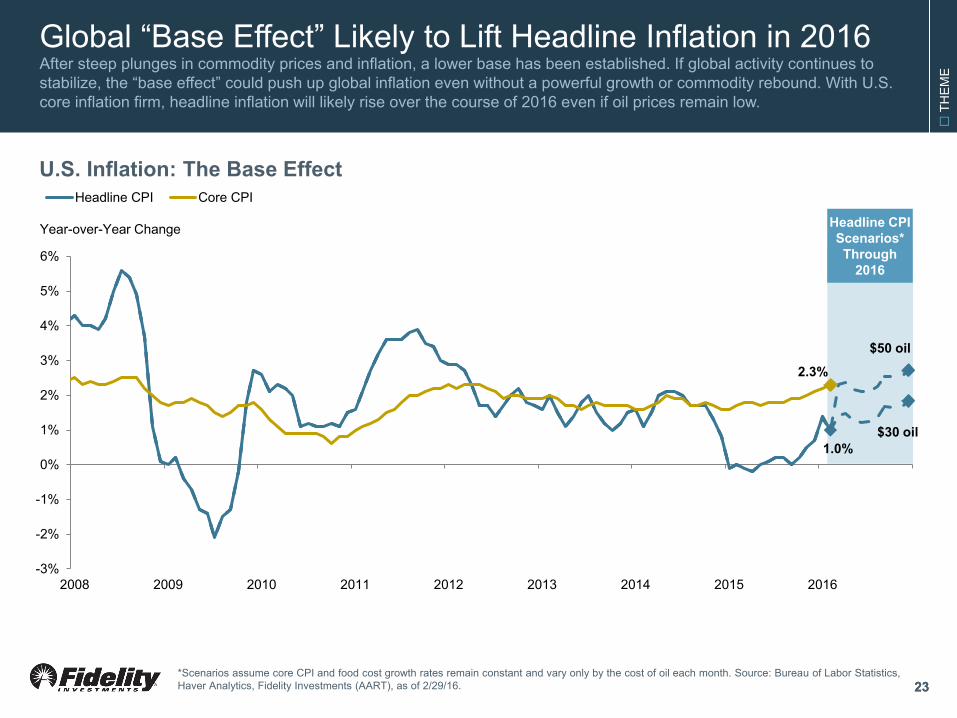
Global “Base Effect” Likely to Lift Headline Inflation in 2016 After steep plunges in commodity prices and inflation, a lower base has been established. If global activity continues to stabilize, the “base effect” could push up global inflation even without a powerful growth or commodity rebound. With U.S. core inflation firm, headline inflation will likely rise over the course of 2016 even if oil prices remain low.
23 23 *Scenarios assume core CPI and food cost growth rates remain constant and vary only by the cost of oil each month. Source: Bureau of Labor Statistics, Haver Analytics, Fidelity Investments (AART), as of 2/29/16.
1.0%
2.3%
-3%
-2%
-1%
0%
1%
2%
3%
4%
5%
6%
2008 2009 2010 2011 2012 2013 2014 2015 2016
Headline CPI Core CPI
$50 oil
$30 oil
Headline CPI Scenarios* Through
2016
U.S. Inflation: The Base Effect
Year-over-Year Change
T
HEM
E
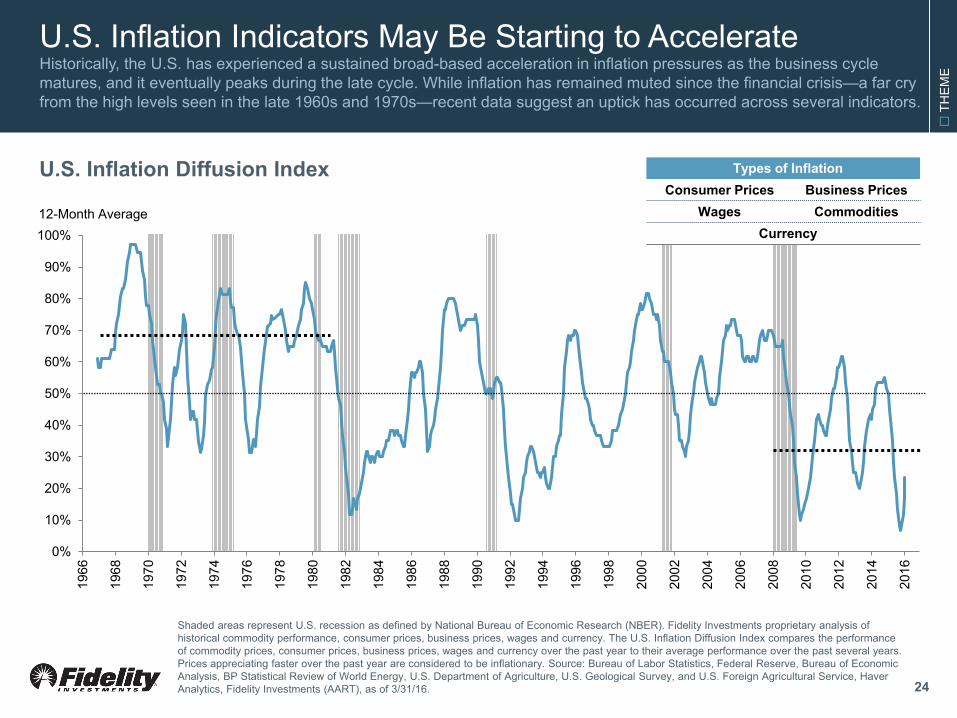
U.S. Inflation Indicators May Be Starting to Accelerate Historically, the U.S. has experienced a sustained broad-based acceleration in inflation pressures as the business cycle matures, and it eventually peaks during the late cycle. While inflation has remained muted since the financial crisis—a far cry from the high levels seen in the late 1960s and 1970s—recent data suggest an uptick has occurred across several indicators.
24
0
0
0
0
0
0
0
0
0
0
1
0%
10%
20%
30%
40%
50%
60%
70%
80%
90%
100%
1966
1968
1970
1972
1974
1976
1978
1980
1982
1984
1986
1988
1990
1992
1994
1996
1998
2000
2002
2004
2006
2008
2010
2012
2014
2016
U.S. Inflation Diffusion Index
Shaded areas represent U.S. recession as defined by National Bureau of Economic Research (NBER). Fidelity Investments proprietary analysis of historical commodity performance, consumer prices, business prices, wages and currency. The U.S. Inflation Diffusion Index compares the performance of commodity prices, consumer prices, business prices, wages and currency over the past year to their average performance over the past several years. Prices appreciating faster over the past year are considered to be inflationary. Source: Bureau of Labor Statistics, Federal Reserve, Bureau of Economic Analysis, BP Statistical Review of World Energy, U.S. Department of Agriculture, U.S. Geological Survey, and U.S. Foreign Agricultural Service, Haver Analytics, Fidelity Investments (AART), as of 3/31/16.
Types of Inflation Consumer Prices Business Prices
Wages Commodities Currency
12-Month Average
T
HEM
E
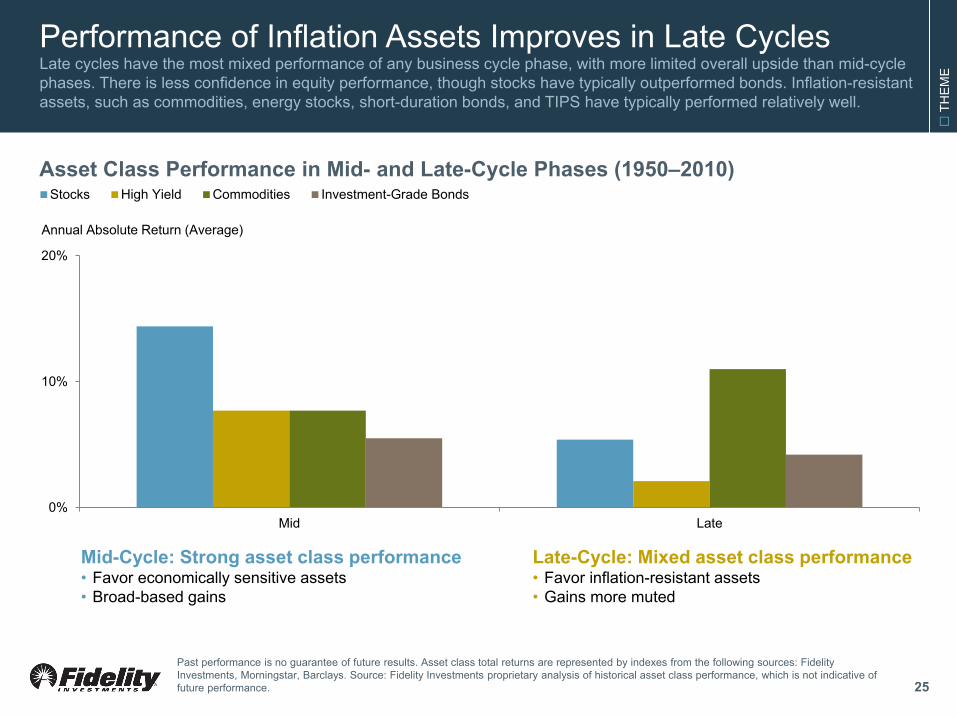
Performance of Inflation Assets Improves in Late Cycles
25
Past performance is no guarantee of future results. Asset class total returns are represented by indexes from the following sources: Fidelity Investments, Morningstar, Barclays. Source: Fidelity Investments proprietary analysis of historical asset class performance, which is not indicative of future performance.
0%
10%
20%
Mid Late
Stocks High Yield Commodities Investment-Grade Bonds
Asset Class Performance in Mid- and Late-Cycle Phases (1950–2010)
Mid-Cycle: Strong asset class performance • Favor economically sensitive assets • Broad-based gains
Late-Cycle: Mixed asset class performance • Favor inflation-resistant assets • Gains more muted
Annual Absolute Return (Average)
Late cycles have the most mixed performance of any business cycle phase, with more limited overall upside than mid-cycle phases. There is less confidence in equity performance, though stocks have typically outperformed bonds. Inflation-resistant assets, such as commodities, energy stocks, short-duration bonds, and TIPS have typically performed relatively well.
Seco
nd Q
uarte
r 201
6 Q
UAR
TER
LY M
ARKE
T U
PDAT
E
U.S. Equity Markets
U
.S. E
QU
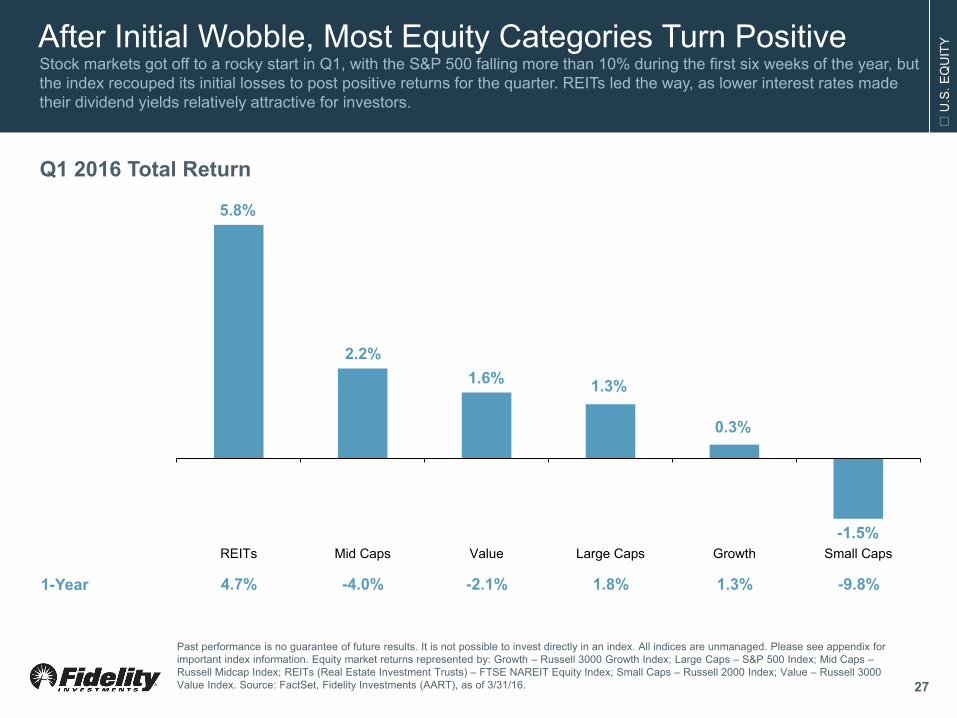
ITY After Initial Wobble, Most Equity Categories Turn Positive
Stock markets got off to a rocky start in Q1, with the S&P 500 falling more than 10% during the first six weeks of the year, but the index recouped its initial losses to post positive returns for the quarter. REITs led the way, as lower interest rates made their dividend yields relatively attractive for investors.
Q1 2016 Total Return
1-Year 4.7% -4.0% -2.1% 1.8% 1.3% -9.8%
5.8%
2.2% 1.6% 1.3%
0.3%
-1.5% REITs Mid Caps Value Large Caps Growth Small Caps
Past performance is no guarantee of future results. It is not possible to invest directly in an index. All indices are unmanaged. Please see appendix for important index information. Equity market returns represented by: Growth – Russell 3000 Growth Index; Large Caps – S&P 500 Index; Mid Caps – Russell Midcap Index; REITs (Real Estate Investment Trusts) – FTSE NAREIT Equity Index; Small Caps – Russell 2000 Index; Value – Russell 3000 Value Index. Source: FactSet, Fidelity Investments (AART), as of 3/31/16. 27
U
.S. E
QU
ITY
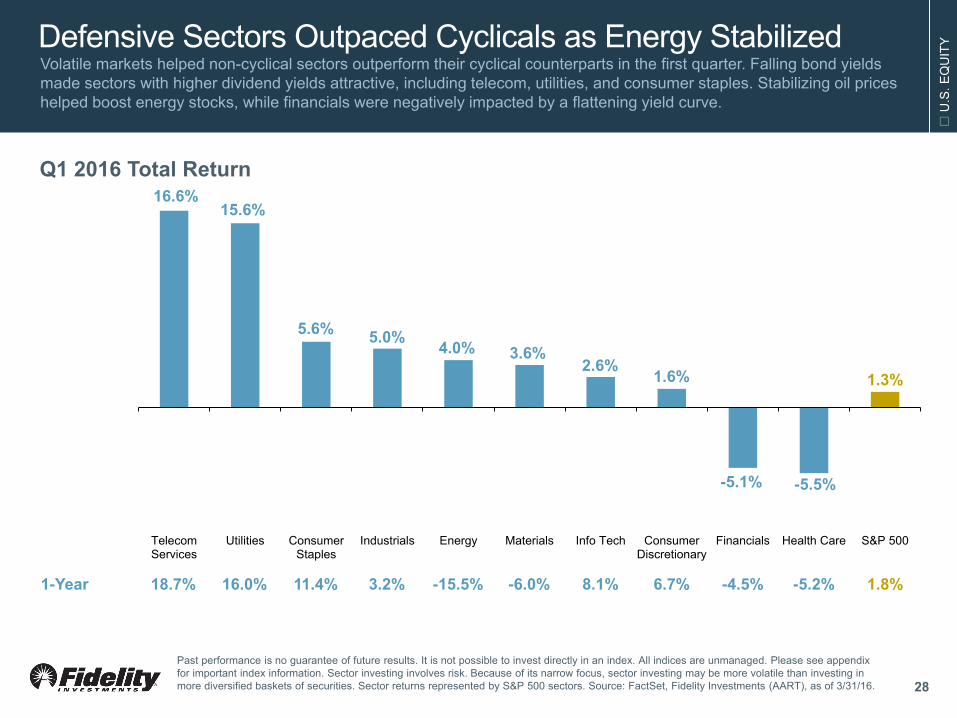
1-Year 18.7% 16.0% 11.4% 3.2% -15.5% -6.0% 8.1% 6.7% -4.5% -5.2% 1.8%
Defensive Sectors Outpaced Cyclicals as Energy Stabilized Volatile markets helped non-cyclical sectors outperform their cyclical counterparts in the first quarter. Falling bond yields made sectors with higher dividend yields attractive, including telecom, utilities, and consumer staples. Stabilizing oil prices helped boost energy stocks, while financials were negatively impacted by a flattening yield curve.
Q1 2016 Total Return 16.6%
15.6%
5.6% 5.0% 4.0% 3.6% 2.6% 1.6%
-5.1% -5.5%
1.3%
TelecomServices
Utilities ConsumerStaples
Industrials Energy Materials Info Tech ConsumerDiscretionary
Financials Health Care S&P 500
Past performance is no guarantee of future results. It is not possible to invest directly in an index. All indices are unmanaged. Please see appendix for important index information. Sector investing involves risk. Because of its narrow focus, sector investing may be more volatile than investing in more diversified baskets of securities. Sector returns represented by S&P 500 sectors. Source: FactSet, Fidelity Investments (AART), as of 3/31/16. 28
U
.S. E
QU
ITY
-8%
-7%
-6%
-5%
-4%
-3%
-2%
-1%
0%
1%
2%
3%
4%
0%
20%
40%
60%
80%
100%
120%
1999
2000
2001
2002
2003
2004
2005
2006
2007
2008
2009
2010
2011
2012
2013
2014
2015
Buybacks as % of Operating Earnings Net Buyback Contribution to EPS
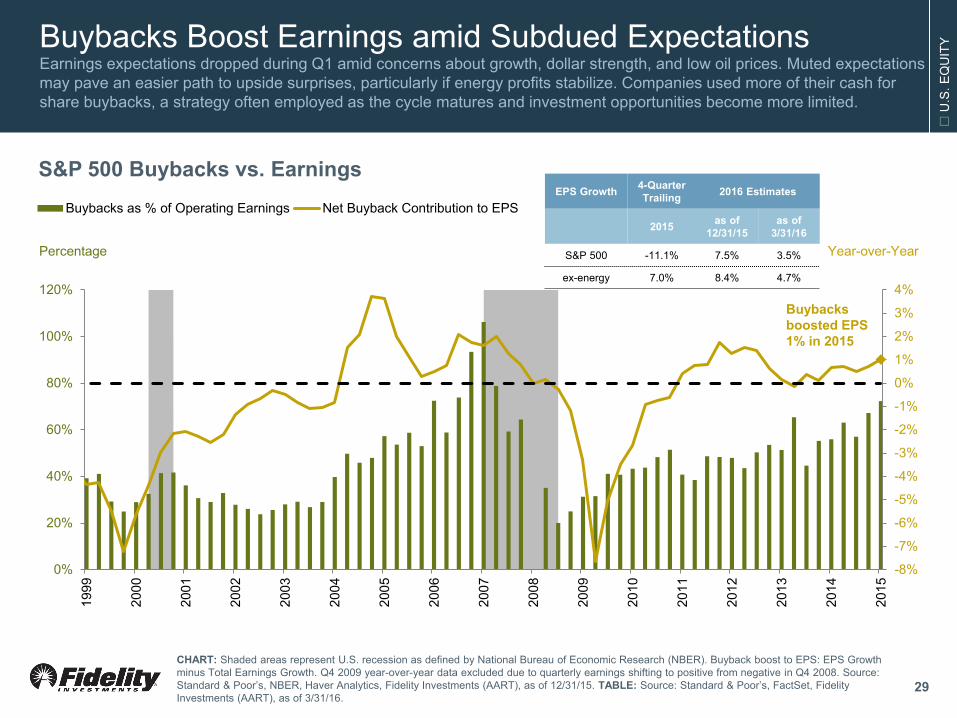
Buybacks Boost Earnings amid Subdued Expectations Earnings expectations dropped during Q1 amid concerns about growth, dollar strength, and low oil prices. Muted expectations may pave an easier path to upside surprises, particularly if energy profits stabilize. Companies used more of their cash for share buybacks, a strategy often employed as the cycle matures and investment opportunities become more limited.
29
S&P 500 Buybacks vs. Earnings
Percentage Year-over-Year
CHART: Shaded areas represent U.S. recession as defined by National Bureau of Economic Research (NBER). Buyback boost to EPS: EPS Growth minus Total Earnings Growth. Q4 2009 year-over-year data excluded due to quarterly earnings shifting to positive from negative in Q4 2008. Source: Standard & Poor’s, NBER, Haver Analytics, Fidelity Investments (AART), as of 12/31/15. TABLE: Source: Standard & Poor’s, FactSet, Fidelity Investments (AART), as of 3/31/16.
Buybacks boosted EPS 1% in 2015
EPS Growth 4-Quarter Trailing 2016 Estimates
2015 as of 12/31/15
as of 3/31/16
S&P 500 -11.1% 7.5% 3.5%
ex-energy 7.0% 8.4% 4.7%
U
.S. E
QU
ITY
0%
20%
40%
60%
80%
100%
0%
4%
8%
12%
16%
TEC ENE HTH MAT CNS
Geometric Average Median Monthly Difference Hit Rate
Mid Cycle Late Cycle Recession
Sector Considerations: Think Through the Cycle A disciplined business cycle approach to sector allocation can produce active returns by favoring industries that may benefit from cyclical trends. While the mid-cycle phase generally offers more limited opportunities for relative sector outperformance, inflation-sensitive sectors historically have provided consistently solid relative performance during the late-cycle phase.
Business Cycle Approach to Sectors
Past performance is no guarantee of future results. Sectors as defined by GICS. LEFT: Unshaded (white) portions above suggest no clear pattern of over- or underperformance vs. broader market. Double +/– signs indicate that the sector is showing a consistent signal across all three metrics: full-phase average performance, median monthly difference, and cycle hit rate. A single +/– indicates a mixed or less consistent signal. Source: The Business Cycle Approach to Sector Investing, Fidelity Investments (AART), September 2014. RIGHT: This chart highlights the best performing sectors in each of the mid-cycle, late-cycle, and recession phases, with an emphasis on the best performing sectors of the late-cycle given the recent rise in late-cycle indicators in the U.S. TEC: Technology; ENE: energy; HTH: health care; MAT: materials. CNS: consumer staples. Hit rate calculates the frequency of a sector outperforming the broader equity market over each business cycle phase since 1962. Source: Haver Analytics, Fidelity Investments (AART), as of 3/31/16. 30
Sector Early Mid Late Recession
Financials + - Consumer
Discretionary ++ --
Technology + + -- --
Industrials ++ + --
Materials -- ++ - Consumer
Staples - + ++
Health Care - ++ ++
Energy -- ++
Telecom -- ++
Utilities -- - + ++
Magnitude of Sector Outperformance (1962–2010)
Annualized Relative Performance Cycle Hit Rate
U
.S. E
QU
ITY
11x
13x
16x 15x
14x
11x
8x
4x
8x
12x
16x
<0 0-1 1-2 2-3 3-5 5-7 7+CPI (Year-over-Year) %
Price/5-Year Peak Real Earnings Ratio (average)
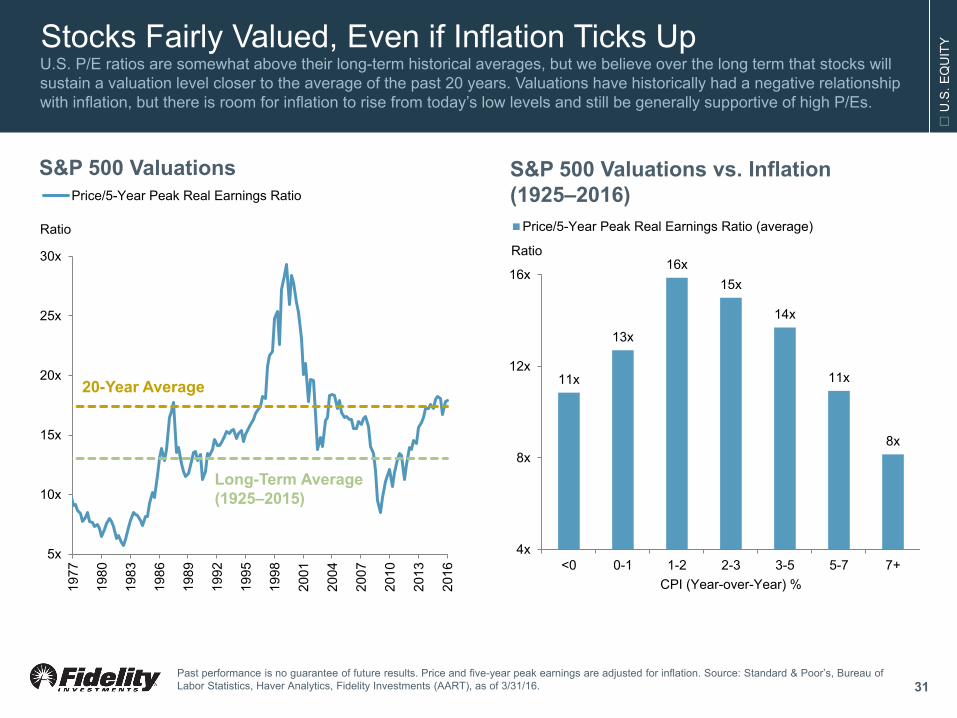
Stocks Fairly Valued, Even if Inflation Ticks Up U.S. P/E ratios are somewhat above their long-term historical averages, but we believe over the long term that stocks will sustain a valuation level closer to the average of the past 20 years. Valuations have historically had a negative relationship with inflation, but there is room for inflation to rise from today’s low levels and still be generally supportive of high P/Es.
31
S&P 500 Valuations vs. Inflation (1925–2016)
Past performance is no guarantee of future results. Price and five-year peak earnings are adjusted for inflation. Source: Standard & Poor’s, Bureau of Labor Statistics, Haver Analytics, Fidelity Investments (AART), as of 3/31/16.
Ratio
5x
10x
15x
20x
25x
30x
1977
1980
1983
1986
1989
1992
1995
1998
2001
2004
2007
2010
2013
2016
Price/5-Year Peak Real Earnings Ratio
S&P 500 Valuations
Ratio
20-Year Average
Long-Term Average (1925–2015)
Seco
nd Q
uarte
r 201
6 Q
UAR
TER
LY M
ARKE
T U
PDAT
E
International Equity Markets & Global Assets
IN
TER
NAT
ION
AL
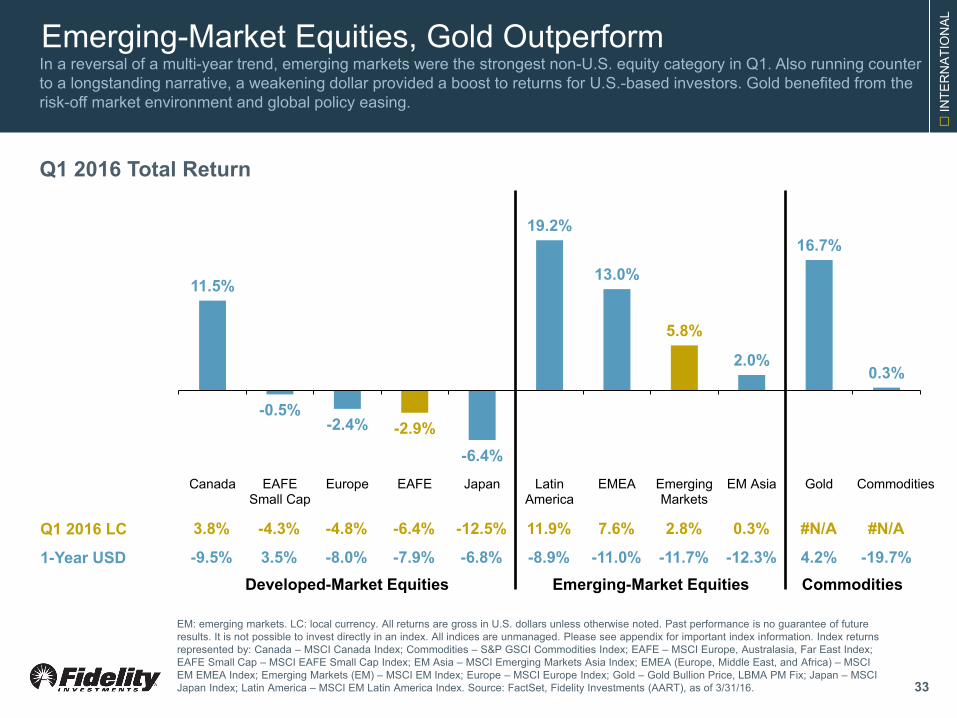
11.5%
-0.5% -2.4% -2.9%
-6.4%
19.2%
13.0%
5.8%
2.0%
16.7%
0.3%
Canada EAFESmall Cap
Europe EAFE Japan LatinAmerica
EMEA EmergingMarkets
EM Asia Gold Commodities
Emerging-Market Equities, Gold Outperform In a reversal of a multi-year trend, emerging markets were the strongest non-U.S. equity category in Q1. Also running counter to a longstanding narrative, a weakening dollar provided a boost to returns for U.S.-based investors. Gold benefited from the risk-off market environment and global policy easing.
Q1 2016 Total Return
Q1 2016 LC 3.8% -4.3% -4.8% -6.4% -12.5% 11.9% 7.6% 2.8% 0.3% #N/A #N/A
1-Year USD -9.5% 3.5% -8.0% -7.9% -6.8% -8.9% -11.0% -11.7% -12.3% 4.2% -19.7%
EM: emerging markets. LC: local currency. All returns are gross in U.S. dollars unless otherwise noted. Past performance is no guarantee of future results. It is not possible to invest directly in an index. All indices are unmanaged. Please see appendix for important index information. Index returns represented by: Canada – MSCI Canada Index; Commodities – S&P GSCI Commodities Index; EAFE – MSCI Europe, Australasia, Far East Index; EAFE Small Cap – MSCI EAFE Small Cap Index; EM Asia – MSCI Emerging Markets Asia Index; EMEA (Europe, Middle East, and Africa) – MSCI EM EMEA Index; Emerging Markets (EM) – MSCI EM Index; Europe – MSCI Europe Index; Gold – Gold Bullion Price, LBMA PM Fix; Japan – MSCI Japan Index; Latin America – MSCI EM Latin America Index. Source: FactSet, Fidelity Investments (AART), as of 3/31/16.
Developed-Market Equities Emerging-Market Equities Commodities
33
IN
TER
NAT
ION
AL
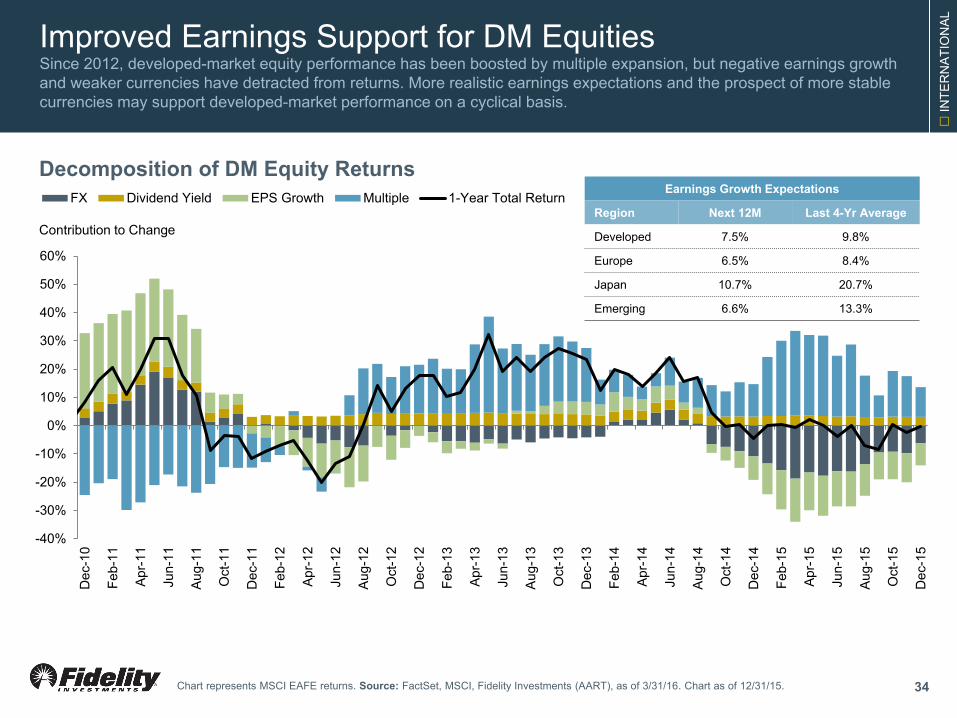
Improved Earnings Support for DM Equities Since 2012, developed-market equity performance has been boosted by multiple expansion, but negative earnings growth and weaker currencies have detracted from returns. More realistic earnings expectations and the prospect of more stable currencies may support developed-market performance on a cyclical basis.
34
-40%
-30%
-20%
-10%
0%
10%
20%
30%
40%
50%
60%
Dec
-10
Feb-
11
Apr-1
1
Jun-
11
Aug-
11
Oct
-11
Dec
-11
Feb-
12
Apr-1
2
Jun-
12
Aug-
12
Oct
-12
Dec
-12
Feb-
13
Apr-1
3
Jun-
13
Aug-
13
Oct
-13
Dec
-13
Feb-
14
Apr-1
4
Jun-
14
Aug-
14
Oct
-14
Dec
-14
Feb-
15
Apr-1
5
Jun-
15
Aug-
15
Oct
-15
Dec
-15
FX Dividend Yield EPS Growth Multiple 1-Year Total ReturnEarnings Growth Expectations
Region Next 12M Last 4-Yr Average
Developed 7.5% 9.8%
Europe 6.5% 8.4%
Japan 10.7% 20.7%
Emerging 6.6% 13.3%
Contribution to Change
Decomposition of DM Equity Returns
Chart represents MSCI EAFE returns. Source: FactSet, MSCI, Fidelity Investments (AART), as of 3/31/16. Chart as of 12/31/15.
IN
TER
NAT
ION
AL
0
10
20
30
40
50
60
Rus
sia
Braz
ilSp
ain
Chi
naTu
rkey
Italy
Sout
h Ko
rea
U.K
.G
erm
any
Aust
ralia
Fran
ceJa
pan
Indo
nesi
aC
anad
aIn
dia
U.S
.M
exic
oPh
ilippi
nes
March 2016
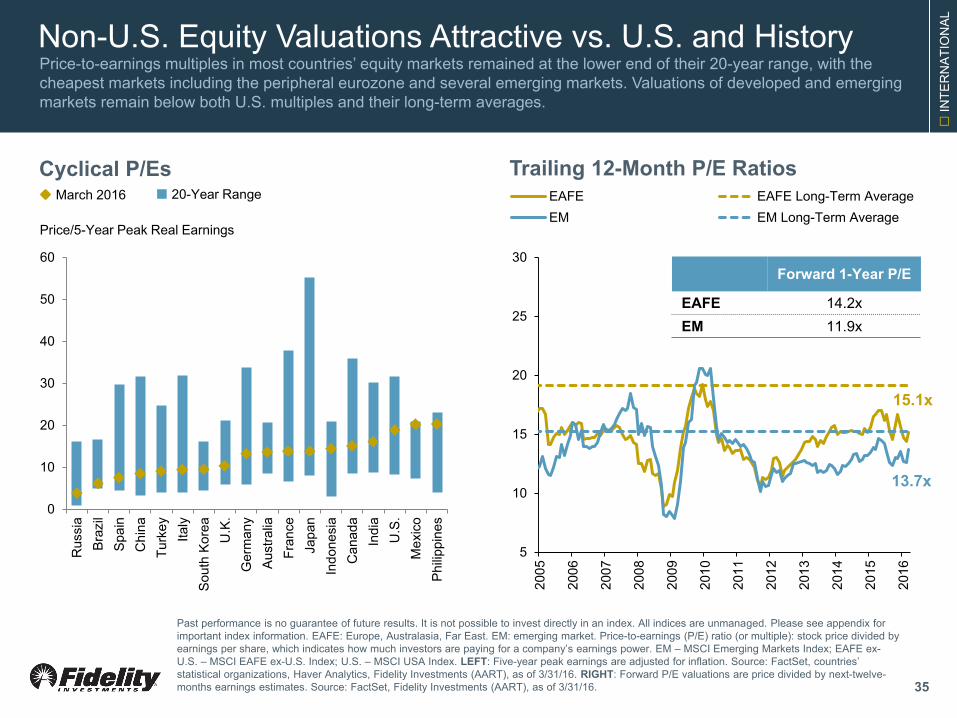
Non-U.S. Equity Valuations Attractive vs. U.S. and History Price-to-earnings multiples in most countries’ equity markets remained at the lower end of their 20-year range, with the cheapest markets including the peripheral eurozone and several emerging markets. Valuations of developed and emerging markets remain below both U.S. multiples and their long-term averages.
35
Cyclical P/Es
Past performance is no guarantee of future results. It is not possible to invest directly in an index. All indices are unmanaged. Please see appendix for important index information. EAFE: Europe, Australasia, Far East. EM: emerging market. Price-to-earnings (P/E) ratio (or multiple): stock price divided by earnings per share, which indicates how much investors are paying for a company’s earnings power. EM – MSCI Emerging Markets Index; EAFE ex-U.S. – MSCI EAFE ex-U.S. Index; U.S. – MSCI USA Index. LEFT: Five-year peak earnings are adjusted for inflation. Source: FactSet, countries’ statistical organizations, Haver Analytics, Fidelity Investments (AART), as of 3/31/16. RIGHT: Forward P/E valuations are price divided by next-twelve-months earnings estimates. Source: FactSet, Fidelity Investments (AART), as of 3/31/16.
15.1x
13.7x
5
10
15
20
25
30
2005
2006
2007
2008
2009
2010
2011
2012
2013
2014
2015
2016
EAFE EAFE Long-Term AverageEM EM Long-Term Average
Forward 1-Year P/E
EAFE 14.2x EM 11.9x
Trailing 12-Month P/E Ratios 20-Year Range
Price/5-Year Peak Real Earnings
IN
TER
NAT
ION
AL
0 5 10 15 20 25
South Korea
Indonesia
Canada
Russia
France
U.K.
Germany
Brazil
Japan
India
China
U.S.
Trillions (USD)
GDP in 2014 Projected GDP Growth by 2034
0%
1%
2%
3%
4%
5%
6%
Japa
nIta
lyG
erm
any
Net
herla
nds
Spai
nFr
ance
Aust
ralia
U.K
.Sw
eden
Can
ada
U.S
.R
ussi
aSo
uth
Kore
aTh
aila
ndSo
uth
Afric
aM
exic
oBr
azil
Turk
eyPe
ruM
alay
sia
Chi
naC
olom
bia
Indo
nesi
aPh
ilippi
nes
Indi
a
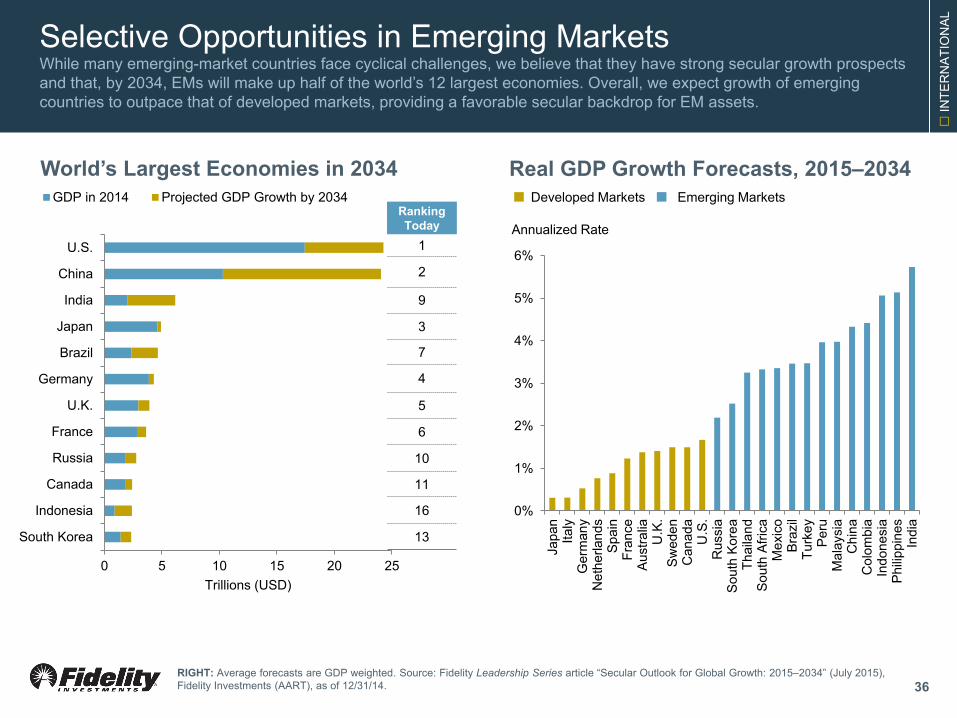
Selective Opportunities in Emerging Markets
36
Annualized Rate
Real GDP Growth Forecasts, 2015–2034
RIGHT: Average forecasts are GDP weighted. Source: Fidelity Leadership Series article “Secular Outlook for Global Growth: 2015–2034” (July 2015), Fidelity Investments (AART), as of 12/31/14.
While many emerging-market countries face cyclical challenges, we believe that they have strong secular growth prospects and that, by 2034, EMs will make up half of the world’s 12 largest economies. Overall, we expect growth of emerging countries to outpace that of developed markets, providing a favorable secular backdrop for EM assets.
Ranking Today
1
2
9
3
7
4
5
6
10
11
16
13
World’s Largest Economies in 2034 Developed Markets Emerging Markets
IN
TER
NAT
ION
AL
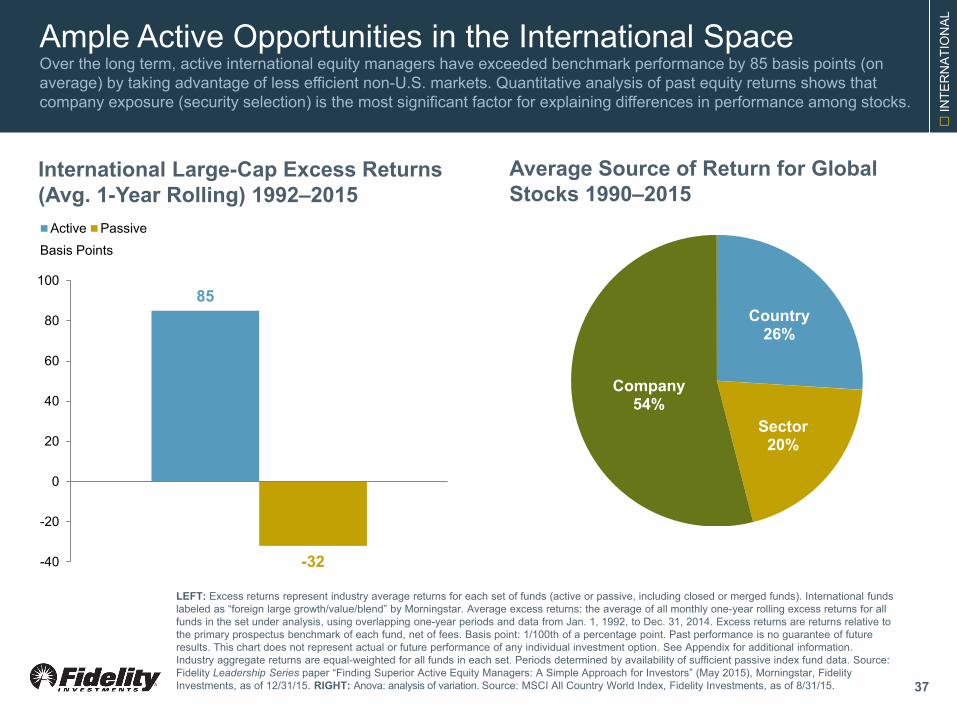
Ample Active Opportunities in the International Space Over the long term, active international equity managers have exceeded benchmark performance by 85 basis points (on average) by taking advantage of less efficient non-U.S. markets. Quantitative analysis of past equity returns shows that company exposure (security selection) is the most significant factor for explaining differences in performance among stocks.
37
Average Source of Return for Global Stocks 1990–2015
LEFT: Excess returns represent industry average returns for each set of funds (active or passive, including closed or merged funds). International funds labeled as “foreign large growth/value/blend” by Morningstar. Average excess returns: the average of all monthly one-year rolling excess returns for all funds in the set under analysis, using overlapping one-year periods and data from Jan. 1, 1992, to Dec. 31, 2014. Excess returns are returns relative to the primary prospectus benchmark of each fund, net of fees. Basis point: 1/100th of a percentage point. Past performance is no guarantee of future results. This chart does not represent actual or future performance of any individual investment option. See Appendix for additional information. Industry aggregate returns are equal-weighted for all funds in each set. Periods determined by availability of sufficient passive index fund data. Source: Fidelity Leadership Series paper “Finding Superior Active Equity Managers: A Simple Approach for Investors” (May 2015), Morningstar, Fidelity Investments, as of 12/31/15. RIGHT: Anova: analysis of variation. Source: MSCI All Country World Index, Fidelity Investments, as of 8/31/15.
85
-32 -40
-20
0
20
40
60
80
100
Active Passive
International Large-Cap Excess Returns (Avg. 1-Year Rolling) 1992–2015
Basis Points
Country 26%
Sector 20%
Company 54%
Seco
nd Q
uarte
r 201
6 Q
UAR
TER
LY M
ARKE
T U
PDAT
E
Fixed-Income Markets
F
IXED
INC
OM
E
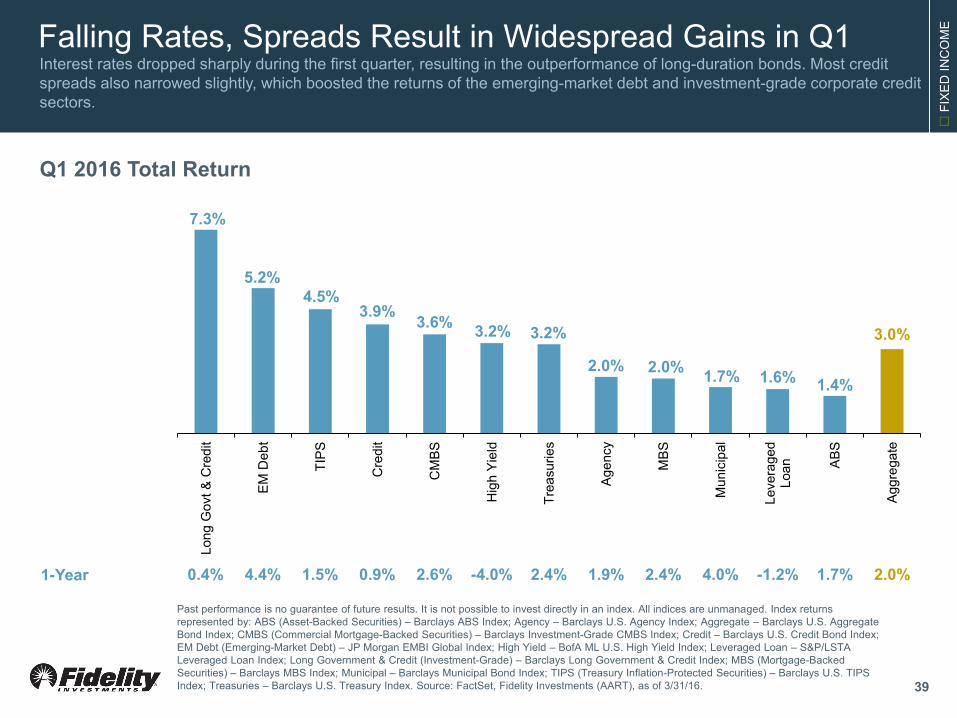
Falling Rates, Spreads Result in Widespread Gains in Q1 Interest rates dropped sharply during the first quarter, resulting in the outperformance of long-duration bonds. Most credit spreads also narrowed slightly, which boosted the returns of the emerging-market debt and investment-grade corporate credit sectors.
Q1 2016 Total Return
1-Year 0.4% 4.4% 1.5% 0.9% 2.6% -4.0% 2.4% 1.9% 2.4% 4.0% -1.2% 1.7% 2.0%
7.3%
5.2% 4.5%
3.9% 3.6% 3.2% 3.2%
2.0% 2.0% 1.7% 1.6% 1.4%
3.0%
Long
Gov
t & C
redi
t
EM D
ebt
TIPS
Cre
dit
CM
BS
Hig
h Yi
eld
Trea
surie
s
Agen
cy
MBS
Mun
icip
al
Leve
rage
dLo
an ABS
Aggr
egat
e
Past performance is no guarantee of future results. It is not possible to invest directly in an index. All indices are unmanaged. Index returns represented by: ABS (Asset-Backed Securities) – Barclays ABS Index; Agency – Barclays U.S. Agency Index; Aggregate – Barclays U.S. Aggregate Bond Index; CMBS (Commercial Mortgage-Backed Securities) – Barclays Investment-Grade CMBS Index; Credit – Barclays U.S. Credit Bond Index; EM Debt (Emerging-Market Debt) – JP Morgan EMBI Global Index; High Yield – BofA ML U.S. High Yield Index; Leveraged Loan – S&P/LSTA Leveraged Loan Index; Long Government & Credit (Investment-Grade) – Barclays Long Government & Credit Index; MBS (Mortgage-Backed Securities) – Barclays MBS Index; Municipal – Barclays Municipal Bond Index; TIPS (Treasury Inflation-Protected Securities) – Barclays U.S. TIPS Index; Treasuries – Barclays U.S. Treasury Index. Source: FactSet, Fidelity Investments (AART), as of 3/31/16. 39
F
IXED
INC
OM
E
10
4 18
15
50
22
45
8
43
59
69 66
0%
10%
20%
30%
40%
50%
60%
70%
80%
90%
100%
0%
1%
2%
3%
4%
5%
6%
7%
8%
9%
U.S. AggregateBond
MBS CMBS CorporateInvestment Grade
CorporateHigh Yield
Emerging-MarketDebt
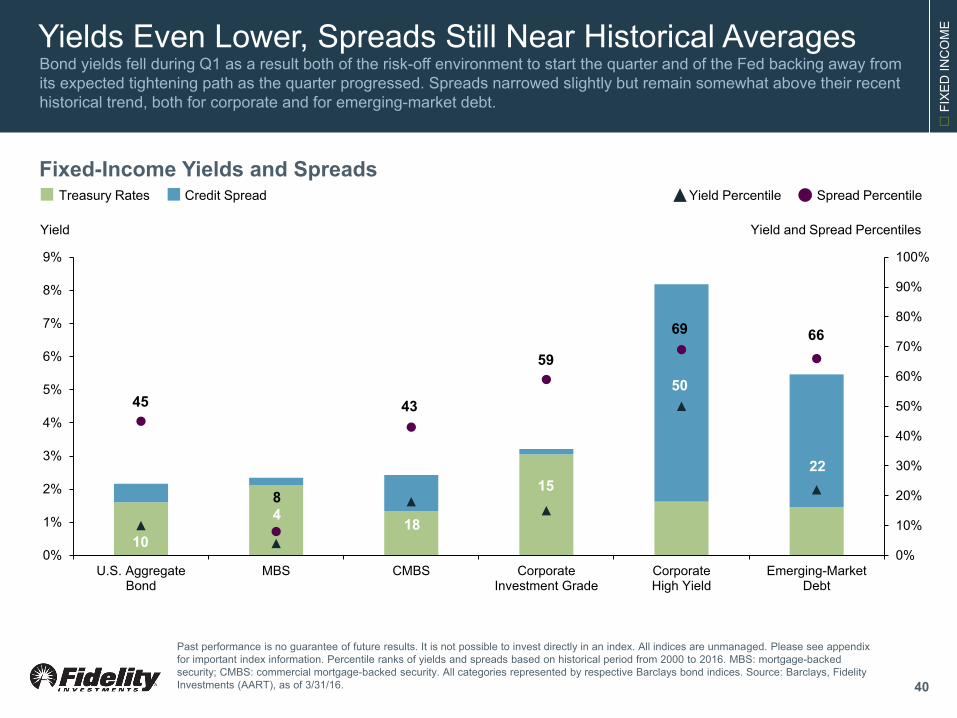
Yields Even Lower, Spreads Still Near Historical Averages Bond yields fell during Q1 as a result both of the risk-off environment to start the quarter and of the Fed backing away from its expected tightening path as the quarter progressed. Spreads narrowed slightly but remain somewhat above their recent historical trend, both for corporate and for emerging-market debt.
Past performance is no guarantee of future results. It is not possible to invest directly in an index. All indices are unmanaged. Please see appendix for important index information. Percentile ranks of yields and spreads based on historical period from 2000 to 2016. MBS: mortgage-backed security; CMBS: commercial mortgage-backed security. All categories represented by respective Barclays bond indices. Source: Barclays, Fidelity Investments (AART), as of 3/31/16.
Fixed-Income Yields and Spreads
Yield Yield and Spread Percentiles
Credit Spread Treasury Rates Spread Percentile Yield Percentile
40
F
IXED
INC
OM
E
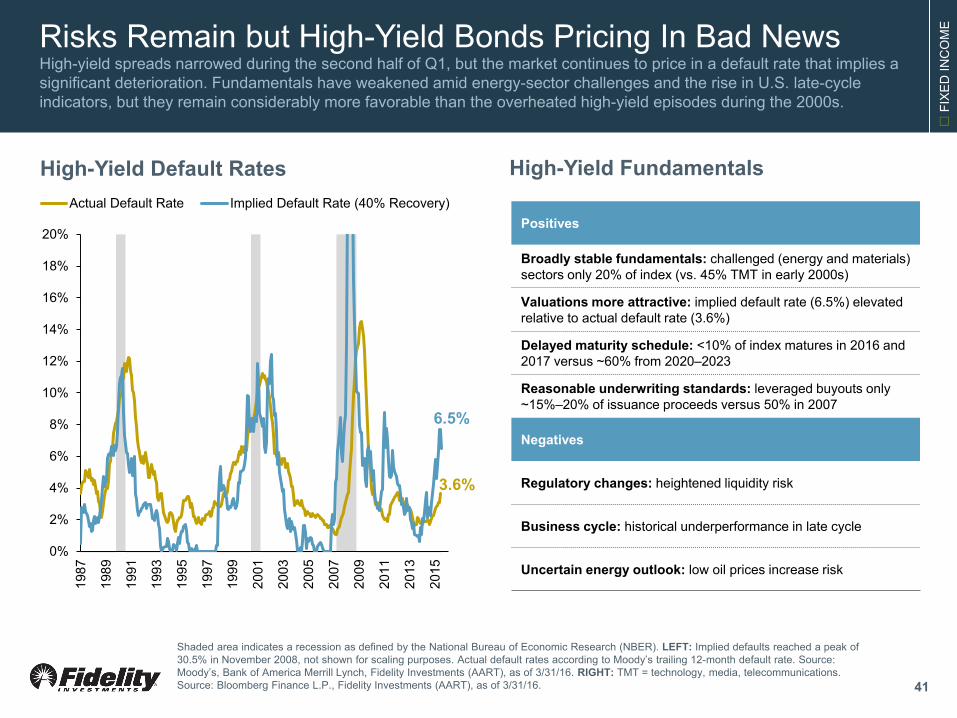
Risks Remain but High-Yield Bonds Pricing In Bad News High-yield spreads narrowed during the second half of Q1, but the market continues to price in a default rate that implies a significant deterioration. Fundamentals have weakened amid energy-sector challenges and the rise in U.S. late-cycle indicators, but they remain considerably more favorable than the overheated high-yield episodes during the 2000s.
41
3.6%
6.5%
0%
2%
4%
6%
8%
10%
12%
14%
16%
18%
20%
1987
1989
1991
1993
1995
1997
1999
2001
2003
2005
2007
2009
2011
2013
2015
Actual Default Rate Implied Default Rate (40% Recovery)
High-Yield Default Rates
Shaded area indicates a recession as defined by the National Bureau of Economic Research (NBER). LEFT: Implied defaults reached a peak of 30.5% in November 2008, not shown for scaling purposes. Actual default rates according to Moody’s trailing 12-month default rate. Source: Moody’s, Bank of America Merrill Lynch, Fidelity Investments (AART), as of 3/31/16. RIGHT: TMT = technology, media, telecommunications. Source: Bloomberg Finance L.P., Fidelity Investments (AART), as of 3/31/16.
Positives
Broadly stable fundamentals: challenged (energy and materials) sectors only 20% of index (vs. 45% TMT in early 2000s)
Valuations more attractive: implied default rate (6.5%) elevated relative to actual default rate (3.6%)
Delayed maturity schedule: <10% of index matures in 2016 and 2017 versus ~60% from 2020–2023
Reasonable underwriting standards: leveraged buyouts only ~15%–20% of issuance proceeds versus 50% in 2007
Negatives
Regulatory changes: heightened liquidity risk
Business cycle: historical underperformance in late cycle
Uncertain energy outlook: low oil prices increase risk
High-Yield Fundamentals
F
IXED
INC
OM
E
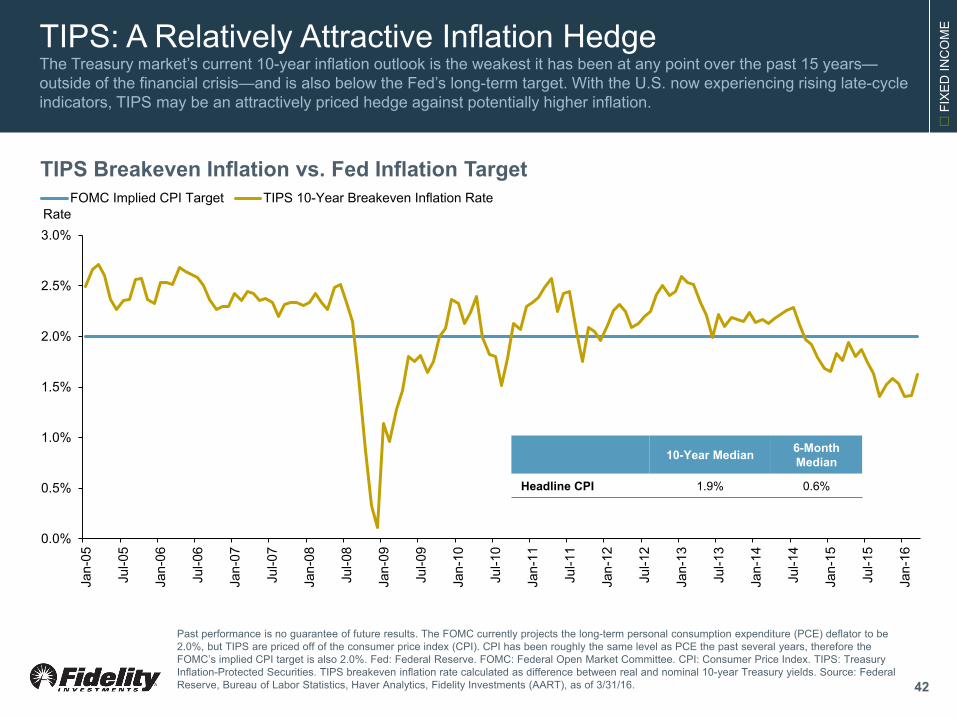
TIPS: A Relatively Attractive Inflation Hedge The Treasury market’s current 10-year inflation outlook is the weakest it has been at any point over the past 15 years—outside of the financial crisis—and is also below the Fed’s long-term target. With the U.S. now experiencing rising late-cycle indicators, TIPS may be an attractively priced hedge against potentially higher inflation.
42
0.0%
0.5%
1.0%
1.5%
2.0%
2.5%
3.0%
Jan-
05
Jul-0
5
Jan-
06
Jul-0
6
Jan-
07
Jul-0
7
Jan-
08
Jul-0
8
Jan-
09
Jul-0
9
Jan-
10
Jul-1
0
Jan-
11
Jul-1
1
Jan-
12
Jul-1
2
Jan-
13
Jul-1
3
Jan-
14
Jul-1
4
Jan-
15
Jul-1
5
Jan-
16
FOMC Implied CPI Target TIPS 10-Year Breakeven Inflation Rate
TIPS Breakeven Inflation vs. Fed Inflation Target
Past performance is no guarantee of future results. The FOMC currently projects the long-term personal consumption expenditure (PCE) deflator to be 2.0%, but TIPS are priced off of the consumer price index (CPI). CPI has been roughly the same level as PCE the past several years, therefore the FOMC’s implied CPI target is also 2.0%. Fed: Federal Reserve. FOMC: Federal Open Market Committee. CPI: Consumer Price Index. TIPS: Treasury Inflation-Protected Securities. TIPS breakeven inflation rate calculated as difference between real and nominal 10-year Treasury yields. Source: Federal Reserve, Bureau of Labor Statistics, Haver Analytics, Fidelity Investments (AART), as of 3/31/16.
10-Year Median 6-Month Median
Headline CPI 1.9% 0.6%
Rate

F
IXED
INC
OM
E
Benefits of Diversification in a Bond Portfolio Fixed-income strategies with designated allocations in both high-quality bonds and higher-yielding sectors have exhibited consistent downside protection. Both a “core-plus” and a “multi-sector” portfolio have generated fewer periods of negative returns than any individual bond sector, while providing lower magnitude of losses than lower-quality sectors.
43
0%
5%
10%
15%
20%
25%
30%
Cor
e Pl
us
Mul
ti Se
ctor
U.S
. Gov
t
Leve
rage
d Lo
ans
IG C
orpo
rate
s
EM D
ebt
Hig
h Yi
eld
Sove
reig
n
1-Year Negative Return Periods, 1998–2015
-35%
-30%
-25%
-20%
-15%
-10%
-5%
0%
U.S
. Gov
t
Cor
e Pl
us
IG C
orpo
rate
s
Sove
reig
n
Mul
ti Se
ctor
EM D
ebt
Leve
rage
d Lo
ans
Hig
h Yi
eld
% of Rolling Periods Total Return
Worst 1-Year Returns, 1998–2015
Past performance is no guarantee of future results. It is not possible to invest directly in an index. IG: investment grade. Index returns represented by: Emerging Market Debt – JPM EMBI Global Index; Foreign Developed-Country Bonds – Citigroup G-7 Non-USD Bond Index; Leveraged Loans – S&P/LSTA Performing Loan Index; U.S. Government – Barclays U.S. Government Index; U.S. High Yield – BofA ML High Yield Index; U.S. Investment Grade – Barclays U.S. Aggregate Bond Index. Source: Morningstar, Fidelity Investments (AART), as of 12/31/15.
Portfolio Description
Core Plus
80% U.S. Investment Grade 10% U.S. High Yield 5% Leveraged Loans 5% Emerging Market
Portfolio Description
Multi Sector
40% High Yield 25% U.S. Government 15% Emerging Market 15% Foreign DM Bonds
5% Leveraged Loans
Seco
nd Q
uarte
r 201
6 Q
UAR
TER
LY M
ARKE
T U
PDAT
E
Asset Allocation Themes
A
SS
ET
ALL
OC
ATI
ON
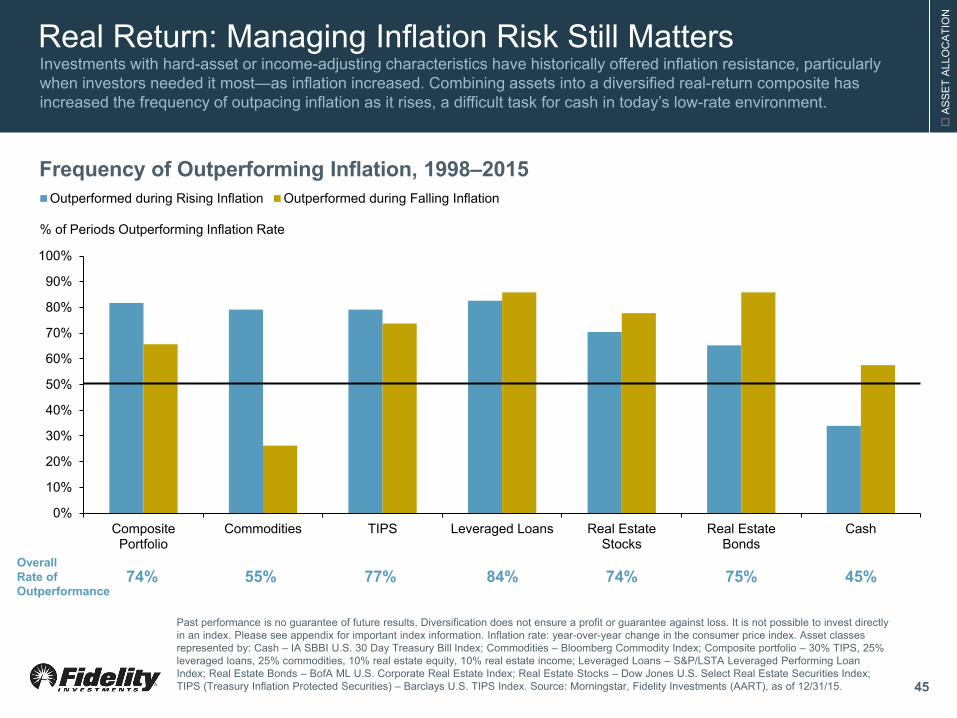
Real Return: Managing Inflation Risk Still Matters Investments with hard-asset or income-adjusting characteristics have historically offered inflation resistance, particularly when investors needed it most—as inflation increased. Combining assets into a diversified real-return composite has increased the frequency of outpacing inflation as it rises, a difficult task for cash in today’s low-rate environment.
Frequency of Outperforming Inflation, 1998–2015
0%
10%
20%
30%
40%
50%
60%
70%
80%
90%
100%
CompositePortfolio
Commodities TIPS Leveraged Loans Real EstateStocks
Real EstateBonds
Cash
Outperformed during Rising Inflation Outperformed during Falling Inflation
Overall Rate of Outperformance
74% 55% 77% 84% 74% 75% 45%
% of Periods Outperforming Inflation Rate
Past performance is no guarantee of future results. Diversification does not ensure a profit or guarantee against loss. It is not possible to invest directly in an index. Please see appendix for important index information. Inflation rate: year-over-year change in the consumer price index. Asset classes represented by: Cash – IA SBBI U.S. 30 Day Treasury Bill Index; Commodities – Bloomberg Commodity Index; Composite portfolio – 30% TIPS, 25% leveraged loans, 25% commodities, 10% real estate equity, 10% real estate income; Leveraged Loans – S&P/LSTA Leveraged Performing Loan Index; Real Estate Bonds – BofA ML U.S. Corporate Real Estate Index; Real Estate Stocks – Dow Jones U.S. Select Real Estate Securities Index; TIPS (Treasury Inflation Protected Securities) – Barclays U.S. TIPS Index. Source: Morningstar, Fidelity Investments (AART), as of 12/31/15. 45
A
SS
ET
ALL
OC
ATI
ON
-1%
0%
1%
2%
3%
4%
0.0% 1.0% 2.0% 3.0% 4.0%
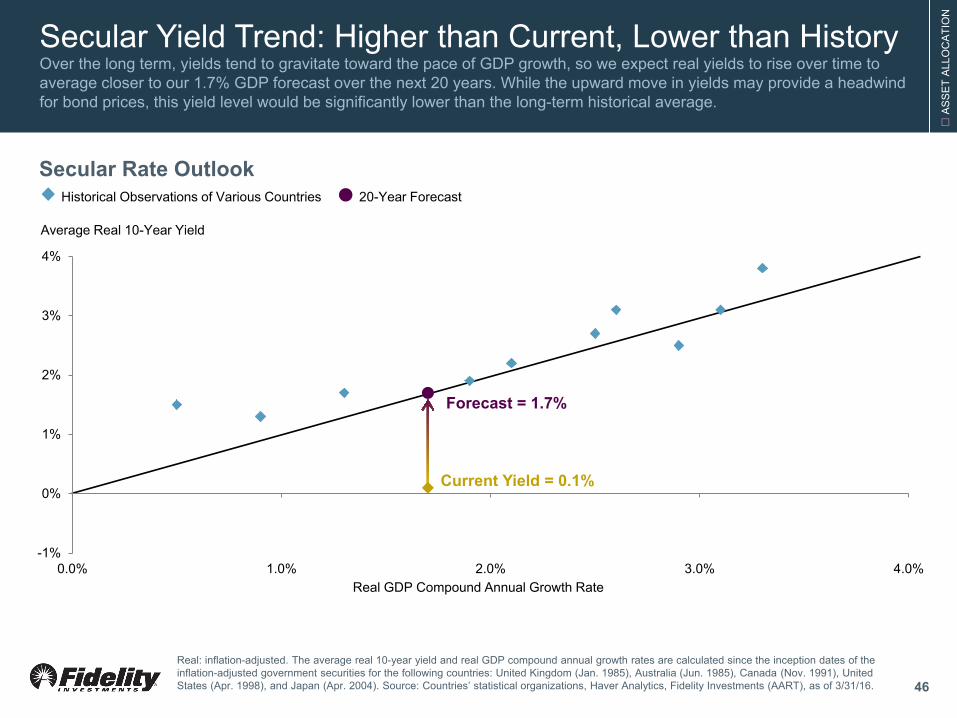
Secular Yield Trend: Higher than Current, Lower than History Over the long term, yields tend to gravitate toward the pace of GDP growth, so we expect real yields to rise over time to average closer to our 1.7% GDP forecast over the next 20 years. While the upward move in yields may provide a headwind for bond prices, this yield level would be significantly lower than the long-term historical average.
46
Real: inflation-adjusted. The average real 10-year yield and real GDP compound annual growth rates are calculated since the inception dates of the inflation-adjusted government securities for the following countries: United Kingdom (Jan. 1985), Australia (Jun. 1985), Canada (Nov. 1991), United States (Apr. 1998), and Japan (Apr. 2004). Source: Countries’ statistical organizations, Haver Analytics, Fidelity Investments (AART), as of 3/31/16.
Historical Observations of Various Countries 20-Year Forecast
Real GDP Compound Annual Growth Rate
Forecast = 1.7%
Current Yield = 0.1%
Secular Rate Outlook
Average Real 10-Year Yield
A
SS
ET
ALL
OC
ATI
ON
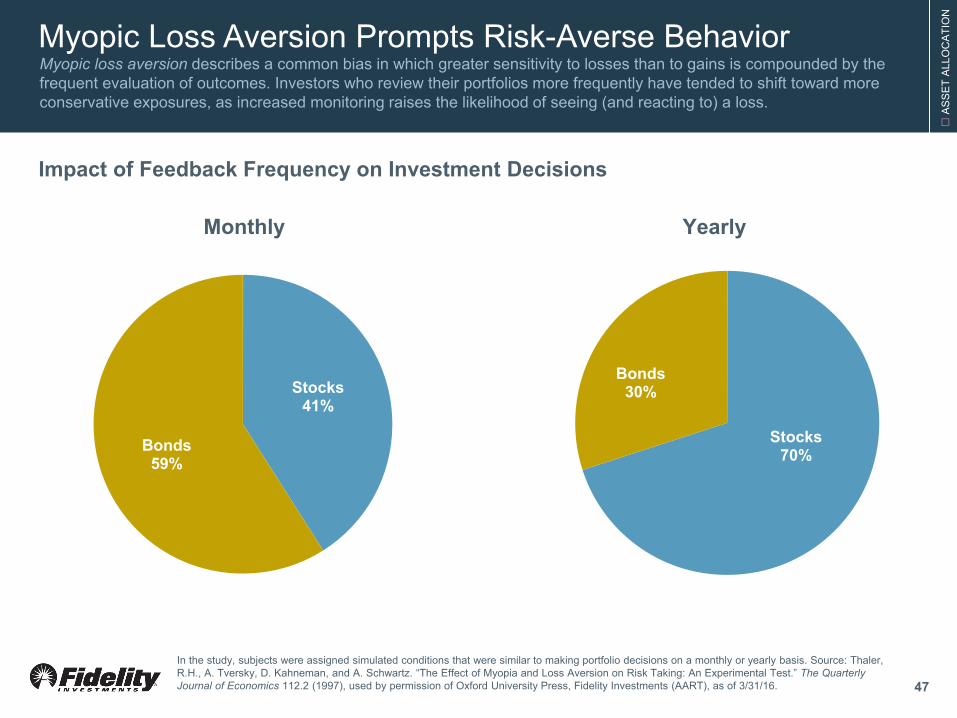
Myopic Loss Aversion Prompts Risk-Averse Behavior Myopic loss aversion describes a common bias in which greater sensitivity to losses than to gains is compounded by the frequent evaluation of outcomes. Investors who review their portfolios more frequently have tended to shift toward more conservative exposures, as increased monitoring raises the likelihood of seeing (and reacting to) a loss.
47
Impact of Feedback Frequency on Investment Decisions
Monthly Yearly
In the study, subjects were assigned simulated conditions that were similar to making portfolio decisions on a monthly or yearly basis. Source: Thaler, R.H., A. Tversky, D. Kahneman, and A. Schwartz. “The Effect of Myopia and Loss Aversion on Risk Taking: An Experimental Test.” The Quarterly Journal of Economics 112.2 (1997), used by permission of Oxford University Press, Fidelity Investments (AART), as of 3/31/16.
Stocks 70%
Bonds 30% Stocks
41%
Bonds 59%
A
SS
ET
ALL
OC
ATI
ON
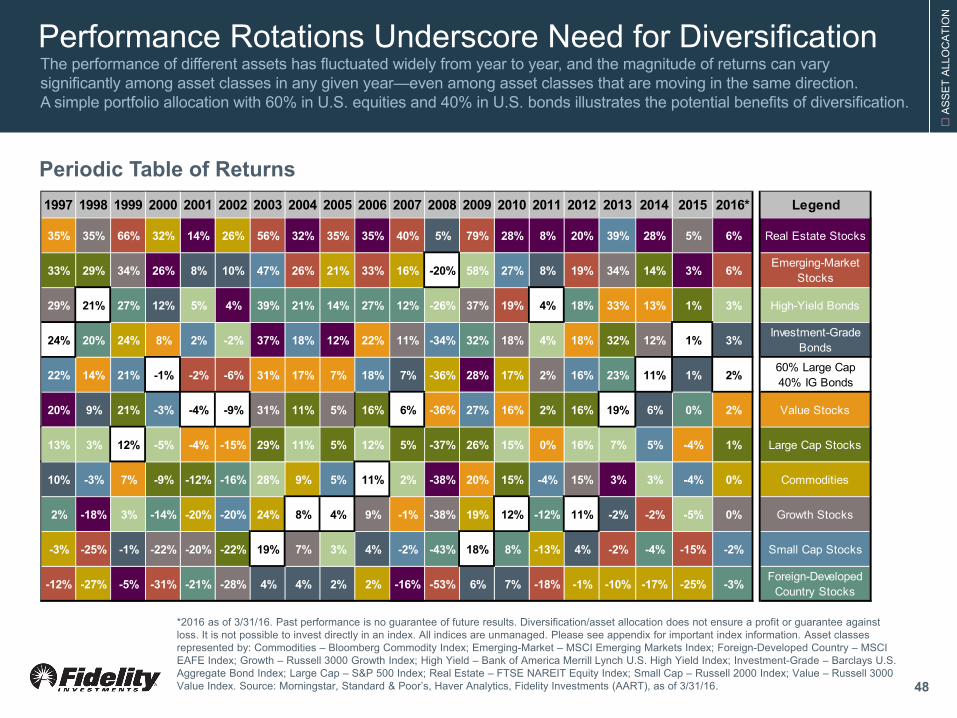
Performance Rotations Underscore Need for Diversification The performance of different assets has fluctuated widely from year to year, and the magnitude of returns can vary significantly among asset classes in any given year—even among asset classes that are moving in the same direction. A simple portfolio allocation with 60% in U.S. equities and 40% in U.S. bonds illustrates the potential benefits of diversification.
Periodic Table of Returns
*2016 as of 3/31/16. Past performance is no guarantee of future results. Diversification/asset allocation does not ensure a profit or guarantee against loss. It is not possible to invest directly in an index. All indices are unmanaged. Please see appendix for important index information. Asset classes represented by: Commodities – Bloomberg Commodity Index; Emerging-Market – MSCI Emerging Markets Index; Foreign-Developed Country – MSCI EAFE Index; Growth – Russell 3000 Growth Index; High Yield – Bank of America Merrill Lynch U.S. High Yield Index; Investment-Grade – Barclays U.S. Aggregate Bond Index; Large Cap – S&P 500 Index; Real Estate – FTSE NAREIT Equity Index; Small Cap – Russell 2000 Index; Value – Russell 3000 Value Index. Source: Morningstar, Standard & Poor’s, Haver Analytics, Fidelity Investments (AART), as of 3/31/16. 48
1997 1998 1999 2000 2001 2002 2003 2004 2005 2006 2007 2008 2009 2010 2011 2012 2013 2014 2015 2016* Legend
35% 35% 66% 32% 14% 26% 56% 32% 35% 35% 40% 5% 79% 28% 8% 20% 39% 28% 5% 6% Real Estate Stocks
33% 29% 34% 26% 8% 10% 47% 26% 21% 33% 16% -20% 58% 27% 8% 19% 34% 14% 3% 6% Emerging-Market Stocks
29% 21% 27% 12% 5% 4% 39% 21% 14% 27% 12% -26% 37% 19% 4% 18% 33% 13% 1% 3% High-Yield Bonds
24% 20% 24% 8% 2% -2% 37% 18% 12% 22% 11% -34% 32% 18% 4% 18% 32% 12% 1% 3% Investment-Grade Bonds
22% 14% 21% -1% -2% -6% 31% 17% 7% 18% 7% -36% 28% 17% 2% 16% 23% 11% 1% 2% 60% Large Cap40% IG Bonds
20% 9% 21% -3% -4% -9% 31% 11% 5% 16% 6% -36% 27% 16% 2% 16% 19% 6% 0% 2% Value Stocks
13% 3% 12% -5% -4% -15% 29% 11% 5% 12% 5% -37% 26% 15% 0% 16% 7% 5% -4% 1% Large Cap Stocks
10% -3% 7% -9% -12% -16% 28% 9% 5% 11% 2% -38% 20% 15% -4% 15% 3% 3% -4% 0% Commodities
2% -18% 3% -14% -20% -20% 24% 8% 4% 9% -1% -38% 19% 12% -12% 11% -2% -2% -5% 0% Growth Stocks
-3% -25% -1% -22% -20% -22% 19% 7% 3% 4% -2% -43% 18% 8% -13% 4% -2% -4% -15% -2% Small Cap Stocks
-12% -27% -5% -31% -21% -28% 4% 4% 2% 2% -16% -53% 6% 7% -18% -1% -10% -17% -25% -3% Foreign-Developed Country Stocks
Appendix: Important Information Views expressed are as of the date indicated, based on the information available at that time, and may change based on market and other conditions. Unless otherwise noted, the opinions provided are those of the authors and not necessarily those of Fidelity Investments or its affiliates. Fidelity does not assume any duty to update any of the information.
Investment decisions should be based on an individual’s own goals, time horizon, and tolerance for risk.
These materials are provided for informational purposes only and should not be used or construed as a recommendation of any security, sector, or investment strategy.
Fidelity does not provide legal or tax advice and the information provided herein is general in nature and should not be considered legal or tax advice. Consult with an attorney or a tax professional regarding your specific legal or tax situation.
Past performance and dividend rates are historical and do not guarantee future results.
Investing involves risk, including risk of loss.
Diversification does not ensure a profit or guarantee against loss.
All indices are unmanaged, and performance of the indices includes reinvestment of dividends and interest income and, unless otherwise noted, is not illustrative of any particular investment. An investment cannot be made in any index.
Although bonds generally present less short-term risk and volatility than stocks, bonds do contain interest rate risk (as interest rates rise, bond prices usually fall, and vice versa) and the risk of default, or the risk that an issuer will be unable to make income or principal payments. Additionally, bonds and short-term investments entail greater inflation risk—or the risk that the return of an investment will not keep up with increases in the prices of goods and services—than stocks. Increases in real interest rates can cause the price of inflation-protected debt securities to decrease.
Stock markets, especially non-U.S. markets, are volatile and can decline significantly in response to adverse issuer, political, regulatory, market, or economic developments. Foreign securities are subject to interest rate, currency exchange rate, economic, and political risks, all of which are magnified in emerging markets.
The securities of smaller, less well-known companies can be more volatile than those of larger companies.
Growth stocks can perform differently from the market as a whole and from other types of stocks, and can be more volatile than other types of stocks. Value stocks can perform differently from other types of stocks and can continue to be undervalued by the market for long periods of time.
Lower-quality debt securities generally offer higher yields but also involve greater risk of default or price changes due to potential changes in the credit quality of the issuer. Any
fixed-income security sold or redeemed prior to maturity may be subject to loss.
Floating-rate loans generally are subject to restrictions on resale, and sometimes trade infrequently in the secondary market; as a result, they may be more difficult to value, buy, or sell. A floating-rate loan may not be fully collateralized and therefore may decline significantly in value.
The municipal market can be affected by adverse tax, legislative, or political changes, and by the financial condition of the issuers of municipal securities. Interest income generated by municipal bonds is generally expected to be exempt from federal income taxes and, if the bonds are held by an investor resident in the state of issuance, from state and local income taxes. Such interest income may be subject to federal and/or state alternative minimum taxes. Investing in municipal bonds for the purpose of generating tax-exempt income may not be appropriate for investors in all tax brackets. Generally, tax-exempt municipal securities are not appropriate holdings for tax-advantaged accounts such as IRAs and 401(k)s.
The commodities industry can be significantly affected by commodity prices, world events, import controls, worldwide competition, government regulations, and economic conditions.
The gold industry can be significantly affected by international monetary and political developments, such as currency devaluations or revaluations, central bank movements, economic and social conditions within a country, trade imbalances, or trade or currency restrictions between countries.
Changes in real estate values or economic downturns can have a significant negative effect on issuers in the real estate industry.
Leverage can magnify the impact that adverse issuer, political, regulatory, market, or economic developments have on a company. In the event of bankruptcy, a company’s creditors take precedence over the company’s stockholders.
Market Indices
BofA ML Corporate Real Estate Index, a subset of BofA ML U.S. Corporate Index, is a market capitalization-weighted index of U.S. dollar-denominated investment-grade corporate debt publicly issued in the U.S. domestic market by real estate issuers. Qualifying securities must have an investment-grade rating (based on an average of Moody’s, S&P, and Fitch). In addition, qualifying securities must have at least one year remaining to final maturity, a fixed coupon schedule, and a minimum amount outstanding of $250 million. BofA ML U.S. Real Estate Index is a subset of the BofA ML Real Estate Corporate Index; qualifying securities must have an investment grade rating and an investment grade-rated country of risk. BofA ML U.S. High Yield Bond Index is a market capitalization-weighted index of U.S. dollar denominated below investment grade corporate debt publicly issued in the U.S. domestic market. The Merrill Lynch High-Yield Bond Master II Index is an unmanaged index that tracks the performance of below-investment-grade, U.S.-dollar-denominated corporate bonds publicly issued in the U.S. domestic market.
49
Appendix: Important Information
50
Market Indices (continued)
Barclays U.S. 1-3 (1-5) Year Government Credit Index includes all publicly issued U.S. government and corporate securities that have a remaining maturity between one and three (five) years and are rated investment grade. Barclays U.S. 1-5 Year Credit Index is designed to cover publicly issued U.S. corporate and specified non-U.S. debentures and secured notes with a maturity between one and five years and meet the specified liquidity and quality requirements; bonds must be SEC-registered to qualify. Barclays U.S. 1-5 Year Municipal Index covers the one- to five-year maturity, U.S. dollar-denominated, tax-exempt bond market with four main sectors: state and local general obligation bonds, revenue bonds, insured bonds, and pre-refunded bonds.
Barclays ABS Index is a market value-weighted index that covers fixed-rate asset-backed securities with average lives greater than or equal to one year and that are part of a public deal; the index covers the following collateral types: credit cards, autos, home equity loans, stranded-cost utility (rate-reduction bonds), and manufactured housing. Barclays CMBS Index is designed to mirror commercial mortgage-backed securities of investment-grade quality (Baa3/BBB-/BBB- or above) using Moody’s, S&P, and Fitch, respectively, with maturities of at least one year. Barclays Emerging Market Bond Index is an unmanaged index that tracks total returns for external-currency-denominated debt instruments of the emerging markets. Barclays Euro Aggregate Bond Index is a broad-based flagship benchmark that measures the investment grade, euro-denominated, fixed rate bond market, including treasuries, government-related, corporate and securitized issues. Barclays Long U.S. Government Credit Index includes all publicly issued U.S. government and corporate securities that have a remaining maturity of 10 or more years, are rated investment grade, and have $250 million or more of outstanding face value. Barclays Municipal Bond Index is a market value-weighted index of investment-grade municipal bonds with maturities of one year or more. Barclays U.S. Agency Bond Index is a market value-weighted index of U.S. Agency government and investment-grade corporate fixed-rate debt issues. Barclays U.S. Aggregate Bond is a broad-based, market-value-weighted benchmark that measures the performance of the investment-grade, U.S. dollar-denominated, fixed-rate taxable bond market. Barclays U.S. Corporate High Yield Bond Index is a market value-weighted index that covers the universe of dollar-denominated, fixed-rate, non-investment grade debt. Barclays U.S. Credit Bond Index is a market value-weighted index of investment-grade corporate fixed-rate debt issues with maturities of one year or more. Barclays U.S. Government Index is a market value-weighted index of U.S. Government fixed-rate debt issues with maturities of one year or more. Barclays U.S. MBS Index is a market value-weighted index of fixed-rate securities that represent interests in pools of mortgage loans, including balloon mortgages, with original terms of 15 and 30 years that are issued by the Government National Mortgage Association (GNMA), the Federal National Mortgage Association (FNMA), and the Federal Home Loan Mortgage Corp. (FHLMC). Barclays U.S. Treasury Inflation-Protected Securities (TIPS) Index (Series-L) is a market value-weighted index that measures the performance of inflation-protected securities issued by the U.S. Treasury. Barclays U.S. Treasury Bond Index is a market value-weighted index of public obligations of the U.S. Treasury with maturities of one year or more.
Bloomberg Commodity Index measures the performance of the commodities market. It consists of exchange-traded futures contracts on physical commodities that are weighted to account for the economic significance and market liquidity of each commodity. The Citigroup Non-USD Group-of-seven (G7) Equal Weighted Index is designed to measure the unhedged performance of the government bond markets of Japan, Germany, France, Britain, Italy, and Canada. The index is equal-weighted by country. Issues included in the index have fixed-rate coupons and maturities of one year or more. The CBOE Volatility Index® (VIX® Index) is a barometer of equity market volatility. The VIX Index is based on real-time prices of options on the S&P 500® Index (SPX) and is designed to reflect investors' consensus view of future (30-day) expected stock market volatility. The Conference Board Leading Economic Index® (LEI) for the U.S. is a series of composite economic indexes that are the key elements in an analytic system designed to signal peaks and troughs in the business cycle. The leading, coincident, and lagging economic indexes are essentially composite averages of several individual leading, coincident, or lagging indicators. They are constructed to summarize and reveal common turning point patterns in economic data in a clearer and more convincing manner than any individual component – primarily because they smooth out some of the volatility of individual components. Dow Jones U.S. Select Real Estate Securities Index is a float-adjusted, market capitalization-weighted index of publicly traded real estate securities, such as real estate investment trusts (REITs) and real estate operating companies (REOCs). FTSE 100 Index is a market capitalization-weighted index of the 100 most highly capitalized blue chip companies listed on the London Stock Exchange. FTSE National Association of Real Estate Investment Trusts (NAREIT) All REITs Index is a market capitalization-weighted index that is designed to measure the performance of all tax-qualified REITs listed on the NYSE, the American Stock Exchange, or the NASDAQ National Market List. FTSE NAREIT Equity REIT Index is an unmanaged market value-weighted index based on the last closing price of the month for tax-qualified REITs listed on the New York Stock Exchange (NYSE). The Global Financial Data (GFD) World x/USA Return Index is a multi-country composite index with constituents weighted by relative GDP and stock market capitalizations; it is designed to approximate continuous and comparable world ex-U.S. equity returns from 1919 to 1969. GFD Emerging Markets Index is a composite of various regional EM indices in use before 1987 using a qualitatively selected weighting of constituent countries; it is designed to approximate continuous and comparable EM equity returns from 1920 to 1987.
Market Indices (continued)
The IA SBBI U.S. Small Cap Stock Index is a custom index designed to measure the performance of small capitalization U.S. stocks. IA SBBI U.S. Intermediate-Term Government Bond Index is an unweighted index that measures the performance of five-year maturity U.S. Treasury bonds. Each year, a one-bond portfolio containing the shortest non-callable bond having a maturity of not less than five years is constructed. IA SBBI U.S. Long-Term Corporate Bond Index is a custom index designed to measure the performance of long-term U.S. corporate bonds. IA SBBI U.S. 30-Day Treasury Bill Index is an unweighted index that measures the performance of 30-day maturity U.S. Treasury bills.
JPM® EMBI Global Index, and its country sub-indices, total returns for the U.S. dollar-denominated debt instruments issued by Emerging Market sovereign and quasi-sovereign entities, such as Brady bonds, loans, and Eurobonds. JPM® EMBI Global Investment Grade Index, and its country sub-indices, tracks total returns for traded external debt instruments issued by emerging-market sovereign and quasi-sovereign entities rated investment grade.
MSCI® All Country (AC) Europe Index is a market capitalization-weighted index that is designed to measure the equity market performance of Europe; it consists of the following developed and emerging-market country indices: Austria, Belgium, Czech Republic, Denmark, Finland, France, Germany, Greece, Hungary, Ireland, Italy, Netherlands, Norway, Poland, Portugal, Russia, Spain, Sweden, Switzerland, Turkey, and United Kingdom. MSCI All Country World Index (ACWI) is a market capitalization-weighted index that is designed to measure the investable equity market performance for global investors of developed and emerging markets. MSCI Europe Index is a market capitalization-weighted index that is designed to measure the investable equity market performance for global investors of the developed markets in Europe. MSCI North America Index is a market capitalization-weighted index designed to measure the performance of large and mid cap segments of the U.S. and Canada markets. MSCI Pacific ex Japan Index is a market capitalization-weighted index that is designed to measure the equity market performance of four of the five developed market countries in the Pacific region including Australia, Hong Kong, New Zealand and Singapore. MSCI World Index is a market capitalization-weighted index that is designed to measure the investable equity market performance for global investors of developed markets. MSCI World ex USA Index is a market capitalization-weighted index designed to measure the equity market performance of developed markets excluding the U.S.
MSCI Emerging Markets (EM) Index is a market capitalization-weighted index that is designed to measure the investable equity market performance for global investors in emerging markets. MSCI EM Asia Index is a market capitalization-weighted index designed to measure equity market performance in Asia. MSCI EM Europe, Middle East, and Africa (EMEA) Index is a market capitalization-weighted index that is designed to measure the investable equity market performance for global investors in the emerging-market countries of Europe, the Middle East, and Africa. MSCI EM Latin America Index is a market capitalization-weighted index that is designed to measure the investable equity market performance for global investors in the emerging-market countries of Latin America. MSCI EM Large Cap Index is composed of those securities in the MSCI EM Index that are defined as large-capitalization stocks.
MSCI Europe, Australasia, Far East Index (EAFE) is a market capitalization-weighted index that is designed to measure the investable equity market performance for global investors in developed markets, excluding the U.S. and Canada. MSCI EAFE Small Cap Index is a market capitalization-weighted index that is designed to measure the investable equity market performance of small cap stocks for global investors in developed markets, excluding the U.S. and Canada.
MSCI Canada Index is a market capitalization-weighted index designed to measure equity market performance in Canada. MSCI China Index is a market capitalization-weighted index designed to measure equity market performance in China. MSCI Japan Index is a market capitalization-weighted index designed to measure equity market performance in Japan. MSCI USA Index is a market capitalization-weighted index designed to measure the equity market performance of the U.S.
MSCI REIT Preferred Index is a preferred stock market capitalization-weighted total return index of certain exchange-traded perpetual preferred securities issued by U.S. Equity and U.S. Hybrid REITs.
Russell 2000® Index is a market capitalization-weighted index designed to measure the performance of the small-cap segment of the U.S. equity market. It includes approximately 2,000 of the smallest securities in the Russell 3000 Index. Russell 3000® Index is a market capitalization-weighted index designed to measure the performance of the 3,000 largest companies in the U.S. equity market. Russell 3000 Growth Index is a market capitalization-weighted index designed to measure the performance of the broad growth segment of the U.S. equity market. It includes those Russell 3000 Index companies with higher price-to-book ratios and higher forecasted growth rates. Russell 3000 Value Index Russell 2500 Value Index is a market capitalization-weighted index designed to measure the performance of the small to mid-cap value segment of the U.S. equity market. It includes those Russell 2500 Index companies with lower price-to-book ratios and lower forecasted growth rates. Russell Midcap® Index is a market capitalization-weighted index designed to measure the performance of the mid-cap segment of the U.S. equity market. It contains approximately 800 of the smallest securities in the Russell 1000 Index.
The S&P 500® Index is a market capitalization-weighted index of 500 common stocks chosen for market size, liquidity, and industry group representation to represent U.S. equity performance. S&P 500 is a registered service mark of The McGraw-Hill Companies, Inc., and has been licensed for use by Fidelity Distributors Corporation and its affiliates. The S&P 500 Total Return Index represents the price changes and reinvested dividends of the S&P 500® Index. The S&P SmallCap 600 is a market capitalization-weighted index of 600 small-capitalization stocks. The S&P GSCI® Commodities Index provides investors with a reliable and publicly available benchmark for investment performance in the commodity markets.
Appendix: Important Information
51
Market Indices (continued)
The Sectors and industries defined by Global Industry Classification Standards (GICS®), except where noted otherwise. S&P 500 sectors are defined as follows: Consumer Discretionary – companies that tend to be the most sensitive to economic cycles. Consumer Staples – companies whose businesses are less sensitive to economic cycles. Energy – companies whose businesses are dominated by either of the following activities: the construction or provision of oil rigs, drilling equipment, and other energy-related services and equipment, including seismic data collection; or the exploration, production, marketing, refining, and/or transportation of oil and gas products, coal, and consumable fuels. Financials – companies involved in activities such as banking, consumer finance, investment banking and brokerage, asset management, insurance and investments, and real estate, including REITs. Health Care – companies in two main industry groups: health care equipment suppliers, manufacturers, and providers of health care services; and companies involved in research, development, production, and marketing of pharmaceuticals and biotechnology products. Industrials – companies whose businesses manufacture and distribute capital goods, provide commercial services and supplies, or provide transportation services. Information Technology – companies in technology software and services and technology hardware and equipment. Materials – companies that are engaged in a wide range of commodity-related manufacturing. Telecommunication Services – companies that provide communications services primarily through fixed-line, cellular, wireless, high bandwidth, and/or fiber-optic cable networks. Utilities – companies considered electric, gas, or water utilities, or companies that operate as independent producers and/or distributors of power.
Standard & Poor’s/Loan Syndications and Trading Association (S&P/LSTA) Leveraged Performing Loan Index is a market value-weighted index designed to represent the performance of U.S. dollar-denominated institutional leveraged performing loan portfolios (excluding loans in payment default) using current market weightings, spreads and interest payments.
Other Indices
The China Home Price Diffusion Index—70 Cities is a price index for existing residential buildings in 70 cities in China.
The Consumer Price Index (CPI) is a monthly inflation indicator that measures the change in the cost of a fixed basket of products and services, including housing, electricity, food, and transportation.
The Producer Price Index (PPI) measures the average change over time in the selling prices received by domestic producers for their output. The prices included in the PPI are from the first commercial transaction for many products and some services.
The London Bullion Market Association (LBMA) publishes the international benchmark price of gold in USD, twice daily. The LBMA Gold price auction takes place by ICE Benchmark Administration (IBA) at 10:30 and 15:00 with the price set in U.S. dollars per fine troy ounce.
A Purchasing Managers’ Index (PMI) is a survey of purchasing managers in a certain economic sector. A PMI over 50 represents expansion of the sector compared to the previous month, while a reading under 50 represents a contraction, and a reading of 50 indicates no change. The Institute for Supply Management ® reports the U.S. manufacturing PMI ®. Markit compiles non-U.S. PMIs. Trade-Weighted $ (Broad) Index: The broad index is a weighted average of the foreign exchange values of the U.S. dollar against the currencies of a large group of major U.S. trading partners. The index weights, which change over time, are derived from U.S. export shares and from U.S. and foreign import shares. Countries whose currencies are included in the Broad index are the Euro Area, Canada, Japan, Mexico, China, United Kingdom, Taiwan, Korea, Singapore, Hong Kong, Malaysia, Brazil, Switzerland, Thailand, Philippines, Australia, Indonesia, India, Israel, Saudi Arabia, Russia, Sweden, Argentina, Venezuela, Chile and Colombia. The Euro Area includes Germany, France, Italy, Netherlands, Belgium/Luxembourg, Ireland, Spain, Austria, Finland, Portugal, and Greece. Trade-Weighted $ (Major) Index: The major currencies index is a weighted average of the foreign exchange values of the U.S. dollar against a subset of currencies in the broad index that circulate widely outside the country of issue. The weights are derived by rescaling the currencies' respective weights in the broad index so that they sum to 1 in each sub-index. Countries whose currencies are included in the Major index are the Euro Area, Canada, Japan, United Kingdom, Switzerland, Australia, and Sweden. The Euro Area includes Germany, France, Italy, Netherlands, Belgium/Luxembourg, Ireland, Spain, Austria, Finland, Portugal, and Greece.
Definitions
Correlation coefficient measures the interdependencies of two random variables that range in value from −1 to +1, indicating perfect negative correlation at −1, absence of correlation at 0, and perfect positive correlation at +1.
The Price-to-Earnings (P/E) ratio is the ratio of a company’s current share price to its current earnings, typically trailing 12-months earnings per share. A Forward P/E calculation will typically use an average of analysts’ published estimates of earnings for the next 12 months in the denominator.
Sharpe ratio compares portfolio returns above the risk-free rate relative to overall portfolio volatility. A higher Sharpe ratio implies better risk-adjusted returns.
Standard deviation shows how much variation there is from the average (mean or expected value). A low standard deviation indicates that the data points tend to be very close to the mean, whereas a high standard deviation indicates that the data points are spread out over a large range of values. A higher standard deviation represents greater relative risk.
Excess return: the amount by which a portfolio’s performance exceeds its benchmark, net (in the case of the analysis in this article) or gross of operating expenses, in percentage points.
Appendix: Important Information
52

Definitions (continued) Methodology for excess returns (Slide 37): Our analysis focused on all U.S. large-cap, foreign (international) large-cap growth/value/blend equity mutual funds tracked by Morningstar between Jan. 1, 1992, and Dec. 31, 2014, including all core, value, and growth funds within each category and including actively managed funds and passive index funds. We included funds that did not exist for the entire period (closed or merged funds) to reduce survivorship bias. For passive index funds, we eliminated funds that were labeled as “enhanced index,” and funds with tracking error greater than 1% (which are unlikely to be actual passive index strategies despite their identification in the database). For international large-cap funds, we eliminated funds benchmarked to a price index, for greater comparability. We selected the oldest share class for each fund as representative; where more than one share class was oldest, we chose the class labeled as “retail.” Total fund counts for international large-cap equity funds: active 397, passive 25; average fund counts for performance calculation: active 213, passive 9. Averaging excess returns: We used Morningstar data on returns from Jan. 1, 1992, through Dec. 31, 2014. We calculated each fund’s excess returns on a one-year rolling basis, relative to each fund’s primary prospectus benchmark and net of reported expense ratio, for each month, using monthly excess return data from Morningstar. We used an equal-weighted average to calculate overall industry one-year returns for each month. (We chose to equal weight the averages in order to represent the average performance of the range of individual funds available to investors, rather than asset weighting, which may introduce bias into the analysis.) Funds in the study included active and passive funds tracked by Morningstar and benchmarked to the following indices: Foreign (international) large-cap equity (all in USD): MSCI ACWI Ex USA; MSCI ACWI Ex USA Growth; MSCI ACWI Ex USA Value; MSCI EAFE; MSCI EAFE Growth; MSCI EAFE Value; MSCI World Ex USA; MSCI World Ex USA Growth; MSCI World Ex USA Value. Index definitions: MSCI ACWI (All Country World Index) ex USA Index is a market capitalization-weighted index designed to measure the investable equity market performance for global investors of large and mid-cap stocks in developed and emerging markets, excluding the United States. MSCI ACWI (All Country World Index) ex USA Growth (Value) Index is a market capitalization-weighted index designed to measure the investable equity market performance of growth (value) stocks for global investors of large- and mid-cap stocks in developed and emerging markets, excluding the United States. MSCI EAFE Index is a market capitalization-weighted index that is designed
to measure the investable equity market performance for global investors in developed markets, excluding the U.S. and Canada. MSCI EAFE Growth (Value) Index is a market capitalization-weighted index that is designed to measure the investable equity market performance of growth (value) stocks for global investors in developed markets, excluding the U.S. and Canada. MSCI World ex USA Index is a market capitalization weighted index that is designed to measure the investable equity market performance for global investors of developed markets, excluding the United States. MSCI World ex USA Growth (Value) Index is a market capitalization weighted index that is designed to measure the investable equity market performance of growth (value) stocks for global investors of developed markets, excluding the United States.
Third-party marks are the property of their respective owners; all other marks are the property of FMR LLC.
If receiving this piece through your relationship with Fidelity Institutional Asset Management (FIAM), this publication is provided to investment professionals, plan sponsors, institutional investors, and individual investors by Fidelity Investments Institutional Services Company, Inc., and for certain institutional investors by Pyramis Distributors Corporation LLC.
If receiving this piece through your relationship with Fidelity Personal & Workplace Investing (PWI), Fidelity Family Office Services (FFOS), or Fidelity Institutional Wealth Services (IWS), this publication is provided through Fidelity Brokerage Services LLC, Member NYSE, SIPC.
If receiving this piece through your relationship with National Financial or Fidelity Capital Markets, this publication is for institutional investor use only. Clearing and custody services are provided through National Financial Services LLC, Member NYSE, SIPC.
753671.1.0
© 2016 FMR LLC. All rights reserved.
Appendix: Important Information
53