Embed Size (px)
Citation preview
i
CZECH STATISTICAL OFFICE NATIONAL ACCOUNTS DEPARTMENT
QUARTERLY NATIONAL ACCOUNTS
INVENTORIES
CZECH REPUBLIC
Description of data sources and methods used for Quarterly National Accounts
Version: June 30, 2016
Co-financed by the grant of European Commission No 04121.2015.002-2015.162

ii

i
Abbreviations
AN Fixed assets
ANA Annual National Accounts
BO Budgetary organisations
BS Business statistics
CEB Czech Export Bank
CIA Czech Insurance Association
CISS Classification of Institutional Sectors
CNB Czech National Bank
CMGDB Czech-Moravian Guarantee and Development Bank
COFOG Classification of the Functions of Government
COICOP Classification of Individual Consumption According to Purpose
CSSA Czech Social Security Administration
CZ-NACE CZ - Classification of Products by Activity (Nomenclature statistique des Activités économiques dans la Communauté Européenne);
CZSO Czech Statistical Office
DIF Deposit Insurance Fund
EDP Excessive deficit procedure
EIRR External Interest reference rate
FISIM Financial Intermediation Services Indirectly Measured
EU European Union
CBO Central budgetary organisations
CFC Consumption of fixed capital
GDC General Directorate of Customs
GDF General Directorate of Finance
GDP Gross Domestic Product
GFCF Gross fixed capital formation
GNI Gross National Income
IMF International Monetary Fund
IRR Internal reference rate
LBO Local budgetary organisations
LF Land Fund
LFS Labour Force Survey
MoEYS Ministry of Education, Youth and Sports, Czech Republic
MoI Ministry of Interior, Czech Republic
MoF Ministry of Finance, Czech Republic
NPISH Non-Profit Institutions Serving Households

ii
OA Owners Association
PPI Price Producer Indices
QNA Quarterly National Accounts
q-o-q Quarter-on-quarter (indices), previous quarter data = 100
RIA Railway Infrastructure Administration
S.11 Non-financial corporations sector
S.12 Financial corporations sector
S.13 General government sector
S.14 Households sector
S.15 Non-Profit Institutions Serving Households
SAD Single Administrative Document
SAIF State Agricultural Intervention Fund
SBO Semi-budgetary organisations
SF State funds
SGAFF Supplementary and Guarantee Agricultural and Forestry Fund
VAT Value Added Tax
y-o-y Year-on-year (indices), the same quarter of previous year data = 100

i
Table of contents
INTRODUCTION ............................................................................................................................................... 1
1. OVERVIEW OF THE CZECH QUARTERLY NATIONAL ACCOUNT S ....................................................... 1
1.1 Organisation and institutional arrangements within the CZSO ................................................................... 1
1.2 Publication timetable, revision policy and dissemination of QNA ................................................................ 3
1.3 QNA compilation approach .......................................................................................................................... 3
1.4 Balancing, benchmarking and other reconciliation procedures ................................................................... 4
1.5 Volume estimates ........................................................................................................................................ 4
1.6 Seasonal and calendar adjustments ........................................................................................................... 4
1.7 Additional information .................................................................................................................................. 4
2. PUBLICATION TIMETABLE, REVISIONS POLICY AND DISS EMINATION OF QNA............................... 6
2.1 Release policy ............................................................................................................................................. 6
2.2 Contents published ...................................................................................................................................... 6
2.3 Special transmission .................................................................................................................................. 10
2.4 Policy for metadata .................................................................................................................................... 10
3. BASIC APPROACH TO THE QUARTERLY NATIONAL ACCOUNT S COMPILATION .......................... 11
3.1 Overall compilation approach .................................................................................................................... 11
3.1.1 General architecture of the quarterly national accounts compilation .................................................... 12
3.2 Balancing, benchmarking and other reconciliation procedures ................................................................. 16
3.2.1 Quarterly GDP balancing procedure ...................................................................................................... 16
3.2.2 Benchmarking of QNA and ANA ............................................................................................................ 17
3.2.3 Other harmonisation procedures ............................................................................................................ 17
3.2.4 Amount of model estimation in various releases .................................................................................... 17
3.3 Volume estimates ...................................................................................................................................... 18
3.3.1 General volume policy ............................................................................................................................ 18
3.3.2 Chaining and benchmarking ................................................................................................................... 19
3.4 Seasonal and calendar adjustment ........................................................................................................... 20
3.4.1 Policy for seasonal adjustment ............................................................................................................... 20
3.4.2 Policy for calendar adjustment ............................................................................................................... 21
3.4.3 Revision policy of the seasonal adjusted data ....................................................................................... 21
4 GDP COMPONENTS: THE PRODUCTION APPROACH ......... .................................................................. 23
4.1 Gross value added, including classification by industry ............................................................................ 23
4.2 Financial intermediate services indirectly measured (FISIM) .................................................................... 31
4.3 Taxes and subsidies on products .............................................................................................................. 32

ii
5 GDP COMPONENTS: EXPENDITURE APPROACH ............ ..................................................................... 35
5.1 Final consumption expenditure of households .......................................................................................... 35
5.2 Final consumption expenditure of government institutions ....................................................................... 37
5.3 Final consumption expenditure of non-profit institutions serving households ........................................... 38
5.4 Gross capital formation .............................................................................................................................. 38
5.4.1 Gross fixed capital formation .................................................................................................................. 38
5.4.2 Changes in inventories ........................................................................................................................... 40
5.4.3 Acquisitions less disposals of valuables ................................................................................................. 41
5.5 Exports and imports ................................................................................................................................... 41
6. GDP COMPONENTS: INCOME APPROACH ................ ............................................................................ 44
6.1 Compensation of employees ..................................................................................................................... 44
6.2 Taxes and subsidies .................................................................................................................................. 45
6.3 Gross operating surplus and gross mixed income .................................................................................... 46
7 POPULATION AND EMPLOYMENT ....................... .................................................................................... 47
7.1 Population .................................................................................................................................................. 47
7.2 Employment: Persons................................................................................................................................ 48
7.3 Employment: total hours worked ............................................................................................................... 50
8 PRELIMINARY ESTIMATE OF GDP (FLASH ESTIMATE OF GD P) ......................................................... 52
8.1 Preliminary estimate of GDP ..................................................................................................................... 52
8.2 Preliminary estimate of employment ......................................................................................................... 53
9 MAIN DATA SOURCES ............................... ................................................................................................ 54

i
Introduction
The purpose of this document is to provide a brief description of data sources and methods used for the quarterly GDP estimates and its components in the Czech Republic. The description is based on practices based on ESA 2010 international standard and it is in fact an update of the previous document issued in 2008. Structure and content of this document is based on the Eurostat recommendations. The document is focused exclusively on the quarterly GDP and its components compilation. To better illustrate the process of quarterly national accounts compilation, importance of sectional parts and the estimation methods used, the description is complemented by numerical illustrations. They document quarterly macroeconomics indicators estimate for the second quarter 2015, within the first standard estimate (i.e. about 60 days after the end of the quarter). The description is the result of a Eurostat grant (Progress towards full implementation of the ESA 2010 – Contract No 04121.2015.002-2015.162). This document will be updated in the future if there are significant methodologies or procedures changes.


1
1. Overview of the Czech quarterly national account s
1.1 Organisation and institutional arrangements wi thin the CZSO
1.1 Quarterly national accounts (QNA) of the Czech Republic are compiled by the Czech Statistical Office (CZSO), which is central authority of state administration of the Czech Republic. The office was established by the Act No 2/1969 Coll., on establishment of ministries and other central government bodies, on January 8, 1969. Activities of the CZSO are managed by the Act No 89/1995 Coll., on State Statistical Service and also by the European Statistics Code, adopted by the Committee for the European Statistical System on September 28, 2011.
1.2 The Czech Statistical Office is an independent institution managed by the President who is appointed by the Czech Republic President on the Government proposal. The President of the CZSO participates in government meetings without voting rights.
1.3 The CZSO is organisationally split into two parts and each of which is managed by a Vice-president.
One of them manages regional representations; the second Vice-president manages all statistical sections i.e.: General Methodology and Register Section, Macroeconomic Section, Business Statistics Section, Demography and Social Statistics Section.
1.4 In addition to this, five departments are managed directly by the CZSO President. Besides Office of
the President of the CZSO, there are departments – Security and Crisis Management Department, Human Resources and Wages Department, Legislation and International Cooperation Department, External Public Relations Department and Information Services Department.
1.5 Macroeconomic Section includes four departments. Two departments are engaged in national
accounts compilation (National Accounts Department and Government and Financial Accounts Department) and the other two are Prices Statistics Department and External Trade Statistics Department. The two national accounts departments are divided into six units (see Scheme 1). At present, these departments have 52 employees; all these employees have university education, in particular of economic character. Allocation of these employees to the main spheres of national accounts is shown below. Both departments collaborate very closely.
1.6 Sector Accounts Unit plays an integral role in the process compilation of quarterly and annual
national accounts for the total economy (QSA or ASA). It compiles full sequence of non-financial accounts, financial accounts, accounts of other changes and balance sheets for all subsectors of non-financial corporations and households sectors. This Unit compiles also full sequence of accounts for non-residents. It compiles production and generation of income accounts also by industry. This unit also participates in preparation of annual statistical surveys, selection of surveyed indicators and their description as well as in preparation of a form for the non-financial corporations survey. Within the unit, estimates to exhaustiveness of the economy, quarterly and annual estimates of housing services, quarterly and annual estimates of employment indicators and the balance of non-produced assets are also carried out. Furthermore regional accounts are also compiled. For the purpose of the quarterly sector accounts the unit compiles non-financial accounts for non-financial corporations and households sectors and coordinates compilation of accounts for other institutional sectors.
1.7 Unit of Input-output tables compiles supply and use tables at current and previous year’s prices and also symmetric input-output tables. It carries out also quarterly and annual estimates of household final consumption expenditure, further balancing of commodity flows within the supply and

2
use tables, and it plays a decisive role during balancing of the goods and services account and in the final data verification of output and intermediate consumption split by industry. It also participates in the preparation of annual statistical survey when defining requirements for the commodity structure. Furthermore, it compiles balances of fixed assets, inventories, valuables and tables of gross fixed capital formation split into three parts: according to (sub)sector x industry x type of assets breakdown. It carries out calculation of fixed capital consumption in the required dividing; it balances acquisitions and disposals (sales) of used fixed assets; it carries out estimates and balances acquisitions and stocks of fixed assets acquired through financial leasing. This unit also participates in preparation for annual statistical surveys, especially in selection of the surveyed indicators for non-financial assets and in their description and also in the survey form. For the purpose of the quarterly GDP estimate the unit carries out estimates of changes in inventories and participates in preparation of quarterly conceptual adjustments.
1.8 Unit of quarterly estimates compiles quarterly estimates of resources and uses of gross domestic
product at current prices and chain-linked volumes, including its seasonally adjusted time series. Following it, the unit is responsible for estimates of output, intermediate consumption, fixed capital formation and exports and imports for quarterly sector accounts compilation. It participates in quarterly estimates of conceptual adjustments and adjustments relating to exhaustiveness of sector structure, which enter into GDP estimates and into quarterly sector accounts. This unit also participates in preparation of quarterly statistical surveys, especially of selection of the surveyed indicators for non-financial corporations and households. This unit is responsible for methodological defining of estimates of exports and imports of goods and services; these items are compiled for quarterly and annual accounts.
Box 1.1 National Accounts Departments
1.9 Government Accounts Unit compiles full set of annual and quarterly non-financial and financial accounts, accounts of other changes and balance sheets for general government sector (split by subsector). It is responsible for the EDP notification of government deficit and debt (notification tables, questionnaire tables, inventory of methods and data sources etc.). It provides underlying data
4202; 6 personsFinancial Accounts Unit
Helena Houžvi čková
4203; 6 personsNon-market economyŠárka Chaloupková
4201; 9 persons
Governemnt Accounts Unit
Jaroslav Kahoun
42; 24 personsGovernemnt and Financial
Accounts DepartmentVáclav Rybá ček
41; 28 persons
National Accounts Department
Vladimír Kermiet
4101; 10 persons
Sector Accounts Department
Jaroslav Zbranek
4102; 9 personsInput - Output Tables
Petr Musil
4103; 5 personsQuarterly Estimates Unit
Tereza Koš ťáková

3
sources for general government sector determined for the GDP estimate (for value added estimate, fixed capital formation and final consumption expenditure) including taxes and subsidies.
1.10 Financial Accounts Unit plays decisive role in balancing of flows and stocks of financial assets and liabilities. It compiles full sequence of non-financial accounts, financial accounts, other changes accounts and balance sheets for (sub)sectors of financial corporations. It also participates in preparation for annual statistical surveys, selection of the surveyed indicators and in their description as well as in financial corporations survey forms. It provides underlying data sources for financial corporations sector and related conceptual adjustments.
1.11 Non-market Economy Unit ensures underlying data sources for general government accounts and ensures coordination and cooperation with the Ministry of Finance, obtains available administrative and statistical data for all government units. Further the Unit compiles annual national accounts for non-profit institutions serving households. The unit also participates in compilation of indicators within the European Comparison Project – GDP expenditure and it calculates weighted average rate of GDP (EU own resource).
1.2 Publication timetable, revision policy and diss emination of QNA
1.12 Main publication of QNU indicators is about 60th day after the reference quarter1. In this term, full set of GDP indicators is published in the structure according to production, expenditure and income approach. Together with it, data on employment are also published.
1.13 In addition to, as a quick information on development of economy, it is published the preliminary estimate of quarterly2.GDP, about 45th day after the end of the reference quarter. GDP and its components may be revised together with publishing of the quarterly sector accounts in connections with update of data on government institutions, about the 90th day after ending of the reference period3.
1.14 Generally, data are refined with each a new estimate. Together with the reference period it may be revised previous quarter of the current year. Together with the fourth quarter, data are revised for the whole year. With the publication of a new set of the annual national accounts, quarterly national accounts (QNAs) are harmonised with the annual national accounts (ANAs).
1.3 QNA compilation approach
1.15 Quarterly national accounts are compiled in compliance with the European system of national accounts (ESA 2010). The quarterly estimate of GDP is based especially on production and expenditure approaches. These two approaches enter as the counterparts into balancing process, which is determining for the final GDP estimates and estimates of its components (at current prices and average prices of previous year).
1.16 Thanks to relatively wide range of available data sources, most of the statistical methods used in the estimates of quarterly GDP belong to direct procedures. These are to a large extent based on data sources, which are by their nature and content similar to the sources, which are used for compiling of the annual national accounts. Differences from the annual data sources (especially lesser details) are taken into account during the QNAs compilation so in order to ensure comparability of time series in the period when the annual national accounts, for the current year, are not available.
1 Standard estimate 2 More details see Chapter 8 3 Standard estimate

4
1.17 If an appropriate data source is not available in the quarterly (or shorter) periodicity, indirect methods are used. These are generally based on the value of annual national accounts for previous year (or on the value for the same period of the previous year) using alternative estimating methods of the year-of-year development.
1.4 Balancing, benchmarking and other reconciliatio n procedures
1.18 GDP estimates are compiled by two independent approaches – the production approach and the expenditure approach. The income approach of GDP estimate does not enter into the balancing process, because gross operating surplus is derived as a residual item. The difference between the two approaches is removed within the balancing process.
1.5 Volume estimates
1.19 Estimate of volume development of macroeconomic indicators is in general based on two main steps. At first, there is a transition of GDP components from current prices to average prices of previous year (using corresponding price indices). The second step is chain-linking of indicator at average prices of the previous year in order to obtain time series at comparable prices to calculate volume indices. Chain-linking of quarterly indicators is carried out using so-called “annual overlap” method.
1.6 Seasonal and calendar adjustments
1.20 GDP and its components according to the production, expenditure and income approaches are also published4 in seasonally adjusted form. Calculations are based on TRAMO/SEATS method. Seasonal adjustment is carried out every quarter. Once a year, i.e. when the first quarterly estimate is made, all the time series of seasonally adjusted data are revised. Apart from this annual revision, revisions of seasonally adjusted data are limited only to the periods in which non-seasonally adjusted data are revised.
1.21 Corrections for calendar influences are carried out only for the selected time series, in which the calendar influence is statistically significant and explainable from an economic point of view. Regression approach is applied using one regression variable, which takes into account distinguishing working days and non-working days and an effect of Easter holidays.
1.7 Additional information
1.22 Main website dedicated to national accounts of the Czech Republic is: http://apl.czso.cz/pll/rocenka/rocenka.indexnu
1.23 Data on Quarterly National Accounts of the Czech Republic are available on: https://www.czso.cz/csu/czso/ctvrtletni_ucty
1.24 All national accounts data on the Czech Republic are published in a database of national accounts
http://apl.czso.cz/pll/rocenka/rocenka.indexnu
4 They are published on the web sites of the CZSO and EUROSTAT

5
1.25 Selected data are also published in the Public Database of the CZSO https://vdb.czso.cz/vdbvo2/
1.26 Data of the quarterly national accounts are regularly transmitted to international institutions. They are for instance International Monetary Fund and its Overview of Economic Indicators (SDDS Plus) is published also on the CZSO web sites. https://www.czso.cz/csu/czso/prehled-ekonomickych-ukazatelu-cr-pro-mmf-sdds-plus

6
2. Publication timetable, revisions policy and diss emination of QNA
2.1 Release policy
2.1 Current estimates of the QNA indicators are published about 60th day after the end of the reference period. News Releases (press releases) include main indicators, information on the possible revisions and short comment on the economy development in the corresponding quarter. Emphasis is put both on expenditure components of GDP and on the source side of GDP. The News Releases are accompanied by an electronic publication that includes a set of tables and time series. All the information is published on the web sites of the CZSO. This updated set of tables of time series is also published in the publication deadline of the quarterly sector accounts (i.e. about 90th day after the end of the quarter).
2.2 In addition to current estimates, preliminary GDP estimates are also published, approximately on the 45th day after the end of the reference quarter. The News Releases of preliminary estimate include only information on year-on-year and quarter-on-quarter GDP growth rate and information on employment (all is adjusted for calendar effects and seasonally adjusted).
News Releases on current estimates of QNA indicators and the flash estimate of GDP are available on:
https://www.czso.cz/csu/czso/ctvrtletni-narodni-ucty-tvorba-a-uziti-hdp-a-predbezny-odhad-hdp
2.3 Catalogue of Products is available on the CZSO web sites about 4 months before the beginning of the year: https://www.czso.cz/csu/czso/katalog-produktu
2.4 At the same time with the current estimate for the quarter, estimates for the previous quarterly are refined. This refining is based on the new information, which is available after the current quarter publication. The revision of all quarterly data is carried out with publication of the fourth quarter. Updated results of quarterly statistical survey P3-04, which is grossed-up using data from VAT tax declarations (for more details see DS89), are the main basis for refining.
2.5 The quarterly accounts are revised in connection with the publication of Annual National Accounts at the end of June so that all outputs of the national accounts are consistent.
2.6 Different revision policy is used for seasonally adjusted data – see Sub-chapter 3.4
2.2 Contents published
2.7 In the deadlines of 60 and 90 days after the end of the quarter the same file of time series of the quarterly releases are published. Data on GDP based on production5, expenditure and income approaches and also time series of employment indicators6 are published. An overview of the releases (unadjusted and adjusted for seasonal influences and different number of working days) is shown in the table 2.1.
2.8 Time series at current prices are available since the first quarter of 1995. The data at average prices of previous year and at chain-linked volumes with the reference year 2010 have been published since the first quarter of 1996. The data are published at the internet address:
https://www.czso.cz/csu/czso/hdp_cr.
5 In 10 main categories of the CZ-NACE 6 The same

7
2.9 In compliance with Transmission Program ESA 2010 all required tables are sent in the term T+2 months after the end of a quarter. In addition to CZSO-website releases, these tables include also exports and imports of goods and services by Member States of EU and the Rest of the World7.
7 In the time series since the 1st quarter 2011 at current prices and since the 1st quarter 2011 at the average
prices of the previous year and at the constant prices chain-linked with the reference year 2010

8
Table 2.1: Overview of quarterly releases of season ally unadjusted data published at the CZSO websites
Seasonally unadjusted
Type of release Production approach
Expenditure approach
Income approach
Breakdown of GFCF
(P.51)
Consumption expenditure
of households by durability
Employment Hours worked
Real gross
domestic income
Sector accounts
Current prices, (CZK mil.) Yes Yes Yes Yes Yes - - - Yes
Previous year average prices, (CZK mil.) Yes Yes - Yes Yes - - Yes -
Chain-linked volumes of 2010, (CZK mil.) Yes Yes - Yes Yes - - - -
Current prices, y-o-y index, (%) Yes Yes Yes Yes Yes - - - -
Volume index, y-o-y index, (%) Yes Yes - Yes Yes - - Yes -
Implicit deflator, y-o-y index, (%) Yes Yes - - - - - - -
Number of units, (persons, thousand hours) - - - - - Yes Yes - -
Number of persons, hours, y-o-y index, (%) - - - - - Yes Yes - -

9
Table 2.2: Overview of quarterly releases of seas onally adjusted data published at the CZSO websites
Seasonally adjusted
Type of release Production approach 2)
Expenditure approach 2)
Income approach 2)
Breakdown of GFCF (P.51) 2)
Consumption expenditure
of households by durability
2)
Employment Hours worked
Real gross
domestic income
Sector accounts
Current prices, (CZK mil.) Yes Yes - - - - - - -
Previous year average prices, (CZK mil.) Yes Yes - - - - - - -
Chain-linked volumes of 2010, (CZK mil.) Yes Yes - - - - - - -
Current prices, y-o-y index, (%) Yes Yes - - - - - - -
Current prices, q-o-q index, (%) Yes Yes - - - - - - -
Volume index, y-o-y index, (%) Yes Yes - - - - - - -
Volume index, q-o-q index, (%) Yes Yes - - - - - - -
Implicit deflator, y-o-y index, (%) Yes Yes - - - - - - -
Implicit deflator, q-o-q index, (%) Yes Yes - - - - - - -
Contributions of industries to variation in GVA and to variation in GDP (percentage points)
Yes Yes 1) - - - - - - -
Number of units, (persons, thousand hours) - - - - - Yes Yes - -
Number of persons, hours, y-o-y index, (%) - - - - - Yes Yes - -
Number of units index, q-o-q index, (%) - - - - - Yes Yes - -
1) Published without exclusion of imports and also with exclusion of imports for final use 2) Adjusted by the different number of working days

10
Releases of quarterly non-financial sector accounts
2.10 All quarterly data for non-financial sector accounts are fully in compliance when the QNAs are published. Indicators for individual sectors are published the 90th day after the end of the quarter at current prices, which are not seasonally adjusted and also in time series since the first quarter 1999. The releases are also sent to Eurostat under the Transmission Programme ESA 2010.
2.3 Special transmission
2.11 All compiled tables under the Transmission Programme are transmitted to Eurostat8 through the eDAMIS system in the SDMX-ML format, and always with each data publication.
2.12 No institution or user has a right to obtain QNA estimates before official date and time of release.
2.4 Policy for metadata
2.13 QNA data for the Czech Republic are provided in compliance with the SDDS standard (Special Data Dissemination Standard) defined by the International Monetary Fund. Metadata relating to the national accounts can be found at the address:
http://dsbb.imf.org/Pages/SDDS/CtyCtgBaseList.aspx?ctycode=CZE&catcode=NAG00
8 Some data, which are part of the Transmission Program, are published only on the Eurostat web sites, not on the
CZSO websites

11
3. Basic approach to the quarterly national account s compilation
3.1 Overall compilation approach
3.1 Quarterly national accounts are compiled in compliance with the European national accounts system9 (ESA 2010). The aim of the quarterly national accounts compilation is primarily quarterly GDP estimate. Apart from this, GDP components on the side of resources and the uses are estimated.
3.2 Quarterly estimate of GDP is based especially on production approach (see Chapter 4) and expenditure approach (see Chapter 5). These two approaches are entering into balancing process as counterparties, which determine the final estimate of GDP (see Chapter 3.2.1). Table 3.1 records the GDP compilation both by approaches in the second quarter 2015, the 60th day after the end of the quarter10. Income approach of GDP estimate is also compiled on quarterly basis, however it does not enter into the balancing process with other methods11 (it is an implicit method).
Table 3.1: Compilation of GDP by production approac h and income approach – 2 nd quarter 2015, CZK million
Line Code Item Current prices
Average prices of previous
year Implicit deflator
Production approach
1 P.1 Output 2 687 636 2 691 411 99,9
2 P.2
Intermediate consumption 1 676 446 1 686 261 99,5
of which: Balance adjustment at average prices of previous year
- -1 405 -
4=1-2 B.1g Gross operating surplus 1 011 190 1 005 150 100,6
5 D.21 Taxes on products 139 002 138 035 100,8
6 D.31 Subsidies on products 29 414 28 886 99,9
7=4+5-6 B.1g* Gross domestic product 1 120 778 1 114 299 100,7
Expenditure approach
8 P.3 Final consumption expenditure 740 825 737 213 100,8
9 Households 525 874 523 850 100,5
10 Government institutions 207 706 206 210 101,5
11 Non-profit institution serving households 7 245 7 153 101,5
12 P.5 Gross capital formation 295 866 293 083 101,1
13 P.51 Gross fixed capital formation 273 282 270 144 101,5
14 P.52
Changes in inventories 21 442 21 822 125,9
15 of which: Balance adjustment at current prices 2 147 - -
16 P.53 Acquisitions less disposals of valuables 1 142 1 117 102,2
17 P.6 Exports (FOB) 953 068 955 239 100
18 P.61 Exports of goods 810 983 815 067 99,7
19 P.62 Exports of services 142 085 140 172 101,7
20 P.7 Imports (FOB) 868 981 871 236 100,2
21 P.71 Imports of goods 748 234 751 586 100
22 P.72 Imports of services 120 747 119 650 101,2
23=8+12+17-20 B.1g* Gross domestic product 1 120 77 8 1 114 299 100,7
9 Regulation (EU) No 549/2016 of European Parliament and Council on European national accounts and regional
accounts in European Union. 10 The publication, September 28 2015 11 Gross operating surplus (including mixed income) is treated as a residual item (i.e. balance item).

12
3.3 Quarterly GDP is compiled in three terms12:
• Preliminary estimate – 45th day after the end of the quarter (see Chapter 8),
• 1st standard estimate – 60th day after the end of the quarter,
• 2nd standard estimate – 90th day after the end of the quarter.
About revision policy see Chapter 2.
3.4 When compiling estimates of GDP in all three deadlines, all items needed for compilation of a balance of sources and uses of GDP (or production approach and expenditure approach) are compiled. The principles of estimate differ, in the individual deadlines, due to dependence on the availability of quarterly data. Some data sources are available already for a preliminary estimate, other data sources only for a standard estimate, some data sources are not available on a quarterly basis at all (see Chapter 3.2.4).
3.5 Thanks to relatively wide range of available data, approaches used for compilation of individual items belong especially in "direct approaches” group (§ 12.07 ESA 2010). Direct procedures are based on data sources, which are available at quarterly or shorter periodicity, which by their nature and content generally correspond to sources used for the annual national accounts compilation. In view of shorter periodicity, some quarterly (monthly) data sources are simplified in comparison with the annual versions, nevertheless when the QNAs are compiled such a fact is taken in account. Thus comparability of time series is ensured even for a period when the annual national accounts for a current year are not available.
3.6 Indirect procedures are used in the case when direct quarterly data sources are not available to the item estimate and they are usually based on the value of the annual national accounts for previous year (or on the value for the same period of the previous year) using alternative methods of development estimating from year to year.
3.7 Description of the quarterly accounts compilation in this document is primarily focused on procedures for estimating in the deadline of 60 day s after the end of the quarter, i.e. for the estimate of the quarter of the current year, when t he annual national accounts are not available . The numerical examples shown in the tables correspond to these procedures, as to the estimate 2nd quarter 2015, which was published on August 28 2015. If the procedure is different in other deadlines, the fact is mentioned in the description of the estimated relevant items
3.8 In addition to this, the chapter 3.2.2 is focused on general procedure of benchmarking of the quarterly national accounts to the annual national accounts. Thanks to a consistent revision policy of the quarterly and the annual national accounts published QNAs data are always in compliance with the annual national accounts.
3.1.1 General architecture of the quarterly nationa l accounts compilation
3.9 The process of the estimate GDP compilation in the quarters of a current year (i.e. without the annual national accounts) can be briefly described in the following steps
1. Takeover of the data sources determined for the individual components of the production approach and expenditure approach.
2. Verification of the data sources and possible corrections. 3. Extrapolated benchmarking to the annual data sources13 (it is carried out for selected items). 4. Conceptual adjustments and adjustments for the exhaustiveness of individual items.
12 Stated number of days is approximate; real term of published data also depends on calendar days 13 This is about extrapolations of the differences between the quarterly and annual data sources. In the estimates for the
quarter of the current year (i.e. in the case, when the annual data are not available), the difference between data sources of the previous year is extrapolated into a quarter of the current year

13
5. Extrapolated benchmarking to the annual national accounts 14 (it is carried out for selected items).
6. Balancing GDP using production approach and expenditure approach at current prices in order to get the GDP value at current prices.
7. Conversion of the individual GDP components of production approach and expenditure approach from current prices into prices of the previous year.15 .
8. Balancing GDP by production approach and expenditure approach at prices of the previous year in order to get the GDP value at prices of the previous year.
9. Seasonal adjusting of GDP and its components separately for current prices and chain-linked volumes with the reference year 2010.
3.10 Verification of data sources and possible correctio ns (para 3.9; the 2nd step) take place always in cooperation with data suppliers. As to the main data sources for production approach (e.g. DS89 or DS11), a working group is established, which regularly meets when data for GDP estimate are transmitted. Experts of the National Accounts Department and other industry statistics are by its members. Verification of data sources and possible corrections are in largely relates to the correct classification of units in connection with organisation changes, corrections of obvious mistakes in the survey and addition of subsequently surveyed data after processing of the data sources. Similar checks are carried out also for items on the expenditure side, in direct communication with suppliers of the input data.
3.11 Conceptual adjustments (para 3.9, step 4) are generally carried out in order to bridge differences between business accounting (most of data sources) and the national accounts methodology. Moreover, adjustments for the exhaustiveness are performed, in order to ensure full coverage of all productive activities, i.e. even those, which may not be recorded within regular survey or administrative source data16.The core (and coding) of the conceptual adjustments and adjustments for the exhaustiveness in the quarterly accounts is fully consistent with the system of the adjustments in the annual national accounts (see Table 3.2). If reliable quarterly data sources are available for individual adjustments at the time when the quarter of the current year data are compiled, then the “direct method” of the estimate is used. If data are not available for the quarter of the current year, “indirect method” of the estimate is used; the method is based on information from the previous year (usually of annual data) and auxiliary variables, which record the year-on-year development. Alternatively, expert estimation is used.
14 This is about extrapolations of differences between the quarterly and the annual national accounts. In the estimates for
quarters of a current year (i.e. when the annual data are not available), the difference between the quarterly and the annual national accounts of the previous year is extrapolated into the quarter of the current year. When annual national accounts are available (not showed in this document which describes 2nd quarter 2015), this step is substituted by the process of "benchmarking to the annual national accounts" (differences are no longer extrapolated but they are real).
15 When annual national accounts are available (not showed in this document which describes 2nd quarter 2015) process of "benchmarking to the annual national accounts at prices of the previous year" follows and subsequently step 8.
16 Within the quarterly accounts system (in order to simplify the process), so-called „extrapolation adjustments“ are also included in these adjustments, which in the annual national accounts system are recorded separately.

14
Table 3.2: Overview of the conceptual adjustments a nd adjustments for the exhaustiveness for the quarterly estimates of GDP in the current year
Code Adjustment name Estimate
methods for a current year 1)
Item
Production approach
Expenditure approach
Income approach
C01A Holding gains/losses on inventories direct P.1 (S.11, S.14)
P.52 - P.2 (S.11, S.14)
C02A Financial leasing direct P.1 (S.11, S.12)
- - P.2
C03A Goods sent abroad for processing direct - P.61, P.71 -
C03B Processing services direct - P.62, P.72 -
C03C Merchanting direct - P.61, P.71 -
C03D Operating lease and other movements without change of ownership direct - P.61, P.71 -
C03E Other adjustments of exports and imports of goods direct - P.61, P.71 -
C03F Overlap between goods and services due to outward processing
direct - P.61, P.71 -
C03G Rerouting - support for renewable sources indirect D.31, D21 - -
C03H Exports of administrative services direct - P.62 -
C03I Margins of financial dealers direct - P.62, P.72 -
C04A Wages and salaries in kind direct/ indirect P.1, P.2
P.31 (S.14, S.13) D.11
C05A Travel expenses direct P.2 (S.13) - D.11
C06 Taxes and subsidies on products/production direct P.1, D.21, D.31 - D.29
C07A Insurance/reinsurance direct P.1 (S.12), P.2 P.62, P.72, P.31 (S.14) -
C07B Export Guarantee and Insurance Corporation – EGAP direct P.1 (S.13), P.2 (S.11, S.12,S.13)
P.62 -
C07D Pension entitlements direct P.1 (S.12) P.31 (S.14) -
C08A Calculation and allocation of FISIM direct P.1 (S.12), P.2 P.62, P.72,
- P.31 (S.14)
C10B Consolidation in the energy industries direct P.1, P.2 (S.11) - -
C11A Capitalisation of small assets (over CZK 20 thousand) indirect P.2 P.51 -
C11B Capitalisation under limit of assets (to CZK 20 thousand) indirect P.2 P.51 -
C12A Treatment of multi-territory enterprises indirect - P.62 -
C13E Allocation of the Czech National Bank output indirect P.1 (S.12),
- - P.2 (S.12)
E01A Consumption of fixed capital indirect P.1 (S.13, S.15) P.3 (S.13, S.15)
-
E02 Imputed rental, paid rental etc. indirect P.1, P.2 (S.14) P.31 (S.14) -
E06C Capitalisation of software produced on own-account indirect P.1 (S.13) P.51 -
E07A Capitalisation of expenditures on research and development indirect P.1, P.2 P.51 -
E08A Natural growth of forests (standing timber) indirect P.1 P.52 -
E09C Notional units - non-residents owned the land and dwellings in the economic territory of the Czech Republic
indirect - P.62 -
E09D Notional units – dwellings and land owned by Czech residents abroad indirect - P.72 -
E10F Foreign workers direct - P.62, P.72, D.11,
D.12 P.31 (S.14)
NX Non-observed economy (informal, illegal, hidden) indirect P.1 (S.11, S.14) P.61. P.62,
P.71, P.72, P.31 (S.14),
D.11 P.2 (S.11, S.14)
"Direct method" indicates that the estimate is carried out on basis of current data for the quarter. "Indirect method" indicates that the data are not available in the current quarters of the current year; therefore the estimates are usually based on data from the previous year.

15
3.12 Other steps relating to the overall procedure, i.e. extrapolation of differences between annual and quarterly data sources (or quarterly and annual national accounts) as well as balancing , conversion of items into the previous year prices and seasonal adjustments are described in more detail in the individual subchapters of this chapter.
3.13 From a technical point of view, quarterly accounts compilation is based on an interconnected system of files of MS Excel application. Standardized models of files are used for all estimated items, especially for benchmarking to the annual data or for conversion into the prices of the previous year. Analyses of individual data obtained from the statistical survey (or from administrative data) are carried out usually through the MS Access application or PL-SQL Developer application.
Classifications used for the quarterly estimates
3.14 Standardized classifications used for the annual national accounts are also used for the quarterly estimates. These are mainly:
1. Classification of economic activities (CZ-NACE17), 2. Statistical Classification of products (CZ-CPA), 3 Classification of the institutional sectors (Sectors by ESA 2010), 4 Classification of individual consumption by purpose (CZ-COICOP), 5. Classification of fixed assets (AN by ESA 2010).
3.15 Generally speaking, within the quarterly accounts more aggregated classification and nomenclature are used than in the annual national accounts.
3.16 The Classification of economic activities (CZ-NACE ) is used .e.g. in estimates of output, intermediate consumption, compensation of employees, or employment. In principle it is the two-digit level of the CZ-NACE (i.e. 44 industries), while the annual national accounts usually use a combination of two and three-digit level (i.e. 120 industries). The outcomes of the quarterly national accounts are published on the level of 10 industries (aggregated CZ-NACE sections).
3.17 Statistical Classification of products (CZ-CPA) is used, e.g. when exports and imports or subsidies on products are compiled, namely on the two-digit level. This classification is (for purposes of conversion into the prices of the previous year) also used for other items with the fact that splitting into the individual commodity groups is carried out by a model, usually based on the supply and use tables of the latest available annual data. The annual national accounts (input–output tables) use two-digit level within the preliminary version and within the semi-final version they use three-digit level.
3.18 Classification of institutional sectors (CISS) by ESA 2010 is used especially for the estimates of output, intermediate consumption, final consumption expenditure, and gross fixed capital formation, compensation of employees or other taxes and subsidies on production. Splitting by sub- sector has not been used with the exception of the general government and financial corporations. Different data sources for individual sectors and also different methodological adjustments, which are applied in each sector are the main reason for the estimates of each items by sector in the quarterly GDP.
3.19 Classification of individual consumption by purpose (CZ-COICOP) is used for the estimate of the final consumption expenditure of households (for 47 groups). For the publication purposes the data are split to four categories by durability (durable goods, semi-durable and non-durable goods and services).
3.20 Classification of fixed assets (AN) is used to estimate gross fixed capital formation. There are five categories:
• Dwellings,
• Other buildings and structures,
17 The classification is fully linked with the NACE, Rev.2

16
• Transport equipment,
• Other machinery and equipment,
• Cultivated biological resources,
• Intellectual property products.
3.2 Balancing, benchmarking and other reconciliatio n procedures
3.2.1 Quarterly GDP balancing procedure
3.21 As mentioned above, GDP is estimated independently by two approaches – the production approach and the expenditure approach. Difference between the two approaches is eliminated within the balancing process. Published releases show no discrepancy between components of GDP18.
3.22 There are two, completely separated balance processes that are carried out during the GDP estimation (seasonally unadjusted data)
• Balancing of GDP at current prices,
• Balancing of GDP at average prices of the previous year.
3.23 Production approach has long been considered to be more reliable as to the GDP estimate at current prices. Therefore, the balancing difference19 at current prices is allocated on the use side, in the most cases into the changes in inventories item .
3.24 On the contrary, the conversion of individual items of the expenditure approach to the prices of the previous year is considered to be more reliable than the conversion of the output and the intermediate consumption. Therefore the balancing difference at prices of previous year is usually allocated into intermediate consumption.
3.25 Table 3.3 records the balancing difference between production and expenditure approach when estimating the second quarter 2015 at 60th day after the end of the quarter, both at current prices and at prices of the previous year. Table 3.1 also records the difference under items in which the difference has been allocated, within the balancing process.
Table 3.3: Balancing difference between production and expenditure approach – 2 nd quarter 2015 CZK million
Line Code Item Current prices
Average prices of the previous year
1 B.1g* Production approach – GDP 1 120 778 1 112 894
2 B.1g* Expenditure approach – GDP 1 118 631 1 114 299
3 Balancing difference 2 147 -1 405
4 Balancing difference - % GDP by production approach 0,19 -0,13
3.26 Besides of mentioned balancing processes, it carries out also balancing of seasonally adjusted data. (See Chapter 3, part 3.4.2).
18 With the exception of the time series at the constant prices chained (2010=100) where, however, the discrepancy
arises from the nature of the chaining method.. 19 This is the difference between the sum of the GDP components calculated by the production and the expenditure
approach.

17
3.2.2 Benchmarking of QNA and ANA
3.27 Benchmarking is the integral part of the process of compiling quarterly national accounts and it is carried out at the most detailed possible level of compilation. Quarterly data are benchmarked at the corresponding annual data mainly using the pro-rata method. This means that the annual values are split pro-rata according to proportions of the source data in the four quarters.
3.28 The proportion of the last available annual value t o the sum of the corresponding quarterly values is extrapolated to the quarter for which annual data are not available (see part 3.9, steps 3 and 5). This ensures continuity at the previous time series and the future revisions are minimized.
3.29 Benchmarking of seasonally adjusted data is described in the part of the chapter 3.4.2.
3.30 In 2014, the major revision of the annual national accounts was finalised (from 1995 to 2013). The revision included many methodological changes in order to ensure compliance with the new standard ESA 2010. In view to the unavailability of suitable quarterly source data, the revision of QNA has been carried out by a simplified way on higher level of aggregation, on the principle of the proportional model of the Cholette-Dagum method20. The aim of this method is to maintain short-term development of the original quarterly data as much as possible under the benchmark value given by the annual values.
3.2.3 Other harmonisation procedures
3.31 All harmonisation procedures are described in the previous chapters.
3.2.4 Amount of model estimation in various release s
3.32 The rate of model estimations in the 1st and 2nd standard term differs from each other due to different levels of data availability and revision policy. In principle, the later deadline, the greater availability of data. In some cases, data are not available even for the 2nd standard term and therefore they are not used until refining the estimate of the quarter during the estimate in the following quarters. In addition, it is also important specification of so called "hard" data” for the previous quarters or of all quarters of the current year; it is usually carried out within the estimate of the current quarter. However, this refining does not affect the rate of modelling estimates.
3.33 For the purposes of this document, a rough estimate of rate of modelling for the main GDP components was performed, both for the production and the expenditure approach21. This estimation of the modelling rate is based on the assumption that the source data22 used to estimate an item are treated as "hard data". On the contrary, all the conceptual adjustments and adjustments for the exhaustiveness are treated as imputations, extrapolations and models if they are not fully based on surveyed data, in the period of the current estimate. Therefore, the modelling rate is treated as a share of the imputation, the extrapolation and the models to the total value of the component. However, this splitting is rather approximate, because some data sources could be, under certain conditions, also treated as the model estimates23 and also some conceptual adjustments and adjustments for the exhaustiveness, which are based both on the models and on the hard data. However, for the purposes of the rough estimate, it was sufficient to carry out this splitting only approximately.
20 The Cholette-Dagum method is recommended and more in detail described within the IMF Manual “Quarterly National Accounts Manual”, 2001. 21 Based on data for the 2nd quarter 2015 (using data of the 1st standard estimate) 22 Or data inputs mentioned for each item in the relevant chapters. 23 In the case of some data sources gross-up for the exhaustiveness is carried out or their estimation is based on
development of data sources of selected indicators from the statistical surveys for the quarter.
18
3.34 In the case of gross value added the modelling rate oscillated around 22%. In principle, this rate is stable for all deadlines of estimates (the 1st and the 2nd standard estimate, incl. refining of the quarter data when the estimate, for the next quarter, is carried out).
3.35 However, when GDP is estimated by the production approach , the modelling rate decreases with later releases of the GDP estimates. When the estimate is carried out in the deadline of 60 days after the end of the quarter the modelling rate varies around 30%, while if the deadline is 90 days after the end of the quarter (when the QSA is published) the rate of modelling is around 20%. The reason for this decreasing is the availability of data for major item of taxes on products 24 for the 2nd deadline of the standard estimate.
3.36 As to the expenditure approach , the modelling rate is for the 1st and the 2nd standard estimate, identical . However, in some cases, it can happen that the rate of modelling can be reduced due to latter refinement, e.g. when the estimate is carried out in the next quarter25.
3.37 The modelling rate relating to the final consumption expenditure of households oscillates around 30%, especially in connection with the imputed rent, non-observed economy and insurance26.
3.38 As to final consumption expenditure of government institutions, the rate of modelling oscillates around 23%, especially in connection with the fixed capital consumption. Final consumption expenditure of non-profit institutions is fully modelled.
3.39 Rate of modelling the gross capital formation oscillates around 40%, especially due to the estimate of considerable part of the gross fixed capital formation27. As to changes in inventories, the rate of modelling oscillates around 16%.
3.40 Rate of modelling of exports and imports of goods and services is relatively low, it oscillates around 4%. Items that must be modelled due to unavailability of “hard data” in both the standard deadlines of the estimates28 or due to unavailability of any “hard data” in the quarters of the current year29 are relatively insignificant. Although there are many different conceptual adjustments, especially for exports and imports of goods, almost all the adjustments are based on “hard data” surveyed for the quarter.
3.41 Rate of modelling in the case of GDP as a whole, from the view of the expenditure approach, is lower than if the production approach is used, i.e. about 12 %. Nevertheless, the reason why there is more emphasis on the production approach than on the expenditure approach is the higher reliability of source input data in comparison with the expenditure approach items.
3.3 Volume estimates
3.3.1 General volume policy
3.42 Estimate of volumes of macroeconomic aggregates generally laid in two the main steps:
1. Conversion of an indicator at the current prices to the average prices of the previous year (using corresponding price indices);
24 Value added tax, consumer tax on tobacco products and the consumer tax on fuel. 25 For instance, data on exports and imports of tourism services are usually available only in the time of estimates of the
following quarter. 26 Rate of estimate may differ depending on the quarter. For example, in comparison to other quarters, the rate of the
estimate in a 3rd quarter is significantly affected by adjustments for self-supply. 27 i.e. capitalisation of small and under-limit assets, capitalisation of R&D expenditure; individual residential
construction and reconstruction and upgrade. 28 The estimate for the tourism based on surveyed data for the quarter, is used when the quarter data are refined, i.e.
when the next quarter data are published. 29. For instance, non-observed economy

19
2. Chain-linking an indicator at the average prices of the previous year in order to obtain time series at the previous year’s prices, i.e. for the calculation of the volume index30.
3.43 Conversion of an indicator at the current prices to the average prices of the previous year is proceeding by following way:
1. Accepting of the relevant quarterly basic indices from the price statistics (usually the average of 2010=100).
2. The calculation of the annual price basic index as a weighted average of quarterly basic indices, where the weights are quarterly values of an indicator at current prices, to which quarterly price indices will be applied.
3. The calculation of the quarterly price indices to the average of the previous year as a proportion of the quarterly price basic index and the annual price basic index of the previous year.
4. The calculation of an indicator at average prices of the previous year as an indicator at the current prices divided by the quarterly price index to the average of the previous year.
3.44 Chaining of quarterly data is proceeding by so called “annual overlap ” method: data at prices of the previous year are converted to the average prices basic (reference) year at the prices of the previous year using annual deflators. This method is used by the most of EU countries and it ensures to meet the requirement of consistency, because the annual sum of the quarterly chained data is equal direct to chained annual value of an indicator. Another advantage of this technique is the possibility of aggregation and decomposition of chain-linked time series without the necessity of additional adjustments.
3.45 Development of the volume is published in the following form:
• Data at prices of the previous year in CZK million;
• Chain-linked data with the reference year 2010, in CZK million;
• Year-on-year31 changes of the volume in %, i.e. real growth rate compared to the same quarter of the previous year;
• The year-on-year deflator in %, i.e. changes compared with the same quarter of the previous year;
• Contributions to the GDP changes;
• Quarter-on-quarter32 changes of the volume in %, i.e. real growth rate in comparison to previous quarter.
3.46 More concrete information on conversion of the corresponding indicator to the prices of the previous year is stated within the individual chapters describing the estimate of the items.
3.3.2 Chaining and benchmarking
3.47 Quarterly data at average prices of the previous year are benchmarked on corresponding annual data mainly using the pro-rata method. Benchmarking of the chain-linked quarterly time series is not necessary due to the fact that the quarterly data are chain-linked using the “annual overlap” method.
3.48 The seasonal adjustment of volume indicators is carried out after chaining. GDP is seasonally adjusted directly, but some aggregates at average prices of the previous year are derived indirectly (e.g. the total final consumption expenditure is derived as the sum of final consumption expenditure of households, government institutions and non-profit institutions serving households
30 This method (chain-linking) is used since 2004 in both annual and also quarterly national accounts. It ensures smaller
inaccuracies when the volume index is calculated, which are caused by the gradual obsolescence of weighting schemes of one base year.
31 The same quarter of the previous year is equal 100 32 The previous quarter is equal 100%
20
3.49 The adjusted data are benchmarked to directly calculated chain-linked annual data.
3.50 The next step is the conversion of the benchmarked chain-linked time series to the average prices of the previous year. Adjusted data at average prices of the previous year are subsequently balanced, i.e. consistency between GDP and the sum of its individual components is enforced. A discrepancy between GDP and the sum of its components is pro-rata allocated into individual components (expenditure approach) and into taxes on products (production approach). Balanced components of GDP are then again chained with the aim to obtain chain-linked adjusted time series.
3.4 Seasonal and calendar adjustment
3.51 The majority of aggregates of the quarterly accounts contain a significant seasonal component. Seasonal fluctuations can cover significant short-term and long-term movements in the time series and thereby limit the understanding of the phenomenon observed in the corresponding time series. The main aim of seasonal adjustment is to filter out normal seasonal fluctuations from the course of the examined time series.
3.52 In addition to the seasonal adjustment, adjustments for calendar effects is carried out, because some aggregates of the quarterly accounts are also affected by the structure of the calendar. It proceeds independently from the seasonal adjustment procedure. Both adjustments are carried out by the TRAMO/SEATS method, but at different phases and at different level of aggregation. By this way higher credibility of the calendar and seasonal factors is achieved. Adjusting for the calendar effects is carried out by the indirect method on the lowest available level of the aggregation. On the contrary seasonal adjustment often gives the best results when it is carried out at higher degree of aggregation
3.4.1 Policy for seasonal adjustment
3.53 The calculations are carried out using the second part of the TRAMO/SEATS method (i.e..SEATS method), which is based on the decomposition of the ARIMA model. This adjustment method is carried out through the software instrument Demetra+. This instrument allows automatic detection of distant observation and the selection between the additive and the multiplicative model according to the available testing criteria. Seasonal adjustment is carried out separately for data at current prices and at chain-linked volumes. Adjusted deflators are derived implicitly
3.54 For practical reasons, time consistency between seasonally adjusted quarterly data and corresponding seasonally non-adjusted annual data is ensured in the Czech quarterly national accounts. Benchmarking is based on the proportional principle of the model multiplication of the Cholette-Dagum method. The advantage of this method is minimization of the impact on the characteristics of the original time series. Reference data are original seasonally unadjusted annual values if the correction for calendar effects is not carried out or they are it the annual values adjusted for calendar effects, if this correction is performed. Annual values adjusted for calendar effects are derived as the sum of corresponding adjusted quarterly values.
3.55 GDP is adjusted directly. The discrepancy between GDP and the sum of its components by three types of calculation approaches (expenditure, production and income) are allocated by a specific way for each of these approaches without affecting GDP. On the uses side discrepancies between GDP and the sum of GVA and subsidies on products are pro-rata allocated into taxes on products. As to the income approach, discrepancies are allocated into an operating surplus and mixed income.

21
3.4.2 Policy for calendar adjustment
3.56 The corrections for calendar effects are made before the seasonal adjustment. For all aggregates is applied the regression approach with modelling of random components using the ARIMA model. The correction for calendar effects is carried out only for the time series in which the influence of the calendar is statistically significant and matter-of-factly explainable. In all cases, a specific calendar for the Czech Republic is applied. The influence of the calendar is corrected in the following time series:
• Output and intermediate consumption – NACE B, CA-CC, CE-CH, CJ-CM, F, G, H,
• Final consumption expenditure of households – COICOP 011, 012, 032, 043, 051-061, 071–082, 092, 093, 121, 123,
• Gross fixed capital formation – dwellings, other buildings and structures, transport equipment, machinery and equipment,
• Exports and imports of goods - CPA 05, 08, 10–11, 13–18, 20-25, 27–29, 31–32,
• Exports and imports of services – transport.
3.57 GDP data are obtained from the resource side, which is considered for more precise. The discrepancy between GDP and the sum of components on expenditure side is allocated into changes of the inventories. As to types of the calendar effects, distinguishing working days and non-working days and an effect of Easter holidays is taken into account.
3.58 A specific calendar for the Czech Republic is used. As a result of the inclusion of the public holidays the calendar effect contains an important seasonal component. According to the Manual “ESS guidelines on seasonal adjustment“, the adjustment for working days should eliminate only unseasonal part of the calendar effect. Therefore, a regression variable that includes deviations of the original variable from long-term averages for each quarter is used.
3.59 Table 3.4 illustrates the average influence of an additional working day on the year to year development (in percentage points; volume indices).
Table 3.4: Average impact of one working day on the year-to-year index, in percentage points; volume indices
Code Item Influence
P.1 Output 0,41
P.2 Intermediate consumption 0,47
P.3 Final consumption expenditure of households 0,19
P.51g Gross fixed capital formation 0,74
P.6 Exports of goods and services 0,73
P.7 Imports of goods and services 0,71
B.1g Gross value added 0,33
B.1*g Gross domestic product 0,3
3.4.3 Revision policy of the seasonal adjusted data
3.60 The revision policy of the seasonally adjusted data is different from the one that is used for the unadjusted data (see Chapter 2).
3.61 Once a year, i.e. when the estimate of the first quarter is carried out, the time series of the seasonal adjusted data are revised. In the course of the revision new models and estimates of their

22
parameters are identified. In this period, they can be implemented possible methodological changes (e.g. transition to a new version of the adjustment method)33.
3.62 Except this annual updating of the seasonal adjustment models, revisions of seasonally adjusted data are limited only to the periods in which non-adjusted data are specified. The adjustment of new or revised unadjusted data, between the revision periods, predictions of the calendar and seasonal factors are used.
33 This change took place, e.g. on the occasion of the estimate for the first quarter 2016, when the time series was
divided (for purposes of the seasonal adjustment) into two period, which they differ by the nature of the seasonal behaviour ( i.e. from the 1st quarter 1995 to the 4th quarter 2013 and since the 1st quarter 2014 further)

23
4 GDP components: the production approach
4.1 Gross value added, including classification by industry
4.1 Gross value added (GVA) is estimated as difference between output and intermediate consumption. The estimate is carried out for individual institutional sectors in splitting to 44 industries by CZ-NACE.
4.2 Calculation of the output and intermediate consumption at current prices is carried out for individual sectors by different way. In the case of non-financial corporations (S.11) and households (S.14) the estimate of the output is based on indicators for sales and on other supplementary indicators and the estimate of the intermediate consumption is based on the indicator of the production consumption. As to general government sector (S.13) and non-profit institutions serving households (S.15) the output is estimated by the cost method and intermediate consumption is estimated according to production consumption, similarly as for market producers. The estimate of the output and the intermediate consumption for financial corporations (S.12) is completely different from other sectors. Following sub-chapters are dedicated to more detailed description of GDP estimation by individual sector.
Gross value added in the non-financial corporations sector (S.11) and in the households sector (S.14)
4.3 The primary data source for the calculation of output and intermediate consumption for the non-financial corporations sector and the households sector is quarterly statistical survey P 3-04 (DS89, see Chapter 9). Indicators are grossed-up to the basic population, broken down into 88 industries on two-digit level CZ-NACE and by size of reference unit to below the threshold (to 20 employees) and above the threshold (over 20 employees).
4.4 Tables 4.1 and 4.2 record calculation of the output based on indicators contained in data sources; the intermediate consumption corresponds to the production consumption indicator.
Table 4.1: The calculation of the output and the in termediate consumption based on the main data source (DS89) for the non-financial corporations se ctor – 2 nd quarter 2015
CZK million
Line Code
of data source
Item
S.11
Total
of which
>20 employees
< 20 employees
1=2+3+4+5-6
DS89
Output (data sources) 2 118 948 1 809 687 309 261
2 Sales of goods 1 039 624 864 763 174 861
3 Sales of own products and services 1 942 865 1 668 871 273 994
4 Change in inventories of the own activity 15 982 14 532 1 450
5 Capitalisation 16 944 15 264 1 680
6 Costs of goods sold 896 467 753 742 142 726
7=8 DS89
Intermediate consumption (data sources) 1 526 375 1 302 319 224 056
8 Production consumption 1 526 375 1 302 319 224 056
9=1-7 Accounting value added 592 573 507 368 85 205
24
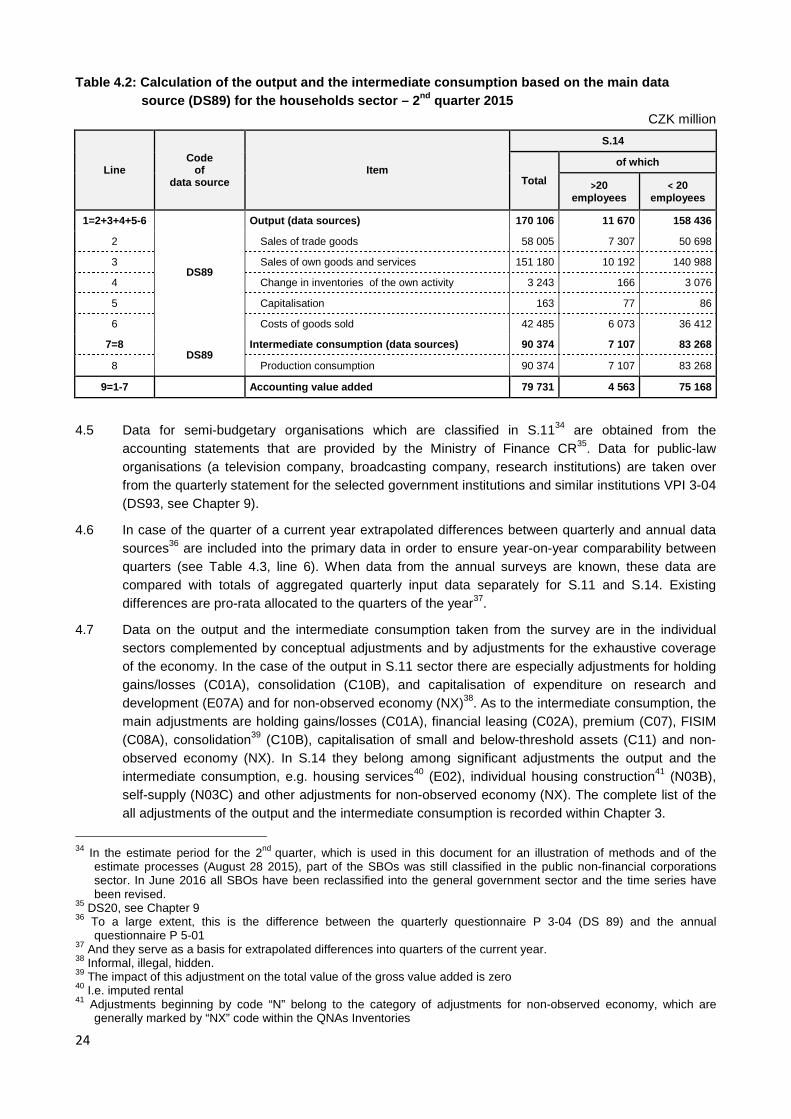
Table 4.2: Calculation of the output and the interm ediate consumption based on the main data source (DS89) for the households sector – 2 nd quarter 2015
CZK million
Line Code
of data source
Item
S.14
Total
of which
>20 employees
< 20 employees
1=2+3+4+5-6
DS89
Output (data sources) 170 106 11 670 158 436
2 Sales of trade goods 58 005 7 307 50 698
3 Sales of own goods and services 151 180 10 192 140 988
4 Change in inventories of the own activity 3 243 166 3 076
5 Capitalisation 163 77 86
6 Costs of goods sold 42 485 6 073 36 412
7=8 DS89
Intermediate consumption (data sources) 90 374 7 107 83 268
8 Production consumption 90 374 7 107 83 268
9=1-7 Accounting value added 79 731 4 563 75 168
4.5 Data for semi-budgetary organisations which are classified in S.1134 are obtained from the accounting statements that are provided by the Ministry of Finance CR35. Data for public-law organisations (a television company, broadcasting company, research institutions) are taken over from the quarterly statement for the selected government institutions and similar institutions VPI 3-04 (DS93, see Chapter 9).
4.6 In case of the quarter of a current year extrapolated differences between quarterly and annual data sources36 are included into the primary data in order to ensure year-on-year comparability between quarters (see Table 4.3, line 6). When data from the annual surveys are known, these data are compared with totals of aggregated quarterly input data separately for S.11 and S.14. Existing differences are pro-rata allocated to the quarters of the year37.
4.7 Data on the output and the intermediate consumption taken from the survey are in the individual sectors complemented by conceptual adjustments and by adjustments for the exhaustive coverage of the economy. In the case of the output in S.11 sector there are especially adjustments for holding gains/losses (C01A), consolidation (C10B), and capitalisation of expenditure on research and development (E07A) and for non-observed economy (NX)38. As to the intermediate consumption, the main adjustments are holding gains/losses (C01A), financial leasing (C02A), premium (C07), FISIM (C08A), consolidation39 (C10B), capitalisation of small and below-threshold assets (C11) and non-observed economy (NX). In S.14 they belong among significant adjustments the output and the intermediate consumption, e.g. housing services40 (E02), individual housing construction41 (N03B), self-supply (N03C) and other adjustments for non-observed economy (NX). The complete list of the all adjustments of the output and the intermediate consumption is recorded within Chapter 3.
34 In the estimate period for the 2nd quarter, which is used in this document for an illustration of methods and of the
estimate processes (August 28 2015), part of the SBOs was still classified in the public non-financial corporations sector. In June 2016 all SBOs have been reclassified into the general government sector and the time series have been revised.
35 DS20, see Chapter 9 36 To a large extent, this is the difference between the quarterly questionnaire P 3-04 (DS 89) and the annual
questionnaire P 5-01 37 And they serve as a basis for extrapolated differences into quarters of the current year. 38 Informal, illegal, hidden. 39 The impact of this adjustment on the total value of the gross value added is zero 40 I.e. imputed rental 41 Adjustments beginning by code “N” belong to the category of adjustments for non-observed economy, which are
generally marked by “NX” code within the QNAs Inventories

25
4.8 If there are differences between quarterly and annual values of the output and the intermediate consumption in individual industries in the previous years, then these differences are extrapolated into the quarters of a current year. (See Table 4.3, line 12). Thanks to this, full data comparability is preserved in the time series.
4.9 Quarterly data for individual quarters can be additionally manually balanced. As to the quarter of the current year, year-on-year and quarter-on-quarter development is determining for these adjustments. As to years, when the annual national accounts are available, an adjustment may be carried out only within the industry so that the sum of the data of four quarters was always in compliance with the annual data.
Table 4.3: Calculation of gross value added for non -financial corporations and households sectors – 2nd quarter 2015
CZK million
Line Code
of data source
Item S.11 S.14
1=2+3+4 Data sources 607 487 79 731
2 DS89 of which P 3-04 survey 592 573 79 731
3 DS93 VPI 3-04 survey 1 806 -
4 DS20 Profit and Loss Statement for
semi-budgetary organisations (accounting statement)
13 109 -
5 Corrections in data sources 1 842 1 080
6 Extrapolated benchmarking to annual data sources -2 885 -23 341
7=1+5+6 Data inputs 606 444 57 470
8 Conceptual adjustments 42 225 51 362
9 Adjustments for exhaustiveness 28 677 77 784
10 Extrapolated corrections from the balancing the ANA -3 183 -1 287
11 Other adjustments -4 620 0
12 Extrapolated benchmarking to the ANA -16 101 -4 987
13=7+8+9+10+ 11+12 B.1g Sector, total 653 442 180 342
Gross value added in the financial corporations sec tor (S.12)
4.10 The quarterly estimate of gross value added is calculated separately for the central bank, commercial banks and cooperative credit unions and for the other non-bank financial institutions, insurance companies and pension funds. The procedure is in principle the same as in the annual national accounts.
4.11 Output of the Czech National Bank (CNB) is calculated by the cost method. It means that within the total output personal and social expenditure, depreciation of tangible and intangible assets and intermediate consumption are included. The intermediate consumption consists of the costs of fees and commissions, the cost of printing banknotes and minting coins, purchased output and other operating costs. The difference between total output (calculation cost method) and revenue from fees and commissions are allocated to the intermediate consumption of subsectors S.122 and S.125. Input data are taken over from the Profit and Loss Statement of the CNB (DS70, see Chapter 9).

26
4.12 Institutions receiving deposits (i.e. commercial banks and cooperatives banks42) provide its Profit and Loss Statements to the CNB and the CZSO obtains these data quarterly in aggregated form (DS42). The output for these units is based on returns from fees and commissions and on the other operating returns. The FISIM43 estimate also enters to the output (see the part 4.2). The intermediate consumption is the sum of payments for fees and commissions, other operating costs and the other administrative costs.
4.13 Quarterly estimates for the non-banking financial institutions 44 are compiled on a basis of the quarterly statistical survey and administrative data provided by the CNB. According to the accounting system used by the financial institutions the CZSO uses two forms of data collection:
1. Units, which keep bookkeeping in compliance with the accounting system determined for banks (investment companies, investment funds and licensed brokers – securities dealers). The CNB provides data for these units. The statements are determined for needs of the banking statistics (DS42, DS45, DS50).
2. Units, which keep bookkeeping in compliance with the accounting system determined for entrepreneurs (units providing financial leasing and units which ensure other financial intermediation or ensure other auxiliary activities relating to the financial intermediation output). The CZSO performs survey for these units through its own “Quarterly statistical survey for other financial institutions” Pen 3-04 (DS08). The calculation of the output and the intermediate consumption is similar as in the case of the institutions receiving deposits (see part 4.12).
4.14 Market output (P.11) of insurance and reinsurance companies is equal to the sum of life insurance, non-life insurance, reinsurance and other output of insurance and reinsurance companies. The service of insurance and reinsurance is not explicitly, by the insurer, charged, its amount is estimated. These estimates are based on the quarterly surveys compiled by the CNB (DS54 and DS75).
4.15 Output of non-life insurance is the service provided to policyholders (clients). The estimate method of this output is fully in compliance with ESA 2010, determined by the following formula.
The non-life insurance output =
Premiums earned
plus Premium supplements
minus Adjusted claims incurred
Incurred claims consist of the written gross premiums and of the change in insurance technical reserves seasonally adjusted for holding gains and losses; and afterwards the incurred claims are adjusted for losses arising from catastrophes surveyed by the Czech Association of Insurance companies (DS79).
4.16 Output of non-life insurance is service of an insurer and it is consumed by households as final consumption and by other sectors as intermediate consumption. Part of the service of the non-life insurance is attributable to non-residents as exports. The services of buildings insurance to households are consumed as an intermediate consumption of households sector and it is entering methodological adjustment as the imputed rentals (E02A, see Chapter 3). The service of the non-life insurance is allocated to the sectors on the basis of the proportion of the sector on gross written insurance premiums from the results of the annual statistical survey (i.e. for the last known year).
42 CZ-NACE 64.19 43 Financial intermediation services indirectly measured 44 CZ-NACE 64 and CZ-NACE 66

27
4.17 Output of life insurance is service provided by insurance companies to domestic or non-resident households. The estimate method of the insurance service is based on the following formula:
Non-life insurance output =
Premiums earned plus Premiums supplements minus Benefits due minus Change in insurance technical reserves adjusted for holding gains and losses.
4.18 Service of life insurance is output of an insurer and it is consumed by domestic households as the final consumption. Part of the service of the life insurance attributable to non-resident households is exports. Service of this insurance is allocated to the sectors on the basis of the proportion of the sector on gross written insurance premiums from the results of the annual statistical survey (i.e. for the last known year).
4.19 Output of the reinsurance is service provided by a reinsurer to resident and non-resident insurers. The output of the reinsurance companies is excluded from the calculation of the output of direct insurance. Service charge is estimated by the similar way as for the non-life direct insurance; however specific payments relating to the reinsurance are entering into the estimate method, in the form of commissions due and shares on profit. The estimate method consists of the earned premium, premium supplements and incurred claims, of the adjustments for losses arisen from catastrophes and of changes in insurance technical reserves adjusted for holding gains and losses.
Simplified by the following formula:
Reinsurance output =
Premiums earned plus Premiums supplements minus Adjusted claims incurred
4.20 The service of reinsurance is output of a reinsurer and it is consumed by resident insurers as intermediate consumption. Part of the service of the reinsurance is attributable to non-resident insurers as exports. Most of the policyholders are non-residents, i.e. the services of the reinsurance are predominantly exported. The output is allocated to the sectors on the basis of the proportion of the sector on gross written insurance premiums from the results of the annual statistical survey (i.e. for the last known year).
4.21 Intermediate consumption is largely constituted by the passive reinsurance, i.e. thus service of reinsurance, which is consumed by the domestic insurance companies and the reinsurance companies. Total passive reinsurance is calculated as the difference between earned reinsurance and adjusted incurred claims. In addition to the passive reinsurance, costs of acquiring of insurance policies, administrative overhead costs, cost of administering financial investments and other expenses enter intermediate consumption. However, wages and other personnel costs, depreciation, interest, insurance and other costs, which are part of the distribution transactions, are excluded. The intermediate consumption is further decreased by levies of the statutory accident insurance contributions to the state budget.
4.22 Model of calculation of the pension companies output is based on the definition of the defined contributions pension scheme according to the § 17.54 ESA 2010. Market output of the pension companies is calculated as the sum of social contributions, supplementary contributions of households after deducting of the paid benefits and increase/decrease of the pension claims (DS53, DS72, see Chapter 9). The main part of the output is recorded as consumed by households through the transaction in provided services by the pension companies and it is a part of final consumption expenditure of households.

28
4.23 Intermediate consumption consists mainly of the item of costs on fees and commissions (DS53, see Chapter 9), which includes costs for remunerations to the depository, payments for the portfolio administration and intermediary contracts, costs for fees for the settlement of transactions in investment instruments to intermediaries and payments to the securities dealers and other costs for the fees and commissions. This item also includes payments to the Pension Company and fees paid to the bank. Intermediate consumption includes further other administrative costs (e.g. the costs of promotion and advertising and other costs for support of sales, rentals, IT costs, legal and tax consulting services, outsourcing, energy consumption). In this item administrative costs including purchases of materials and energy consumption are also included.
4.24 Output of the pension funds is calculated by the cost method. The total output includes intermediate consumption, other taxes and subsidies on production, compensation of employees, and consumption of fixed capital (CFC) and net operating surplus. Because of the pension companies charge all these items (except the intermediate consumption), the pension funds show zero value added.
4.25 In addition to source data, the estimate of output and intermediate consumption for S.12 is complemented by the conceptual adjustments and by the adjustments for the exhaustiveness of coverage of the economy (C02A, C04A, C08A, E07A in output and C02A, C04A, C07A, C07B, C08A, C11A, C11B, C13E in intermediate consumption45).
4.26 Similarly as in the sectors S.11 and S.14, the differences between the annual and the quarterly data sources and the annual and the quarterly national accounts are extrapolated (according to these known differences of the last year, for which annual data are available). If the data for the year are known, the difference between quarterly and annual data is pro-rata allocated into the individual quarters of the year.
Tables 4.4: Calculation of the gross value added in the financial corporations sector – 2 nd quarter 2015 CZK million
Line Code
of data source
Item S.12
1=2+3+4+5 Data sources 24 007
2 DS08,DS42, DS45,DS50,DS70
of which: Financial intermediation 13 360
3 DS54,DS75,DS79 Insurance and reinsurance 7 018
4 DS53,DS72 Pension companies 716
5 DS08 Auxiliary financial institutions 2 913
6 Corrections in data sources 0
7 Extrapolated benchmarking to annual data sources 1 621
8= Data inputs 25 628
1+6+7
9 Conceptual adjustments 15 856
10 Adjustments for exhaustiveness 141
11 Extrapolated corrections from the balancing of the ANA 0
12 Other adjustments 0
13 Extrapolated benchmarking to the ANA 3 062
14=8+9+10+11+12+13 B.1g Sector, total 44 687
45 For more details, see Chapter 3

29
Gross value added in the general government sector (S.13)
4.27 Quarterly data sources for the general government sector are similar to those which are used in the annual national accounts (DS18-20, DS24, DS38, DS61, DS76, DS92 and DS93; see Chapter 9). Quarterly data are taken over both from the Ministry of Finance database46 for so called selected accounting units47 (i.e. Organisational Units of the State, Extra-budgetary State Funds, Territorial Self-governing Divisions, Voluntary Associations of Municipalities, Regional Councils of Cohesion Regions and Semi-budgetary organisations), and from the statistical survey (universities48, health insurance companies49). Some government institutions provide their individual accounting statements (e.g. the Support Guarantee and Agricultural and Forestry Fund, the Railway Infrastructure Administration, etc.50).
4.28 Data from the accounting statements, budgetary classification or statistical statements are then transformed into the indicators in the national accounting concept.
4.29 Similarity of data sources for the quarterly and the annual national accounts make it possible using similar procedures for compiling the QNA for S.13 as for the ANA. The cost method is used for the calculation of non-market output, i.e. it is the sum of intermediate consumption, compensation of employees, fixed capital consumption and other taxes on production payable. Data on intermediate consumption, compensation of employees and data on taxes on production are available. Quarterly fixed capital consumption (E01A, see Chapter 3) is estimated in splitting according to sub-sector, industry and by type of assets.
4.30 The most significant conceptual adjustment is the capitalisation of expenditure for research and development (E07A, see Chapter 3), which is a part of the output for own final use, and exclusion of the value of the small and below-threshold assets (C11, see Chapter 3) from the intermediate consumption and its including into gross fixed capital formation item.
4.31 Market output contents revenue from sales of services and products at market prices.
Table 4.5: Calculation of gross value added in the general government sector – 2 nd quarter 2015 CZK million
Line Code
Item Activity
Market Non-market Total
1=2+3+4+5 P.1 Output 6 266 170 589 176 855
2 P.2 Intermediate consumption - 47 152 -
3 D.1 Compensation of employees - 76 290 -
4 P.51c Consumption of fixed capital - 46 961 -
5 D.29-D.39 Other taxes minus other subsidies
on production - 186 -
6 P.2 Intermediate consumption 2 482 47 152 49 634
7=1-6 B.1g Gross value added 3 784 123 437 127 221
46 The State Treasury, which includes data sources DS18, DS20, DS76 47 Organisational Units of the State, whose revenue and expenditure are included in the State budget, are recognized as
central budgetary organisations; Territorial Self-governing Divisions, Voluntary Associations of Municipalities, Regional Councils of Cohesion Regions, whose revenue and expenditure are included in the local budget, are recognized as local budgetary organisations.
48 VPI 3-04 (DS93) 49 ZDP 3-04 (DS92) 50 DS61, DS24, DS38

30
Gross value added in the non-profit institutions se rving households sector (S.15)
4.32 For the calculation of output and intermediate consumption for the sector non-profit institutions serving households, almost no quarterly information, with the exception of the number of employees and the volume of wages, is available. Estimate of the necessary indicators is therefore compiled using extrapolation methods.
4.33 Similarly as for the sector S.13, for the calculation of the non-market output for S.15 the cost method is used, i.e. the sum of intermediate consumption, compensation of employees, fixed capital consumption and of the other taxes on production. The compensation of employees is estimated from the total wages (including other personal costs) on the basis of data obtained from the statistical survey (DS95, see Chapter 9). The fixed capital consumption (E01A, see Chapter 3) is calculated by the same way as in other sectors; other items are estimated using information on the number employees, obtained from the Special database of employees (DS96) that provides more detailed data than the statistical survey.
4.34 Market output and intermediate consumption are estimated using extrapolation methods. Conceptual adjustments and adjustments for the exhaustiveness of the output and the intermediate consumption for sector S.15 are not significant. Their total calculation is described in the Chapter 3.
Table 4.6: Calculation of gross value added in non- profit institutions serving households 2nd quarter 2015
CZK million
Line Code
Item Activity
Market Non-market Total
1=2+3+4+5 P.1 Output 1 532 10 305 11 837
2 P.2 Intermediate consumption - 5 258 -
3 D.1 Compensation of employees - 4 188 -
4 P.51c Consumption of fixed capital - 843 -
5 D.29-D.39 Other taxes minus other subsidies
on production - 16 -
6 P.2 Intermediate consumption 1 084 5 258 6 342
7=1-6 B.1g Gross value added 448 5 047 5 495
Conversion of output and intermediate consumption to average prices of the previous year
4.35 Conversion to average prices of the previous year is carried out by a double deflation method, i.e. separately for output and intermediate consumption. Market output for all sectors (without FISIM and subsidies51) is revaluated using weighted price indices for each of the industries52 where the commodity structure of the output for domestic uses and the output for exports53 is used as weights. Intermediate consumption for all sectors (without FISIM) is converted to the average prices of the previous year similarly as the market output, i.e. through weighted price indices for each of the industries, where the commodity structure of the intermediate consumption from the domestic output and from the imports is used as weights.
4.36 Non-market output , domestic FISIM and subsidies on products are revaluated separately (see para 4.49–4.51 and 4.60) and then they are added to the recalculated market output or to the intermediate consumption.
51 The description of both these items is stated within the corresponding chapters 52 44 NACE industries 53 The Quarterly producers’ price indices are used – DS100, see Chapter 9). Structure of output is used from the
input/output tables for the last year which is available (i.e. usually tables for the preliminary version of the previous year).
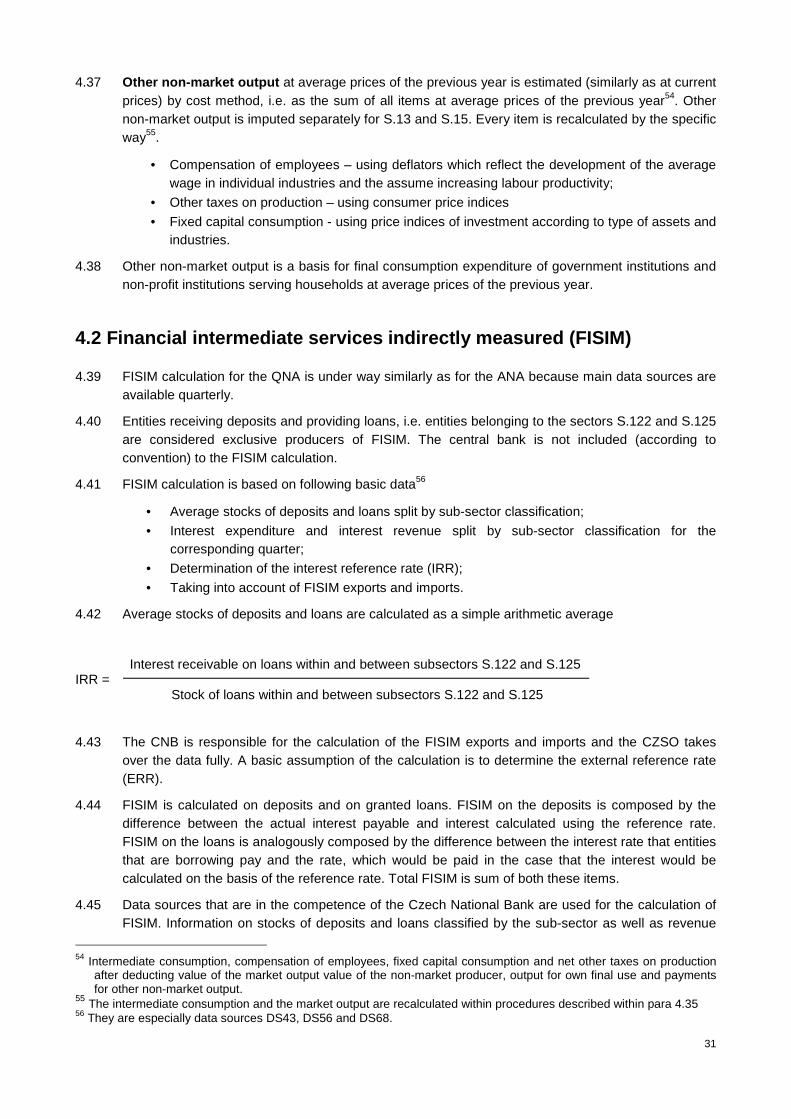
31
4.37 Other non-market output at average prices of the previous year is estimated (similarly as at current prices) by cost method, i.e. as the sum of all items at average prices of the previous year54. Other non-market output is imputed separately for S.13 and S.15. Every item is recalculated by the specific way55.
• Compensation of employees – using deflators which reflect the development of the average wage in individual industries and the assume increasing labour productivity;
• Other taxes on production – using consumer price indices
• Fixed capital consumption - using price indices of investment according to type of assets and industries.
4.38 Other non-market output is a basis for final consumption expenditure of government institutions and non-profit institutions serving households at average prices of the previous year.
4.2 Financial intermediate services indirectly meas ured (FISIM)
4.39 FISIM calculation for the QNA is under way similarly as for the ANA because main data sources are available quarterly.
4.40 Entities receiving deposits and providing loans, i.e. entities belonging to the sectors S.122 and S.125 are considered exclusive producers of FISIM. The central bank is not included (according to convention) to the FISIM calculation.
4.41 FISIM calculation is based on following basic data56
• Average stocks of deposits and loans split by sub-sector classification;
• Interest expenditure and interest revenue split by sub-sector classification for the corresponding quarter;
• Determination of the interest reference rate (IRR);
• Taking into account of FISIM exports and imports.
4.42 Average stocks of deposits and loans are calculated as a simple arithmetic average
Interest receivable on loans within and between subsectors S.122 and S.125 IRR = Stock of loans within and between subsectors S.122 and S.125
4.43 The CNB is responsible for the calculation of the FISIM exports and imports and the CZSO takes over the data fully. A basic assumption of the calculation is to determine the external reference rate (ERR).
4.44 FISIM is calculated on deposits and on granted loans. FISIM on the deposits is composed by the difference between the actual interest payable and interest calculated using the reference rate. FISIM on the loans is analogously composed by the difference between the interest rate that entities that are borrowing pay and the rate, which would be paid in the case that the interest would be calculated on the basis of the reference rate. Total FISIM is sum of both these items.
4.45 Data sources that are in the competence of the Czech National Bank are used for the calculation of FISIM. Information on stocks of deposits and loans classified by the sub-sector as well as revenue
54 Intermediate consumption, compensation of employees, fixed capital consumption and net other taxes on production
after deducting value of the market output value of the non-market producer, output for own final use and payments for other non-market output.
55 The intermediate consumption and the market output are recalculated within procedures described within para 4.35 56 They are especially data sources DS43, DS56 and DS68.

32
and expenditure interest is the basis. Used data sources for households sector are split in order to splitting FISIM among final consumption of households, FISIM for dwelling, FISIM applying to owners associations (OA) and FISIM applying to self-employed persons. FISIM calculated for the group of population is not included into the intermediate consumption but into the final consumption of households.
4.46 The indirect method of estimate, based on data of the previous years, is used for the calculating of FISIM from leasing loans (because data for the leasing loans are available only in annual periodicity).
4.47 Units that have the banking license but they are active outside of S.12 sector, are excluded from the FISIM calculation57.
4.48 Within the national accounts FISIM is recorded by the following way: On the resource side FISIM signifies the output of sub-sectors S.122 and S.125 and imports of services. On the expenditure side it enters into the intermediate consumption, the final consumption of households and into exports of services.
Conversion to average prices of the previous year
4.49 The deflator of FISIM output and FISIM imports are used for conversion of FISIM to the average prices of the previous year. The output deflator is used for the conversion of financial consumption expenditure of households FISIM and for the conversion of exports FISIM. Intermediate consumption is deflated by the weighted average of the two deflators.
4.50 Conversion of the FISIM to average prices of the previous year is carried out in five steps:
• Calculation of FISIM proportion at current prices on the value of interest-bearing liabilities;
• Calculation of the deflator of the interest-bearing liabilities as a share of the use (the sum of intermediate consumption, final consumption expenditure of households, gross fixed capital formation and exports without FISIM) at current and previous year’s prices;
• Conversion of the interest-bearing liabilities to the average prices of the previous year using the above mentioned deflator;
• Calculation of FISIM output at the average prices of the previous year (the average annual percentage of the FISIM of the previous year multiplied by the interest-bearing liability at the prices of the previous year;
• Calculation of the deflator of the FISIM output as the proportion of the FISIM output at current prices and at the prices of the previous year.
4.51 Deflator of the FISIM imports is calculated by a simplified way. The interest rate is use (the proportion of the interest rate of the current quarter to the average annual interest rate of the previous year).
4.3 Taxes and subsidies on products
Taxes on products (D.21)
4.52 The Ministry of Finance provides data on taxes on products quarterly on the basis accrual principle (see (DS27). These data are generally used for quarterly GDP estimates. Table 4.7 records taxes on products, which have been used for the GDP estimate by the production method, for the second quarter 2015 (i.e. data are in compliance with the Table 3.1, Chapter 3).
57 E.g. The Czech export bank (CEB) or the Czech-Moravian Guarantee and Development Bank (CMGDB)

33
Table 4.7: Taxes on products (D.21) – 2 nd quarter 2015 CZK million
Line Code Item 2Q 2015
1 D.21 Taxes on products 139 002
2 D.211 Value Added Tax 82 385
3 D.212 Taxes and duties on imports excluding VAT 2 178
4 D.214 Taxes on products except VAT and import taxes 54 439
5 Excise duties 37 571
6 wine 35
7 spirit 1 363
8 beer 1 282
9 tobacco products 13 245
10 fuel, gas, solid fuel, electricity and solar electricity 21 646
11 Other taxes on products (excluding VAT1) ) 16 868
1) For instance, the tax to support renewable energy sources58 ), levies on lottery, and gambling machines, tax on acquired real estate, levy on withdrawal of land from agriculture, resort and recreation fees on visitors.
4.53 Accrualisation, which is carried out by the Ministry of Finance, is based for most taxes on time adjusted cash payments59. However, in the period 60 days after the end of the quarter no information on the cash payments is available for the accrualisation (usually data on payments, which take place in the 2nd month after the end of the quarter and due to their factual nature are related still to the previous quarter60). In this case the Ministry of Finance estimates these data on the basis of information from the General Directorate of Finance (GDF), and subsequently it refines the data for later GDP estimates.
4.54 Data that are provided by the Ministry of Finance for the 1st standard estimate, 60 days after the end of the quarter are always analysed during compiling of the QNA or they are adjusted in relation to other information61. In the following GDP estimates, when final data provided by the Ministry of Finance are available, taxes are usually allocated to the quarter according to information provided by the MoF. VAT is usually an exception; its allocation to the quarters is always connected with development of components of GDP use in order to ensure consistency between quarterly development of GDP and development of final consumption expenditure of households, intermediate consumption etc.62.
Conversion into the average prices of the previous year
4.55 Conversion of taxes on products into average prices of the previous year is carried out by the individual type of taxes.
4.56 Value added tax is conversed into the average prices of the previous year by the following way:
58 The tax to support renewable energy sources (especially related to solar energy) in the current year is based on the
data of the previous year and it is allocated into a quarter on the basis of the expected production of electricity from these sources of energy during the year (i.e. especially in the 2nd and 3rd quarter). This tax is related to the adjustment in the annual national C03G.
59 As to the value added (VAT) the revenue from VAT are shifted by one month and excessive deductions of VAT are shifted by two months. As to excise duties the payments are generally shifted by two months; however the adjustment is based on legislative rules relating to the maturity of each type of the taxes.
60 For instance paid excessive deductions of the VAT, payments for the excise duties on tobacco products or fuel 61 For instance information on components of use, which are connected with the taxes or information from tax
declarations (if they are available) 62 And including capital formation and final consumption expenditure of the government institutions. Estimate of the
components, which are connected with GDP, is based on information from input/output tables of the previous year.

34
1. Allocation of VAT into individual components of use to which it applies (final consumption expenditure of households, government institutions and NPISH, gross fixed capital formation, intermediate consumption, purchases of non-residents in the Czech Republic)63. This model of allocation is based on the structure of allocated VAT from the previous year (by supply and use tables).
2 Application of deflators to VAT by the individual components of use. As deflators, each use-component deflator to which VAT applies is used.
4.57 Excise taxes as well as other taxes are conversed into the prices of the previous year separately according to type of taxes, where the index of the development of tax rate is used as deflator.
Subsidies on products (D.31)
4.58 Administrative data provided by the MoF are basic source on subsidies on products, especially they are financial statements of budgetary organisations (central and local government (DS18 and DS90), semi-budgetary organisations of central and local government (DS20) and extra-budgetary funds (DS91). These data are not adjusted in the quarterly accounts.
4.59 Table 4.8 records subsidies on products which were used for the GDP estimate by production approach for the 2nd quarter 2015 (i.e. data are in compliance with the table 3.1, Chapter 3).
Table 4.8: Subsidies on products (D.31) – 2 nd quarter 2015
CZK million
Line Code Item 2Q 2015
1 D.31 Subsidies on products 29 414
2 D.319 Other subsidies on products 29 414
3 Subsidies from the State Intervention Agricultural Fund 993
4 Subsidies on regional and local travel services 8 768
5 Subsidies to private schools 791
6 Subsidies on renewable energy sources 1) 16 253
7 Contribution to semi-budgetary organisations classified in S.11001 2 609
1) incl. Conceptual adjustment C03G, i.e. it contains a contribution for renewable sources of energy paid by consumers within the electricity price
Conversion into the average prices of the previous year
4.60 No direct prices indices (or deflators) are available for the conversion of taxes on products at current prices into the average prices of the previous year. Therefore, an alternative way is used, based on the assumption of existence of the relation between subsidies on products and price development of the products. For this reason, the quarterly producer price indices (on two digit level CZ-CPA) are used for conversion into the average prices of the previous year.
63 It is recorded as imports of services (P.72). It is the only item of exports which has link to VAT.
35
5 GDP components: expenditure approach
5.1 Final consumption expenditure of households
5.1 Estimate of the final consumption expenditure of households is carried out by combination of data sources, model calculation and adjustments for the exhaustiveness of the .economy. Final consumption expenditure of households is compiled in compliance with the internal standard classification COICOP – at the two-digit level, i.e. in 46 groups. Final consumption expenditure of households is compiled primarily in the national concept, i.e. it presents consumption of resident households in the Czech Republic territory and also abroad. Afterwards, the final consumption expenditure of households is compiled in domestic concept, i.e. it presents consumption of resident and non-residents households in the Czech Republic territory.
5.2 Estimate of the final consumption expenditure of households is based on several data sources. Above all, it is a model calculation based on a retail sales index (DS97), household budget survey64 (DS57) and alternative calculation for selected commodities. Estimate of the final consumption expenditure is primarily based on retail sales data.
5.3 Information on retail sales is obtained from the “Monthly surveys for trade and services” (SP 1-12)65. The index at current prices, calculated from the sales, is transferred into selected COICOP items. Data from the family budget statistics are used for other COICOP items. In the case of the 1st standard estimate, when data from the family budget statistics are not available, information on their quarter-on-quarter development in the previous year is used. Estimate for alcoholic drinks and tobacco is based on the quarterly estimate of the previous year, price indices and on the annual volume index of the previous year.
5.4 An alternative estimate of passenger cars is based on information on sales and registrations of passenger cars and on average prices of these cars. For used cars it is distinguished their origin and in the case of imported used cars is decisive the 1st registration of such car in the Czech Republic. As to remaining part of used cars it is essential not only who buys a used car, but also who sells it. If a household buys a used car through a dealer of the used cars from another household, then the final consumption expenditure includes only the margin paid to the dealer. An alternative estimate for motorcycles is based on information on the number of motorcycles in breakdown on new and used and on the structure of registered motorcycles split by the list of prices of individual makes of motorcycles and scooters according to cubic capacity.
5.5 An alternative estimate of electricity and gas consumption is based on physical indicators from the balance of electricity and gas. The estimate of final consumption expenditure of households relating to electricity and gas is calculated on basis information on electricity/gas expenditure for the quarter of the previous year multiplied by the volume index (calculated using physical indicators of the balance of energy) and the consumer price index of the relevant quarter of the year. Other fuels included under COICOP 04566 are estimated on basis of the household budgets statistic.
64 Household budget survey has no longer been used since the 3rd quarter 2015 and it has not been
available since the 1st quarter 2016. 65 DS97 66 Electricity, steam, gas, fuels (liquid, solid and heat fuel)

36
5.6 Estimate of expenditure for bets and lotteries is based on indirect methods. It is based on annual data, which are taken over from the Ministry of Finance of the Czech Republic and they are extrapolated into the quarter of the current year. The Ministry of Finance publishes data on amounts received and paid by betting agencies and betting rooms. Estimate of the final consumption of households is calculated as difference between both the amounts.
5.7 Comprehensive recording of the final consumption of households must take into account, in addition to the adjustment of the main of data sources, other adjustments, which significantly affect the final consumption of households. It is about the items, which include the following adjustments: adjustments for the exhaustiveness of the coverage of the economy, conceptual adjustments and model calculations and extrapolation and also corrections based on balancing commodities within the annual supply and uses tables, which become part of the annual final consumption of households.
Table 5.1: Calculation of final consumption of hous eholds CZK million
Line Code Item 2Q 2015
1 DS57;DS97 Data sources 370 690
2 Extrapolated settlement to the annual data source 33 410
3=1+2 Data inputs 404 100
4 Conceptual adjustments 116 157
5 Adjustments for exhaustiveness 19 000
6 Extrapolated adjustments from the balancing within the ANAs -11 685
7 Other adjustments 1) -1 698
8 Extrapolated settlement to the ANAs 0
9= 4+5+6+7+8 Adjustments, total 121 774
10=3+9 P.31 Final consumption expenditure of househ olds 525 874
1) The adjustments are based on the analysis of items on the two digit COICOP level
5.8 Adjustments for the exhaustiveness relating to non-observed economy67 (NX), which affects the final consumption expenditure of households include especially adjustments for illegal alcohol, tobacco, drugs and prostitutions. It also includes an agricultural self-supplying (N03C68). Within the adjustments for the exhaustiveness of the economy they are taken account also other adjustments, which are taken over from the annual national accounts and extrapolated into quarters of the next year, where they are equally allocated into the individual quarters69.
5.9 Conceptual adjustments relating to wages in kind (C04), taxes and subsides70 (C06), non-life and life insurance or pensions claims (C07) and FISIM (C08) are part of the final consumption of households.
5.10 Adjustments related to the imputed and paid rental (E02) and institutional organisations (E10L) are an essential part of final consumption expenditure of households. The imputed rental is
67 Informal, illegal, hidden economy 68 The category of adjustments for the non-observed economy is divided for many adjustments. In the QNA
Inventories, these individual adjustments are recorded in a simplified way under the code NX, but it is valid that they carried out similarly in the quarterly national accounts as in the annual national accounts. Estimate of these adjustments in the quarters of the current year, it is usually based on indirect methods, i.e. on the data extrapolation from the previous year.
69 It is e.g. deliberate distortion of the individual consumption of entrepreneurs or activities of domestic personnel 70 Highway vignette, vehicle registration fee

37
largely based on indirect model methods used for estimates based on information on family houses, flats, garages and cottages71. The paid rental is based the annual national accounts and the extrapolation into a quarter of the current year.
5.11 If annual data on the final consumption expenditure of households are available, the sum of the quarterly estimates of the final consumption expenditure of households is compared with the annual expenditure. The difference within the each COICOP group is breakdown pro-rata into quarters. At the same time this difference is extrapolated into a quarter of the current year.
Conversion into the average prices of the previous year.
5.12 Conversion of the final consumption expenditure of households into the average prices of the previous year using consumer price indices at the two-two digit level COICOP (46 groups)72. If annual data are available, the sum of the quarters in the individual groups is compared with the annual value of the final consumption expenditure of households at prices of the previous year. The difference is then pro-rata allocated to quarters.
5.2 Final consumption expenditure of government ins titutions
5.13 Calculation of the final consumption expenditure of government institutions is based on the production approach; it is especially based on the estimate of output of non-market services (see Chapter 4). A substantial part of the final consumption expenditure of government institutions consist of free of charge non-market output directly produced by government institutions The output is measured indirectly, i.e. it is estimated using the cost method as the sum of intermediate consumption, compensation of employees, consumption of fixed capital and net other taxes on production after deducting of the value of market output of non-market producers, output for own final use and payments for other non-market production.
5.14 The second part of the final consumption expenditure of government institutions includes of the value the value of market production purchased by government institutions (social transfers in kind ). It is surveyed directly from the statistical surveys (DS92).
5.15 The final consumption expenditure of government institutions are estimated on the basis of their share in the free of charge other non-market output that is known from the ANAs. Their deduction from the total final consumption expenditure of government institutions they are obtained the final individual consumption expenditure of government institutions.
5.16 Revision of the final consumption expenditure of general government and their breakdown into individual and collective consumption can be carried out during the 2nd estimate of the QNAs. This revision takes into account additional data sources for government institutions and the appropriate corrections of errors, based on new information at the time of this estimate.
Conversion into the average prices of the previous year
5.17 Conversion into the average prices of the previous year is carried out separately for the non-market services (see Chapter 4) and for the market output purchased by government institutions. Market output purchased by government institutions73 is conversed into the average prices of the previous year according to individual types of products (health care,
71 The final consumption expenditure of households is included an amount that is added into the output of
households sector. 72 DS99 73 D.632 (social transfers in kind)

38
medicaments – especially for medicaments produced in the Czech Republic and imported from abroad, medical apparatuses and transport).
5.3 Final consumption expenditure of non-profit ins titutions serving households
5.18 The final consumption expenditure of non-profit institutions serving households (NISH) is equal to value of goods and services produced by NISH and provided to households free of charge (other non-market output provided free of charge) and market output purchased by NISH. Calculation of the free of charge output is described in the Chapter 4.
5.4 Gross capital formation
5.4.1 Gross fixed capital formation
5.19 Gross fixed capital formation (GFCF) is estimated separately for individual institutional sectors by six type of fixed assets. GFCF is done as difference between increases and decreases of fixed assets.
5.20 Quarterly estimates of GFCF are based especially on the quarterly statistical survey of economic entities selected production industries, financial institutions and selected government institutions (see DS89, DS11, DS08, DS92 and DS94). Part of the data sources is taken over from administrative source, especially from the Auxiliary Analytical Overview, financial statements for evaluating fulfilment of budgets of central and local budgetary organisations and state funds and accounting statements for semi-budgetary organisations DS76, DS18, DS20, DS21, DS91, DS61, DS24).
5.21 Some of the statistical survey does not provide required splitting of fixed assets. Missing breakdown is estimated mainly using data from the P 6-04 survey (DS11). From the statistical survey, only the P 6-04 survey provides information on the structure of assets in needed breakdown.
5.22 Data on acquisitions and disposals of fixed assets taken over from the statistical survey are complemented by conceptual adjustments and adjustments for the exhaustiveness of coverage of economy in individual sectors. Among the most important of adjustments belong capitalisation of small and below-threshold assets (C11A, C11B), capitalisation of research and development expenditure (E07A) and individual housing construction a reconstructions and modernization (NX).
5.23 To keep year-of-year comparability, supposed differences between annual and quarterly data are extrapolated in the quarters of the current year based on the difference from the last known year. This difference is extrapolated by pro-rata allocation to the individual quarters.
5.24 Further adjustment includes a change of the character of seasonality, so called the commodity flows method.

39
Table 5.2: Calculation of the GFCF non-financial co rporations sector, general government and households – 2 nd quarter 2015
CZK million
Line Code Item S.11 S.13 S.14
1 Data inputs, total 111 091 37 233 8 371
2 Conceptual adjustments 19 860 6 490 6 711
3 Adjustments for exhaustiveness 0 0 20 665
4 Extrapolated reconciliation to the ANAs 34 264 0 2 293
5 Adjustments by the commodity flows method
13 051 4 877 1 072
6=1+2+3+4+5 P.51g Sectors, total 178 266 48 600 39 112
Method of commodity flows
5.25 Quarterly estimate of the GFCF are based mainly on quarterly statistical survey. However, the seasonal character of the collected data is not consistency with the seasonal character of output and imports of the relevant commodities. Differences in the character of seasonality are likely caused by a systematic shift when the accounting cases are recorded during the current year.
5.26 The commodity flows method largely does not eliminate this inconsistency. This method was first applied and published in 200674. It is used during the preliminary estimates and in cases when data are available for all quarters of the year75. A procedure of the method is stated in the following paragraph.
5.27 The annual supply and use tables provide information on GFCF at the basic prices divided into the part showing GFCF from the domestic output (“domestic GFCF”) and the part from imports (“imported GFCF”); both part are divided by two-digit level of the CZ-CPA classification. In the first step, the data are used for calculation of the annual shares of domestic GFCF in the total output76 and shares of imported GFCF in the total imports77. Annual shares are then applied to data on the quarterly output and the imports in order to estimate of the total value of the GFCF in the quarter. The difference between the GFCF at current and basic prices, in the supply and use tables, is allocated to the quarters using the sum of the domestic and imported GFCF. All calculations are carried out at the two--digit level of the CZ-CPA classification and subsequently they are transferred into the non-financial assets classification (AN).
5.28 In the deadline of the first standard estimate during the quarter of the current year, when the quarterly results from the statistical survey are available, the GFCF estimate78 is based on the application of the year-of-year indices79 on the value of the GFCF in the same quarter of the previous year80. This keeps comparability in the time series and respected the year-of-year development of the aggregate.
74 The method was tested and it was used on the basis of the results in the total time series from 1995. 75 I.e. during the estimate of the 4th quarter and for years when the annual national accounts are available. 76 Without export, output of non-market services 77 Without re-export and merchanting 78 According to AN classification 79 The calculation is based on the quarterly source data development 80 I.e. the results of the used method of commodity flows of the previous year

40
Conversion into the average prices of the previous year
5.29 The conversion is carried out using the price indices of investment, which are derived from the industrial producer price index and from the index of the import prices, weighted by the structure of the GFCF to the GFCF from the domestic output and imports. The conversion is carried out on the level of the six types of the fixed assets.
5.4.2 Changes in inventories
5.30 The basic data source P 6-04 (DS11) constitutes quarterly statistical survey, which is made for more than 2000 companies with a significant amount of assets in the Czech economy. Inventories at current prices are available by type: material, work in progress, finished goods and merchandise. Calculation of changes in inventories is primarily based on the difference between initial and final stocks in two consecutive quarters, broken down into 44 groups of industries at the two-two-digit level of the CZ-NACE classification.
5.31 As another data sources they are used the administrative data from the MoF data base (DS21) and data from the quarterly statistical surveys VPI 3-04 (DS93), Zdp 3-04 (DS92) and Pen 3c-04 (DS08).
5.32 Calculation of changes in inventories is carried out according to the individual institutional sectors and by industry for each type of the inventories.
5.33 Data from the statistical survey and from the administrative sources are supplemented by the conceptual adjustments made due to reconciliation with the methodological rules ESA 2010. These adjustments include a natural increase of standing timber (Chapter 3, E08) and holding gains/losses on inventories (Chapter 3, C12).
5.34 Holding gains/losses on inventories are calculated separately using the appropriate price indices (PPI, indices of export and import prices) for each industry group, and separately for non-financial corporations sector and also separately for households sector. A specific approach was chosen for the general government sector, when they are used data on revaluation, provided by the State Material Reserves Administration.
5.35 Because that needed source data are not available for revaluation and for other changes in volume in a quarter, the potential difference between of the sum of quarterly and annual data split by type of inventories is pro-rata allocated into quarters. This adjustment is not extrapolated into the quarter of the current year (i.e. when the annual national accounts are not available).
5.36 Because information on inventories in the quarter is relatively incomplete, the change in inventories is used as the balancing item. The difference between resources and use of GDP at current prices is usually allocated into the change in inventories item81.
81 Table 5.3 records the balancing adjustment for the 2nd quarter 2015 under „Other adjustments“ item.

41
Table 5.3: Calculation of the Changes in inventorie s*) – 2nd quarter 3012 CZK million
Line Code Item 2.Q 2015
1 Data inputs, total 18 060
2 Conceptual adjustments 1 236
3 Other adjustments 1) 2 147
4=1+2+3 P.52 Sector, total 21 442
*) The difference of items to the “Sector, total” is caused by rounding 1) Balancing adjustment related to balancing of production and expenditure approaches (See Chapter 3 and Table 3.1)
Conversion into the average prices of the previous year
5.37 Conversion into the average prices of the previous year is carried out using of total weighted price indices, which are part of the calculation of the holding gains/losses item82. The item is calculated for each type of inventories separately. The correction to the existing annual indicators is allocated pro-rata between individual types of inventories.
5.4.3 Acquisitions less disposals of valuables
5.38 No information is available for the quarterly estimates of acquisitions less disposals of valuables. The annual value at current prices is disaggregated through the proportional Denton method. Conversion into the average prices of the previous year is carried out using the price industrial index for the CPA 90 - Creative, arts and entertainment services.
5.5 Exports and imports
Exports and imports of goods
5.39 Exports and imports estimate of goods in the national accounts is based on the change in ownership rule between residents and non-residents, and regardless of the physical movement of goods across borders (national concept).
5.40 The national treatment of foreign trade provides data in both the commodity classification (on two-digit level of the CZ-CPA classification) and also in the territorial breakdown, including CIF valuation (cost insurance freight) and FOB (free on board) valuation. The quarterly estimates of foreign trade are published at FOB valuation.
5.41 The estimate is based on the national concept of foreign trade DS58 (see Chapter 9). Moreover, the data are adjusted for following conceptual adjustments: mainly goods for refinement are excluded (C03A), and merchanting83 (C03C) is added and (in general) other goods that cross borders without a change of ownership is excluded. The data are also
82 They are industry weighted price indices, which are depending on the type of inventories based on the
commodity structure of the stocks of inventories, output, intermediate consumption or import. 83 Goods under merchanting (trading abroad)

42
adjusted for the exhaustiveness in connection with the non-observed economy84 (NX). The total overview of the changes is showed in the Chapter 3.
5.42 In most cases, data for needed adjustments are obtained directly from the data source; only adjustments for the exhaustiveness are based on the last known annual information and they are equally allocated to the quarters.
Table 5.4: Exports of goods – 2 nd quarter 2015 CZK million
Line Code
Item Total of which
intra-EU non-EU
1 DS58 Exports (FOB) - national concept of foreign trade 840 997 701 073 139 924
2 Conceptual adjustments -30 185 -22 870 -7 315
3 Adjustments for exhaustiveness 171 171 0
4=1+2+3 P.61 Exports of goods 810 983 678 374 132 609
Table 5.5: Imports of goods - 2 nd quarter 2015 CZK million
Line Code
Item Total of which
intra-EU non-EU
1 DS58 Imports (FOB) - national concept of foreign trade 768 081 538 908 229 173
2 Conceptual adjustments -20 661 -20 042 -619
3 Adjustments for exhaustiveness 814 294 520
4=1+2+3 P.71 Imports of goods 748 234 519 160 229 074
Conversion into the average prices of the previous year
5.43 Monthly price indices of exports and imports at the two-digit level are the basis for the conversion of exports and imports of goods to the average prices of the previous year. For the purpose of converting the total exports of goods into previous year prices, the re-exports are deflated separately (by import price indices) from the remaining part of exports of goods (deflated by export price indices).
Exports and imports of services
5.44 The estimate of exports and imports of services is based on the combination of several data sources. The basic source is the quarterly sample survey on exports and imports of services85, which does not include data on tourism and financial services. For these areas data provided by the Czech National Bank86 are used.
5.45 The data sources are then complemented by the conceptual adjustment especially for refinement services (C03B), insurance and reinsurance services (C07), FISIM (C08)87 and for
84 Drugs, tobacco, fuels, trademarks 85 DS59 86 DS87, DS85 87 The adjustments marked with the letter E are treated, in the national accounts system, as extrapolation

43
the adjustment for the exhaustiveness relating to the non-observed economy (NX)88. The total overview of these adjustments is stated in the Chapter 3.
5.46 All basic sources for the estimate are surveyed in a territorial a commodity structure. Only the source DS87 is provided in the territorial breakdown, but only in aggregated form. Therefore, for the needs of deflation, determined commodity structures at the two-digit level CZ-CPA classification are used within the expert estimates.
5.47 The data are obtained directly, only data resulting from some conceptual adjustments (C12A, E09C, and E09D) and from the adjustments for the exhaustiveness are estimated on basis of the last known annual estimates, which are pro-rata allocated into quarters.
Table 5.6: Exports of services – 2 nd quarter 2015 CZK million
Line Code
Item Total of which
intra-EU non-EU
1 DS59 Quarterly sample survey for exports and imports of services 91 449 51 383 40 066
2 DS87 Tourism 32 887 26 237 6 650
3 DS85 Financial services 202 149 53
4=1+2+3 Data inputs 124 538 77 769 46 769
5 Conceptual adjustments 16 883 11 099 5 784
6 Adjustments for exhaustiveness 664 664 0
7=4+5+6 P.62 Exports of services 142 085 89 532 45 850
Table 5.7: Imports of services – 2 nd quarter 2015 CZK million
Line Code
Item Total of which
intra-EU non-EU
1 DS59 Quarterly sample survey for exports and imports of services 85 005 49 664 35 341
2 DS87 Tourism 23 379 20 175 3 204
3 DS85 Financial services 451 234 217
4=1+2+3 Data inputs 108 835 70 073 38 762
5 Conceptual adjustments 11 182 9 780 1 402
6 Adjustments for exhaustiveness 730 709 21
7=4+5+6 P.72 Imports of services 120 747 80 562 36 764
Conversion into the average prices of the previous year
5.48 Price indices used for conversion of exports and imports from the current prices into the average prices of the previous year are not available. The most significant sources of this calculation include consumer prices indices, indices of services market prices and indices of construction structures. These indices are calculated for the domestic economy. For exports and imports¸ they are further adjusted by the average exchange rate of the CZK against the Eur.
88 Prostitution, alcohol

44
6. GDP components: income approach
6.1 Main items of the income approach are, for the GDP calculation, following:
• Compensation of employees (D.1),
• Taxes on production and imports (D.2),
• Subsidies (D.3),
• Gross operating surplus (B.2) and gross mixed income (B.3).
6.2 All main items of the income approach are divided by the CZ-NACE and the institutional sector classification (CISS).
6.3 The overview of individual GDP components in the quarterly national accounts of the Czech Republic is showed in the table 6.1.
Table 6.1: GDP estimate by the income approach – 2nd quarter 2015 CZK million
Line Code Item 2Q 2015
1 D.1 Compensation of employees 443 414
2 D.2 Taxes on production and imports 144 323
3 D.3 Subsidies 39 375
4 B.2g + B.3g Gross operating surplus and mixed income 572 416
5 = 1+2-3+4 B.1g* Gross domestic product 1 120 778
6.1 Compensation of employees
6.4 Compensation of employees (D.1) is total remuneration, in cash or in kind, provided by an employer to an employee in return for work done by the latter during an accounting period. Compensation of employees includes two components:
• Wages and salaries paid in cash or in kind,
• Social contributions of employers, i.e. actual and imputed.
6.5 Compensation of employees is recorded in the national accounts in the three kinds of combined dividing, partially by main component and sub-component, further according to type of activities (by CZ-NACE classification) and according to institutional sector/sub-sector classification (CISS).
6.6 Calculation of the compensation of employees (D.1) is split into the following items:
• Wages and salaries in cash (D.11p),
• Wages and salaries in kind (D.11n),
• Actual social contributions of employers (D.121),
• Imputed social contributions (D.122).
6.7 Estimate of the Compensation of employee’s item (D.1) is carried out by compilation of a number of data sources, model calculation, methodological adjustments and adjustments for the exhaustiveness of recording the economy.
6.8 Quarterly data on the wages and salaries (D.11) are obtained from the statistical questionnaires (DS08, DS89, DS92, DS93), from the administrative sources (DS18, DS20, DS24, DS38, DS61, DS76, DS90, DS91) and from expert estimates based on estimates of employment (See Chapter 7).

45
6.9 Wages and salaries (D.11) are revenue of employees from dependence activity and functional benefits. In the national accounts of the Czech Republic, the wages and salaries are recorded on a gross basis, i.e. before deduction of legal employees' social contributions on social and health insurance, taxes and by the employee agreed deductions.
6.10 During compilation of the quarterly national accounts of the Czech Republic, at the beginning phase, data on wages and salaries are taken over from the statistical questionnaires already grossed up for the total set of institutional units.
6.11 Methodological adjustments result from the correct recording wages in kind. Wages and salaries in kind are remunerations for work done and paid in the form of goods and services or another benefits. The quarterly wages and salaries in kind are derived from the corresponding annual estimates.
6.12 The adjustments of the wages and salaries for the exhaustiveness of the economy (NX) relates to employing workers illegally, paying a part of the wage outside the official accounting or by employing domestic personal and relating to complete recording of wage in kind. This estimate is carried out on basis of annual data sources for small and medium-sized non-financial enterprises and entrepreneurs – natural persons.
6.13 Balance adjustments resulted from the analysis of wages and salaries for each sub-sector/sector and industry in relation to the number of workers, social contributions and output and from the comparison in the time series.
6.14 Actual social contributions of employers (D.121) cover pension insurance contributions (D.1211) and sickness insurance, contributions to the state employment policy and health insurance contributions (D.1212). The contributions are determined as a percentage of the gross wages reported. This percentage is determined by law. From the side of recipients of the actual social contributions, i.e. government institutions and insurance companies, reliable data (on the basis of cash principle) are available, which allow easier the estimation.
6.15 Valuation of wages and salaries recorded in the national accounts is based (in principle) on valuation within business accounting. Valuation of social and health insurance contributions is adjusted by the time adjusted method. Basic sources are data on actual payments of the employers on social and health insurance processed so as to comply the time continuity with the period in which the work was done.
6.16 Imputed social contributions (D.122) are derived from the annual estimates broken-down by industry.
6.2 Taxes and subsidies
6.17 Other taxes and subsidies on production (D.29, D.39) are included under taxes and subsidies (D.2, D.3) along with taxes and subsidies on products (D.21, D.31). Sources and methods used for quarterly estimates of the taxes and subsidies on products are described in the part 4.3 and other taxes and subsidies are described below
Other taxes on production (D.29)
6.18 Procedure used for other taxes on production estimate in the QNA is very similar to the procedure used within the ANA. Main source data are available in the quarter period. Input data on other taxes on production are available from the side of recipients, i.e. from the financial statements of central government institutions (DS90), state funds (DS91), the Vine-grower Fund (DS24), DIF (DS38). Other taxes on production are recorded on cash basis; only

46
two items (Real estate tax and Road tax) are accrualised. The time adjusted method of cash data is used for this adjustment (See Chapter 3). The MoF carries out this adjustment.
6.19 Other taxes on production include the following taxes and fees:
• Road tax
• Surface water pollution fees
• Air pollution fees
• Levy on withdrawal of land from agriculture
• Levy on withdrawal of land from forestry
• Underground water pollution fee
• Fee on registration and recording of packaging
• Other environmental fees and levies
• Motor vehicle entry fees
• Other levy on selected activities and services
• Administrative fees
• Real estate tax
• Sale of stamps revenue
• Levies of producers and importers of wine to the Vine-grower Fund
• Contribution to the Deposit insurance Fund
• Sale of emission permits
• Previous local fees
Other subsidies on production (D.39)
6.20 Data sources used for the quarterly estimates of the other subsidies on production are similar to those, which are used in the ANA. The input data on other subsidies on production are available from side of payers and they are recorded on cash basis.
6.21 Most of the other subsidies are provided by the following entities:
• Central budgetary organisations (DS90),
• Local budgetary organisations (DS18),
• State Environmental Fund (DS91),
• State Culture Fund (DS91),
• State Fund for Support and Development of Cinematography (DS91),
• State Housing Development Fund (DS91),
• State Agricultural Intervention Fund (DS91),
• State Transport Infrastructure Fund (DS91),
• Support and Guarantee Agricultural and Forestry Fund,
• Vine-grower Fund (DS24).
6.3 Gross operating surplus and gross mixed income
6.22 Gross operating surplus (B.2) and gross mixed income (B.3) are balancing items of the Generation of income account. Both items are recorded in the combination of sector and industry classification.
6.23 No direct quarterly data are available relating to the operating surplus and mixed income. These items are derived as balancing item by deducting the compensation of employees and net taxes on production from GDP.

47
7 Population and employment
7.1 Population
7.1 Data on population are taken over from demographic statistics. The data correspond to the mid-year population. The mid-quarter population in a calendar quarter is determined as average of the monthly averages of the number of inhabitants; the mid-monthly population is calculated as average of number of inhabitants at the beginning and at the end of corresponding month.
7.2 Quarterly estimate of economically active population, i.e. the potential size of the labour force in the Czech Republic is in principle the same as annual. It represents sum of unemployed and employed persons, and each of these components is estimated separately. Table 7.1 records estimate of the economically active of population in the 2nd quarter 2015.
7.3 Data on unemployment are taken over from the Labour Force Sample Survey (LFS).
7.4 Employment is for needs of the estimate of economically active population based on the national concept89 of employment while the estimate of the employment in national accounts is primarily based on the domestic concept90 (see section 7.2).
7.5 Conversion of the data from the domestic concept of employment into the national concept represents including residents working for resident units and excluding non-residents working for resident units. Paragraphs 7.6 and 7.7 describe more detailed the estimate of the number of residents working for non-resident units and on the contrary non-residents working for resident units.
Table 7.1: Population and employment – 2 nd quarter 2015
Line Item 2Q 2015
1 Population 10 538 780
2 =3+4 Economically active population 5 415 519
3 Unemployed persons 261 793
4=5+6 Employment, total (national concept) 5 153 726
of which
5 employees 4 386 131
6 self-employed persons 767 595
7.6 Quantification of a number of residents , who work for the non-resident units:
The estimate of a number of residents, who work for non-resident units, is based on the Labour Force Sample Survey (LFS) by individual country. The survey provides data on number of persons working abroad legally and daily or crossing the borders monthly or working abroad 3 months or less. In some cases it could be also a repeated residence, i.e. longer than 1 year; however these cases cannot be distinguished. For the illegal employment it is considered temporary job or the second job. The LFS provides no information on illegal employees; it means that the number of these employees is estimated. These estimates are
89 It represents the number of residents working at the residents and non-residents production units 90 It represents the number of residents and non-residents working at the resident production units, i.e. a labour,
who contributes to the gross value added or GDP. National concept is used in the national accounts e.g. in estimates of labour productivity.

48
based on experiences of the Labour Offices and for EU countries it is determined the share of 2% from employment estimates for corresponding country based on the LFS; for other countries it is applied the share 10%. The Ministry of Foreign Affairs provides data on the number of residents who are employed as personnel of foreign diplomatic missions, EU institutions and international organisations.
7.7 Quantification of a number of non- residents , who work for the resident units:
The estimate of a number of non-residents, who work in the Czech Republic, is based on combination of several administrative sources. The Ministry of Interior (MoI) publishes information on the total number of foreigners in the Czech Republic territory by length of residence and the country of origin. Data from the Ministry of Labour and Social Affairs (MoLSA) are used for determination of the number of the non-resident workers. The Ministry of Education, Youth and Sports (MoEYS) monitors the number of foreign students, who study in the Czech Republic Estimate of non-residents legally employed split by individual CZ-NACE, is carried out by combination of all available data sources. The number of illegally employed and economically inactive foreigners is grossed-up on a basis of combination of surveyed data. Expert estimates of the illegal employment of non-residents is based on development of the checks number carried out for employers who employ foreigners (i.e. controls carried out by the Labour Offices in cooperation with the Alien Policy inspectorates and customs offices.
7.2 Employment: Persons
7.8 Employment in terms of the national accounts is estimated in the domestic concept. The data are also quarterly published by 10 CZ-NACE categories, both in persons91 and in the number of worked hours.
7.9 The data on employment correspond to the number of persons with a main job. The main job is only one job of the person or a job with the greatest number of worked hours (if the person has more than one job). Data are compiled for the whole national economy in dividing on the 2-digit level CZ-NACE. Employment expressed by the number of employed persons includes the number of employees and the number of self-employed persons.
7.10 Estimate of the number of persons is based on information on main job obtained from the Labour Force Sample Survey and adjusted in compliance with the ESA 2010 methodology. These adjustments include methodological adjustments and adjustments for the exhaustiveness of the economy. Methodological adjustments include supplementing of underestimated or missing data and other adjustments, which must be made regarding to methodology of employment according to ESA 2010. Adjustments for the exhaustiveness of recording the economy represent estimates of number of the persons for the non-observed economy.
7.11 If annual data on the number of employed persons are available, the average of the quarterly estimates of the number of employed persons is compared with the annual data. The difference is pro-rata allocated into individual quarters of the year. Subsequently this difference is extrapolated into quarters of the following year. This basic procedure of the estimate is the same both for employees and for self-employed persons.
91 For the purpose of estimates of worked hours (see Chapter 7.3) estimate of employment in full-time equivalent
jobs is carried out; the data are not published quarterly.

49
Number of employees
7.12 Estimate of number of employees is based on data on employees with the main job from the LFS, which are adjusted in compliance with ESA 2010. The transposition of collected data from the LFS in the national concept to the domestic concept is the most important adjustment, which is carried out. This adjustment is necessary because data from the LFS largely correspond to the employment national concept92. Transition of the data from the national into the domestic concept of employment means excluding workers abroad (the Czech workers working abroad less than one year) and including non-residents, who work for non-resident units (foreigners working in the Czech Republic less than one year)93.
7.13 Transfer of data on the self-employed persons to the employee’s category constitutes the greatest methodological adjustment. This transfer relates to the owners of corporations and quasi-corporations, who work in their companies, and who enrol as self-employed persons in the LFS questionnaire. If the persons work in their companies, then they are classified as employees in compliance with the methodology ESA 2010. This adjustment is taken over from the last known annual estimate and it is allocated pro-rata into quarters. Estimate of the adjustment for the year is based on Business Statistics data (BS).
7.14 The estimate of the number of employees working illegally who are not recorded within the LFS data is an adjustment on exhaustiveness.
Table 7.2: Employed persons – employees – 2 nd quarter 215 CZK million
Line Code Item 2Q 2015
1 DS98 Data sources - main job 4 160 761
2 Methodological adjustments 119 777
of which residents working abroad 1) -48 660
non-residents working in the Czech Republic 2) 25 513
3 Adjustments for the exhaustiveness 93 522
4 Extrapolated benchmarking for the ANA 21 880
5=1+2+3+4 Employed persons 4 395 940
1) Czech workers working abroad less than one year; data source LFS
2) Foreigners working in the Czech Republic less than one year; data source: Balance of the number of foreigners, NA
7.15 Estimate of industries structure of collected data and methodological adjustments are based on a “Special Employee Database” (DS96). The special database contents data on employees based on the Czech Social Security Administration (CSSA) register, which are adjusted according to the results from another statistical questionnaires (Prům 1-12, P 3-04 etc.) and information from other registers (especially the Business Register). The Special database is described in more details in the Chapter 9. Although data from the LFS provide information on the industry structure, the data are not used due to their inconsistency with data from the business statistics94. Data on the number of the employees, from the LFS, are allocated into industries according to the place of the actual workplace of the employees. In the case of the Business statistics, data on the number of the employees are allocated into industries according to prevailing activity of the company.
92 LFS is a survey that is carried out only in resident households. 93 This adjustment is carried out only on the LFSS level, it means that there is different from the adjustments
described under §§ 7.5 and 7.7 94 Other figures of national accounts are based on the Business statistics

50
7.16 Estimate of the industry structure of the employees, who work illegally, is extrapolated on the basis of the last known annual estimate.
Number of self-employed persons
7.17 Estimate of the number of the self-employed persons is based on the information from the LFS that is adjusted according to ESA 2010 methodology. Transfer of data on the self-employed persons to the employee’s category constitutes the greatest methodological adjustment. This adjustment is described under paragraph 7.13.
7.18 Adjustments for the exhaustiveness of recording of the economy include an estimate of deliberately non-registered producers, an estimate of persons working in the illegal economy, an estimate of persons working for self-supply and an estimate of persons for individual housing construction, who are not recorded in the LFS data. Estimates of the number of these persons are extrapolated on the basis of the last known annual estimates. Estimate of the persons working in the illegal economy, which is taken over direct from the last known annual estimate, is an exception; the estimate is allocated pro-rata into individual industries.
Table 7.3: Employed persons – self-employed persons – 2nd quarter 2015 CZK million
Line Code Item 2Q 2015
1 DS98 Data sources - main job 883 007
2 Methodological adjustments -142 924
3 Adjustments for the exhaustiveness 33 867
4 Extrapolation - reconciliation to ANA -6 354
5=1+2+3+4 Employed persons 767 595
7.19 Estimate of the industry structure of collected data and methodology adjustments are based on the year-of-year development of the quarterly LFS data95. The industry structure of persons, within the exhaustive recording of economy, is the result of an extrapolation of the annual estimates for the last known year The estimate of the industry structure of persons working in the illegal economy is an exception. This estimate is taken over from the last known annual estimate (the industry structure is the same in all quarters).
7.3 Employment: total hours worked
7.20 Total worked hours include worked hours for employees and self-employed persons. Estimate of the number of worked hours is based on data on full-time equivalent jobs (Jobs FTE) and on the number of hours actually worked in full-time employment for the corresponding quarter. Worked hours are in compliance with ESA 2010 methodology and include actually worked hours during normal work time, i.e. worked hours extra (overtime hours). Worked hours indicator does not include hours that are paid, but they are not worked (e.g. annual leave, public holidays or sick leave, meal breaks).
7.21 Worked hours indicator is compiled for the national economy as a whole in splitting according to CZ-NACE sections.
7.22 Procedure for calculating of worked hours for the quarter is following:
95 Data from the LFS are only source data for the estimate of the industry structure of self-employed for the
quarter.

51
NUMBER OF WORKED HOURS = A * B,
where A…..average number of actually worked hours in full time job for the quarter,¨
B….number of time job relating to full-time for the quarter (Jobs FTE)
7.23 Data from the LFS are a basis for the indicator of the number of actually worked hours in full-time job by employees as well as for self-employed persons.
7.24 Estimate procedure of the registered number of full-time equivalent (Jobs FTE) is analogous as estimate procedure of employed persons. Estimate of the time jobs relating to full-time job is based on the LFS, which are further adjusted according to ESA 2010 methodology. Carried out adjustments include methodological adjustments and adjustments for the exhaustiveness recording the economy.
7.25 Data on industry structure are based on the number of the employed persons, which is multiplied by a correlation coefficient, which expresses a ratio of the number-time of the full-time job and on the number of employed persons. Calculation of the coefficient is possible only for the annual data. For that reason, the coefficient for the year and the industry is used for all corresponding quarters of the year. The last available annual data are used for individual quarters of the year, for which annual data are not yet available. This calculation method is the same for employees as for self-employed persons.

52
8 Preliminary estimate of GDP (flash estimate of GD P)
8.1 Preliminary estimate of GDP
8.1 Preliminary estimate of GDP provides the first information on economy development of the Czech Republic in the previous quarter, about 15 days before the standard GDP estimate. The preliminary GDP estimates, in the Czech Republic96, are published about 45 days after the end of the quarter. In the form of News Releases they are published quarter-on-quarter (q--o-q) and year on year (y-o-y) volume indices of GDP for the quarter97.
8.2 Besides the GDP preliminary estimate, the CZSO further publishes also a preliminary estimate of employed persons. This estimate is published together with information on GDP (in the form of quick information). It means, about 45 days after ending of the reference period.
8.3 The modelling rate for the preliminary of GDP estimates is due to smaller extent of data source higher than the (latter) standard estimates (see sub-chapter 3.2.4). In the case of the GDP estimate by the production approach , the rate of the estimates is approximately the same as in the cases of the 1st standard estimate of GDP, i.e. about 30%. Specification of the 1st standard estimate is so probably given by more accurate source data than the higher extent of the data sources.
8.4 As to the expenditure approach , the rate of estimates for some items is substantially higher than for the standard estimates described in the sub-chapter 3.2.4. For instance the estimate rate as to the fixed assets formation item is 100%. Higher rate of an estimate is also for exports and imports98.
Sources and procedures of GDP compilation
8.5 The preliminary estimate of GDP is basically based on the same procedure as the 1st and the 2nd standard estimate. However, some estimate procedures of partial items are different, because they are based on another data basis than that, which is available in the standard term (and it is not available for the preliminary estimate). Due to the estimate is based especially on the output side of GDP.
8.6 Data base of the estimate is then different from the GDP standard estimate, especially as to data source P 6-04 (DS11), which is not available and which provides information on important items of the expenditure approach estimate of GDP. The following paragraphs describe differences between output, expenditure and income approaches in the term of preliminary estimate and the standard estimate.
8.7 Production approach used for the preliminary GDP estimate is based on preliminary data sources99, which are generally used in the standard GDP estimate. In principle, the procedures are not different from the standard GDP estimate. At present, the CZSO has mostly available some data on important conceptual adjustments (e.g. FISIM). As to net taxes
96 Since the 4th quarter 2007 97 GDP development adjusted by price changes, seasonal effects and different number of working days 98 Data on services are not available 99 Especially, the quarterly survey - P 3-04 questionnaire (DS89) for S.11 and S.14 sectors or data
sources for the estimate of S.13

53
on products, their preliminary estimates are available from the MoF100 and they are checked with supplementary data sources101 or alternative estimates102.
8.8 Expenditure approach for the preliminary GDP estimate differs, as mentioned above, especially due to unavailability of data source for indicators such as stocks of inventories and fixed capital formation. Therefore, the estimate of stock of inventories is primarily based on the model calculation on a basis of the quarter-of-quarter development in the previous year. Gross fixed capital formation is estimated on basis of the method of commodity flows (see sub-chapter 5.4.1). Data on exports and imports103, as well as final consumption expenditure are based on the similar data (even though preliminary) as in the standard estimate. Because the expenditure side is used particularly as weighting schema for the GDP deflation in the case of the preliminary estimate, potential inaccuracies have insignificant effect on the actual GDP estimate at the average prices of the previous year.
8.9 Income approach for the preliminary GDP estimate is not used in this deadline. However, complete system is fully interconnected, so some items entering the income approach are used for the value added estimate in the non-profit institutions serving households sector (similarly as in the standard estimate).
8.10 As to data sources needed for conversion of GDP components into prices of the previous year, most of the data of price statistics are available for the quarter. However, the price indices for months after the quarter104 are also needed for the holding gains/losses estimate (C01). The data are not available for these months, and the price development is treated as stable. Within regular estimation, the preliminary price indices estimates are then updated.
8.2 Preliminary estimate of employment
8.11 Within the preliminary estimate of employment the number of employed persons in the domestic concept is only estimated (the number of residents and non-residents working in resident production units). The indicators are compiled for the total economy split by sector 2-digit level.
8.12 The methodology of estimating the number of employed persons is the same within the preliminary estimate as for the standard estimate (see Chapter 7). The data sources are the same for both deadlines of the estimate as in the case of the standard estimate (only with the difference that the preliminary estimate is based on the preliminary data sources). Specification of the preliminary estimate (during the standard estimate) is usually very small and results from specified the data source.
100 Because the estimates of individual taxes are based on the time adjusted cash payments, at the time of preliminary GDP estimate, only data for the first month after ending a quarter are available. However, complete estimate needs data also for the second month after ending of the quarter.
101 E.g. preliminary data from the tax declarations to VAT or issued stickers determined for tobacco products 102 Based on the development of expenditure components of GDP, which taxes on products are related to. 103 With the exception of foreign trade with services and some conceptual adjustments 104 Indices used for inventory revaluation with longer turnover

54
9 Main data sources
9.1 This chapter contains descriptions of the main data sources, which are used for estimates of quarterly GDP. The individual data sources are numbered by unique code (DSxx)105, which is used in the previous chapters.
Table 9.1: Overview of data sources
Code Name of the data source Survey
Used in the approach of estimating GDP
Other
Production Expenditure Income
DS08
Quarterly survey of other financial institutions (keeping accounting as entrepreneurs)
Pen 3c-04 x
DS11 Quarterly survey on financial indicators P 6-04 X
DS16 Balance of Payments X X X
DS18 Financial statements for evaluation of fulfilment of local budgets (local BO)
FIN 2-12M X X X
DS20 Profit and Loss Statement for CBO, LBO and SBO
X X
DS21 Balance sheet for CBO, LBO, SBO X
DS24
Accounting statements according to the Decree No 504/2002 Coll., of the Wine-grower Fund
X X X
DS27 Taxes (on accrual basis) X X
DS38 Deposit Insurance Fund X
DS42
Profit and Loss Statement of CNB for units (keeping accounting as banks; for commercial banks, cooperative credit unions and securities dealers (FIS20_11)
FISIFE20 X
DS43 Quarterly survey on interests expenditure and revenue for banks (VISIFE20)
VISIFE20 X
DS45 Quarterly Profit and Loss Statement for financial payment institutions and electronic money
VYPIS20 X
DS50 Profit and Loss Statement FKI/IS VYFOS20 X
DS53 Profit and Loss Statement, Pension funds
Vype2011 X X X
DS54 Profit and Loss Statement, Insurance companies VYPOS20 X X X
DS56 Exports and imports of FISIM X
DS57 Household budget survey (Family accounts) X X
DS58 Foreign trade statistics in goods (national concept)
X X
105 The codes are thus compatible with the other methodological description of the National accounts of the
Czech Republic. This chapter presents only data sources that are used as the basis for the QNAs compilation. Data sources used exclusively in the ANAs are not described in this chapter.

55
Code Name of the data source Survey
Used in the approach of estimating GDP
Other
Production Expenditure Income
DS59 Quarterly survey for imports and exports (ZO 1-04) ZO 1-04 X X
DS61
Accounting statement according to the Decree No 500/2002 Coll. - F Centrum, SŽDC, PGRLF, PRISKO
X X X
DS68 Database ARAD operated by the CNB X
DS70 Profit and Loss Statement for the CNB (IVIVYS10) IVIVYS10 X
DS72 Supplementary balance sheet for pension funds DOPE31 X X X
DS75 Report of the CNB for Insurance companies on legal accident insurance
RISIPE17 X X X
DS76 Auxiliary Analytical Overview (AAO) X X
DS79 Statistical information on natural damages (CIA) X X X
DS85
Monthly surveys of selected revenue and payments for banks and foreign branches – Dev (ČNB) 11-12 / PESIFE11 (ČNB)
X
DS87 Tourism - exports, imports X
DS89 Quarterly survey for business entities in selected industries
P 3-04 X
DS90
Financial statements for evaluation of fulfilment of the State budget - chapter administrators and other central BO
FIN 1-12 OSS X X X
DS91 Financial statements for assessing fulfilment of state funds budgets FIN 2-12SF X X X
DS92 Quarterly survey of health insurance companies
Zdp 3-04 X X
DS93 Quarterly survey for selected government and similar organisations VPI 3-04 X X
DS94 Quarterly survey in financial intermediation industry
Pen Poj 3-04 X X X
DS95 Quarterly survey on labour Práce 2-04 X X
DS96 Special database of employees X X
DS97 Monthly survey for trade and services SP 1-12 X
DS98 Labour Force Survey (LFS) X
DS99 Consumer price index X
DS100 Price indices of producers X
DS101 Price indices of exports and imports X

56
DS08 Quarterly statement of other financial institutions keeping accounts as entrepreneurs (Pen 3c-04)
9.2 This data source is used for ensuring of underlying information determined for the estimation of output and intermediate consumption for financial institutions that are not included under the CNB reporting. The survey is submitted by units whose prevailing activity consists in providing financial services (classified under 64.2106 and 64.9107 CZ-NACE or in providing of performed services or services closely related to financial intermediation (classified under 66.1108 and 66.2109 CZ-NACE and that keep accounting as entrepreneurs.
DS08 data source: Statistical survey Pen 3c-04
Name of survey: Quarterly survey of other financial institutions (keeping accounting as entrepreneurs)
Link to surveys undertaken at the European level The surveys are not carried out at European level
Periodicity: Quarterly
Time of availability of results 50 days after the reference period
Main variables used in QNA: Average registered number of employees, wages without other personnel costs, acquisitions and disposals of long-term tangible and intangible assets, financial indicators of non-banking financial institutions, stocks of assets and liabilities
Further adjustments made to the survey data: Gross-up to a complete set using annually collected data
DS11 Quarterly survey on financial indicators (P 6-04)
9.3 This data source includes quarterly data on financial indicators of business entities. The survey is carried out in 2000 organisations that have important assets classified in non-financial corporations sector S.11 (stocks indicators) and in units, keeping accounts as entrepreneurs and classified in the general government sector S.13 (stocks and flows indicators). Data on inventory stocks split by individual type are also surveyed for the quarterly national accounts.
106 i.e. activities of holding companies 107 i.e. other financial intermediation 108 Auxiliary activities relating to financial intermediation, excluding insurance and pension financing 109 Auxiliary activities relating to insurance and pension financing
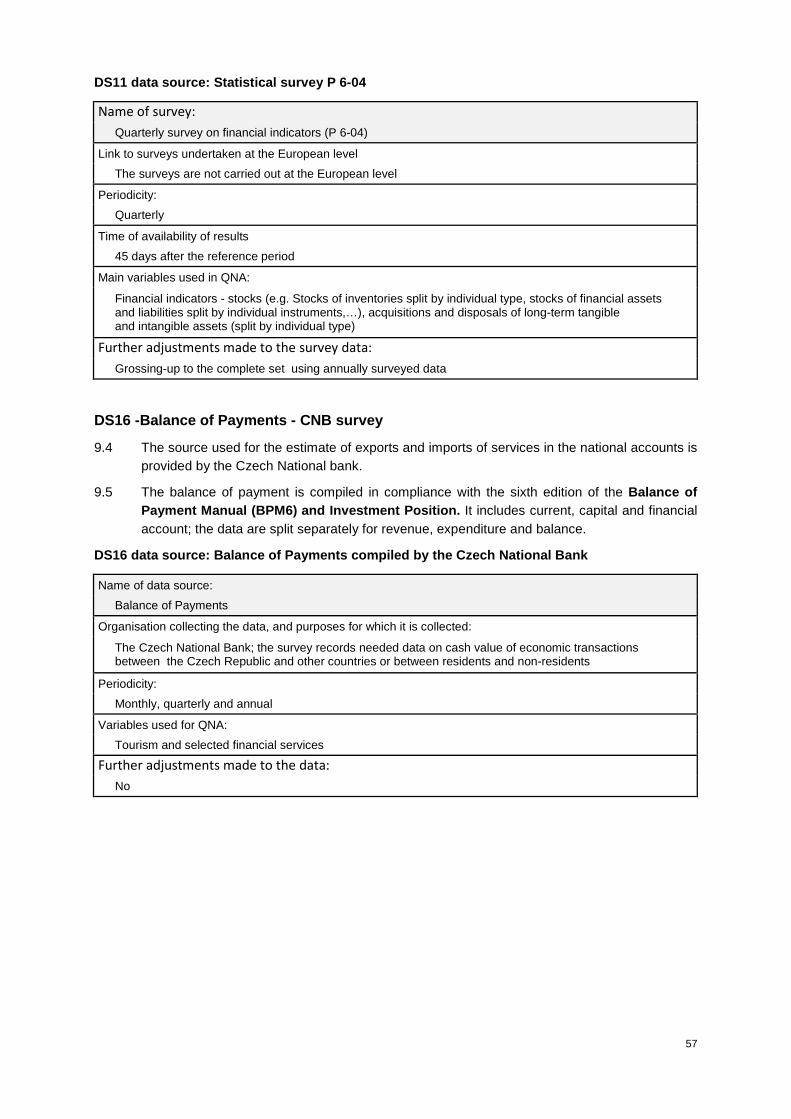
57
DS11 data source: Statistical survey P 6-04
Name of survey:
Quarterly survey on financial indicators (P 6-04)
Link to surveys undertaken at the European level
The surveys are not carried out at the European level
Periodicity:
Quarterly
Time of availability of results
45 days after the reference period
Main variables used in QNA:
Financial indicators - stocks (e.g. Stocks of inventories split by individual type, stocks of financial assets and liabilities split by individual instruments,…), acquisitions and disposals of long-term tangible and intangible assets (split by individual type)
Further adjustments made to the survey data:
Grossing-up to the complete set using annually surveyed data
DS16 -Balance of Payments - CNB survey
9.4 The source used for the estimate of exports and imports of services in the national accounts is provided by the Czech National bank.
9.5 The balance of payment is compiled in compliance with the sixth edition of the Balance of Payment Manual (BPM6) and Investment Position. It includes current, capital and financial account; the data are split separately for revenue, expenditure and balance.
DS16 data source: Balance of Payments compiled by t he Czech National Bank
Name of data source:
Balance of Payments
Organisation collecting the data, and purposes for which it is collected:
The Czech National Bank; the survey records needed data on cash value of economic transactions between the Czech Republic and other countries or between residents and non-residents
Periodicity:
Monthly, quarterly and annual
Variables used for QNA:
Tourism and selected financial services
Further adjustments made to the data:
No

58
DS18 Financial statement for evaluation of budgets fulfilment of local budgetary organisations
9.6 The statement is determined for local budgetary organisations (territorial self-governing units, voluntary association of municipalities, regional councils of cohesion regions). It is the main source for these organisations, which contents revenue and expenditure data for their main activity.
DS18 data source: Financial statement of local budg etary organisations (FIN 2-12 M)
Name of data source: Financial statements for evaluation of fulfilment of budgets of Territorial Self-governing Divisions, Voluntary Associations of Municipalities, Regional Council of Cohesion Regions (local BOs)
Organisation collecting the data, and purposes for which they are collected:
The Ministry of Finance; evaluation of fulfilment of budgets of LBO
Periodicity:
Monthly
Variables used for QNA: Revenue (tax revenue, revenue from own activities, revenue from sales of property, other revenue); Expenditure (wages and salaries of employees, legal and other social insurance, purchases of material, water, fuel and energy and services, acquisitions of tangible and intangible assets, paid subsidies etc.)
Further adjustments made to the data: No
DS20 Profit and Loss Statement of central budgetary organisations (incl. the Land Fund), state funds, local budgetary organisations, central and local semi-budgetary organisations
9.7 The statement is determined for the government institutions, so called selected accounting units and it is the main date source for the estimation of output and intermediate consumption.
DS20 data source: Profit and Loss statement of cent ral budgetary organisations (incl. the Land Fund), state funds, local budgetary organisations, central (state) and local SBO
Name of data source:
Profit and Loss Statement for Organisational units of the State (incl. the Land Fund), State Funds, Territorial Self-governing Divisions, Voluntary Associations of Municipalities, Regional Council of Cohesion Regions (local BOs) and central and local semi-budgetary organisations (SBO)
Organisation collecting the data, and purposes for which it is collected: The Ministry of Finance; check of economic activities
Periodicity: Quarterly
Variables used for QNA:
Revenue: sales of services, other revenue; Expenditure (consumption of materials and services, payments of wages and salaries, legal and other social premiums, other expenditure)
Further adjustments made to the data: No

59
DS21 Balance sheet of central budgetary organisations (incl. the Land Fund), state funds, local budgetary organisations, central (stat e) and local semi-budgetary organisations
9.8 The data source DS21 is determined for government institutions so called selected accounting units (organisational units of the State, state funds, territorial self-governing units, voluntary associations of municipalities, regional councils of cohesion regions and central and local semi-budgetary organisations). It is important source for the estimate of changes in inventories and gross fixed capital formation.
DS21 data source: Balance sheets for central budget ary organisations (incl. the Land Fund), state funds, local budgetary organisations, central (state) and local semi-budgetary organisations
Name of data source: Balance Sheet for central and local semi-budgetary organisations (SBO), organisational units of the State (incl. the Land Fund), State Funds and local budgetary organisations (LBO)
Organisation collecting the data, and purposes for which it is collected: The Ministry of Finance; check of economy activities
Periodicity: Quarterly
Variables used for QNA: Stocks of long-term tangible and intangible assets, inventories by kind
Further adjustments made to the data: No
DS24 Accounting statements according to the Decree No 504/2002 Coll. /2002 Coll., – Vine-grower Fund
9.9 The Fund provides the individual data directly to the CZSO. The Fund collects compulsory levies from wine growers, producers and importers of wine and provides subsidies and grants. These accounting statements are the main data source used for the estimate of output and intermediate consumption of this unit.
DS24 data source : Accounting statements according to the Decree No 50 4/2002 Coll., – Vine-grower Fund
Name of data source: Accounting statements according to the Decree No 504/2002 Coll. - of the Vine-grower Fund
Organisation collecting the data, and purposes for which it is collected: The CZSO; data from the statement are determined for purposes of compilation of quarterly national accounts
Periodicity: Quarterly
Variables used for QNA: Revenue (sales of services, revenue from compulsory levies paid by producers and importers of vine); Expenditure (consumption of material and services, payments for wages and salaries, legal and other social premium, subsidies etc.)
Further adjustments made to the data:
No

60
DS27 Accrual taxes
9.10 The Ministry of Finance provides information on taxes revenue (cash) adjusted by time shifted method. By this method following taxes are transformed from cash basis to accrual basis: value added tax, excise duties, road tax, tax on acquisitions of real estate, and taxes on lotteries, gambling and betting, real estate tax, tax on income and inheritance and gift tax.
9.11 The MoF provides the data to the CZSO on basis on the signed agreement in deadline 42 days (as preliminary) and 75 days (as final) after the end of the reference quarter.
DS27 data source: Accrual taxes - Ministry of Finan ce
Name of data source: Taxes on the accrual basis (time shifted)
Organisation collecting the data, and purposes for which it is collected: Financial Administration Bodies ensuring tax administration including their collection, subordinated to the MoF
Periodicity: Quarterly
Variables used for QNA: Value added tax, consumer tax on tobacco products, import duty, tax on electricity and gas, solar tax ,real estate tax, etc.
Further adjustments made to the data: VAT can be adjusted on the basis of the development of GDP components, to which VAT applies. The sum
of the quarters for the year (in the QNAs) respects always the annual information on accrualised VAT in compliance with this data source
DS38 Accounting statements and supplemental data – Deposit Insurance Fund
9.12 The Deposit Insurance Fund provides its Profit and Loss Statement, Balance Sheet and supplementary data. The data are used for compiling of all indicators of the quarterly national accounts for this unit (for the quarterly GDP estimate, especially for the estimate of output and intermediate consumption).
DS38 data source: Accounting statements and supplem ental data – Deposit Insurance Fund
Name of data source Accounting statements - Profit and Loss Statement, Balance Sheet and supplemental data - Deposit Insurance Fund
Organisation collecting the data, and purposes for which it is collected: The CZSO obtains the data directly from the DIF
Periodicity: Quarterly
Deadline when the results are available: 60 days after the end of the calendar quarter
Variables used for QNA: Revenue (sales of services, other revenue); Expenditure (consumption of material and services, payments of wages and salaries, legal and other social premiums, other expenditure) Stocks of long-term tangible and intangible assets, financial assets, inventories, liabilities); Contributions received from banks, insurance claims of clients, detailed information on "other receivables", "Other expenses", "Other revenues", data for debt securities consolidation
Further adjustments made to the data: No

61
DS42 Monthly and quarterly Profit and Loss Statemen t for commercial banks, cooperative credit unions and security dealers clas sified in S.125 subsector and for security dealers classified in S.126 (FISIFE20_11)
9.13 The CZSO obtains the quarterly Profit and Loss Statement for commercial banks, cooperative credit unions and security dealers classified in S.125 subsector and for security dealers classified in S.126, from the Czech National Bank. Selected items are used for the quarterly national accounts from the statement.
DS42 data source: Profit and Loss Statement for com mercial banks, cooperative credit unions and security dealers – CNB survey
Name of the survey: Profit and Loss statement for commercial banks, cooperative credit unions and security dealers classified in S.125 subsector and for security dealers classified in S.126 subsector (FISIFE20_11)
Link to surveys undertaken at the European level The surveyed is organised in compliance with Regulation (EU) No 575/2013 of the European Parliament and of the Council on prudential requirements for credit institutions and investment firms and related delegated and implementing acts and amending Regulation No 648/2012
Periodicity: Quarterly
Time of availability of results For commercial banks: The CNB organised collection and processing of the data for purpose of the banking statistics; Statements from the 1st to 11th month in deadline T+25 days, for 12th to 10th February of the following year. The CNB sends processed data for individual quarters as follows: For the preliminary quarterly estimates: 1st to 3rd quarter to T+33 days, where T is the end for the reference quarter. For the final quarterly estimates: 1st to 3rd quarter to T+50 days, where T is end for the reference quarter. For the preliminary quarterly and final estimate for the 4th quarter, they are used only data for the 10th and 11th month. The CNB sends in deadline: end of the 11th month + 60 days + estimated values for the 12th month (based on data for the 10th and 11th month). For cooperation credit unions: quarterly in deadline T+35 days; the last quarter in deadline T+50 For security dealers: quarterly and annually in deadline T+40.
Main variables used in QNA:
- revenue from fees and commissions - other operating revenue - expenditure for fees and commissions - other operating expenditure - other administrative expenditure
Further adjustments made to the data: Within S.122 subsector, values for all banks are recorded, except for the Czech-Moravian Guarantee and Development Bank and the Czech Export Bank. Data for these banks are recorded in S.1311 subsector

62
DS43 Quarterly surveys on interest expenditure and revenue of banks (VISIFE20)
9.14 The CZSO obtains the quarterly statements on interest expenditure and revenue of a bank from the Czech National Bank. They are individual data. For the quarterly national accounts selected items on interest expenditure and revenue (see table) are used. The data are used for the FISIM calculation.
DS43 data source: CNB survey
Name of the survey:
Quarterly statement on interest revenue and expenditure of the bank (VISIFE20)
Periodicity:
Quarterly
Time of availability of results
The CNB organises collection and processing the data. Individual banks and their foreign subsidiaries send the information for the 1st to 3rd quarter in deadline T+25 days after the end of surveyed quarter and for the 4th quarterly to 10 February of the following year. The CNB sends the processed data for the individual quarters to the CZSO by this way: For the preliminary quarterly estimates: 1st to 3rd quarter to T+33 days, where T is end for the reference quarter. For the final quarterly estimates: 1st to 3rd quarter to T+55 days, where T is end for the reference quarter. For the preliminary and final quarterly estimate for the 4th quarter, they are used data for the 3rd quarter due to late processing the data for December.
Main variables used in QNA: They are used only grand totals of the values of the interest revenue and expenditure (in CZK) for the individual institutional sectors, subsectors and within them for public, national private and under foreign control sub-sectors.
Further adjustments made to the data: Within S.122 subsector, data on interest are recorded without interest reported by banks, which are classified in S.1311 (i.e. the Czech-Moravian Guarantee and Development Bank and the Czech Export Bank). FISIM is not calculated for these two banks.

63
DS45 Quarterly Profit and Loss Statement of payment institutions, electronic money institutions (VYPI20_11)
9.15 This data source, quarterly Profit and Loss Statement of payment institutions and electronic money institutions, is obtained from the Czech National Bank. They are individual data. Selected items from this statement are used for the quarterly national accounts compilation (see table).
DS45 data source: CNB survey
Name of the survey:
Quarterly Profit and Loss Statement of payment institutions and electronic money
Periodicity:
Quarterly
Time of availability of results
For the 1st to 3rd quarters in deadline T+35 days; after the end of the quarter For the 4th quarter in deadline T+50 days, after the end of the quarter
Variables used for QNA: - revenue from fees and commission - other financial revenue - other operating revenue - expenditure for fees and commissions - other operating expenditure - other administrative expenditure
Further adjustments made to the data: No

64
DS50 Quarterly Profit and Loss Statement of collect ive investment funds (CIF) and investment companies (IC) – (VYFOS20)
9.16 This data source, quarterly Profit and Loss Statement of collective investment funds (CIF) and investment companies (IC) is obtained from the Czech National Bank. They are individual data. Detail items from this statement are used for the quarterly national accounts compilation.
DS50 data source: CNB survey
Name of the survey: Quarterly Profit and Loss Statement of collective investment funds (CIF) and investment companies (IC)
Periodicity: Quarterly
Time of availability of results
For the 1st to 3rd quarters in deadline T+40 days; after the end of the quarter For the 4th quarter in deadline T+55 days, after the end of the quarter
Variables used for QNA: - revenue from fees and commissions - other financial revenue - other operating revenue - expenditure for fees and commissions - other operating expenditure - other administrative expenditure
Further adjustments made to the data: No

65
DS53 Profit and Loss Statement - Pension funds
9.17 Profit and Loss Statement of a pension fund constitutes an overview of revenue and expenditure items and economic activities of the pension fund in compliance with the Decree No 501/2002 Coll.; the Decree implements some provisions of the Act No 563/1991 Coll., on accounting, as amended, determined for accounting units that are banks and other financial institutions. Collection and processing the statements is ensured by the Czech National Bank for the purposes of the state supervision over pension funds. The CZSO takes over these individual statements in the form of a DBF file. The statement is important data source for the purposes of output and intermediate consumption estimate within the quarterly GDP estimate.
DS53 data source: Profit and Loss Statement - pensi on funds (VYPE2011) - CNB survey
Name of the survey:
Quarterly Profit and Loss Statement of pension funds
Periodicity:
Quarterly
Time of availability of results
The first data are available in deadline T+33 days; other data are available in deadline T+50 days, where T is end for the reference quarter. Revised data are available in deadline T+9 moths.
Main variables used in QNA: Accounting information on revenue and expenditure and economic results. More detailed structure of revenue and expenditure relating to fees and commissions and other administrative expenditure follows their structure stated in the laws on pension saving and supplemental pension insurance. Data are reported from the beginning of the year to the end of the reference quarter. Main variables used in the national accounts are revenue and expenditure from interest and similar revenue. Revenue and expenditure from fees and commissions, profit or loss from financial transactions, profit or loss for the accounting period before taxation and profit or loss for the accounting period after taxation.
Further adjustments made to the data:
No

66
DS54 Profit and Loss Statement – Insurance Companie s
9.18 The data source contains accounting data for insurance companies and reinsurance companies. All units, which are registered in the Business Register and engaged in insurance as the main activity, are obliged to fill the statement regardless of a number of employees. The statement is used as the main base for compilation of quarterly and annual national accounts. The reported data serve as a basis for compilation of the total sequence of the national accounts of units classified in S.128 sub-sector and for the insurance companies classified in S.1311 sub-sector.
9.19 The CNB collects and processes accounting statements of insurance companies and reinsurance companies for needs of the state supervision over these units. The Profit and Loss statement of the insurance/reinsurance company is compiled in compliance with the Decree (of the MoF) No 202/2002 Coll. as amended, which implements some provisions of the Act No 563/1991 Coll., on accounting, as amended, for accounting units, which are insurance companies.
DS54 Profit and Loss Statement - insurance companie s/reinsurance companies (VYPOS20) – CNB survey
Name of survey: Profit and loss Statement of the Insurance Company/Reinsurance Company VYPOS20
Link to surveys undertaken at the European level The surveys are not carried out at the European level
Periodicity: Quarterly
Time of availability of results
The first data are available in deadline T+33 days; other data are available in deadline T+50 days, where T is end for the reference quarter.
Main variables used in QNA: The statement consists of 3 part: VYPO20_Technical account for non-life insurance: Main indicators: earned premiums, insurance benefit costs, transferred revenue from financial placement, other technical income, operating expenses, other technical expenses, changes in other technical provisions, incl. reinsurers' share, change of equalization provision, bonuses and rebates. VYPO20_Technical account for life insurance: Main indicators: earned premiums, insurance benefit costs, investment income, gains on investments, other technical income, operating expenses, other technical expenses, investments, disposals of investments, change in other technical provisions, incl. of reinsurers, premiums and discounts, the transfer of investment income. VYPO20_21 Non-technical account Main indicators: the results of the technical accounts, income from financial placement, transferred income from financial placement, other income, expenses related to financial placement, other expenses, taxes, gains and losses. Individual parts of the statement are split according to the standard financial statement structure resulting from the Decree No 502/2002 Coll., as amended, the Annex No 2 The values of individual expense items are recorded with the negative sign. The values of individual revenue items are recorded with the positive sign. As to changes in value of stocks, a share of an insurer, transfer of income from financial placement and taxes and profit and loss items, items reported in the negative value constitute the expenses and items in the positive value constitute the income. Individual items of the statement contain turnover value from the beginning year to the end of reference period. Further adjustments made to the survey data: No

67
DS56 Exports and imports of FISIM
9.20 The data source DS56 is quarterly compiled model calculation of the CNB, for exports and imports values, including values of imported and exported interest. Data are reported according to sector and they are taken over into the total FISIM calculation.
DS56 data source: Model calculation of the CNB
Name of data source: Exports and imports of FISIM Organisation collecting the data, and purposes for which it is collected: Model calculation carried out by the CNB Periodicity: Quarterly; in deadline T+50
Variables used for QNA: Total value of imported/exported FISIM split by subsector; value of imported/exported interest Further adjustments made to the data: No
DS57 Household Budget Statistics
9.21 Family Budget Statistics provides information on the amount of private household’s expenditure and on their consumption structure. It monitors household’s consumption arranged by different of viewpoints and effects of different of factors (price movements, market situation) on expenditure structure. Data from this statistics make it possible to analyse the structure of revenue, expenditure and consumption according to individual type of households.
9.22 The household, i.e. a group of persons living together, which collectively participate in financing main expenditure is a reporting unit. Reporting units are chosen by deliberate quota sampling. Quota characteristics of the basic population are following: social group of households, number of dependent children, the number of household members and net cash income per person. For the single-member household of pensioners, the sex is also by a selective characteristic.
DS57 data source: Household budget survey (Family a ccounts) Statistics
Name of survey: Family Budgets Link to surveys undertaken at the European level: The surveys are not carried out at the European level Periodicity: Quarterly Time of availability of results: 62th day after the end of the reference period
Main variables used in QNA: Expenditure in CZK per person
Further adjustments made to the survey data: Grossing-up to the complete population; estimates for selected commodities (alcohol, tobacco etc.)

68
DS58 External Trade Statistics in Goods (national c oncept)
9.23 The data source 58 is the main source for the estimate of exports and imports of goods in the national accounts. In compliance with ESA 2010, it fully respects a rule relating to a change of ownership between residents and non-residents (national concept).
9.24 National concept of external trade is based on two basic systems of data collection of external trade statistics (Intrastat, Extrastat). These systems primarily serve to the statistics, which is based on the crossing of goods across borders (cross-border concept).
9.25 Intrastat and Extrastat systems and the main adjustments leading to the national concept are showed in the following table. External Trade Unit of the CZSO is responsible for processing of the national concept.
DS58 data source: External Trade Statistics in good s - General Directorate of Customs and Custom Offices
Name of data source: National concept of External Trade Statistics
Organisation collecting the data, and purposes for which it is collected: General Directorate of Customs and Customs Office; monitoring the movement of goods between the Czech Republic and other EU Member States (Statement for Intrastat) and between countries outside EU (Single Administrative Document - Extrastat).
Periodicity: Monthly
Variables used for QNA: Exports and imports of goods with the following attributes: the country of destination/origin, commodity structure KN8 (invoiced or the statistical value), delivery conditions, which make possible valuating each transaction by CIF and FOB.
Further adjustments made to the data: 1) Mathematical-statistical grossing-up 2) Conversion of data into the national concept - exclusion of business operations, which do not take account the change of ownership (quasi transit) and adding of business operations between residents and non-residents, which take place within the Czech Republic.

69
DS59 Quarterly survey on imports and exports of ser vices (ZO 1-04)
9.26 The data source DS59 is the main source of international trade in services. This statistical survey provides data on imports and exports excluding tourism and financial services provided by financial institutions.
DS59 data source: Quarterly statistical survey on i mports and exports of services (ZO 1-04)
Name of survey: Quarterly survey on imports and exports of services
Link to surveys undertaken at the European level: The surveys are not carried out at the European level
Periodicity: Quarterly
Time of availability of results): 46th day after the end of the reference period
Main variables used in QNA: Exports and imports of services: code of service, origin country, destination country, currency code, invoiced amount
Further adjustments made to the survey data: Reported transport services relating to exports and imports of goods are adjusted according to ESA 2010 (§ 3.177 and 3.178). Combination of two aspects is taken in account: 1) territory on which the goods moves (a country from which the goods is carried, country of destination; territory between these countries) 2) what transporter is transporting the goods (resident or non-resident). Individual combinations of the calculation of the transport services allow well to supplement imports and exports data at FOB and CIF valuation.
DS61 Accounting statements according to the Decree No 500/2002 Coll., for entrepreneurs – F-Centrum, RIA, SGAFF, Prisko
9.27 DS61 is used as the main source of information on F-Centrum, Railway Infrastructure Administration (RIA), Support and Guarantee Agricultural and Forestry Fund (SGAFF) and PRISKO, i.e. accounting units classified in S.1311, which as entrepreneurs use double-entry bookkeeping system on accrual principle. These units provide the accounting statements directly to the CZSO, on the individual basis. Data are used especially for the output and intermediate consumption estimate in the general government.
DS61 data source: Accounting statements according to the Decree No 5 00/2002 Coll., for entrepreneurs
Name of data source: Accounting statements according the Decree No 500/2002 Coll. - of F-centrum, RIA, SGAFF, PRISKO
Organisation collecting the data, and purposes for which it is collected: The CZSO; data from the statement are used for purposes of compilation of quarterly national accounts
Periodicity: Quarterly
Variables used for QNA: Revenue (revenue from sales of services, other revenue) Costs (consumption of material, wages and salaries costs, legal and other social insurance, other costs)
Further adjustments made to the data: No

70
DS68 Database ARAD – time series system
9.28 DS68 source is a public database, which is part of the CNB information system. It is united presentation system of time series of aggregated data for individual statistics and financial market area. Most of this information is based on statistical processing conducted directly by the CNB; some data are taken from external sources. The ARAD database is divided into two main blocks that contain statistical data (e.g. information from the Monetary and Financial Statistics) and basic indicators of the financial market
DS68 data source: CNB database
Name of data source: Database ARAD
Organisation collecting the data, and purposes for which it is collected: The Czech National Bank; It is a database of statistical data based on different sources managed by the CNB. For each source table an administrator is responsible for the data sources and the methodology. The source DS68 includes a lot of statistical data in the form of time series for units from all institutional sectors. The data are based on both the CNB processing and external sources.
Periodicity: Monthly or quarterly
Variables used for QNA: Stocks of client loans and deposits of commercial banks split by sub-sector; the monthly stocks of interbank loans and deposits from the balance sheets of these banks split by resident/non-resident; total households debt for housing
Further adjustments made to the data: No

71
DS70 Quarterly Profit and Loss Statement of the Cze ch National Bank (IVIVYS10)
9.29 The CZSO takes over the quarterly Profit and Loss Statement of the Czech National Bank from the CNB. They are individual data. The selected items from the statement are used for the quarterly national accounts compilation.
DS70 data source: Accounting statement of the Czech National Bank
Name of survey: Profit and Loss Statement of the Czech National bank
Link to surveys undertaken at the European level The surveys are not carried out at the European level
Periodicity: Monthly
Time of availability of results : The first three quarters: in deadline T+33 days after the end of the last month of the reference quarter The last quarter: in deadline T+50 days after the end of the December
Main variables used in QNA: Costs for employees Social costs Depreciation of tangible assets Depreciation of intangible assets Fees and commissions costs Costs of printing banknotes Purchases of performances Other operating costs Revenue from fees and commissions Further adjustments made to the survey data: No

72
DS72 Supplementary Balance Sheet of pension funds
9.30 Statement “Specification of received and paid funds” includes data on all received and paid means relating to supplementary social insurance.
9.31 The Czech National Bank ensures collection and processing of the statement.
DS72 Supplementary Balance Sheet of pension funds ( DOPE31) – CNB survey
Name of survey: Supplemental Balance Sheet of the pension funds DOPE31
Link to surveys undertaken at the European level: The surveys are not carried out at the European level
Periodicity Quarterly
Time of availability of results The results are available in two deadline T+33 days and T+50 days after the end of the reference period
Main variables used in QNA: The statement contains three parts: DOPE31_11: Received funds in the reference period The data area includes all received funds by a pension company relating to the pension insurance, supplement pension saving including the supplementary pension insurance through the transformed fund. Received means are reported in the aggregated form for the pension funds, participatory funds and the transformed fund from the beginning of the year at the end of the reference period in CZK thousand. The main indicators: Own contributions of participants, contributions from the state, contributions from employers, means transferred from another insurance company, means transferred from the transformed fund into a participatory fund.
DOPE31_21: Paid means in the reference period This part of the statement includes data on all means paid by the insurance company relating to compulsory and supplemental pension savings including the supplemental pension insurance through the transformed fund. Paid means are reported in aggregated form for pension funds, participatory funds and transformed funds from the beginning of the year at the end of the reference period in thousand CZK. Main aggregates: Means paid to participants, means of a one-time premium, means transferred to another insurance company, means transferred into participatory funds from the transferred fund, returned means into the State budget, returned contributions to participants.
DOPE31_22: Stock of means: The data area includes the total stock of means of the participants of the pension savings, supplementary pension savings and supplementary pension insurance operated through the transformed fund. For the pension saving (pension funds) and supplementary pension saving (participants funds) the total stock of means for all personal accounts as well as for pension accounts, which are kept by the pension company for each participant is reported.
Further adjustments made to the survey data: No
DS75 Report on statutory accident insurance
9.32 The data source includes survey results on statutory accident insurance for insurance companies, which are entitled to manage insurance of employer responsibility for work injuries and occupational diseases according to the Decree No 125/1993 Coll. The Czech National Bank collects and processes the statements and, in compliance with the agreement, the CNB sends the statement to the CZSO.
9.33 Data from the statements are used as the main data source for the quarterly and the annual national accounts for units classified in S.129.

73
DS75 data source: Report on statutory accident insu rance (RISIPE17) – CNB survey
Name of survey: Report on legal accident insurance
Link to surveys undertaken at the European level: The surveys are not carried out at the European level
Periodicity (e.g. quarterly/monthly/other- to be specified): Quarterly
Time of availability of results (e.g. 40 days after the end of the reference period): The first data are available in deadline T+33 days; other data are available in deadline T+50 days, where T is end for the reference quarter.
Main variables used in QNA: The main indicator is gross premium written for the statutory accident insurance, i.e. insurance of employer responsibility for work injuries and occupational diseases according to the Decree (of the MoF) No 125/1993 Coll., as amended. The item includes values from the beginning of the year to the end of the reference period. Expenses for insurance claims from the statutory incident insurance: i.e. the gross claims paid resulting from the statutory accident insurance responsibility of employers for work injuries or occupational diseases according to the Decree (of the MoF) No 125/1993 Coll., as amended.
Further adjustments made to the survey data: No
DS76 Auxiliary Analytical Overview (AAO)
9.34 DS76 source, Auxiliary Analytical Overview, is determined for selected government units (in compliance with the Act No 563/1999 Coll., on accounting, as amended). The statement belong among basic accounting sources used for compilation of quarterly and annual national accounts for units classified in S.1311, S.1313 and for semi-budgetary organisations classified in S.11001 (see footnote 32). It is used for compilation of non-financial and financial accounts, gross fixed capital formation, acquisitions of land and inventories. It is also an appropriate source for the consolidation of General Government accounts.
DS76 data source: Auxiliary Analytical Overview (AA O)
Name of data source: Auxiliary Analytical Overview
Organisation collecting the data, and purposes for which it is collected: Ministry of Finance
Periodicity: Quarterly
Variables used for QNA: The initial and final stocks and turnover of selected items of the balance sheets, detailed information on expenditure and revenue from the beginning year, for the main and secondary activity; long-term intangible and tangible assets split by type of the changes, inventories split by type of the changes
Further adjustments made to the data: No
DS79 Statistical data on the natural damages
9.35 The data source includes statistical data on the natural damages surveyed by the Czech Insurance Association for the member insurance companies. The data are used as an auxiliary source for compilation of quarterly and annual national accounts, especially for calculating the amount of the capital transfer arising from the claims paid for these natural damages, for the units classified in S.128 sub-sector. The statistical data are published on the web sites of the Czech Insurance Association. .

74
DS79 data source: Statistical data on the natural d amages
Name of data source: Statistical data on the natural damages
Organisation collecting the data, and purposes for which it is collected: The Czech Insurance Association (CIA), non-profit institution established to organise and support of mutual assistance, cooperation and ensure interests of the insurance and reinsurance companies. It is a Member of the Insurance Europe (formerly the European Insurance and Reinsurance Federation - EIRF); The Czech Insurance Association processes data obtained from its members and publishes them via the web-sites of the Association.
Periodicity: Quarterly
Variables used for QNA: Total volumes of damages caused by floods, storms and damage caused by weight of snow. They include claims incurred from property insurance of individuals, property insurance of businessmen and damages to motor vehicles. Total number of damages caused by floods, storms and damages caused by weight of snow. They include the total number of claims incurred from property insurance of individuals, property insurance of businessmen and damages to motor vehicles.
Further adjustments made to the data: No
DS85 Monthly survey of the bank/the subsidiary of f oreign banks on collected receipts and payments (Dev (CNB) 11-12/PESIFE11)
9.36 The DS85 source is one of sources used for the estimate of exports and imports of services. The Czech National Bank provides the data, which relate to aggregated data on encashment and payments for financial services carried out by banks in relation to abroad and split by country.
DS85 data source: Monthly survey of the bank/the su bsidiary of foreign banks on collected receipts and payments (Dev (CNB) 11 -12/PESIFE11)
Name of data source: Monthly survey of the bank / the subsidiary foreign banks on collected receipts and payments
Organisation collecting the data, and purposes for which it is collected: The Czech National Bank; part of the Balance of Payment item in the area of exports and imports of financial services
Periodicity: Monthly
Variables used for QNA: Financial services split by individual country
Further adjustments made to the data: No
DA87 Tourism – exports, imports
9.37 The source is used to estimate exports and imports of services. It provides estimates of purchases abroad carried out by residents and purchases carried out by non-residents in the Czech Republic that are relating to tourism. The information is provided by the CNB, which in some cases cooperates with the CZSO. This cooperation relates to the estimates of seasonal business trips and study stays.

75
DS87 data source: Tourism
Name of data source: Tourism
Organisation collecting the data, and purposes for which it is collected: The Czech National Bank collects data on tourism
Periodicity: Quarterly
Variables used for QNA: Business Travel (seasonal, other), Personal Travel (health stays, study stays, others)
Further adjustments made to the data: The estimates, carried out by the CNB, are available only in aggregated form. Within the expert estimates there are specified the commodity structures on 2-digit level, for needs of the quarterly national accounts.
DS89 Quarterly survey for economic entities of sele cted production industries (P 3- 04)
9.38 It is a quarterly statistical survey in business entities classified into S.11 and S.14. Exhaustive survey is organised for units with more than 50 employees; sample survey is organised in units with 20 to 49 employees and in addition to the individual survey it is carried out in units with high volume of non-financial assets.
9.39 Grossing-up indicators from sample survey is performed with the use of the VAT and the number of employees data.
9.40 Estimates of the indicators for the units, which have not submitted the statistical survey due to various reasons within the deadline, are calculated on the basis of VAT development taking into account the previously presented data.
9.41 Output and intermediate consumption for units with less than 20 employees are estimated on the basis of data on VAT development provided by the MoF.
DS89 data source: Statistical survey
Name of survey: Quarterly survey for economic entities of selected production industries (P 3-04)
Link to surveys undertaken at the European level: The surveys are not carried out at the European level
Periodicity: Quarterly
Time of availability of results (e.g. 40 days after the end of the reference period): T+40 days and T+55 days after the end of the reference period.
Main variables used in QNA: The indicators entering into value added compilation (sales of goods, own products and services, changes in inventories, capitalisation, costs of goods sold, number of employees, wages and salaries, increases and disposals of long-term intangible and tangible assets.
Further adjustments made to the survey data: Grossing-up items, which are not quarterly surveyed, with using the annual data

76
DS90 Financial statement for evaluation of fulfilme nt of the budget of the chapter administrators and Organisational Units of the Stat e (FIN 1-12 OOS)
9.42 DS90 source is determined for the administrators of chapters and Organisational Units of the State. It is the main accounting source for these organisations; it includes revenue and expenditure relating to their main activity.
DS90 data source: Financial statement for evaluatio n of fulfilment of the budget of the chapter administrators and Organisational Units of the Stat e (FIN 1-12 OOS)
Name of data source: Financial Statement for evaluation of fulfilment of the budget of the chapter administrators and Organisational units of the State
Organisation collecting the data, and purposes for which it is collected: The Ministry of Finance; evaluation of fulfilment of the budget of the chapter administrators and Organisational units of the State
Periodicity: Monthly
Variables used for QNA: Revenue (tax revenue, revenue from the own activities, revenue from sales of assets, other revenue. Expenditure (wages and salaries of employees, statutory social and other insurance, purchases of material, water, fuel and energy, services, acquisitions of intangible and tangible assets, paid subsidies and grants)
Further adjustments made to the data: No
DS91 Financial statement for the evaluation of fulf ilment of the State Funds budget
9.43 The statement introduced by the MoF and determined for the state funds, is the main source of data for these organisations.
DS91 data source: Financial statement for the evalu ation of fulfilment of the State Funds budget
Name of data source: Financial statement for the evaluation of fulfilment of the State Funds budget
Organisation collecting the data, and purposes for which it is collected: The Ministry of Finance; check of economy activities
Periodicity: Monthly
Variables used for QNA: Revenue (tax revenue, revenue from own activities, revenue from sales of property, other revenue); Expenditure (wages and salaries of employees, legal and other social insurance, purchases of material, water, fuel and energy and services, acquisitions of intangible and tangible assets, paid subsidies etc.)
Further adjustments made to the data: Data transposition from the accounting system into national accounts

77
DS92 Quarterly survey of Health Insurance Companies (Zdp 3-04)
9.44 The statistical survey provides data for the health insurance companies and it serves especially to compilation of the quarterly national accounts and to the government deficit and debt calculation.
DS92 data source: Statistical survey
Name of survey: Quarterly survey of health insurance companies (Zdp 3-04)
Link to surveys undertaken at the European level: The surveys are not carried out at the European level
Periodicity: Quarterly
Time of availability of results: T+40 days after reference period, where T is the end of the reference period
Main variables used in QNA: The structure of indicators meets the needs of quarterly GDP estimates and compilation of QNA. The indicators are surveyed for the main and secondary activities (eg. Revenue from own activities, subsidies, etc., and taxes, wages and salaries, etc.). Written premiums are split by payer, i.e. for employers, employees and self-employed persons and payments for health care are split by purpose (classification COFOG). The survey includes also data on acquisitions of long-term intangible and tangible fixed assets split by individual type or acquisitions of inventories.
Further adjustments made to the survey data: No
DS93 Quarterly survey for selected government and s imilar units (VPI 3-04)
9.45 The statistical survey provides data for public universities, public research institutions, legal school entities, the Czech Radio, the Czech Television, the Railway Infrastructure Administration, the Support and Guarantee Agricultural and Forestry Fund, the Deposit Insurance Fund and other selected public non-financial, and financial corporations.
DS93 data source: Statistical survey
Name of survey: Quarterly statistical survey of selected government units and similar organisations (VPI 3-04)
Link to surveys undertaken at the European level: The surveys are not carried out at the European level
Periodicity: Quarterly
Time of availability of results: T+40 days after reference period where T is the end of the reference quarter.
Main variables used in QNA: The structure of indicators meets the needs of quarterly GDP estimates and compilation of QNA. The indicators are surveyed for the main and secondary activities (e.g. revenue from own activities, subsidies, etc., and taxes, wages and salaries, etc.). The survey includes also data on acquisitions of long-term intangible and tangible fixed assets split by individual type or acquisitions of inventories.
Further adjustments made to the survey data: No

78
DS94 Quarterly survey of the financial intermediati on industry (Pen, Poj 3-04)
9.46 This statistical survey provides information on financial intermediation industry used for the quarterly macroeconomic indicators calculation, for the quarterly national accounts compilation and for needs of international organisations.
DS64 data source: Quarterly survey of financial int ermediation industry
Name of survey: Quarterly survey of financial intermediation industry
Periodicity: Quarterly
Time of availability of results: T+40 days after the reference period
Main variables used in QNA: Indicators on labour - the number of employees, wages and salaries, basic data on increases and decreases of intangible and tangible assets
Further adjustments made to the survey data: No
DS95 Quarterly survey on labour (Práce 2-04)
9.47 Sample statistical survey relating to government and non-profit institutions organised especially for the needs of the development of employment and average wages. Obtained indicators are used for the quarterly estimates of gross value added for S.13 and S.15, at current and fixed prices.
DS95 data source: Quarterly survey on labour
Name of survey: Quarterly survey on labour (Práce 2-04)
Link to surveys undertaken at the European level: The surveys are not carried out at the European level
Periodicity: Quarterly
Time of availability of results: T+40 days and T+56 days after the end after the reference period
Main variables used in QNA: The number of employees, wages and salaries, other personal costs
Further adjustments made to the survey data: No
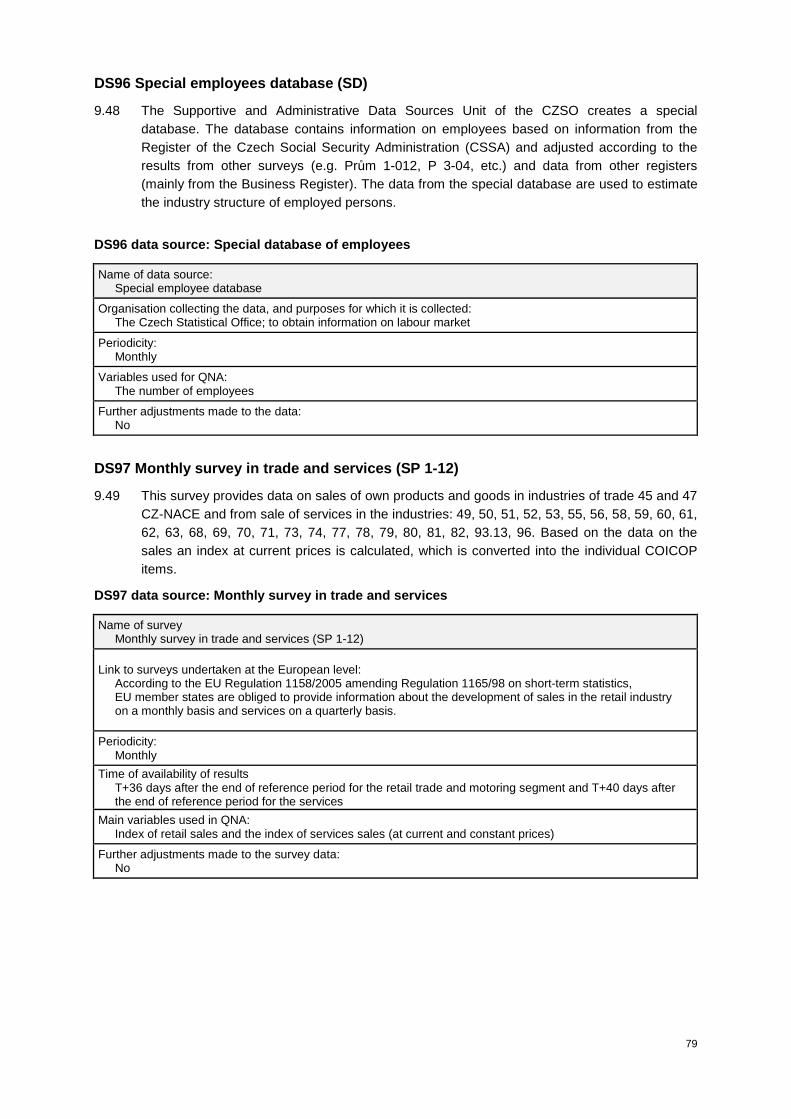
79
DS96 Special employees database (SD)
9.48 The Supportive and Administrative Data Sources Unit of the CZSO creates a special database. The database contains information on employees based on information from the Register of the Czech Social Security Administration (CSSA) and adjusted according to the results from other surveys (e.g. Prům 1-012, P 3-04, etc.) and data from other registers (mainly from the Business Register). The data from the special database are used to estimate the industry structure of employed persons.
DS96 data source: Special database of employees
Name of data source: Special employee database
Organisation collecting the data, and purposes for which it is collected: The Czech Statistical Office; to obtain information on labour market
Periodicity: Monthly
Variables used for QNA: The number of employees
Further adjustments made to the data: No
DS97 Monthly survey in trade and services (SP 1-12)
9.49 This survey provides data on sales of own products and goods in industries of trade 45 and 47 CZ-NACE and from sale of services in the industries: 49, 50, 51, 52, 53, 55, 56, 58, 59, 60, 61, 62, 63, 68, 69, 70, 71, 73, 74, 77, 78, 79, 80, 81, 82, 93.13, 96. Based on the data on the sales an index at current prices is calculated, which is converted into the individual COICOP items.
DS97 data source: Monthly survey in trade and servi ces
Name of survey Monthly survey in trade and services (SP 1-12)
Link to surveys undertaken at the European level: According to the EU Regulation 1158/2005 amending Regulation 1165/98 on short-term statistics, EU member states are obliged to provide information about the development of sales in the retail industry on a monthly basis and services on a quarterly basis.
Periodicity: Monthly
Time of availability of results T+36 days after the end of reference period for the retail trade and motoring segment and T+40 days after the end of reference period for the services
Main variables used in QNA: Index of retail sales and the index of services sales (at current and constant prices)
Further adjustments made to the survey data: No

80
DS98 Labour Force Survey (LFS)
9.50 The main aim of the LFS is to achieve regular information about the labor market situation and to enable analysis from different aspects, especially economic, social and demographic characteristics. The results of the LFS improve information on the nature of employment and unemployment of population and other related factors. In the LFS the recommendations of Eurostat, ILO and other international organisations are implemented, in the maximum possible extent,. They are thus created the preconditions for comparing the situation on the labour market with other countries on the principle of the same methodological approach.
9.51 Data from the LFS are used for the estimate of the employed persons, the estimate of the number of full-time employment contracts, the estimate of worked hours and residents working abroad.
DS98 data source: Labour Force Survey (LFS)
Name of survey Labour Force Survey
Link to surveys undertaken at the European level: The analogue of survey in European Union
Periodicity: Quarterly
Time of availability of results T+45 days after the end of reference quarter
Main variables used in QNA: Employed persons (employees, self-employed persons), the number of full-time employment contracts (employees, self-employed persons), hours worked (employees, self-employed persons) and residents working abroad
Further adjustments made to the survey data: No

81
DS99 Indices of consumer prices
9.52 Development of consumer prices (living costs) is measured according to the consumer basket, which is determined on basis of a selection of goods and services paid by the population. Price representatives include such products and services, which have a significant share in the expenditures of the population and cover the entire area of the consumption. Consumer basket includes about 730 items, which are gradually aggregated into 12 main categories of the consumer basket according to the weighted average of individual price indices. Weights in the consumer basket used to calculate the consumer price indices (living costs) are based on the structure of household expenditure surveyed by the household budget statistics for 2005 and adjusted according to the national accounts statistics.
DS99 data source: Statistical survey of prices in r etail trade
Name of survey: Survey of individual prices in retail trade
Link to surveys undertaken at the European level: The analogue of survey in European Union
Periodicity: Monthly
Time of availability of results T+10 days after the end of reference month
Main variables used in QNA: Indices of consumer prices - at 3-digit level of the COICOP classification.
Further adjustments made to the survey data: No
DS100 Indices of producer prices
9.53 Indices of producer prices include the price indices of industrial producers, price indices of construction works, price indices of market services and price indices of agricultural output.
9.54 Price indices of industrial producers are surveyed monthly on the basis of data provided by the selected organisations (about 1 200) for selected representatives (about 4 700). Monitored prices are prices agreed between the supplier and the customer. They do not include VAT, consumer tax, transport costs to the customer and secondary transport costs and they are invoiced for the most important business cases.
9.55 In 1995 the statistical report for determining of price index of construction works was introduced: the content of the survey is not changed at least two years, and the survey returns between the reporting unit and the Statistical Office. The survey includes 141 price representatives (selected types of construction works). News network determined by purposeful selection included 750 representatives from different classes. Quarterly reported prices were agreed between the supplier and the consumer for the unit of the construction works, which were carried out by own workers of the reporting unit in the Czech Republic. As a complement to the material for domestic construction works, all other costs needed to carry out construction activities are included, except for costs for a building site preparation and VAT.
9.56 Price indices of market services include the following indices from business area: price indices of the domestic transport of goods, postal and communication services, financial intermediation, waste disposal services and other business services.

82
9.57 Price indices of agricultural producers are calculated every month from prices surveyed among about 650 selected producers in agriculture (private, cooperative and public enterprises); these price indices do not include VAT. Negotiated prices obtained in the internal market (excluding output for own use) are surveyed. From 1 January 2001, prices of agricultural producers monitored for 95 basic agricultural products (i.e. price representatives): 63 crop products (including fruit and vegetables) and 32 animal products.
DS100 data source: Statistical survey of producer p rices
Name of survey: 27 of partial statistical surveys
Link to surveys undertaken at the European level: The analogues of surveys in European Union
Periodicity: Monthly
Time of availability of results T+15 days after the end of reference month
Main variables used in QNA: Producer price indices - at 2-digit level of the CZ-CPA classification.
Further adjustments made to the survey data: No
DS101 Price indices of exports and imports
9.58 The price indices are calculated in compliance with the Harmonized System and converted so to satisfy dividing according to main SITC groups, Rev. 4 and needs of the national accounts and Eurostat in compliance with the Standard Classification of Products (CZ-CPA). Choice of price representatives was carried out according to enterprises, Joint Stock Companies and Limited Companies that are important in the foreign trade of the Czech Republic (i.e. both production enterprises – about 520 units, and enterprises, which are only engaged by foreign trade – about 480 units. At present, the weighting formula of price representatives includes 1 750 exported and 1 650 imported products, incl. raw materials that have significant share in the value of the key groups traded within the foreign trade.
DS101 data source: Statistical survey of export and import prices
Name of survey: Monthly survey on prices in foreign trade ( oil, products, transport, services)
Link to surveys undertaken at the European level: The analogue of survey in European Union
Periodicity: Monthly
Time of availability of results T+45 days after the end of reference period
Main variables used in QNA: Price indices of exports and imports - at 2-digit level of the CPA classification.
Further adjustments made to the survey data: No