Embed Size (px)
Citation preview
QUARTERLY PERFORMANCE REPORTS: 2015/16 - 3rd Quarter
EASTERN CAPE
Sector: Health
Programme / Subprogramme / Performance Measures Target for
2015/16 as per
Annual
Performance
Plan (APP)
1st Quarter
Planned output
as per APP
1st Quarter
Actual output -
validated
2nd Quarter
Planned output
as per APP
2nd Quarter
Actual output -
validated
3rd Quarter
Planned output
as per APP
3rd Quarter
Preliminary
output
QUARTERLY OUTPUTS
Programme 1: Administration
Percentage of Hospitals with broadband access 50.0% 10.0% 0% 25.0% 0% 35.0% 0%Percentage of fixed PHC facilities with broadband access 49.0% 10.0% 0% 25.0% 15.0% 34.0% 0%
Programme 2: District Health Services
District ManagementPercentage of fixed PHC Facilities scoring above 80% on the ideal clinic dashboard 10.4% 2.0% 0% 5.0% 0% 8.0% 3.7% Patient Experience of Care rate (PHC Facilities) 73.0% 73.0% 0% 73.0% 0% 73.0% 0%Number of Districts with District Clinical Specialist Teams (DCSTs) 8 2 5 4 4 6 - PHC utilisation rate 2.8 0.0 2.7 0.0 2.8 2.8 2.9 Complaints resolution rate 92.0% 92.0% 78.1% 92.0% 78.1% 92.0% 81.0% Complaint resolution within 25 working days rate 80.0% 80.0% 96.9% 80.0% 96.3% 80.0% 97.4%
HIV and AIDS, TB and STI controlTotal clients remaining on ART 355,531 320,746 328,595 332,341 342,216 343,936 352,322 Client tested for HIV (incl ANC) 1,300,648 325,162 371,232 325,162 445,939 325,162 484,409 TB symptom 5yrs and older screened rate 70.0% 70.0% 0% 70.0% 0% 70.0% 49.1% Male condom distribution Rate (annualised) 38 38 48 38 58 38 61 Female condom distribution Rate (annualised) 1 1 1 1 1 1 1 Medical male circumcision performed - Total 49 000 133 3 091 32 3 603 21 067 2 223 TB new client treatment success rate 82.0% 82.0% 83.5% 82.0% 83.6% 82.0% 83.9% TB client lost to follow up rate 6.8% 6.8% 6.3% 6.8% 6.3% 6.8% 7.0%
Maternal, child and women healthAntenatal 1st visit before 20 weeks rate 50.0% 50.0% 54.3% 50.0% 59.6% 50.0% 63.9% Mother postnatal visit within 6 days rate 55.0% 55.0% 56.9% 55.0% 56.9% 55.0% 61.1% Infant 1st PCR test positive around 6 weeks rate 1.5% 1.5% 0.7% 1.5% 1.6% 1.5% 1.8% Immunisation coverage under 1 year (annualised) 90.0% 90.0% 82.4% 90.0% 85.9% 90.0% 88.2% Measles 2nd dose coverage (annualised) 90.0% 90.0% 75.5% 90.0% 88.6% 90.0% 89.0% DTaP-IPV/Hib 3 - Measles 1st dose drop-out rate 0.5% 0.5% 9.4%- 0.5% 25.7%- 0.5% 630.9%- Child under 5 years diarrhoea case fatality rate 5.6% 5.6% 4.9% 5.6% 3.3% 5.6% 2.3% Child under 5 years pneumonia case fatality rate 4.0% 4.0% 2.4% 4.0% 3.7% 4.0% 3.9% Child under 5 years severe acute malnutrition case fatality rate 10.0% 10.0% 13.2% 10.0% 10.8% 10.0% 9.0% School Grade R screening coverage (annualised) 10.0% 2.0% 0% 3.0% 0.8% 6.0% 2.8% School Grade 1 screening coverage (annualised) 27.4% 16.0% 7.0% 22.0% 9.9% 18.0% 18.5% School Grade 8 screening coverage (annualised) 10.0% 2.0% 3.6% 4.0% 5.6% 8.0% 7.1% Couple year protection rate (annualised) 63.0% - 0% - 0% - 0%Cervical cancer screening coverage (annualised) 44.0% 44.0% 64.9% 44.0% 65.0% 44.0% 68.5% Vitamin A 12-59 months coverage (annualised) 55.0% 55.0% 57.2% 55.0% 73.5% 55.0% 67.3%
District HospitalsNational Core Standards self assessment rate 75.0% 75.0% 0% 75.0% 4.5% 75.0% 83.3% Quality improvement plan after self assessment rate 100.0% 100.0% 0% 100.0% 0% 100.0% 90.9% Percentage of Hospitals compliant with all extreme and vital measures of the national core standards 35.0% 10.0% 0% 15.0% 0% 25.0% 0%Patient Experience of Care Survey Rate 100.0% 100.0% 0% 100.0% 0% 100.0% 68.2% Average Length of Stay 4.9 days 4.9 days 5.2 days 4.9 days 5.2 days 4.9 days 5.2 days Inpatient Bed Utilisation Rate 65.0% 65.0% 57.8% 65.0% 58.9% 65.0% 57.7% Expenditure per PDE R 2,166 R 2,166 R 1,910 R 2,166 R 2,030 R 2,166 R 2,781Complaints resolution rate 95.0% 95.0% 94.7% 95.0% 94.7% 95.0% 92.0% Complaint resolution within 25 working days rate 90.0% 90.0% 99.5% 90.0% 99.4% 90.0% 100.0%
Disease Prevention and ControlClients screened for hypertension-25 years and older 80,000 10,000 507,260 35,000 758,181 55,000 759,342 Clients screened for diabetes- 5 years and older 80,000 10,000 353,706 35,000 589,330 55,000 614,868 Client screened for Mental disorders 1.1% 1.1% 0.9% 1.1% 2.1% 1.1% 2.5% Client treated for Mental Disorders new 10.0% 2.5% 15.4% 5.0% 10.0% 7.5% 8.8% Cataract Surgery Rate annualised not measured - - - - - - Malaria case fatality rate not measured - 0% - 0% - 0%
Programme 3: Emergency Medical ServicesEMS P1 urban response under 15 minutes rate 6,600.0% 66.0% 61.9% 66.0% 59.8% 6,600.0% 57.9%
EMS P1 rural response under 40 minutes rate 66.0% 66.0% 42.4% 66.0% 50.0% 66.0% 47.8% EMS inter-facility transfer rate 30.0% 30.0% 27.5% 30.0% 29.3% 30.0% 30.3%
Programme 4: Provincial Hospital Services
General (regional) hospitalsNational Core Standards self assessment rate 75.0% 75.0% 0% 75.0% 0% 75.0% 60.0% Quality improvement plan after self assessment rate 100.0% 100.0% 0% 100.0% 0% 100.0% 100.0% Percentage of Hospitals compliant with all extreme and vital measures of the national core standards 35.0% 35.0% 0% 35.0% 0% 35.0% 0%Patient Experience of Care Survey Rate 70.0% - 0% - 40.0% - 0%
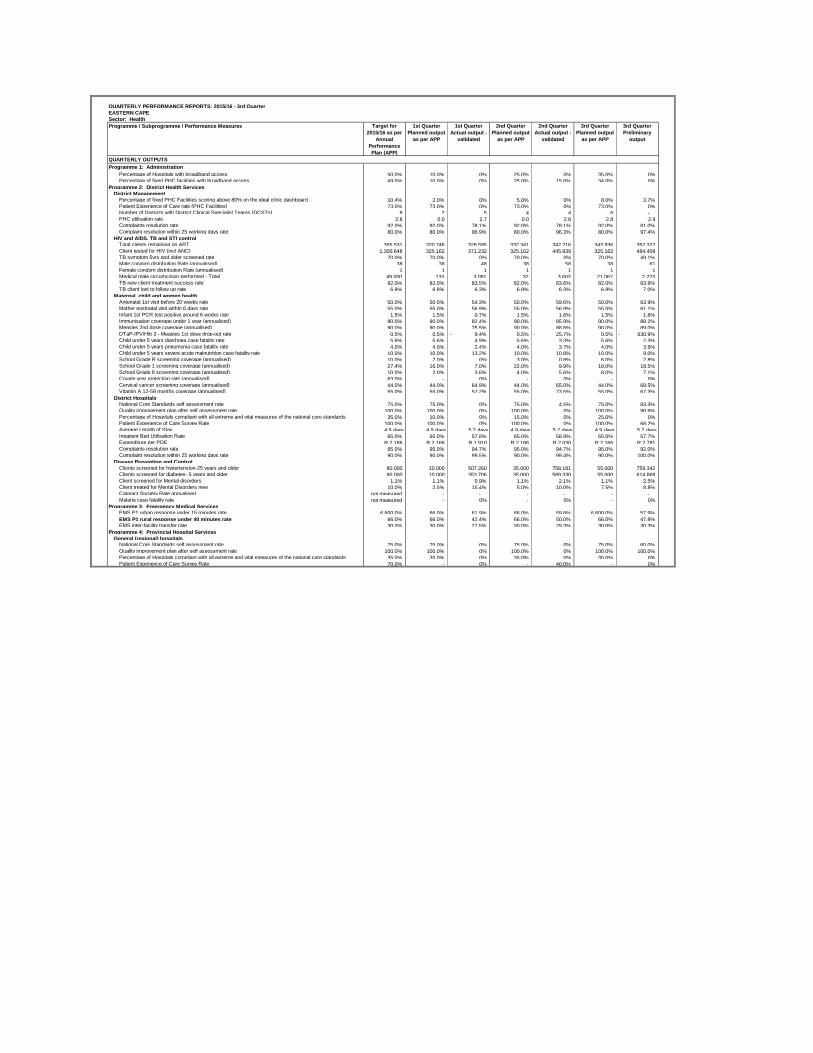
QUARTERLY PERFORMANCE REPORTS: 2015/16 - 3rd Quarter
EASTERN CAPE
Sector: Health
Programme / Subprogramme / Performance Measures Target for
2015/16 as per
Annual
Performance
Plan (APP)
1st Quarter
Planned output
as per APP
1st Quarter
Actual output -
validated
2nd Quarter
Planned output
as per APP
2nd Quarter
Actual output -
validated
3rd Quarter
Planned output
as per APP
3rd Quarter
Preliminary
output
QUARTERLY OUTPUTS
Average Length of Stay 4.6 days 4.6 days 5.5 days 4.6 days 5.7 days 4.6 days 5.4 days
Inpatient Bed Utilisation Rate 75.0% 75.0% 68.5% 75.0% 70.1% 75.0% 66.4% Expenditure per PDE R 2,181 R 2,181 R 1,320 R 2,181 R 1,556 R 2,181 R 2,247Complaints resolution rate 90.0% 90.0% 89.1% 90.0% 83.8% 90.0% 86.8% Complaint resolution within 25 working days rate 80.0% 80.0% 99.5% 80.0% 99.0% 80.0% 96.7%
Programme 5: Central Hospital Services 0% 0% 0% 0% 0% 0% 0%
Provincial Tertiary HospitalsNational Core Standards self assessment rate 100.0% 100.0% 0% 100.0% 50.0% 100.0% 50.0% Quality improvement plan after self assessment rate 100.0% 100.0% 0% 100.0% 100.0% 100.0% 100.0% Percentage of Hospitals compliant with all extreme and vital measures of the national core standards 100.0% 100.0% 0% 100.0% 0% 100.0% 100.0% Patient Experience of Care Survey Rate 80.0% 50.0% 0% 62.0% 50.0% 70.0% 50.0% Average Length of Stay 5.5 days 5.5 days 6.0 days 5.5 days 5.9 days 5.5 days 5.7 days Inpatient Bed Utilisation Rate 75.0% 75.0% 75.6% 75.0% 77.4% 75.0% 77.9% Expenditure per PDE R 2,019 R 2,019 R 3,377 R 2,019 R 2,607 R 2,019 R 4,379Complaints resolution rate 80.0% 80.0% 96.5% 80.0% 98.3% 80.0% 97.1% Complaint resolution within 25 working days rate 90.0% 90.0% 100.0% 90.0% 100.0% 90.0% 100.0%
Central Hospital ServicesNational Core Standards self assessment rate 100.0% 100.0% 0% 100.0% 0% 100.0% 0%Quality improvement plan after self assessment rate 100.0% 100.0% 0% 100.0% 0% 100.0% 0%Percentage of Hospitals compliant with all extreme and vital measures of the national core standards 100.0% 100.0% 0% 100.0% 0% 100.0% 0%Patient Experience of Care Survey Rate 80.0% 60.0% 0% 70.0% 0% 75.0% 0%Average Length of Stay 5.5 days 5.5 days 7.8 days 5.5 days 8.2 days 5.5 days 8.3 days Inpatient Bed Utilisation Rate 75.0% 75.0% 92.7% 75.0% 98.8% 75.0% 92.5% Expenditure per PDE R 2,019 R 2,019 R 4,402 R 2,019 R 4,119 R 2,019 R 6,327Complaints resolution rate 80.0% 80.0% 100.0% 80.0% 96.8% 80.0% 98.6% Complaint resolution within 25 working days rate 90.0% 90.0% 100.0% 90.0% 100.0% 90.0% 100.0%
1. Information submitted by: Dr T. Mbengashe Head of Department: Health Eastern Cape: Tel: (040) 608 1114 Ms N.T.M Mbina-Mthembu Director General: Office of the Premier Eastern Cape

QUARTERLY PERFORMANCE REPORTS: 2015/16 - 3rd Quarter
FREE STATE
Sector: Health
Programme / Subprogramme / Performance Measures Target for
2015/16 as per
Annual
Performance
Plan (APP)
1st Quarter
Planned output
as per APP
1st Quarter
Actual output -
validated
2nd Quarter
Planned output
as per APP
2nd Quarter
Actual output -
validated
3rd Quarter
Planned output
as per APP
3rd Quarter
Preliminary
output
QUARTERLY OUTPUTS
Programme 1: Administration
Percentage of Hospitals with broadband access 25.0% 0% 0% 0% 0% 0% 0%
Percentage of fixed PHC facilities with broadband access 75.0% 0% 0% 0% 0% 0% 0%
Programme 2: District Health Services
District Management
Percentage of fixed PHC Facilities scoring above 80% on the ideal clinic dashboard 10.0% 2.0% 8.2% 3.0% 1.0% 3.0% 4.0%
Patient Experience of Care rate (PHC Facilities) 85.0% 85.0% 0% 85.0% 0% 85.0% 30.9%
Number of Districts with District Clinical Specialist Teams (DCSTs) 5 5 5 - - - -
PHC utilisation rate 3.0 3.0 2.4 3.0 2.5 3.0 2.4
Complaints resolution rate 85.0% 85.0% 95.3% 85.0% 80.1% 85.0% 59.7%
Complaint resolution within 25 working days rate 85.0% 85.0% 88.4% 85.0% 97.7% 85.0% 97.6%
HIV and AIDS, TB and STI control
Total clients remaining on ART 191,180 172,632 174,191 178,814 184,340 184,996 182,536
Client tested for HIV (incl ANC) 606,343 151,585 138,183 151,585 180,862 151,588 185,343
TB symptom 5yrs and older screened rate 65.0% 65.0% 92.6% 65.0% 86.5% 65.0% 105.6%
Male condom distribution Rate (annualised) 46 46 33 46 69 46 59
Female condom distribution Rate (annualised) 1 1 1 1 2 1 2
Medical male circumcision performed - Total 74 496 11 640 10 384 34 920 11 243 6 984 6 659
TB new client treatment success rate 84.0% 84.0% 80.5% 84.0% 79.8% 84.0% 77.1%
TB client lost to follow up rate 4.5% 4.5% 5.3% 4.5% 5.4% 4.5% 5.4%
Maternal, child and women health
Antenatal 1st visit before 20 weeks rate 65.0% 65.0% 62.2% 65.0% 60.4% 65.0% 66.0%
Mother postnatal visit within 6 days rate 82.0% 82.0% 74.2% 82.0% 72.3% 82.0% 75.2%
Infant 1st PCR test positive around 6 weeks rate <2% <2% 1.4% <2% 1.3% <2% 1.8%
Immunisation coverage under 1 year (annualised) 95.0% 95.0% 84.2% 95.0% 83.7% 95.0% 85.2%
Measles 2nd dose coverage (annualised) 85.0% 85.0% 86.5% 85.0% 84.8% 85.0% 89.5%
DTaP-IPV/Hib 3 - Measles 1st dose drop-out rate <10% <10% 109.5% <10% 103.2% <10% 102.0%
Child under 5 years diarrhoea case fatality rate <3% <3% 3.3% <3% 1.8% <3% 2.7%
Child under 5 years pneumonia case fatality rate <3% <3% 1.5% <3% 2.3% <3% 1.7%
Child under 5 years severe acute malnutrition case fatality rate 11.4% 11.4% 10.3% 11.4% 10.1% 11.4% 4.1%
School Grade R screening coverage (annualised) 30.0% 30.0% 32.6% 30.0% 16.2% 30.0% 42.3%
School Grade 1 screening coverage (annualised) 40.0% 40.0% 35.4% 40.0% 25.1% 40.0% 46.7%
School Grade 8 screening coverage (annualised) 35.0% 35.0% 48.0% 35.0% 23.2% 35.0% 31.9%
Couple year protection rate (annualised) 55.0% 55.0% 44.9% 55.0% 68.5% 55.0% 61.2%
Cervical cancer screening coverage (annualised) 60.0% 60.0% 49.0% 60.0% 72.6% 60.0% 62.8%
Vitamin A 12-59 months coverage (annualised) 60.0% 60.0% 60.9% 60.0% 61.0% 60.0% 55.1%
District Hospitals
National Core Standards self assessment rate 50.0% 10.0% 12.5% 20.0% 16.7% 15.0% 4.2%
Quality improvement plan after self assessment rate 50.0% 10.0% 100.0% 20.0% 100.0% 15.0% 100.0%
Percentage of Hospitals compliant with all extreme and vital measures of the national core standards 50.0% 0% 0% 0% 0% 0% 0%
Patient Experience of Care Survey Rate 85.0% 85.0% 45.8% 85.0% 58.3% 85.0% 41.7%
Average Length of Stay 3.5 days 3.5 days 3.3 days 3.5 days 3.0 days 3.5 days 3.1 days
Inpatient Bed Utilisation Rate 70.0% 70.0% 60.1% 70.0% 56.4% 70.0% 57.6%
Expenditure per PDE R 2,000 R 2,000 R 2,038 R 2,000 R 2,464 R 2,000 R 2,307
Complaints resolution rate 85.0% 85.0% 86.0% 85.0% 85.6% 85.0% 62.0%
Complaint resolution within 25 working days rate 85.0% 85.0% 89.2% 85.0% 94.1% 85.0% 100.0%
Disease Prevention and Control
Clients screened for hypertension-25 years and older 630,673 157,688 121,428 157,688 184,125 157,688 235,442
Clients screened for diabetes- 5 years and older 630,673 157,688 74,105 157,688 120,780 157,688 142,505
Client screened for Mental disorders 20.0% 20.0% 4.3% 20.0% 9.2% 20.0% 13.1%
Client treated for Mental Disorders new 90.0% 90.0% 1.4% 90.0% 1.2% 90.0% 1.7%
Cataract Surgery Rate annualised 1,535.0 1,535.0 553.7 1,535.0 909.9 1,535.0 923.1
Malaria case fatality rate 0% 0% 0% 0% 0% 0% 0%
Programme 3: Emergency Medical Services
EMS P1 urban response under 15 minutes rate 50.0% 50.0% 30.5% 50.0% 29.7% 50.0% 25.6%
EMS P1 rural response under 40 minutes rate 68.0% 68.0% 67.0% 68.0% 67.3% 68.0% 73.3%
EMS inter-facility transfer rate 12.0% 12.0% 9.4% 12.0% 9.2% 12.0% 8.7%
Programme 4: Provincial Hospital Services
General (regional) hospitals
National Core Standards self assessment rate 100.0% 25.0% 50.0% 25.0% 25.0% 25.0% 0%
Quality improvement plan after self assessment rate 100.0% 25.0% 100.0% 25.0% 100.0% 25.0% 0%
Percentage of Hospitals compliant with all extreme and vital measures of the national core standards 50.0% 0% 0% 0% 0% 0% 0%
Patient Experience of Care Survey Rate 85.0% 85.0% 100.0% 85.0% 100.0% 85.0% 100.0%
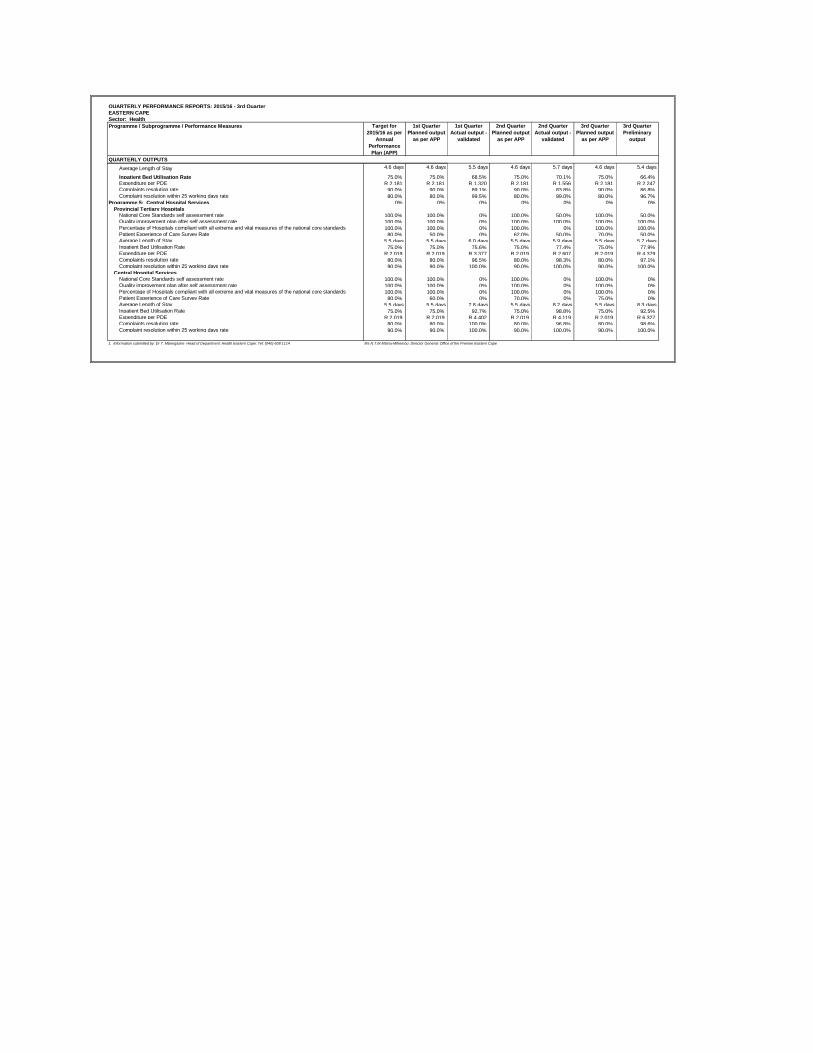
QUARTERLY PERFORMANCE REPORTS: 2015/16 - 3rd Quarter
FREE STATE
Sector: Health
Programme / Subprogramme / Performance Measures Target for
2015/16 as per
Annual
Performance
Plan (APP)
1st Quarter
Planned output
as per APP
1st Quarter
Actual output -
validated
2nd Quarter
Planned output
as per APP
2nd Quarter
Actual output -
validated
3rd Quarter
Planned output
as per APP
3rd Quarter
Preliminary
output
QUARTERLY OUTPUTS
Average Length of Stay 5.0 days 5.0 days 5.2 days 5.0 days 5.4 days 5.0 days 5.4 days
Inpatient Bed Utilisation Rate 75.0% 75.0% 65.2% 75.0% 66.6% 75.0% 69.9%
Expenditure per PDE R 2,480 R 2,480 R 2,340 R 2,480 R 2,560 R 2,480 R 2,368
Complaints resolution rate 85.0% 85.0% 82.3% 85.0% 69.7% 85.0% 94.6%
Complaint resolution within 25 working days rate 85.0% 85.0% 77.8% 85.0% 104.6% 85.0% 100.0%
Programme 5: Central Hospital Services 0% 0% 0% 0% 0% 0% 0%
Provincial Tertiary Hospitals - - -
National Core Standards self assessment rate 100.0% 0% 100.0% 0% 0% 100.0% 0%
Quality improvement plan after self assessment rate 100.0% 0% 100.0% 0% 0% 100.0% 0%
Percentage of Hospitals compliant with all extreme and vital measures of the national core standards 0% 0% 0% 0% 0% 0% 0%
Patient Experience of Care Survey Rate 85.0% 85.0% 100.0% 85.0% 100.0% 85.0% 100.0%
Average Length of Stay 8.5 days 8.5 days 6.7 days 8.5 days 6.3 days 8.5 days 6.2 days
Inpatient Bed Utilisation Rate 80.0% 80.0% 77.1% 80.0% 82.9% 80.0% 90.8%
Expenditure per PDE R 2,800 R 2,800 R 2,755 R 2,800 R 3,091 R 2,800 R 3,020
Complaints resolution rate 85.0% 85.0% 82.6% 85.0% 33.3% 85.0% 71.4%
Complaint resolution within 25 working days rate 85.0% 85.0% 42.1% 85.0% 100.0% 85.0% 100.0%
Central Hospital Services
National Core Standards self assessment rate 100.0% 0% 100.0% 0% 0% 100.0% 0%
Quality improvement plan after self assessment rate 100.0% 0% 100.0% 0% 0% 100.0% 0%
Percentage of Hospitals compliant with all extreme and vital measures of the national core standards 100.0% 0% 0% 0% 0% 0% 0%
Patient Experience of Care Survey Rate 85.0% 85.0% 100.0% 85.0% 0% 85.0% 100.0%
Average Length of Stay 7.5 days 7.5 days 7.3 days 7.5 days 6.7 days 7.5 days 7.8 days
Inpatient Bed Utilisation Rate 77.0% 77.0% 74.3% 77.0% 72.7% 77.0% 72.3%
Expenditure per PDE R 4,652 R 4,652 R 5,180 R 4,652 R 5,988 R 4,652 R 6,036
Complaints resolution rate 85.0% 85.0% 100.0% 85.0% 100.0% 85.0% 100.0%
Complaint resolution within 25 working days rate 85.0% 85.0% 95.3% 85.0% 97.9% 85.0% 100.0%
1. Information submitted by: Dr. D. Motau Head of Department: Health Free State: Tel: (051) 408 1107 Mr. K. Ralekontsane Director General: Office of the Premier Free State
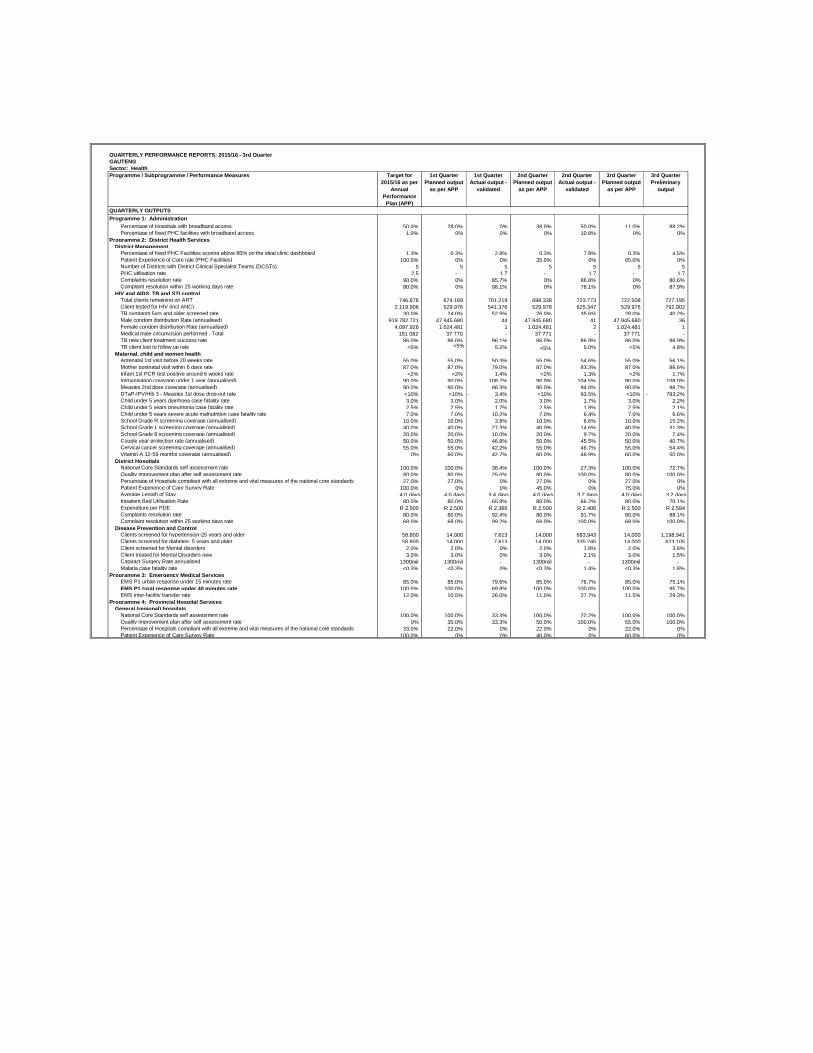
QUARTERLY PERFORMANCE REPORTS: 2015/16 - 3rd Quarter
GAUTENG
Sector: Health
Programme / Subprogramme / Performance Measures Target for
2015/16 as per
Annual
Performance
Plan (APP)
1st Quarter
Planned output
as per APP
1st Quarter
Actual output -
validated
2nd Quarter
Planned output
as per APP
2nd Quarter
Actual output -
validated
3rd Quarter
Planned output
as per APP
3rd Quarter
Preliminary
output
QUARTERLY OUTPUTS
Programme 1: Administration
Percentage of Hospitals with broadband access 50.0% 28.0% 0% 38.0% 50.0% 11.0% 88.2%
Percentage of fixed PHC facilities with broadband access 1.0% 0% 0% 0% 10.8% 0% 0%
Programme 2: District Health Services
District Management
Percentage of fixed PHC Facilities scoring above 80% on the ideal clinic dashboard 1.3% 0.3% 2.8% 0.3% 7.9% 0.3% 4.5%
Patient Experience of Care rate (PHC Facilities) 100.0% 0% 0% 35.0% 0% 65.0% 0%
Number of Districts with District Clinical Specialist Teams (DCSTs) 5 5 5 5 5 5 5
PHC utilisation rate 2.5 - 1.7 - 1.7 - 1.7
Complaints resolution rate 90.0% 0% 85.7% 0% 86.8% 0% 80.6%
Complaint resolution within 25 working days rate 80.0% 0% 98.1% 0% 78.1% 0% 87.9%
HIV and AIDS, TB and STI control
Total clients remaining on ART 746,678 674,169 701,219 698,338 723,773 722,508 727,195
Client tested for HIV (incl ANC) 2,119,906 529,976 541,376 529,978 625,347 529,976 792,902
TB symptom 5yrs and older screened rate 30.0% 24.0% 52.5% 26.0% 35.6% 28.0% 40.2%
Male condom distribution Rate (annualised) 919,782,721 47,945,680 44 47,945,680 41 47,945,680 36
Female condom distribution Rate (annualised) 4,097,926 1,024,481 1 1,024,481 2 1,024,481 1
Medical male circumcision performed - Total 151 082 37 770 - 37 771 - 37 771 -
TB new client treatment success rate 86.0% 86.0% 86.1% 86.0% 86.9% 86.0% 86.9%
TB client lost to follow up rate <5% <5% 5.2% <5% 5.0% <5% 4.8%
Maternal, child and women health
Antenatal 1st visit before 20 weeks rate 55.0% 55.0% 50.3% 55.0% 54.6% 55.0% 56.1%
Mother postnatal visit within 6 days rate 87.0% 87.0% 79.0% 87.0% 83.3% 87.0% 86.6%
Infant 1st PCR test positive around 6 weeks rate <2% <2% 1.4% <2% 1.3% <2% 1.7%
Immunisation coverage under 1 year (annualised) 90.0% 90.0% 108.7% 90.0% 104.5% 90.0% 108.0%
Measles 2nd dose coverage (annualised) 90.0% 90.0% 86.3% 90.0% 94.0% 90.0% 98.7%
DTaP-IPV/Hib 3 - Measles 1st dose drop-out rate <10% <10% 3.4%- <10% 93.5% <10% 783.2%-
Child under 5 years diarrhoea case fatality rate 3.0% 3.0% 2.0% 3.0% 1.7% 3.0% 2.2%
Child under 5 years pneumonia case fatality rate 2.5% 2.5% 1.7% 2.5% 1.8% 2.5% 2.1%
Child under 5 years severe acute malnutrition case fatality rate 7.0% 7.0% 10.2% 7.0% 6.4% 7.0% 6.6%
School Grade R screening coverage (annualised) 10.0% 10.0% 3.8% 10.0% 6.6% 10.0% 15.2%
School Grade 1 screening coverage (annualised) 40.0% 40.0% 27.3% 40.0% 14.6% 40.0% 31.3%
School Grade 8 screening coverage (annualised) 20.0% 20.0% 10.0% 20.0% 9.7% 20.0% 7.4%
Couple year protection rate (annualised) 50.0% 50.0% 46.8% 50.0% 45.5% 50.0% 40.7%
Cervical cancer screening coverage (annualised) 55.0% 55.0% 42.2% 55.0% 46.7% 55.0% 54.4%
Vitamin A 12-59 months coverage (annualised) 0% 60.0% 42.7% 60.0% 46.9% 60.0% 50.0%
District Hospitals
National Core Standards self assessment rate 100.0% 100.0% 36.4% 100.0% 27.3% 100.0% 72.7%
Quality improvement plan after self assessment rate 80.0% 80.0% 25.0% 80.0% 100.0% 80.0% 100.0%
Percentage of Hospitals compliant with all extreme and vital measures of the national core standards 27.0% 27.0% 0% 27.0% 0% 27.0% 0%
Patient Experience of Care Survey Rate 100.0% 0% 0% 45.0% 0% 75.0% 0%
Average Length of Stay 4.0 days 4.0 days 3.4 days 4.0 days 3.2 days 4.0 days 3.2 days
Inpatient Bed Utilisation Rate 80.0% 80.0% 65.8% 80.0% 66.2% 80.0% 70.1%
Expenditure per PDE R 2,500 R 2,500 R 2,366 R 2,500 R 2,406 R 2,500 R 2,594
Complaints resolution rate 80.0% 80.0% 92.4% 80.0% 91.7% 80.0% 88.1%
Complaint resolution within 25 working days rate 68.0% 68.0% 99.2% 68.0% 100.0% 68.0% 100.0%
Disease Prevention and Control
Clients screened for hypertension-25 years and older 58,800 14,000 7,613 14,000 683,943 14,000 1,198,941
Clients screened for diabetes- 5 years and older 58,800 14,000 7,613 14,000 335,245 14,000 623,105
Client screened for Mental disorders 2.0% 2.0% 0% 2.0% 1.8% 2.0% 3.6%
Client treated for Mental Disorders new 3.0% 3.0% 0% 3.0% 2.1% 3.0% 1.5%
Cataract Surgery Rate annualised 1300mil 1300mil - 1300mil - 1300mil -
Malaria case fatality rate <0.3% <0.3% 0% <0.3% 1.4% <0.3% 1.8%
Programme 3: Emergency Medical Services
EMS P1 urban response under 15 minutes rate 85.0% 85.0% 79.6% 85.0% 76.7% 85.0% 75.1%
EMS P1 rural response under 40 minutes rate 100.0% 100.0% 69.8% 100.0% 100.0% 100.0% 95.7%
EMS inter-facility transfer rate 12.0% 10.5% 26.0% 11.0% 27.7% 11.5% 29.3%
Programme 4: Provincial Hospital Services
General (regional) hospitals
National Core Standards self assessment rate 100.0% 100.0% 33.3% 100.0% 22.2% 100.0% 100.0%
Quality improvement plan after self assessment rate 0% 35.0% 33.3% 50.0% 100.0% 55.0% 100.0%
Percentage of Hospitals compliant with all extreme and vital measures of the national core standards 33.0% 22.0% 0% 22.0% 0% 22.0% 0%
Patient Experience of Care Survey Rate 100.0% 0% 0% 40.0% 0% 60.0% 0%
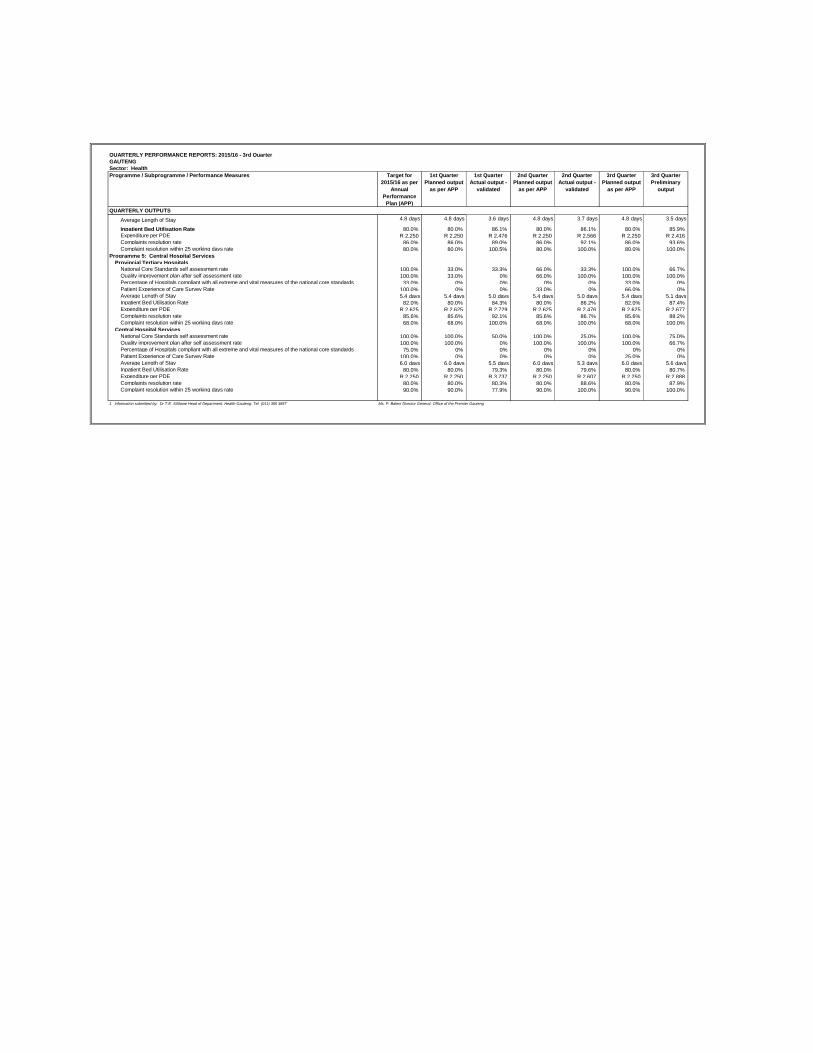
QUARTERLY PERFORMANCE REPORTS: 2015/16 - 3rd Quarter
GAUTENG
Sector: Health
Programme / Subprogramme / Performance Measures Target for
2015/16 as per
Annual
Performance
Plan (APP)
1st Quarter
Planned output
as per APP
1st Quarter
Actual output -
validated
2nd Quarter
Planned output
as per APP
2nd Quarter
Actual output -
validated
3rd Quarter
Planned output
as per APP
3rd Quarter
Preliminary
output
QUARTERLY OUTPUTS
Average Length of Stay 4.8 days 4.8 days 3.6 days 4.8 days 3.7 days 4.8 days 3.5 days
Inpatient Bed Utilisation Rate 80.0% 80.0% 86.1% 80.0% 86.1% 80.0% 85.9%
Expenditure per PDE R 2,250 R 2,250 R 2,476 R 2,250 R 2,566 R 2,250 R 2,416
Complaints resolution rate 86.0% 86.0% 89.0% 86.0% 92.1% 86.0% 93.6%
Complaint resolution within 25 working days rate 80.0% 80.0% 100.5% 80.0% 100.0% 80.0% 100.0%
Programme 5: Central Hospital Services
Provincial Tertiary Hospitals
National Core Standards self assessment rate 100.0% 33.0% 33.3% 66.0% 33.3% 100.0% 66.7%
Quality improvement plan after self assessment rate 100.0% 33.0% 0% 66.0% 100.0% 100.0% 100.0%
Percentage of Hospitals compliant with all extreme and vital measures of the national core standards 33.0% 0% 0% 0% 0% 33.0% 0%
Patient Experience of Care Survey Rate 100.0% 0% 0% 33.0% 0% 66.0% 0%
Average Length of Stay 5.4 days 5.4 days 5.0 days 5.4 days 5.0 days 5.4 days 5.1 days
Inpatient Bed Utilisation Rate 82.0% 80.0% 84.3% 80.0% 86.2% 82.0% 87.4%
Expenditure per PDE R 2,625 R 2,625 R 2,729 R 2,625 R 2,476 R 2,625 R 2,677
Complaints resolution rate 85.6% 85.6% 92.1% 85.6% 86.7% 85.6% 88.2%
Complaint resolution within 25 working days rate 68.0% 68.0% 100.0% 68.0% 100.0% 68.0% 100.0%
Central Hospital Services
National Core Standards self assessment rate 100.0% 100.0% 50.0% 100.0% 25.0% 100.0% 75.0%
Quality improvement plan after self assessment rate 100.0% 100.0% 0% 100.0% 100.0% 100.0% 66.7%
Percentage of Hospitals compliant with all extreme and vital measures of the national core standards 75.0% 0% 0% 0% 0% 0% 0%
Patient Experience of Care Survey Rate 100.0% 0% 0% 0% 0% 25.0% 0%
Average Length of Stay 6.0 days 6.0 days 5.5 days 6.0 days 5.3 days 6.0 days 5.6 days
Inpatient Bed Utilisation Rate 80.0% 80.0% 79.3% 80.0% 79.6% 80.0% 80.7%
Expenditure per PDE R 2,250 R 2,250 R 3,737 R 2,250 R 2,607 R 2,250 R 2,888
Complaints resolution rate 80.0% 80.0% 80.3% 80.0% 88.6% 80.0% 87.9%
Complaint resolution within 25 working days rate 90.0% 90.0% 77.9% 90.0% 100.0% 90.0% 100.0%
1. Information submitted by: Dr T.E. Silibane Head of Department: Health Gauteng: Tel (011) 355 3857 Ms. P. Baleni Director General: Office of the Premier Gauteng
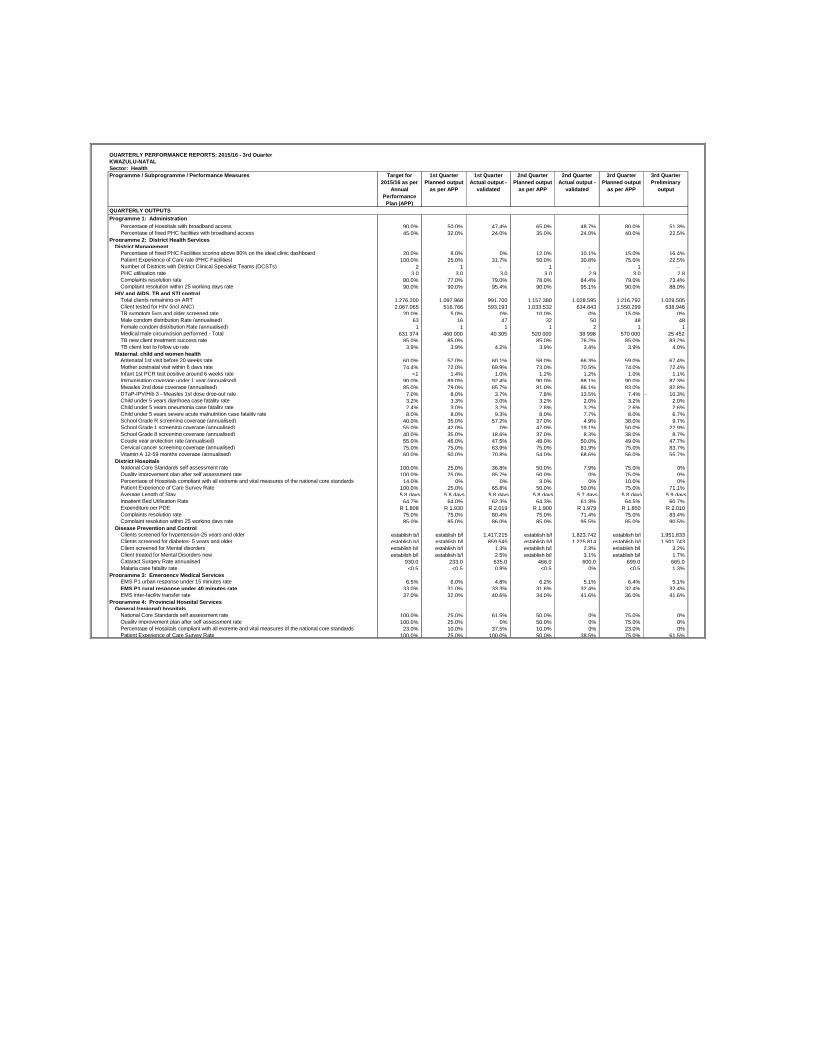
QUARTERLY PERFORMANCE REPORTS: 2015/16 - 3rd Quarter
KWAZULU-NATAL
Sector: Health
Programme / Subprogramme / Performance Measures Target for
2015/16 as per
Annual
Performance
Plan (APP)
1st Quarter
Planned output
as per APP
1st Quarter
Actual output -
validated
2nd Quarter
Planned output
as per APP
2nd Quarter
Actual output -
validated
3rd Quarter
Planned output
as per APP
3rd Quarter
Preliminary
output
QUARTERLY OUTPUTS
Programme 1: Administration
Percentage of Hospitals with broadband access 90.0% 50.0% 47.4% 65.0% 48.7% 80.0% 51.3%
Percentage of fixed PHC facilities with broadband access 45.0% 32.0% 24.0% 35.0% 24.0% 40.0% 22.5%
Programme 2: District Health Services
District Management
Percentage of fixed PHC Facilities scoring above 80% on the ideal clinic dashboard 20.0% 8.0% 0% 12.0% 10.1% 15.0% 16.4%
Patient Experience of Care rate (PHC Facilities) 100.0% 25.0% 31.7% 50.0% 30.8% 75.0% 22.5%
Number of Districts with District Clinical Specialist Teams (DCSTs) 2 1 - 1 - 1 -
PHC utilisation rate 3.0 3.0 3.0 3.0 2.9 3.0 2.8
Complaints resolution rate 80.0% 77.0% 79.0% 78.0% 84.4% 79.0% 73.4%
Complaint resolution within 25 working days rate 90.0% 90.0% 95.4% 90.0% 95.1% 90.0% 88.0%
HIV and AIDS, TB and STI control
Total clients remaining on ART 1,276,200 1,097,968 991,700 1,157,380 1,028,595 1,216,792 1,029,505
Client tested for HIV (incl ANC) 2,067,065 516,766 593,193 1,033,532 634,843 1,550,299 638,946
TB symptom 5yrs and older screened rate 20.0% 5.0% 0% 10.0% 0% 15.0% 0%
Male condom distribution Rate (annualised) 63 16 47 32 50 48 48
Female condom distribution Rate (annualised) 1 1 1 1 2 1 1
Medical male circumcision performed - Total 631 374 460 000 40 305 520 000 38 998 570 000 25 452
TB new client treatment success rate 85.0% 85.0% 85.0% 76.2% 85.0% 83.2%
TB client lost to follow up rate 3.9% 3.9% 4.2% 3.9% 3.4% 3.9% 4.0%
Maternal, child and women health
Antenatal 1st visit before 20 weeks rate 60.0% 57.0% 60.1% 58.0% 66.3% 59.0% 67.4%
Mother postnatal visit within 6 days rate 74.4% 72.0% 69.9% 73.0% 70.5% 74.0% 72.4%
Infant 1st PCR test positive around 6 weeks rate <1 1.4% 1.0% 1.2% 1.2% 1.0% 1.1%
Immunisation coverage under 1 year (annualised) 90.0% 89.0% 92.4% 90.0% 88.1% 90.0% 87.3%
Measles 2nd dose coverage (annualised) 85.0% 79.0% 85.7% 81.0% 86.1% 83.0% 82.8%
DTaP-IPV/Hib 3 - Measles 1st dose drop-out rate 7.0% 8.0% 3.7% 7.8% 13.5% 7.4% 10.3%-
Child under 5 years diarrhoea case fatality rate 3.2% 3.3% 3.0% 3.2% 2.0% 3.2% 2.0%
Child under 5 years pneumonia case fatality rate 2.4% 3.0% 3.2% 2.8% 3.2% 2.6% 2.6%
Child under 5 years severe acute malnutrition case fatality rate 8.0% 8.0% 9.3% 8.0% 7.7% 8.0% 6.7%
School Grade R screening coverage (annualised) 40.0% 35.0% 57.2% 37.0% 4.9% 38.0% 9.7%
School Grade 1 screening coverage (annualised) 55.0% 42.0% 0% 47.0% 19.1% 50.0% 22.9%
School Grade 8 screening coverage (annualised) 40.0% 35.0% 18.6% 37.0% 8.3% 38.0% 8.7%
Couple year protection rate (annualised) 55.0% 46.0% 47.5% 48.0% 50.0% 49.0% 47.7%
Cervical cancer screening coverage (annualised) 75.0% 75.0% 63.9% 75.0% 81.9% 75.0% 83.7%
Vitamin A 12-59 months coverage (annualised) 60.0% 50.0% 70.8% 54.0% 68.6% 56.0% 55.7%
District Hospitals
National Core Standards self assessment rate 100.0% 25.0% 36.8% 50.0% 7.9% 75.0% 0%
Quality improvement plan after self assessment rate 100.0% 25.0% 85.7% 50.0% 0% 75.0% 0%
Percentage of Hospitals compliant with all extreme and vital measures of the national core standards 14.0% 0% 0% 3.0% 0% 10.0% 0%
Patient Experience of Care Survey Rate 100.0% 25.0% 65.8% 50.0% 50.0% 75.0% 71.1%
Average Length of Stay 5.8 days 5.8 days 5.8 days 5.8 days 5.7 days 5.8 days 5.9 days
Inpatient Bed Utilisation Rate 64.7% 64.0% 62.3% 64.3% 61.3% 64.5% 60.7%
Expenditure per PDE R 1,808 R 1,930 R 2,019 R 1,900 R 1,979 R 1,850 R 2,010
Complaints resolution rate 75.0% 75.0% 80.4% 75.0% 71.4% 75.0% 83.4%
Complaint resolution within 25 working days rate 85.0% 85.0% 86.0% 85.0% 95.5% 85.0% 90.5%
Disease Prevention and Control
Clients screened for hypertension-25 years and older establish b/l establish b/l 1,417,215 establish b/l 1,823,742 establish b/l 1,951,833
Clients screened for diabetes- 5 years and older establish b/l establish b/l 859,545 establish b/l 1,225,814 establish b/l 1,501,743
Client screened for Mental disorders establish b/l establish b/l 1.3% establish b/l 2.3% establish b/l 3.2%
Client treated for Mental Disorders new establish b/l establish b/l 2.5% establish b/l 3.1% establish b/l 1.7%
Cataract Surgery Rate annualised 930.0 233.0 635.0 466.0 600.0 699.0 665.0
Malaria case fatality rate <0.5 <0.5 0.8% <0.5 0% <0.5 1.3%
Programme 3: Emergency Medical Services
EMS P1 urban response under 15 minutes rate 6.5% 6.0% 4.8% 6.2% 5.1% 6.4% 5.1%
EMS P1 rural response under 40 minutes rate 33.0% 31.0% 33.3% 31.6% 32.4% 32.4% 32.4%
EMS inter-facility transfer rate 37.0% 32.0% 40.6% 34.0% 41.6% 36.0% 41.6%
Programme 4: Provincial Hospital Services
General (regional) hospitals
National Core Standards self assessment rate 100.0% 25.0% 61.5% 50.0% 0% 75.0% 0%
Quality improvement plan after self assessment rate 100.0% 25.0% 0% 50.0% 0% 75.0% 0%
Percentage of Hospitals compliant with all extreme and vital measures of the national core standards 23.0% 10.0% 37.5% 10.0% 0% 23.0% 0%
Patient Experience of Care Survey Rate 100.0% 25.0% 100.0% 50.0% 38.5% 75.0% 61.5%

QUARTERLY PERFORMANCE REPORTS: 2015/16 - 3rd Quarter
KWAZULU-NATAL
Sector: Health
Programme / Subprogramme / Performance Measures Target for
2015/16 as per
Annual
Performance
Plan (APP)
1st Quarter
Planned output
as per APP
1st Quarter
Actual output -
validated
2nd Quarter
Planned output
as per APP
2nd Quarter
Actual output -
validated
3rd Quarter
Planned output
as per APP
3rd Quarter
Preliminary
output
QUARTERLY OUTPUTS
Average Length of Stay 6.1 days 6.1 days 6.4 days 6.1 days 6.4 days 6.1 days 6.4 days
Inpatient Bed Utilisation Rate 76.1% 76.7% 78.0% 76.5% 76.1% 76.3% 74.4%
Expenditure per PDE R 2,225 R 2,300 R 2,733 R 2,280 R 2,623 R 2,260 R 3,067
Complaints resolution rate 80.0% 80.0% 78.1% 80.0% 86.3% 80.0% 86.6%
Complaint resolution within 25 working days rate 95.0% 94.0% 98.0% 94.0% 96.0% 94.5% 100.0%
Programme 5: Central Hospital Services 0% 0% 0% 0% 0% 0% 0%
Provincial Tertiary Hospitals
National Core Standards self assessment rate 100.0% 50.0% 33.3% 50.0% 0% 50.0% 0%
Quality improvement plan after self assessment rate 100.0% 50.0% 0% 50.0% 0% 50.0% 0%
Percentage of Hospitals compliant with all extreme and vital measures of the national core standards 50.0% 0% 100.0% 0% 0% 0% 0%
Patient Experience of Care Survey Rate 100.0% 50.0% 66.7% 50.0% 66.7% 50.0% 66.7%
Average Length of Stay 9.6 days 9.9 days 7.7 days 9.8 days 7.8 days 9.7 days 7.4 days
Inpatient Bed Utilisation Rate 84.0% 84.0% 76.4% 84.0% 73.0% 84.0% 63.4%
Expenditure per PDE R 4,377 R 5,000 R 2,685 R 4,800 R 2,876 R 4,500 R 4,691
Complaints resolution rate 78.0% 74.5% 81.1% 75.0% 84.8% 75.0% 78.0%
Complaint resolution within 25 working days rate 100.0% 100.0% 100.0% 100.0% 98.1% 100.0% 90.6%
Central Hospital Services
National Core Standards self assessment rate 100.0% 0% 0% 0% 0% 0% 0%
Quality improvement plan after self assessment rate 100.0% 100.0% 0% 100.0% 0% 100.0% 0%
Percentage of Hospitals compliant with all extreme and vital measures of the national core standards 100.0% 0% 0% 0% 0% 0% 0%
Patient Experience of Care Survey Rate 100.0% 0% 0% 0% 0% 0% 100.0%
Average Length of Stay 8.5 days 8.5 days 8.7 days 8.5 days 8.5 days 8.5 days 8.4 days
Inpatient Bed Utilisation Rate 70.0% 69.0% 66.8% 69.3% 67.1% 69.7% 68.7%
Expenditure per PDE R 7,651 R 7,651 R 8,791 R 7,651 R 8,033 R 7,651 R 7,576
Complaints resolution rate 80.0% 75.0% 25.0% 76.0% 96.2% 78.0% 77.8%
Complaint resolution within 25 working days rate 100.0% 100.0% 100.0% 100.0% 96.0% 100.0% 100.0%
1. Information submitted by: Dr S.T. Mtshali Head of Department: Health Kwazulu Natal Tel: (033) 395 2799 Mr. F. Brooks Acting Director General: Office of the Premier Kwazulu Natal
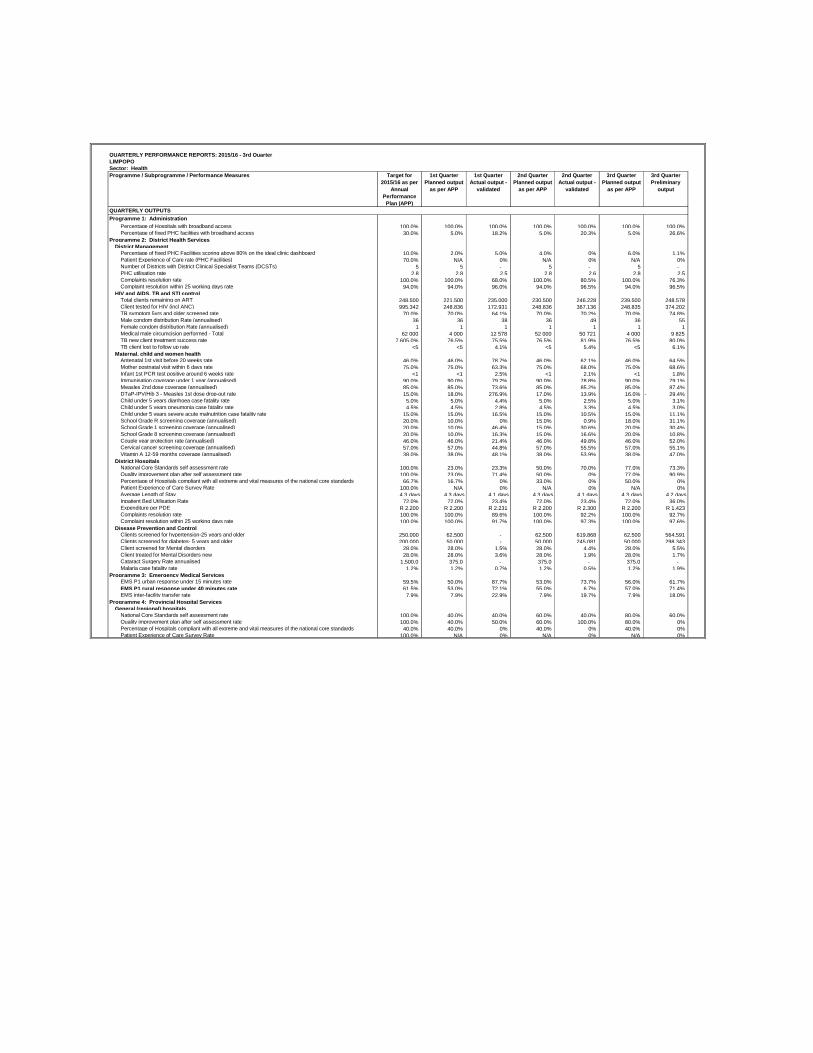
QUARTERLY PERFORMANCE REPORTS: 2015/16 - 3rd Quarter
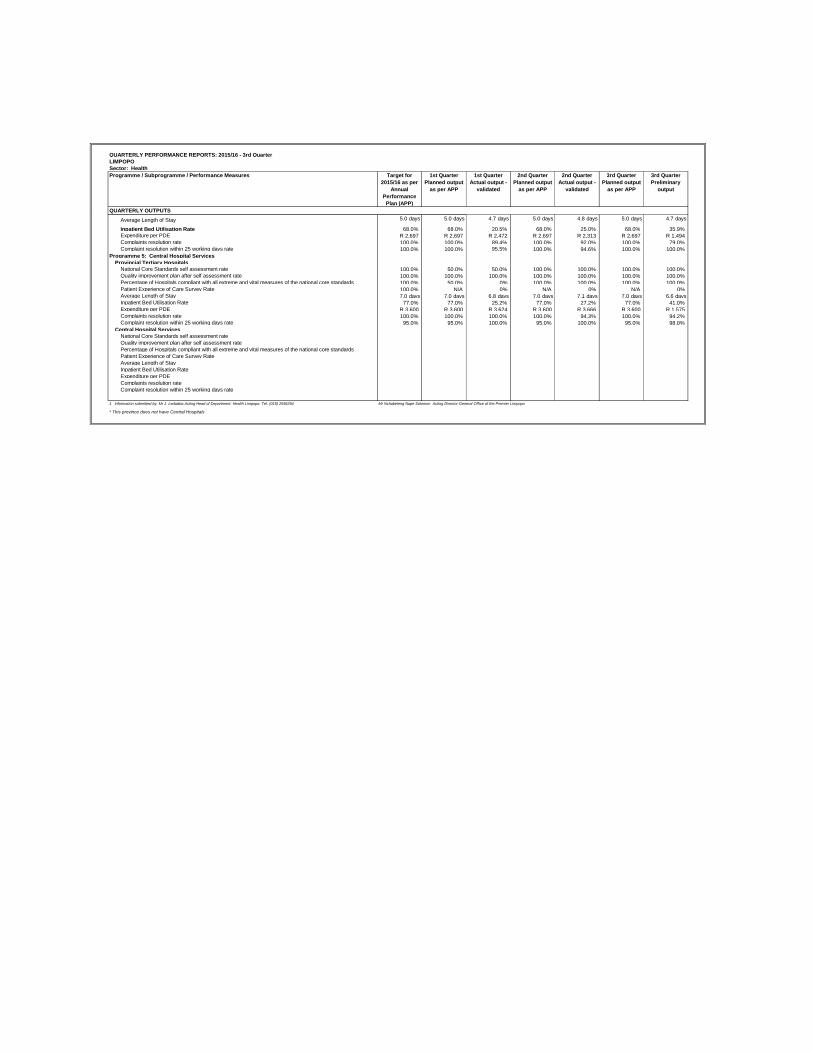
LIMPOPO
Sector: Health
Programme / Subprogramme / Performance Measures Target for
2015/16 as per
Annual
Performance
Plan (APP)
1st Quarter
Planned output
as per APP
1st Quarter
Actual output -
validated
2nd Quarter
Planned output
as per APP
2nd Quarter
Actual output -
validated
3rd Quarter
Planned output
as per APP
3rd Quarter
Preliminary
output
QUARTERLY OUTPUTS
Programme 1: Administration
Percentage of Hospitals with broadband access 100.0% 100.0% 100.0% 100.0% 100.0% 100.0% 100.0%
Percentage of fixed PHC facilities with broadband access 30.0% 5.0% 18.2% 5.0% 20.3% 5.0% 26.6%
Programme 2: District Health Services
District Management
Percentage of fixed PHC Facilities scoring above 80% on the ideal clinic dashboard 10.0% 2.0% 5.0% 4.0% 0% 6.0% 1.1%
Patient Experience of Care rate (PHC Facilities) 70.0% N/A 0% N/A 0% N/A 0%
Number of Districts with District Clinical Specialist Teams (DCSTs) 5 5 - 5 - 5 -
PHC utilisation rate 2.8 2.8 2.5 2.8 2.6 2.8 2.5
Complaints resolution rate 100.0% 100.0% 68.0% 100.0% 80.5% 100.0% 76.3%
Complaint resolution within 25 working days rate 94.0% 94.0% 96.0% 94.0% 96.5% 94.0% 96.5%
HIV and AIDS, TB and STI control
Total clients remaining on ART 248,500 221,500 235,000 230,500 246,228 239,500 248,578
Client tested for HIV (incl ANC) 995,342 248,836 172,931 248,836 367,136 248,835 374,202
TB symptom 5yrs and older screened rate 70.0% 70.0% 64.1% 70.0% 70.2% 70.0% 74.8%
Male condom distribution Rate (annualised) 36 36 38 36 49 36 55
Female condom distribution Rate (annualised) 1 1 1 1 1 1 1
Medical male circumcision performed - Total 62 000 4 000 12 578 52 000 50 721 4 000 9 825
TB new client treatment success rate 7,605.0% 76.5% 75.5% 76.5% 81.9% 76.5% 80.0%
TB client lost to follow up rate <5 <5 4.1% <5 5.4% <5 6.1%
Maternal, child and women health
Antenatal 1st visit before 20 weeks rate 46.0% 46.0% 78.7% 46.0% 62.1% 46.0% 64.5%
Mother postnatal visit within 6 days rate 75.0% 75.0% 63.3% 75.0% 68.0% 75.0% 68.6%
Infant 1st PCR test positive around 6 weeks rate <1 <1 2.5% <1 2.1% <1 1.8%
Immunisation coverage under 1 year (annualised) 90.0% 90.0% 79.2% 90.0% 78.8% 90.0% 79.1%
Measles 2nd dose coverage (annualised) 85.0% 85.0% 73.6% 85.0% 85.2% 85.0% 87.4%
DTaP-IPV/Hib 3 - Measles 1st dose drop-out rate 15.0% 18.0% 276.9% 17.0% 13.9% 16.0% 29.4%-
Child under 5 years diarrhoea case fatality rate 5.0% 5.0% 4.4% 5.0% 2.5% 5.0% 3.1%
Child under 5 years pneumonia case fatality rate 4.5% 4.5% 2.8% 4.5% 3.3% 4.5% 3.0%
Child under 5 years severe acute malnutrition case fatality rate 15.0% 15.0% 16.5% 15.0% 10.5% 15.0% 11.1%
School Grade R screening coverage (annualised) 20.0% 10.0% 0% 15.0% 0.9% 18.0% 31.1%
School Grade 1 screening coverage (annualised) 20.0% 10.0% 46.4% 15.0% 30.6% 20.0% 30.4%
School Grade 8 screening coverage (annualised) 20.0% 10.0% 16.3% 15.0% 16.6% 20.0% 10.8%
Couple year protection rate (annualised) 46.0% 46.0% 21.4% 46.0% 49.8% 46.0% 52.0%
Cervical cancer screening coverage (annualised) 57.0% 57.0% 44.8% 57.0% 55.5% 57.0% 55.1%
Vitamin A 12-59 months coverage (annualised) 38.0% 38.0% 48.1% 38.0% 53.9% 38.0% 47.0%
District Hospitals
National Core Standards self assessment rate 100.0% 23.0% 23.3% 50.0% 70.0% 77.0% 73.3%
Quality improvement plan after self assessment rate 100.0% 23.0% 71.4% 50.0% 0% 77.0% 90.9%
Percentage of Hospitals compliant with all extreme and vital measures of the national core standards 66.7% 16.7% 0% 33.0% 0% 50.0% 0%
Patient Experience of Care Survey Rate 100.0% N/A 0% N/A 0% N/A 0%
Average Length of Stay 4.3 days 4.3 days 4.1 days 4.3 days 4.1 days 4.3 days 4.2 days
Inpatient Bed Utilisation Rate 72.0% 72.0% 23.4% 72.0% 23.4% 72.0% 36.0%
Expenditure per PDE R 2,200 R 2,200 R 2,231 R 2,200 R 2,300 R 2,200 R 1,423
Complaints resolution rate 100.0% 100.0% 89.6% 100.0% 92.2% 100.0% 92.7%
Complaint resolution within 25 working days rate 100.0% 100.0% 91.7% 100.0% 97.3% 100.0% 97.6%
Disease Prevention and Control
Clients screened for hypertension-25 years and older 250,000 62,500 - 62,500 619,868 62,500 564,591
Clients screened for diabetes- 5 years and older 200,000 50,000 - 50,000 245,081 50,000 298,343
Client screened for Mental disorders 28.0% 28.0% 1.5% 28.0% 4.4% 28.0% 5.5%
Client treated for Mental Disorders new 28.0% 28.0% 3.6% 28.0% 1.9% 28.0% 1.7%
Cataract Surgery Rate annualised 1,500.0 375.0 - 375.0 - 375.0 -
Malaria case fatality rate 1.2% 1.2% 0.7% 1.2% 0.5% 1.2% 1.9%
Programme 3: Emergency Medical Services
EMS P1 urban response under 15 minutes rate 59.5% 50.0% 87.7% 53.0% 73.7% 56.0% 61.7%
EMS P1 rural response under 40 minutes rate 61.5% 53.0% 72.1% 55.0% 6.7% 57.0% 71.4%
EMS inter-facility transfer rate 7.9% 7.9% 22.9% 7.9% 19.7% 7.9% 18.0%
Programme 4: Provincial Hospital Services
General (regional) hospitals
National Core Standards self assessment rate 100.0% 40.0% 40.0% 60.0% 40.0% 80.0% 60.0%
Quality improvement plan after self assessment rate 100.0% 40.0% 50.0% 60.0% 100.0% 80.0% 0%
Percentage of Hospitals compliant with all extreme and vital measures of the national core standards 40.0% 40.0% 0% 40.0% 0% 40.0% 0%
Patient Experience of Care Survey Rate 100.0% N/A 0% N/A 0% N/A 0%
QUARTERLY PERFORMANCE REPORTS: 2015/16 - 3rd Quarter
LIMPOPO
Sector: Health
Programme / Subprogramme / Performance Measures Target for
2015/16 as per
Annual
Performance
Plan (APP)
1st Quarter
Planned output
as per APP
1st Quarter
Actual output -
validated
2nd Quarter
Planned output
as per APP
2nd Quarter
Actual output -
validated
3rd Quarter
Planned output
as per APP
3rd Quarter
Preliminary
output
QUARTERLY OUTPUTS
Average Length of Stay 5.0 days 5.0 days 4.7 days 5.0 days 4.8 days 5.0 days 4.7 days
Inpatient Bed Utilisation Rate 68.0% 68.0% 20.5% 68.0% 25.0% 68.0% 35.9%
Expenditure per PDE R 2,697 R 2,697 R 2,472 R 2,697 R 2,313 R 2,697 R 1,494
Complaints resolution rate 100.0% 100.0% 89.4% 100.0% 92.0% 100.0% 79.0%
Complaint resolution within 25 working days rate 100.0% 100.0% 95.5% 100.0% 94.6% 100.0% 100.0%
Programme 5: Central Hospital Services
Provincial Tertiary Hospitals
National Core Standards self assessment rate 100.0% 50.0% 50.0% 100.0% 100.0% 100.0% 100.0%
Quality improvement plan after self assessment rate 100.0% 100.0% 100.0% 100.0% 100.0% 100.0% 100.0%
Percentage of Hospitals compliant with all extreme and vital measures of the national core standards 100.0% 50.0% 0% 100.0% 100.0% 100.0% 100.0%
Patient Experience of Care Survey Rate 100.0% N/A 0% N/A 0% N/A 0%
Average Length of Stay 7.0 days 7.0 days 6.8 days 7.0 days 7.1 days 7.0 days 6.6 days
Inpatient Bed Utilisation Rate 77.0% 77.0% 25.2% 77.0% 27.2% 77.0% 41.0%
Expenditure per PDE R 3,600 R 3,600 R 3,624 R 3,600 R 3,666 R 3,600 R 1,575
Complaints resolution rate 100.0% 100.0% 100.0% 100.0% 94.3% 100.0% 94.2%
Complaint resolution within 25 working days rate 95.0% 95.0% 100.0% 95.0% 100.0% 95.0% 98.0%
Central Hospital Services
National Core Standards self assessment rate
Quality improvement plan after self assessment rate
Percentage of Hospitals compliant with all extreme and vital measures of the national core standards
Patient Experience of Care Survey Rate
Average Length of Stay
Inpatient Bed Utilisation Rate
Expenditure per PDE
Complaints resolution rate
Complaint resolution within 25 working days rate
1. Information submitted by: Mr J. Ledwaba Acting Head of Department: Health Limpopo: Tel: (015) 2936294 Mr Nchabeleng Nape Solomon Acting Director General Office of the Premier Limpopo
* This province does not have Central Hospitals
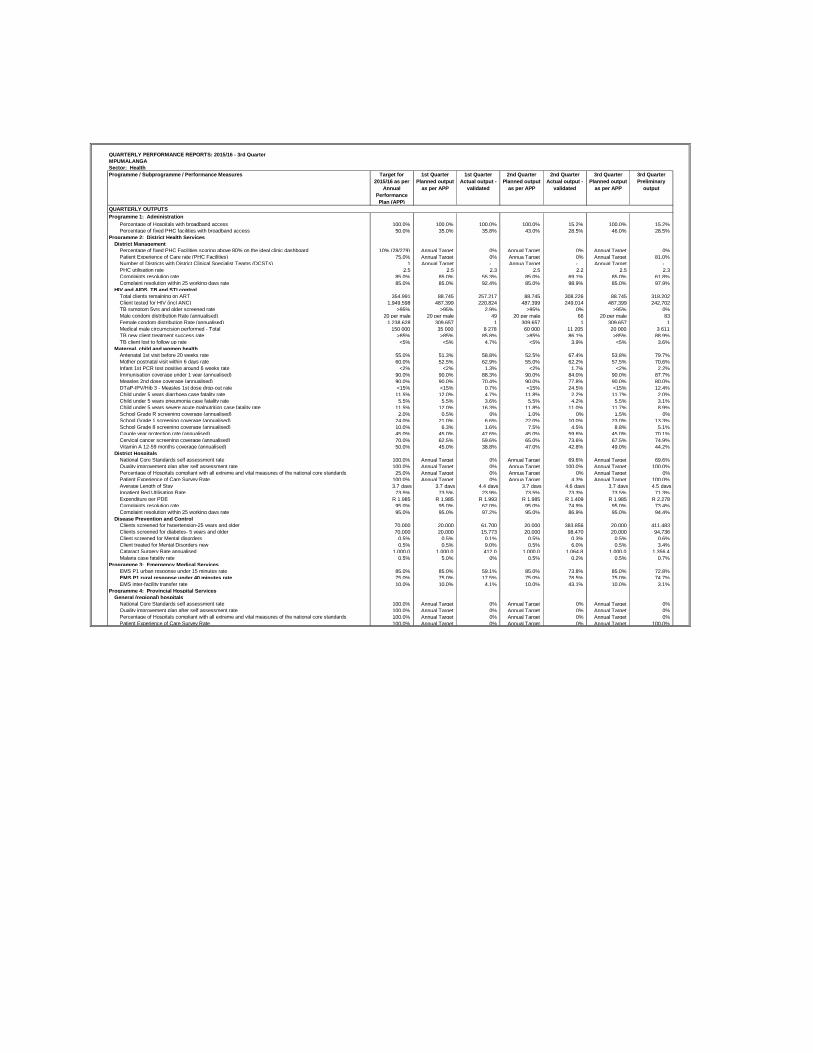
QUARTERLY PERFORMANCE REPORTS: 2015/16 - 3rd Quarter
MPUMALANGA
Sector: Health
Programme / Subprogramme / Performance Measures Target for
2015/16 as per
Annual
Performance
Plan (APP)
1st Quarter
Planned output
as per APP
1st Quarter
Actual output -
validated
2nd Quarter
Planned output
as per APP
2nd Quarter
Actual output -
validated
3rd Quarter
Planned output
as per APP
3rd Quarter
Preliminary
output
QUARTERLY OUTPUTS
Programme 1: Administration
Percentage of Hospitals with broadband access 100.0% 100.0% 100.0% 100.0% 15.2% 100.0% 15.2%
Percentage of fixed PHC facilities with broadband access 50.0% 35.0% 35.8% 43.0% 28.5% 46.0% 28.5%
Programme 2: District Health Services
District Management
Percentage of fixed PHC Facilities scoring above 80% on the ideal clinic dashboard 10% (28/279) Annual Target 0% Annual Target 0% Annual Target 0%
Patient Experience of Care rate (PHC Facilities) 75.0% Annual Target 0% Annua Target 0% Annual Target 81.0%
Number of Districts with District Clinical Specialist Teams (DCSTs) 1 Annual Target - Annua Target - Annual Target -
PHC utilisation rate 2.5 2.5 2.3 2.5 2.2 2.5 2.3
Complaints resolution rate 85.0% 85.0% 55.3% 85.0% 69.1% 85.0% 61.8%
Complaint resolution within 25 working days rate 85.0% 85.0% 92.4% 85.0% 98.9% 85.0% 97.9%
HIV and AIDS, TB and STI control
Total clients remaining on ART 354,991 88,745 257,217 88,745 308,226 88,745 318,202
Client tested for HIV (incl ANC) 1,949,598 487,399 220,824 487,399 249,014 487,399 242,702
TB symptom 5yrs and older screened rate >95% >95% 2.9% >95% 0% >95% 0%
Male condom distribution Rate (annualised) 20 per male 20 per male 49 20 per male 66 20 per male 83
Female condom distribution Rate (annualised) 1,238,628 309,657 1 309,657 1 309,657 1
Medical male circumcision performed - Total 150 000 35 000 8 278 60 000 11 205 20 000 3 611
TB new client treatment success rate >85% >85% 85.8% >85% 86.1% >85% 88.9%
TB client lost to follow up rate <5% <5% 4.7% <5% 3.9% <5% 3.6%
Maternal, child and women health
Antenatal 1st visit before 20 weeks rate 55.0% 51.3% 58.8% 52.5% 67.4% 53.8% 79.7%
Mother postnatal visit within 6 days rate 60.0% 52.5% 62.9% 55.0% 62.2% 57.5% 70.6%
Infant 1st PCR test positive around 6 weeks rate <2% <2% 1.3% <2% 1.7% <2% 2.2%
Immunisation coverage under 1 year (annualised) 90.0% 90.0% 88.3% 90.0% 84.0% 90.0% 87.7%
Measles 2nd dose coverage (annualised) 90.0% 90.0% 70.4% 90.0% 77.8% 90.0% 80.0%
DTaP-IPV/Hib 3 - Measles 1st dose drop-out rate <15% <15% 0.7% <15% 24.5% <15% 12.4%
Child under 5 years diarrhoea case fatality rate 11.5% 12.0% 4.7% 11.8% 2.2% 11.7% 2.0%
Child under 5 years pneumonia case fatality rate 5.5% 5.5% 3.6% 5.5% 4.2% 5.5% 3.1%
Child under 5 years severe acute malnutrition case fatality rate 11.5% 12.0% 16.3% 11.8% 11.0% 11.7% 8.9%
School Grade R screening coverage (annualised) 2.0% 0.5% 0% 1.0% 0% 1.5% 0%
School Grade 1 screening coverage (annualised) 24.0% 21.0% 6.6% 22.0% 10.0% 23.0% 13.3%
School Grade 8 screening coverage (annualised) 10.0% 6.3% 1.6% 7.5% 4.5% 8.8% 5.1%
Couple year protection rate (annualised) 45.0% 45.0% 47.6% 45.0% 59.6% 45.0% 70.1%
Cervical cancer screening coverage (annualised) 70.0% 62.5% 59.6% 65.0% 73.6% 67.5% 74.9%
Vitamin A 12-59 months coverage (annualised) 50.0% 45.0% 38.8% 47.0% 42.8% 49.0% 44.2%
District Hospitals
National Core Standards self assessment rate 100.0% Annual Target 0% Annual Target 69.6% Annual Target 69.6%
Quality improvement plan after self assessment rate 100.0% Annual Target 0% Annua Target 100.0% Annual Target 100.0%
Percentage of Hospitals compliant with all extreme and vital measures of the national core standards 25.0% Annual Target 0% Annua Target 0% Annual Target 0%
Patient Experience of Care Survey Rate 100.0% Annual Target 0% Annua Target 4.3% Annual Target 100.0%
Average Length of Stay 3.7 days 3.7 days 4.4 days 3.7 days 4.6 days 3.7 days 4.5 days
Inpatient Bed Utilisation Rate 73.5% 73.5% 23.9% 73.5% 73.3% 73.5% 71.3%
Expenditure per PDE R 1,985 R 1,985 R 1,993 R 1,985 R 1,409 R 1,985 R 2,278
Complaints resolution rate 95.0% 95.0% 62.0% 95.0% 74.9% 95.0% 73.4%
Complaint resolution within 25 working days rate 95.0% 95.0% 97.2% 95.0% 86.9% 95.0% 94.4%
Disease Prevention and Control
Clients screened for hypertension-25 years and older 70,000 20,000 61,700 20,000 383,856 20,000 411,483
Clients screened for diabetes- 5 years and older 70,000 20,000 15,773 20,000 98,470 20,000 94,736
Client screened for Mental disorders 0.5% 0.5% 0.1% 0.5% 0.3% 0.5% 0.6%
Client treated for Mental Disorders new 0.5% 0.5% 9.0% 0.5% 6.0% 0.5% 3.4%
Cataract Surgery Rate annualised 1,000.0 1,000.0 412.0 1,000.0 1,064.8 1,000.0 1,356.4
Malaria case fatality rate 0.5% 5.0% 0% 0.5% 0.2% 0.5% 0.7%
Programme 3: Emergency Medical Services
EMS P1 urban response under 15 minutes rate 85.0% 85.0% 59.1% 85.0% 73.8% 85.0% 72.8%
EMS P1 rural response under 40 minutes rate 75.0% 75.0% 17.5% 75.0% 78.5% 75.0% 74.7%
EMS inter-facility transfer rate 10.0% 10.0% 4.1% 10.0% 43.1% 10.0% 3.1%
Programme 4: Provincial Hospital Services
General (regional) hospitals
National Core Standards self assessment rate 100.0% Annual Target 0% Annual Target 0% Annual Target 0%
Quality improvement plan after self assessment rate 100.0% Annual Target 0% Annual Target 0% Annual Target 0%
Percentage of Hospitals compliant with all extreme and vital measures of the national core standards 100.0% Annual Target 0% Annual Target 0% Annual Target 0%
Patient Experience of Care Survey Rate 100.0% Annual Target 0% Annual Target 0% Annual Target 100.0%
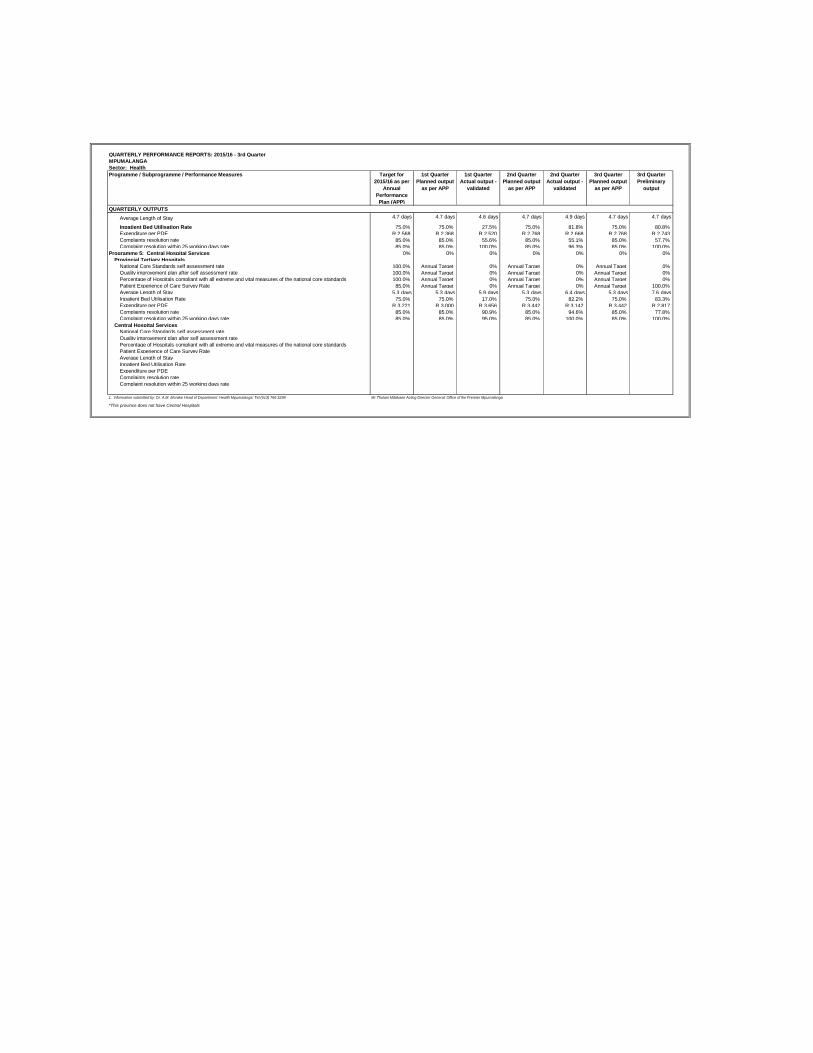
QUARTERLY PERFORMANCE REPORTS: 2015/16 - 3rd Quarter
MPUMALANGA
Sector: Health
Programme / Subprogramme / Performance Measures Target for
2015/16 as per
Annual
Performance
Plan (APP)
1st Quarter
Planned output
as per APP
1st Quarter
Actual output -
validated
2nd Quarter
Planned output
as per APP
2nd Quarter
Actual output -
validated
3rd Quarter
Planned output
as per APP
3rd Quarter
Preliminary
output
QUARTERLY OUTPUTS
Average Length of Stay 4.7 days 4.7 days 4.6 days 4.7 days 4.9 days 4.7 days 4.7 days
Inpatient Bed Utilisation Rate 75.0% 75.0% 27.5% 75.0% 81.8% 75.0% 80.8%
Expenditure per PDE R 2,568 R 2,368 R 2,520 R 2,768 R 2,668 R 2,768 R 2,743
Complaints resolution rate 85.0% 85.0% 55.6% 85.0% 55.1% 85.0% 57.7%
Complaint resolution within 25 working days rate 85.0% 85.0% 100.0% 85.0% 96.3% 85.0% 100.0%
Programme 5: Central Hospital Services 0% 0% 0% 0% 0% 0% 0%
Provincial Tertiary Hospitals
National Core Standards self assessment rate 100.0% Annual Target 0% Annual Target 0% Annual Taget 0%
Quality improvement plan after self assessment rate 100.0% Annual Target 0% Annual Target 0% Annual Target 0%
Percentage of Hospitals compliant with all extreme and vital measures of the national core standards 100.0% Annual Target 0% Annual Target 0% Annual Target 0%
Patient Experience of Care Survey Rate 85.0% Annual Target 0% Annual Target 0% Annual Target 100.0%
Average Length of Stay 5.3 days 5.3 days 5.9 days 5.3 days 6.4 days 5.3 days 7.6 days
Inpatient Bed Utilisation Rate 75.0% 75.0% 17.0% 75.0% 82.2% 75.0% 83.3%
Expenditure per PDE R 3,221 R 3,000 R 3,656 R 3,442 R 3,142 R 3,442 R 2,817
Complaints resolution rate 85.0% 85.0% 90.9% 85.0% 94.6% 85.0% 77.8%
Complaint resolution within 25 working days rate 85.0% 85.0% 95.0% 85.0% 100.0% 85.0% 100.0%
Central Hospital Services
National Core Standards self assessment rate
Quality improvement plan after self assessment rate
Percentage of Hospitals compliant with all extreme and vital measures of the national core standards
Patient Experience of Care Survey Rate
Average Length of Stay
Inpatient Bed Utilisation Rate
Expenditure per PDE
Complaints resolution rate
Complaint resolution within 25 working days rate
1. Information submitted by: Dr. A.M. Morake Head of Department: Health Mpumalanga: Tel (013) 766 3298 Mr Thulani Mdakane Acting Director General: Office of the Premier Mpumalanga
*This province does not have Central Hospitals

QUARTERLY PERFORMANCE REPORTS: 2015/16 - 3rd Quarter
NORTHERN CAPE
Sector: Health
Programme / Subprogramme / Performance Measures Target for
2015/16 as per
Annual
Performance
Plan (APP)
1st Quarter
Planned output
as per APP
1st Quarter
Actual output -
validated
2nd Quarter
Planned output
as per APP
2nd Quarter
Actual output -
validated
3rd Quarter
Planned output
as per APP
3rd Quarter
Preliminary
output
QUARTERLY OUTPUTS
Programme 1: Administration
Percentage of Hospitals with broadband access 30.0% 30.0% 7.1% 30.0% 7.1% 30.0% 7.1%
Percentage of fixed PHC facilities with broadband access 26.0% 0% 0% 0% 0% 13.0% 0%
Programme 2: District Health Services
District Management
Percentage of fixed PHC Facilities scoring above 80% on the ideal clinic dashboard 27.0% 7.0% 0% 14.0% 0.6% 20.0% 0.6%
Patient Experience of Care rate (PHC Facilities) 80.0% 80.0% 1.2% 80.0% 54.3% 80.0% 61.6%
Number of Districts with District Clinical Specialist Teams (DCSTs) 1 1 - 1 5 1 5
PHC utilisation rate 3.0 3.0 2.6 3.0 2.6 3.0 2.6
Complaints resolution rate 80.0% 80.0% 73.1% 80.0% 75.8% 80.0% 57.4%
Complaint resolution within 25 working days rate 80.0% 80.0% 94.7% 80.0% 91.4% 80.0% 100.0%
HIV and AIDS, TB and STI control
Total clients remaining on ART 52,999 46,959 43,530 48,979 45,812 50,989 39,812
Client tested for HIV (incl ANC) 241,037 67,490 50,078 69,901 57,299 48,207 56,321
TB symptom 5yrs and older screened rate 30.0% 30.0% 38.5% 30.0% 41.0% 30.0% 54.3%
Male condom distribution Rate (annualised) 37 37 1 37 21 37 21
Female condom distribution Rate (annualised) 1 1 1 1 1 1 1
Medical male circumcision performed - Total 24 279 5 794 6 687 11 381 1 925 2 276 500
TB new client treatment success rate 95.0% 95.0% 75.7% 95.0% 76.8% 95.0% 75.0%
TB client lost to follow up rate 6.0% 6.0% 7.4% 6.0% 5.5% 6.0% 7.1%
Maternal, child and women health
Antenatal 1st visit before 20 weeks rate 62.0% 62.0% 60.8% 62.0% 82.9% 62.0% 62.9%
Mother postnatal visit within 6 days rate 55.0% 50.0% 55.6% 53.0% 51.8% 55.0% 53.4%
Infant 1st PCR test positive around 6 weeks rate 1.9% 1.9% 2.4% 1.9% 3.6% 1.9% 2.2%
Immunisation coverage under 1 year (annualised) 98.0% 98.0% 85.3% 98.0% 80.7% 98.0% 83.2%
Measles 2nd dose coverage (annualised) 85.0% 85.0% 69.2% 85.0% 77.5% 85.0% 74.6%
DTaP-IPV/Hib 3 - Measles 1st dose drop-out rate <20% <20% 6.2% <20% 13.9% <20% 11.1%
Child under 5 years diarrhoea case fatality rate 2.8/1000 2.8/1000 1.6% 2.8/1000 1.0% 2.8/1000 2.0%
Child under 5 years pneumonia case fatality rate 2.8/1000 2.8/1000 1.1% 2.8/1000 1.2% 2.8/1000 0.9%
Child under 5 years severe acute malnutrition case fatality rate 10.0% 10.0% 8.6% 10.0% 7.4% 10.0% 9.6%
School Grade R screening coverage (annualised) 30.0% 30.0% 3.3% 30.0% 11.3% 30.0% 2.6%
School Grade 1 screening coverage (annualised) 30.0% 30.0% 31.2% 30.0% 19.2% 30.0% 10.5%
School Grade 8 screening coverage (annualised) 25.0% 25.0% 12.4% 25.0% 7.8% 25.0% 8.7%
Couple year protection rate (annualised) 45.0% 45.0% 24.1% 45.0% 28.2% 45.0% 27.1%
Cervical cancer screening coverage (annualised) 55.0% 55.0% 41.1% 55.0% 50.9% 55.0% 48.8%
Vitamin A 12-59 months coverage (annualised) 42.0% 42.0% 44.2% 42.0% 47.0% 42.0% 48.1%
District Hospitals
National Core Standards self assessment rate 100.0% 100.0% 0% 100.0% 100.0% 100.0% 100.0%
Quality improvement plan after self assessment rate 100.0% 100.0% 0% 100.0% 100.0% 100.0% 100.0%
Percentage of Hospitals compliant with all extreme and vital measures of the national core standards 27.0% 9.0% 0% 9.0% 100.0% 9.0% 100.0%
Patient Experience of Care Survey Rate 80.0% 80.0% 0% 80.0% 72.7% 80.0% 81.8%
Average Length of Stay 3.5 days 3.5 days 3.5 days 3.5 days 3.3 days 3.5 days 3.2 days
Inpatient Bed Utilisation Rate 63.0% 63.0% 60.4% 63.0% 61.0% 63.0% 58.6%
Expenditure per PDE R 1,720 R 1,720 R 2,668 R 1,720 R 2,475 R 1,720 R 2,486
Complaints resolution rate 80.0% 80.0% 73.7% 80.0% 87.0% 80.0% 34.5%
Complaint resolution within 25 working days rate 80.0% 80.0% 100.0% 80.0% 100.0% 80.0% 100.0%
Disease Prevention and Control
Clients screened for hypertension-25 years and older 108,759 27,951 40,792 27,190 46,549 26,646 52,299
Clients screened for diabetes- 5 years and older 108,759 27,951 14,171 27,190 17,310 26,646 27,042
Client screened for Mental disorders 15.0% 15.0% 0.4% 15.0% 0.5% 15.0% 1.1%
Client treated for Mental Disorders new 2.0% 2.0% 100.0% 2.0% 23.6% 2.0% 18.2%
Cataract Surgery Rate annualised 1395/1000000 349/1000000 822.8 349/1000000 947.1 348/1000000 1,497.8
Malaria case fatality rate 0% 0% 0% 0% 0% 0% 0%
Programme 3: Emergency Medical Services
EMS P1 urban response under 15 minutes rate 60.0% 60.0% 53.5% 60.0% 69.1% 60.0% 53.4%
EMS P1 rural response under 40 minutes rate 40.0% 40.0% 53.5% 40.0% 39.4% 40.0% 39.2%
EMS inter-facility transfer rate 10.0% 10.0% 14.4% 10.0% 16.1% 10.0% 15.0%
Programme 4: Provincial Hospital Services
General (regional) hospitals
National Core Standards self assessment rate 100.0% 100.0% 0% 100.0% 100.0% 100.0% 100.0%
Quality improvement plan after self assessment rate 100.0% 100.0% 0% 100.0% 100.0% 100.0% 100.0%
Percentage of Hospitals compliant with all extreme and vital measures of the national core standards 100.0% 100.0% 0% 100.0% 0% 100.0% 0%
Patient Experience of Care Survey Rate 80.0% 80.0% 0% 80.0% 100.0% 80.0% 100.0%

QUARTERLY PERFORMANCE REPORTS: 2015/16 - 3rd Quarter
NORTHERN CAPE
Sector: Health
Programme / Subprogramme / Performance Measures Target for
2015/16 as per
Annual
Performance
Plan (APP)
1st Quarter
Planned output
as per APP
1st Quarter
Actual output -
validated
2nd Quarter
Planned output
as per APP
2nd Quarter
Actual output -
validated
3rd Quarter
Planned output
as per APP
3rd Quarter
Preliminary
output
QUARTERLY OUTPUTS
Average Length of Stay 4.8 days 4.8 days 4.7 days 4.8 days 4.4 days 4.8 days 5.1 days
Inpatient Bed Utilisation Rate 72.0% 72.0% 102.9% 72.0% 97.4% 72.0% 105.3%
Expenditure per PDE R 2,570 R 2,570 R 3,410 R 2,570 R 2,531 R 2,570 R 2,936
Complaints resolution rate 80.0% 80.0% 57.1% 80.0% 0% 80.0% 0%
Complaint resolution within 25 working days rate 80.0% 80.0% 100.0% 80.0% 0% 80.0% 0%
Programme 5: Central Hospital Services
Provincial Tertiary Hospitals
National Core Standards self assessment rate 100.0% 100.0% 0% 100.0% 100.0% 100.0% 100.0%
Quality improvement plan after self assessment rate 100.0% 100.0% 0% 100.0% 100.0% 100.0% 100.0%
Percentage of Hospitals compliant with all extreme and vital measures of the national core standards 100.0% 100.0% 0% 100.0% 0% 100.0% 0%
Patient Experience of Care Survey Rate 80.0% 80.0% 100.0% 80.0% 100.0% 80.0% 100.0%
Average Length of Stay 5.5 days 5.5 days 6.2 days 5.5 days 6.0 days 5.5 days 6.1 days
Inpatient Bed Utilisation Rate 74.0% 74.0% 71.8% 74.0% 74.6% 74.0% 75.3%
Expenditure per PDE R 3,736 R 3,736 R 4,502 R 3,736 R 3,504 R 3,736 R 3,701
Complaints resolution rate 80.0% 80.0% 14.3% 80.0% 100.0% 80.0% 100.0%
Complaint resolution within 25 working days rate 80.0% 80.0% 100.0% 80.0% 77.1% 80.0% 100.0%
Central Hospital Services
National Core Standards self assessment rate
Quality improvement plan after self assessment rate
Percentage of Hospitals compliant with all extreme and vital measures of the national core standards
Patient Experience of Care Survey Rate
Average Length of Stay
Inpatient Bed Utilisation Rate
Expenditure per PDE
Complaints resolution rate
Complaint resolution within 25 working days rate
1. Information submitted by: Ms G. Matlaopane Head of Department: Health Northern Cape: Tel: (053) 830 0806 Adv. J. Bekebeke Director General: Office of the Premier Northern Cape
*This province does not have Central Hospitals
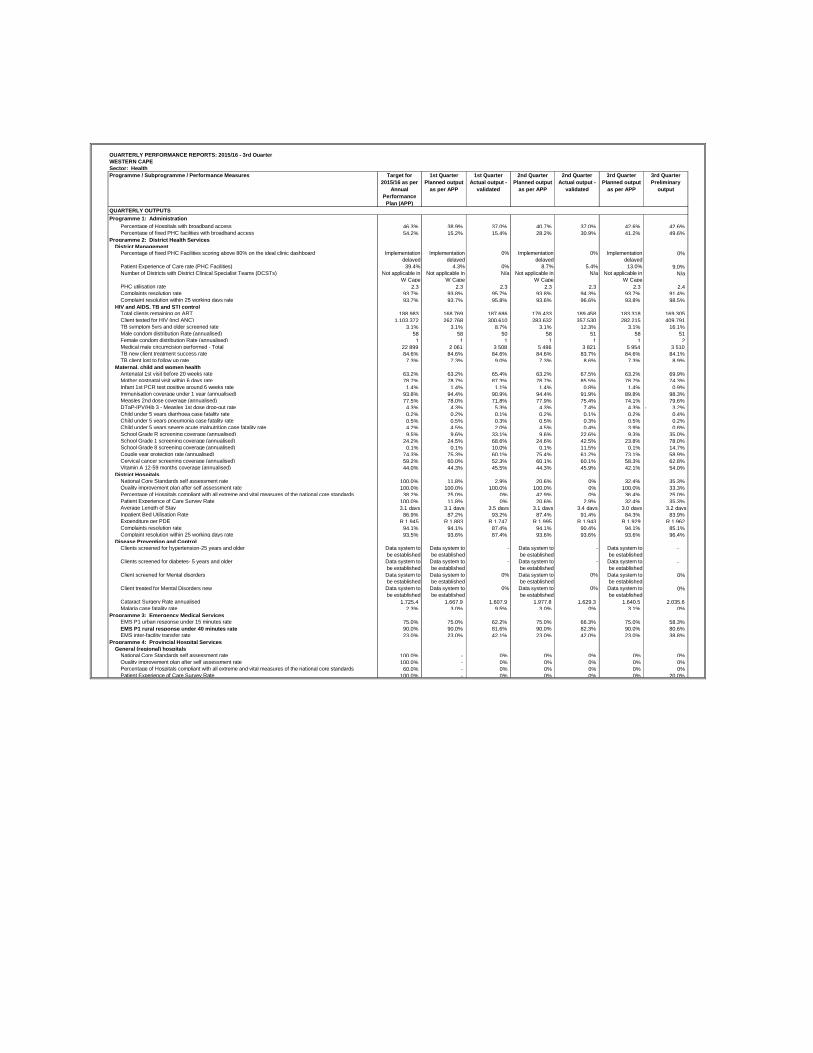
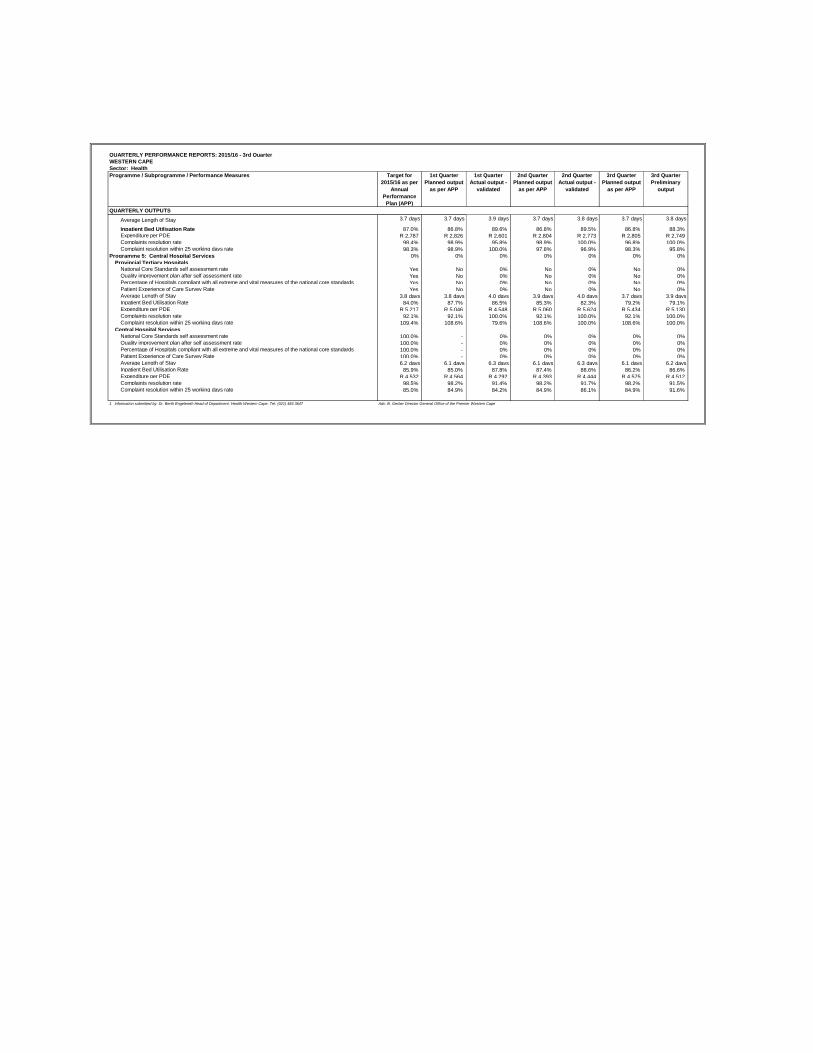
QUARTERLY PERFORMANCE REPORTS: 2015/16 - 3rd Quarter
WESTERN CAPE
Sector: Health
Programme / Subprogramme / Performance Measures Target for
2015/16 as per
Annual
Performance
Plan (APP)
1st Quarter
Planned output
as per APP
1st Quarter
Actual output -
validated
2nd Quarter
Planned output
as per APP
2nd Quarter
Actual output -
validated
3rd Quarter
Planned output
as per APP
3rd Quarter
Preliminary
output
QUARTERLY OUTPUTS
Programme 1: Administration
Percentage of Hospitals with broadband access 46.3% 38.9% 37.0% 40.7% 37.0% 42.6% 42.6%
Percentage of fixed PHC facilities with broadband access 54.2% 15.2% 15.4% 28.2% 30.9% 41.2% 49.6%
Programme 2: District Health Services
District Management
Percentage of fixed PHC Facilities scoring above 80% on the ideal clinic dashboard Implementation
delayed
Implementation
delayed
0% Implementation
delayed
0% Implementation
delayed
0%
Patient Experience of Care rate (PHC Facilities) 39.4% 4.3% 0% 8.7% 5.4% 13.0% 9.0%
Number of Districts with District Clinical Specialist Teams (DCSTs) Not applicable in
W Cape
Not applicable in
W Cape
N/a Not applicable in
W Cape
N/a Not applicable in
W Cape
N/a
PHC utilisation rate 2.3 2.3 2.3 2.3 2.3 2.3 2.4
Complaints resolution rate 93.7% 93.8% 95.7% 93.8% 94.3% 93.7% 91.4%
Complaint resolution within 25 working days rate 93.7% 93.7% 95.8% 93.6% 96.6% 93.8% 98.5%
HIV and AIDS, TB and STI control
Total clients remaining on ART 188,983 168,769 187,686 176,433 189,458 183,318 169,305
Client tested for HIV (incl ANC) 1,103,372 262,768 300,610 283,632 357,530 282,215 409,791
TB symptom 5yrs and older screened rate 3.1% 3.1% 8.7% 3.1% 12.3% 3.1% 16.1%
Male condom distribution Rate (annualised) 58 58 50 58 51 58 51
Female condom distribution Rate (annualised) 1 1 1 1 1 1 2
Medical male circumcision performed - Total 22 899 2 061 3 508 5 496 3 821 5 954 3 510
TB new client treatment success rate 84.6% 84.6% 84.6% 84.6% 83.7% 84.6% 84.1%
TB client lost to follow up rate 7.3% 7.3% 9.0% 7.3% 8.6% 7.3% 8.9%
Maternal, child and women health
Antenatal 1st visit before 20 weeks rate 63.2% 63.2% 65.4% 63.2% 67.5% 63.2% 69.9%
Mother postnatal visit within 6 days rate 78.7% 78.7% 87.3% 78.7% 85.5% 78.7% 74.3%
Infant 1st PCR test positive around 6 weeks rate 1.4% 1.4% 1.1% 1.4% 0.8% 1.4% 0.9%
Immunisation coverage under 1 year (annualised) 93.8% 94.4% 90.9% 94.4% 91.9% 89.8% 98.3%
Measles 2nd dose coverage (annualised) 77.5% 78.0% 71.8% 77.9% 75.4% 74.1% 79.6%
DTaP-IPV/Hib 3 - Measles 1st dose drop-out rate 4.3% 4.3% 5.3% 4.3% 7.4% 4.3% 3.2%-
Child under 5 years diarrhoea case fatality rate 0.2% 0.2% 0.1% 0.2% 0.1% 0.2% 0.4%
Child under 5 years pneumonia case fatality rate 0.5% 0.5% 0.3% 0.5% 0.3% 0.5% 0.2%
Child under 5 years severe acute malnutrition case fatality rate 4.2% 4.5% 2.0% 4.5% 0.4% 3.9% 0.8%
School Grade R screening coverage (annualised) 9.5% 9.6% 33.1% 9.6% 22.6% 9.3% 35.0%
School Grade 1 screening coverage (annualised) 24.2% 24.5% 68.6% 24.6% 42.5% 23.8% 78.0%
School Grade 8 screening coverage (annualised) 0.1% 0.1% 10.0% 0.1% 11.5% 0.1% 14.7%
Couple year protection rate (annualised) 74.3% 75.3% 60.1% 75.4% 61.2% 73.1% 58.9%
Cervical cancer screening coverage (annualised) 59.2% 60.0% 52.3% 60.1% 60.1% 58.3% 62.8%
Vitamin A 12-59 months coverage (annualised) 44.0% 44.3% 45.5% 44.3% 45.9% 42.1% 54.0%
District Hospitals
National Core Standards self assessment rate 100.0% 11.8% 2.9% 20.6% 0% 32.4% 35.3%
Quality improvement plan after self assessment rate 100.0% 100.0% 100.0% 100.0% 0% 100.0% 33.3%
Percentage of Hospitals compliant with all extreme and vital measures of the national core standards 38.2% 25.0% 0% 42.9% 0% 36.4% 25.0%
Patient Experience of Care Survey Rate 100.0% 11.8% 0% 20.6% 2.9% 32.4% 35.3%
Average Length of Stay 3.1 days 3.1 days 3.5 days 3.1 days 3.4 days 3.0 days 3.2 days
Inpatient Bed Utilisation Rate 86.9% 87.2% 93.2% 87.4% 91.4% 84.3% 83.9%
Expenditure per PDE R 1,945 R 1,883 R 1,747 R 1,995 R 1,943 R 1,929 R 1,962
Complaints resolution rate 94.1% 94.1% 87.4% 94.1% 90.4% 94.1% 85.1%
Complaint resolution within 25 working days rate 93.5% 93.6% 87.4% 93.6% 93.6% 93.6% 96.4%
Disease Prevention and Control
Clients screened for hypertension-25 years and older Data system to
be established
Data system to
be established
- Data system to
be established
- Data system to
be established
-
Clients screened for diabetes- 5 years and older Data system to
be established
Data system to
be established
- Data system to
be established
- Data system to
be established
-
Client screened for Mental disorders Data system to
be established
Data system to
be established
0% Data system to
be established
0% Data system to
be established
0%
Client treated for Mental Disorders new Data system to
be established
Data system to
be established
0% Data system to
be established
0% Data system to
be established
0%
Cataract Surgery Rate annualised 1,725.4 1,667.9 1,607.9 1,977.8 1,629.3 1,640.5 2,035.6
Malaria case fatality rate 2.3% 3.0% 9.5% 3.0% 0% 3.1% 0%
Programme 3: Emergency Medical Services
EMS P1 urban response under 15 minutes rate 75.0% 75.0% 62.2% 75.0% 66.3% 75.0% 58.3%
EMS P1 rural response under 40 minutes rate 90.0% 90.0% 81.6% 90.0% 82.3% 90.0% 80.6%
EMS inter-facility transfer rate 23.0% 23.0% 42.1% 23.0% 42.0% 23.0% 38.8%
Programme 4: Provincial Hospital Services
General (regional) hospitals
National Core Standards self assessment rate 100.0% - 0% 0% 0% 0% 0%
Quality improvement plan after self assessment rate 100.0% - 0% 0% 0% 0% 0%
Percentage of Hospitals compliant with all extreme and vital measures of the national core standards 60.0% - 0% 0% 0% 0% 0%
Patient Experience of Care Survey Rate 100.0% - 0% 0% 0% 0% 20.0%
QUARTERLY PERFORMANCE REPORTS: 2015/16 - 3rd Quarter
WESTERN CAPE
Sector: Health
Programme / Subprogramme / Performance Measures Target for
2015/16 as per
Annual
Performance
Plan (APP)
1st Quarter
Planned output
as per APP
1st Quarter
Actual output -
validated
2nd Quarter
Planned output
as per APP
2nd Quarter
Actual output -
validated
3rd Quarter
Planned output
as per APP
3rd Quarter
Preliminary
output
QUARTERLY OUTPUTS
Average Length of Stay 3.7 days 3.7 days 3.9 days 3.7 days 3.8 days 3.7 days 3.8 days
Inpatient Bed Utilisation Rate 87.0% 86.8% 89.6% 86.8% 89.5% 86.8% 88.3%
Expenditure per PDE R 2,787 R 2,826 R 2,601 R 2,804 R 2,773 R 2,805 R 2,749
Complaints resolution rate 98.4% 98.9% 95.8% 98.9% 100.0% 96.8% 100.0%
Complaint resolution within 25 working days rate 98.3% 98.9% 100.0% 97.8% 96.9% 98.3% 95.8%
Programme 5: Central Hospital Services 0% 0% 0% 0% 0% 0% 0%
Provincial Tertiary Hospitals
National Core Standards self assessment rate Yes No 0% No 0% No 0%
Quality improvement plan after self assessment rate Yes No 0% No 0% No 0%
Percentage of Hospitals compliant with all extreme and vital measures of the national core standards Yes No 0% No 0% No 0%
Patient Experience of Care Survey Rate Yes No 0% No 0% No 0%
Average Length of Stay 3.8 days 3.8 days 4.0 days 3.9 days 4.0 days 3.7 days 3.9 days
Inpatient Bed Utilisation Rate 84.0% 87.7% 86.5% 85.3% 82.3% 79.2% 79.1%
Expenditure per PDE R 5,217 R 5,046 R 4,548 R 5,060 R 5,624 R 5,434 R 5,130
Complaints resolution rate 92.1% 92.1% 100.0% 92.1% 100.0% 92.1% 100.0%
Complaint resolution within 25 working days rate 109.4% 108.6% 79.6% 108.6% 100.0% 108.6% 100.0%
Central Hospital Services
National Core Standards self assessment rate 100.0% - 0% 0% 0% 0% 0%
Quality improvement plan after self assessment rate 100.0% - 0% 0% 0% 0% 0%
Percentage of Hospitals compliant with all extreme and vital measures of the national core standards 100.0% - 0% 0% 0% 0% 0%
Patient Experience of Care Survey Rate 100.0% - 0% 0% 0% 0% 0%
Average Length of Stay 6.2 days 6.1 days 6.3 days 6.1 days 6.3 days 6.1 days 6.2 days
Inpatient Bed Utilisation Rate 85.9% 85.0% 87.8% 87.4% 88.6% 86.2% 86.6%
Expenditure per PDE R 4,532 R 4,564 R 4,292 R 4,393 R 4,444 R 4,575 R 4,512
Complaints resolution rate 98.5% 98.2% 91.4% 98.2% 91.7% 98.2% 91.5%
Complaint resolution within 25 working days rate 85.0% 84.9% 84.2% 84.9% 86.1% 84.9% 91.6%
1. Information submitted by: Dr. Berth Engelereth Head of Department: Health Western Cape: Tel: (021) 483 3647 Adv. B. Gerber Director General Office of the Premier Western Cape


![Quarterly Performance Review [Company Update]](https://img.pdfslide.net/doc/110x75/577c7f061a28abe054a2ec36/quarterly-performance-review-company-update.jpg)