Embed Size (px)
Citation preview

Quarterly Report 1/2013
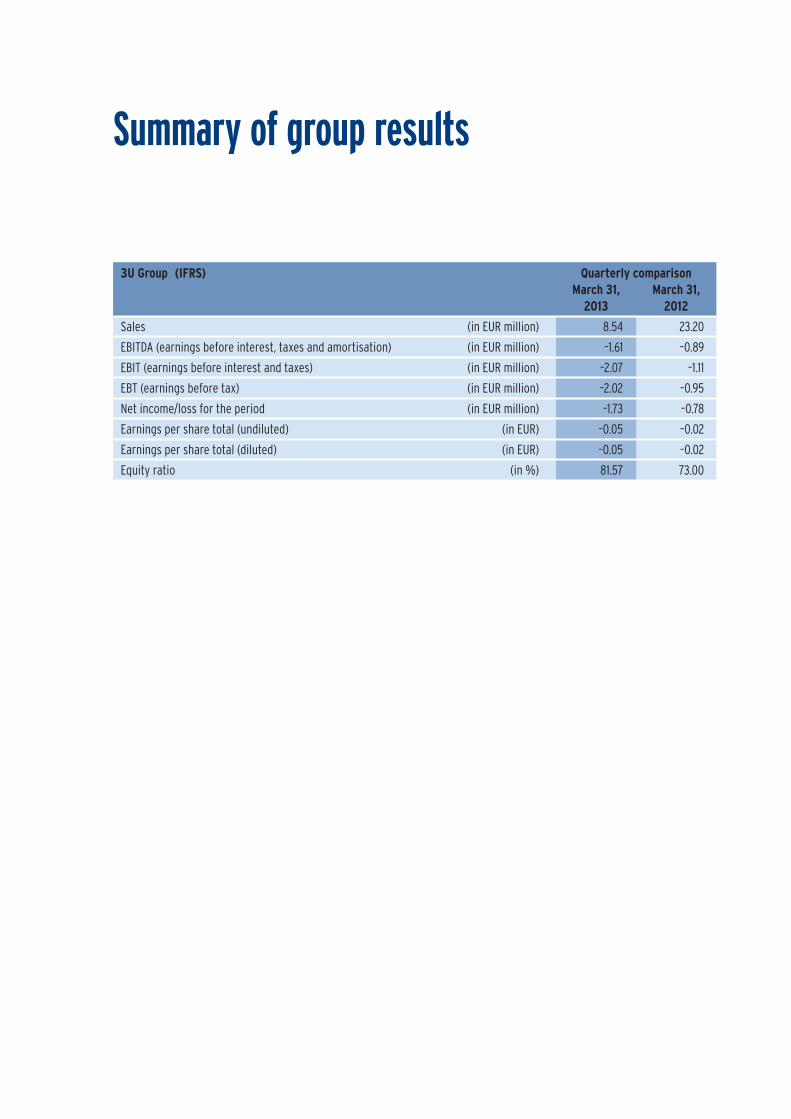
Summary of group results
3U Group (IFRS) Quarterly comparisonMarch 31, March 31,
2013 2012
Sales (in EUR million) 8.54 23.20
EBITDA (earnings before interest, taxes and amortisation) (in EUR million) –1.61 –0.89
EBIT (earnings before interest and taxes) (in EUR million) –2.07 –1.11
EBT (earnings before tax) (in EUR million) –2.02 –0.95
Net income/loss for the period (in EUR million) –1.73 –0.78
Earnings per share total (undiluted) (in EUR) –0.05 –0.02
Earnings per share total (diluted) (in EUR) –0.05 –0.02
Equity ratio (in %) 81.57 73.00
2
2
4
7
8
8
24
28
28
30
31
32
34
36
44
45
45
45
46
46
47
To our Shareholders
Letter to our shareholders
The 3U share
Corporate governance report
Interim Group Management Report
Report on business development
Outlook
Interim Consolidated Financial Statements
Balance sheet as of March 31, 2013
Income statement
Statement of income and accumulated earnings
Statement of changes in equity
Cash flow statement
Explanatory notes to the consolidated financial statements as of March 31, 2013
Responsibility statement
Further Information
Financial calendar
Contact
Imprint
Disclaimer
3U Group
Contents 1
2
TO OUR SHAREHOLDERS | INTERIM GROUP MANAGEMENT REPORT | INTERIM CONSOLIDATED FINANCIAL STATEMENTS | FURTHER INFORMATION
Letter to our shareholders
Dear shareholders,
due to the unfortunate course of fiscal 2012, we informed you about six weeks ago that we had adopted a number of measures in
the fourth quarter of 2012, which have to be implemented in 2013 if they have not already been addressed in the fourth quarter
of 2012.
Today we are able to report on substantial progress in the implementation in the 4-points target achievement strategy 2013, which
gives us confidence to achieve a turnaround in 2013 and profitable growth again in 2014.
Progress in the 4-points target achievement strategy 2013
The cost reduction and margin improvement program in the segment Telephony has resulted in a significant increase in profitability
in the first quarter to. Core component of this program is the reconstruction of the telecommunications network, which will shortly
lead to lower network costs. Improved results compared to the fourth quarter of 2012 were achieved among others by greatly
reduced administrative costs. However, the market environment remains very difficult because it is characterized by strong com-
petition, and regulatory decisions forcing 3U repeatedly to adjust. With the individual companies in the segment Telephony, we
are able to pursue different strategy, marketing and sales concepts and successfully occupy niches that we otherwise could not
occupy with just one company due to legal requirements. We will face all of these challenges in the future, as we adapt to the con-
tinuously changing conditions and thus generate future positive earnings contributions.
The positive impact of the cost optimization and efficiency improvement program in the segment Renewable Energies are only
partially supported by the business figures. This is due to the fact that lower personnel expenses due to headcount reductions
unfold their full impact not until the second or third quarter. A positive impact will also come from a high order backlog at
ClimaLevel. The execution of orders has been significantly delayed by the severe and prolonged winter. With the announcement
of the Federal Government to intervene massively in the existing compensation system according to the EEG, the industry has been
deprived of any planning and investment security. Despite these negative factors, we have succeeded to significantly increase seg-
ment sales compared to the previous year, even without large-volume trading with PV modules.
In the segment Services, we significantly increased the area of corporate consulting/IT security. With new customers including the
banking sector and consultancy contracts including minimum fixed maturities, recurring sales are realized. With our cloud products,
we are in a mega-trend. The product portfolio consisting of project management, contract management, inventory management,
CRM, Helpdesk, mobile device management and organizer, can be perfectly combined. So far we have not been able to reach the
intended market presence. This next growth spurt we want to achieve with a strategic partner with better access to the relevant
market. With external support alternative scenarios with different parties were intensively discussed in recent months; this also
includes the pro rata or complete sale of the Subsidiary weclapp. These talks/presentations have significant tied up management
resources (including marketing).
The project development has also been reduced as part of the cost cutting measures taken. We had to give up the original plan
to develop a series of solar parks with these capacities, due to the changed conditions. Nevertheless, we were able to success-
fully acquire the first significant external projects, so that this area also developed satisfactorily.
3
TO OUR SHAREHOLDERS | INTERIM GROUP MANAGEMENT REPORT | INTERIM CONSOLIDATED FINANCIAL STATEMENTS | FURTHER INFORMATION
Continued difficult conditions for renewable energy
Renewable energy is and will remain a growth market. According to the REN21 (Renewable Energy Policy Network for the 21st Cen-
tury) report published in November 2012 global investments in renewable energy grow at rates of 15–20 %. It is still being heavily
invested in renewable energy in Germany, although the expansion of PV systems has been greatly reduced. The PV expansion
target of the federal government remains at 2,500 to 3,500 MW. If many more PV plants are realised the feed-in tariffs would not
only drop by 11.4 % annually, but by up to 29 %. These conditions already characterized the PV market in 2012 and made large-scale
PV plants hardly calculable. Conditions are not expected to improve in 2013.
Against this background, 3U HOLDING AG counts particularly on the area of heating, cooling and ventilation, which benefits from
low interest rates, relatively high energy prices and supportive laws and regulations and develops very favorably. In addition, 3U
drives the final work on the realized solar power plant at the Marburg site to move from the research and development phase to
the active marketing phase. The significant investments in the SKW are already completed today.
Another focus concerns project developments in the area renewable energy. In light of the current conditions and the expected
changes in the EEG mainly wind power projects in attractive locations have a good reward profile. Through the planning resources
available to us, we are able to identify promising projects. For this reason, we deal also currently with potential wind power
projects.
Annual General Meeting 2013
Our Annual General Meeting will be held in Marburg on May 29, 2013. There has been intensive contact with shareholders ahead;
some of them have very clearly expressed their displeasure with the development of the past financial year. We tried to convince
them of our strategy for the further development of 3U. We are looking forward to the opportunity at the next AGM to answer our
shareholders’ questions.
You can be assured that we focus all our energy to position 3U HOLDING AG successfully again. The first steps in the right direction
have been taken, further will follow.
We would be delighted if you continue to join us on our journey.
Marburg, May 2013
The Management Board
Michael Schmidt Christoph Hellrung Andreas Odenbreit
The 3U share
The shares of 3U HOLDING AG are no-par bearer shares listed in the Prime Standard of the Frankfurt Stock Exchange. Besides
trading in Frankfurt on Xetra and the floor, the stock is also traded on the OTC markets in Berlin, Dusseldorf, Munich and Stuttgart.
General market development
The international stock markets in most cases recorded an upward trend in the first quarter of 2013. In Europe, by contrast, the
sovereign debt crisis and macroeconomic development continued to impact the performance of share prices. Positive and negative
signs for the development of the economy more or less balanced out without a clear trend emerging. The elections in Italy and
the banking crisis in Cyprus in particular dominated the headlines. While the economic indicators for Germany showed a slightly
positive trend, the signs for other countries in the Euro zone pointed more towards recession. Against this background, the DAX 30
increased by 2.4 %.
Development of the 3U share
The shares of 3U HOLDING AG started in fiscal year 2013 with a quotation of EUR 0.51. Following a brief increase to EUR 0,60 at Mid-
January the share gave up its gains and shuttled between EUR 0.47 and EUR 0.50 from the end of January and ended the report-
ing period with a quotation of EUR 0.48.
The Prime All Share Index started the business year 2013 at 2,852.87 points and closed at 2,968.88 and was therefore able to gain
roughly 4 %.
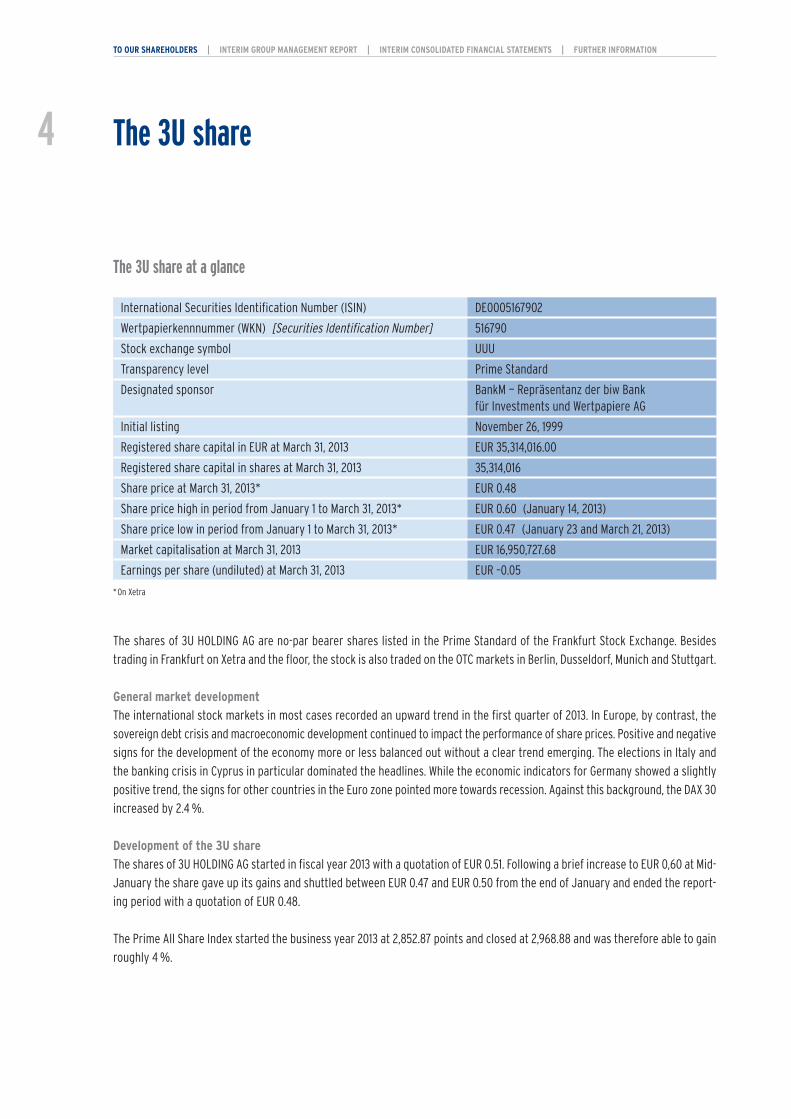
The 3U share at a glance
International Securities Identification Number (ISIN) DE0005167902
Wertpapierkennnummer (WKN) [Securities Identification Number] 516790
Stock exchange symbol UUU
Transparency level Prime Standard
Designated sponsor BankM — Repräsentanz der biw Bank für Investments und Wertpapiere AG
Initial listing November 26, 1999
Registered share capital in EUR at March 31, 2013 EUR 35,314,016.00
Registered share capital in shares at March 31, 2013 35,314,016
Share price at March 31, 2013* EUR 0.48
Share price high in period from January 1 to March 31, 2013* EUR 0.60 (January 14, 2013)
Share price low in period from January 1 to March 31, 2013* EUR 0.47 (January 23 and March 21, 2013)
Market capitalisation at March 31, 2013 EUR 16,950,727.68
Earnings per share (undiluted) at March 31, 2013 EUR –0.05
*On Xetra
TO OUR SHAREHOLDERS | INTERIM GROUP MANAGEMENT REPORT | INTERIM CONSOLIDATED FINANCIAL STATEMENTS | FURTHER INFORMATION
4

5
TO OUR SHAREHOLDERS | INTERIM GROUP MANAGEMENT REPORT | INTERIM CONSOLIDATED FINANCIAL STATEMENTS | FURTHER INFORMATION
April 2012 July 2012 October 2012 January 2013
Source: EquityStory AG/Interactive Data Managed Solutions AGPrime All Share3U HOLDING adj.
60
70
80
90
100
110
120
Share price
Share price performance of the 3U shares* from March 31, 2012 to March 31, 2013 vs. Prime All Share Index
Shareholder structure as at March 31, 2013
Michael Schmidt 25.49 % 8,999,995 shares
Andreas Odenbreit 0.06 % 20,500 shares
Gerd Simon 0.03 % 10,000 shares
(Supervisory Board)
Roland Thieme 5.58 % 1,971,232 shares
(associated person)
Remaining free float 68.84 % 24,312,289 shares
*Tagesschlusskurs Xetra

Investor relations
An open dialogue with our shareholders is a top priority for us. We want to continue to promote the awareness of 3U HOLDING AG
on the capital market. The 3U share shall be perceived as an attractive long-term investment. We want to convey the development
of the Group and our strategy in an open, continuous and reliable way to further strengthen the trust of the investors and to
achieve a fair assessment on the capital market.
We keep an intense frequent dialogue with our most important investors. In the discussions with our investors it became clear
that the development of 3U HOLDING AG is followed with interest but that there is still scepticism regarding the future develop-
ment of the Group and in particular the prospects for the segments Renewable Energy and Services.
The liquidity of the stock has increased compared to the prior year. The average daily number of traded 3U shares in Frankfurt
increased in 2013 compared to the previous year to approximately 40,000 units, after trading in the year 2012 amounted to a daily
average of approximately 30,000 3U shares.
The Management Board of 3U HOLDING AG has decided on the basis of the authorisation granted by the Annual General Meeting
of May 31, 2012 to repurchase up to 10 % of its own shares (up to 3,531,401 shares) on the stock exchange during the period from
May 1, 2013 until not later than May 30, 2017. During the time span of the share buyback program, the Management Board reserves
the right to suspend and resume the share buyback at any time, in accordance with the legal requirements to be observed. The
shares may be used for all purposes according to the authorization given by the resolution of the Annual General Meeting of
May 31, 2012.
3U HOLDING AG will report weekly on the progress of the share buy-back program on its website at http://www.3u.net/investor-
relations/die-aktie/aktienrueckkauf.
TO OUR SHAREHOLDERS | INTERIM GROUP MANAGEMENT REPORT | INTERIM CONSOLIDATED FINANCIAL STATEMENTS | FURTHER INFORMATION
6

Declaration of conformity
The Management and Supervisory Boards of 3U HOLDING AG discussed continuously the contents of the Corporate Governance
Code at length and decided that the recommendations are largely observed.
3U HOLDING AG submitted the most current declaration of conformity required according to the German Stock Corporation Act
on March 22, 2013. It can be viewed permanently on its website (www.3u.net) under the path “Investor Relations/Corporate
Governance”.
Deviations from the recommendations
Deductible D&O insurance
The D&O insurance of the Company does not contain deductibles for the Supervisory Board. Regarding this, 3U HOLDING AG thinks
that the responsibility and motivation with which the members of the Supervisory Board of the Company perform their tasks can-
not be improved by such deductibles.
Diversity
In the allocation of managerial functions the Management Board acts according to the requirements of the respective function
and searches for the person who fulfils these requirements in the best possible way. If several candidates of similar qualification
are available, the Management Board looks for diversity and an appropriate consideration of women in the Company in the allo-
cation without elevating those criteria to an overriding principle.
Executive remuneration
The Supervisory Board has not stipulated a cap for compensation to be paid to Members of the Management Board (max. 2 years’
salary) because the contracts have only a limited period of 3 years. Accordingly, the proposed limit of possible compensation
claims of Board Members as intended with 4.2.3 is already inherently included in the employment contracts of the Board Members.
Age limits & diversity for members of the Management Board and Supervisory Board
The Supervisory Board chooses the members of the Management Board according to suitability and qualification and looks for
the best composition possible for management positions. The Company is of the opinion that the special weighting of further
criteria predetermined by the code would restrict the choice of possible candidates for the Management Board. Furthermore it
has to be considered that the Management Board consists of just three members at this time.
The cast of the Supervisory Board is chosen according to suitability, experience and qualification as well. To follow other guide-
lines for choosing suitable members would restrict the flexibility without gaining other advantages for the Company. This is true
all the more since the Supervisory Board currently consists of only three members.
Corporate governance report
TO OUR SHAREHOLDERS | INTERIM GROUP MANAGEMENT REPORT | INTERIM CONSOLIDATED FINANCIAL STATEMENTS | FURTHER INFORMATION
7

Earnings
Group sales declined significantly from EUR 23.20 million by EUR 14.66 million to EUR 8.54 million compared to the previous year.
In particular the sales shortfall in the segment Telephony is responsible for this. In this segment, sales have declined by EUR 15.15
million compared to the corresponding period (first quarter 2012), while in the segment Renewable Energies sales compared to
the first quarter of 2012 could be expanded by EUR 0.68 million. In the segment Telephony it was mainly sales in the area whole-
sale/value-added services that significantly decreased.
The earnings situation of the first quarter is substantially influenced by the significantly lower gross profit compared to the
corresponding period. In the same period last year, gross profit was positively influenced primarily by one-time other operating
income in the amount of EUR 1.36 million, while only EUR 0.4 million other operating income were incurred in the first quarter of
2013. Personnel expenses and other operating expenses amounted to EUR 4.39 million and were slightly above the level of the first
quarter of 2012 with EUR 4.18 million. Compared with the fourth quarter of 2012, these expenses have already been significantly
reduced. This results in particular from the 4-points target achievement strategy, initiated in mid November 2012, which will
develop its full potential for cost reduction during the year 2013.
With EUR –1.61 million EBITDA has decreased again compared to the corresponding period from the previous year (EUR –0.89 mil-
lion). Compared to the last two quarters of 2012, however, a significant improvement and turnaround can be observed.
The financial result decreased from EUR 0.16 million in the same quarter last year by EUR 0.11 million to EUR 0.04 million in the first
quarter of 2013. This is primarily due to lower interest income and higher interest expenses on loan financing.
The income tax refund in the amount of EUR 0.02 million (previous year: tax charge EUR –0.07 million) relates to current taxes on
income in the amount of EUR –0.02 million (previous year : EUR –0.06 million) and with EUR 0.04 million (previous year : EUR –0.01
million) deferred taxes.
As a consequence, Group’s earnings in the first three months of 2013 with EUR –1.73 million are EUR 0.96 million below the Group’s
earnings of the comparable period 2012 (EUR –0.78 million).
In accordance with internal reporting, 3U Group covers the segments Telephony, Services, Renewable Energies and Holding/Con-
solidation within its segment reporting.
Following, the segments are reported including the sales between segments and earnings after share of non-controlling share-
holder but before PLA. Beyond that it needs to be noted that taxes on profits and income are carried by the parent company,
3U HOLDING AG, as long as subsidiary conditions exist.
TO OUR SHAREHOLDERS | INTERIM GROUP MANAGEMENT REPORT | INTERIM CONSOLIDATED FINANCIAL STATEMENTS | FURTHER INFORMATION
8 Report on business development

–5
0
5
10
15
20
25
Earnings*EBITDASales
Q1 2012 Q2 2012 Q3 2012 Q4 2012 Q1 2013 *After share of non-controlling shareholders
–0.78
–2.69 –2.82 –3.09–1.73
–0.89–2.27
–3.58 –3.19
–1.61
23.20
17.55
11.32
8.91 8.54
Development (sales, EBITDA, earnings) — 3U Group in EUR million
TO OUR SHAREHOLDERS | INTERIM GROUP MANAGEMENT REPORT | INTERIM CONSOLIDATED FINANCIAL STATEMENTS | FURTHER INFORMATION
9

–5
0
5
10
15
20
25
Earnings*EBITDASales
Q1 2012 Q2 2012 Q3 2012 Q4 2012 Q1 2013 *Segment income before profit transfer
0.080.69 0.15
–0.88
0.570.20 0.47
–0.40 –0.23
0.64
21.24
15.08
6.46
4.876.09
Segment Telephony
The very intense competition and the cuts by the Amendment to the Telecommunications Act and the associated additional margin
declines have left their mark in the segment Telephony at the end of 2012. Nevertheless compared to the fourth quarter of 2012
both sales and margins were significantly increased in the first three months of fiscal year 2013.
Sales in the segment Telephony increased in the reporting period compared to the fourth quarter 2012 from EUR 4.87 million to
EUR 6.09 million. The market continues to be very difficult, due to the highly competitive conditions which have worsened in fis-
cal 2012 again and the continuously shrinking of the open call-by-call market.
Higher margins compared to the fourth quarter of 2012 resulted in gross profits at EUR 1.84 million being almost on the level of
the previous year’s first quarter (EUR 1.95 million). The slight decline was more than offset by significantly lower other expenses.
With EUR 0.64 million EBITDA is EUR 0.44 million higher. Earnings increased by EUR 0.49 million from EUR 0.08 million to EUR 0.57 mil-
lion in the first quarter of 2013 compared to the first quarter of 2012.
Development (sales, EBITDA, earnings) — Segment Telephony in EUR million
TO OUR SHAREHOLDERS | INTERIM GROUP MANAGEMENT REPORT | INTERIM CONSOLIDATED FINANCIAL STATEMENTS | FURTHER INFORMATION
10
Segment Services
The segment Services is comprised of IT consulting and development, business consulting and the distribution and marketing
resources, which are utilized Group-wide for several Group Companies. At the end of 2012 products in the area of IT development
reached an appropriate marketability, which is suitable to accelerate the commercialization in 2013.
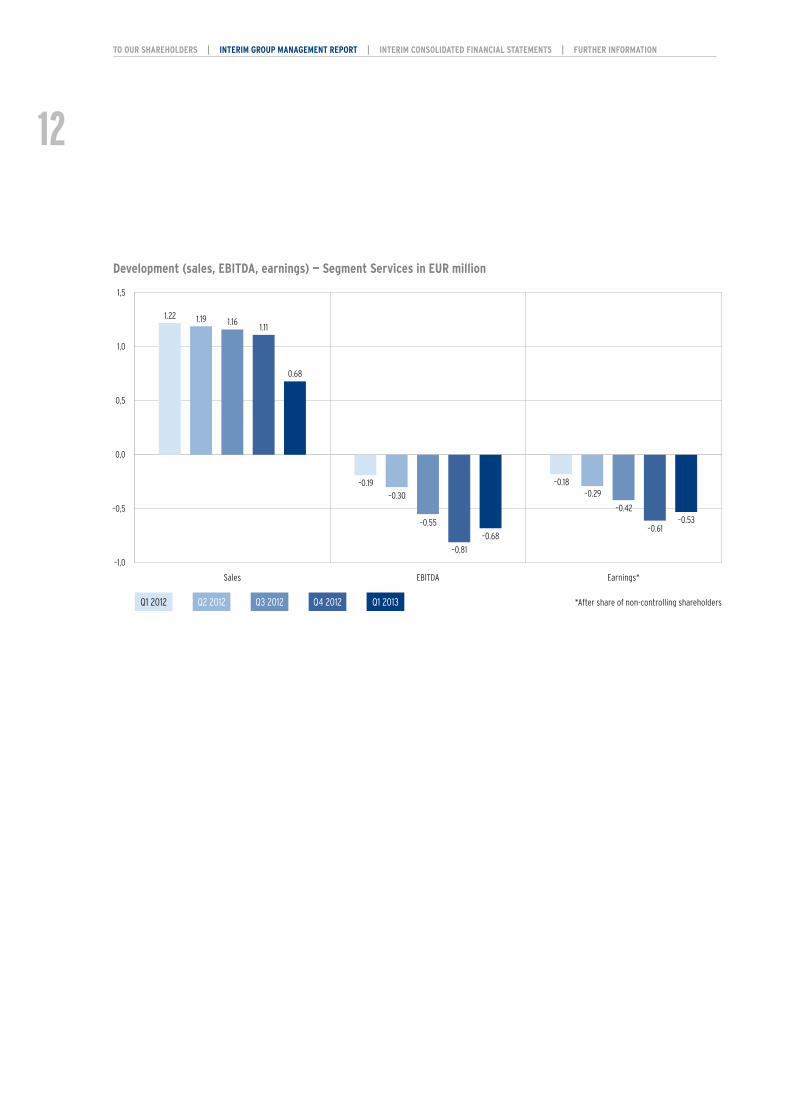
Sales of EUR 0.68 million (previous year : EUR 1.22 million) reported in this segment for the first three months of the business year
2013 were still predominantly generated within the Group. This decrease resulted primarily from the reduction of intra-group
services of this segment.
Especially the IT staff was further strengthened in 2012 to advance the topic of cloud computing. Cloud computing enables the
realization of cost advantages over conventional systems, especially if, for example, the payment is determined by the duration
of use of the service and the service is used only occasionally. This can save a considerable degree of local resources. Increasingly,
this resource efficiency is brought in connection with the sustainable use of ICT systems.
The workforce reduction in particular in the area of internal corporate services compared to the previous quarter led to a decrease
in personnel expenses of EUR 0.12 million from EUR 1.12 million to EUR 1.00 million. The restructuring measures introduced in this
segment at the end of 2012 are only partially reflected in the expenses so far. Other operating expenses increased compared to
the same period last year by EUR 0.14 million to EUR 0.43 million. These expenses comprise also external development and sales
resources.
EBITDA was at EUR –0.68 million (previous year : EUR –0.19 million). In particular, lower sales while still high staff expenses and high
other operating expenses have contributed to this. Earnings were negative with EUR –0.53 million (previous year : EUR –0.18 mil-
lion). Compared to the last quarter of 2012, the impact of cost reductions is already apparent, despite the significantly lower sales.
TO OUR SHAREHOLDERS | INTERIM GROUP MANAGEMENT REPORT | INTERIM CONSOLIDATED FINANCIAL STATEMENTS | FURTHER INFORMATION
11
–1,0
–0,5
0,0
0,5
1,0
1,5
Earnings*EBITDASales
Q1 2012 Q2 2012 Q3 2012 Q4 2012 Q1 2013
–0.18–0.29
–0.42
–0.61–0.53
–0.19–0.30
–0.55
–0.81
–0.68
1.22 1.19 1.161.11
0.68
*After share of non-controlling shareholders
Development (sales, EBITDA, earnings) — Segment Services in EUR million
TO OUR SHAREHOLDERS | INTERIM GROUP MANAGEMENT REPORT | INTERIM CONSOLIDATED FINANCIAL STATEMENTS | FURTHER INFORMATION
12

–2
0
2
4
6
Earnings*EBITDASales
Q1 2012 Q2 2012 Q3 2012 Q4 2012 Q1 2013 *After share of non-controlling shareholders
–0.56–0.88
–0.38
–1.12–0.80–0.69 –0.74
–0.46
–0.87
–0.47
1.88
2.40
4.86
3.74
2.56
Segment Renewable Energies
The segment Renewable Energies comprises almost all activities of 3U in the sector of Renewable Energies, except for the SPP
(Solar Power Plant) project and other internal planning services. The trade with solar system technology thereby consists of
thermal solar plants for solar heat generation, regulation, heat storage and heat distribution as well as photovoltaic systems. The
service portfolio ranges from system solutions for single-family homes up to very large solar plants. Furthermore this segment
includes, among others, the development, production and trade of products for the electrical industry and environmental tech-
nology goods for thermal solar plants and plants for electricity generation from heat.
Even without large-volume trading with PV modules the segment Renewable Energies saw an increase in sales from EUR 1.88 mil-
lion to EUR 2.56 million in the first three quarters of 2013 compared to the previous year.
Gross profit in the segment Renewable Energies is with EUR 0.91 million EUR 0.59 million above the previous year. The increase in
staff expenses and other operating costs led to an EBITDA, which was still EUR 0.22 million higher than in the same period last year.
Higher depreciation on fixed assets and a higher negative financial result (an increase of EUR 0.24 million compared to the pre-
vious year) — both primarily due to the depreciation and the financial needs of the project Adelebsen — have contributed to the
segment Renewable Energies’ earnings for the first three months of 2013 (EUR –0.80 million) being EUR 0.24 million below the level
of the previous year (EUR –0.56 million).
Development (sales, EBITDA, earnings) — Segment Renewable Energies in EUR million
TO OUR SHAREHOLDERS | INTERIM GROUP MANAGEMENT REPORT | INTERIM CONSOLIDATED FINANCIAL STATEMENTS | FURTHER INFORMATION
13

Holding/Consolidation
The Holding activities including activities concerning the Solar Power Plant (SPP) and other planning services as well as the
necessary Group consolidating are pooled in Holding/Consolidation.
Staff resources have been set up in a competence team for the implementation of the SPP project and other internal planning
services. Those will mostly pay off in the medium-term, when this expertise will be applied to SPPs as well as other renewable
energy projects, which are marketed to third parties.
Holding/Consolidation reported sales of EUR –0.78 million (previous year : EUR –1.14 million) in the reported period. These comprise
of the sales of the Holding and sales consolidations. These sales consolidations result mainly from the consolidation of the sales
between the segments as well as from the consolidation of services within the Group.
EBITDA in the first quarter amounts to EUR –1.10 million (previous year : EUR –0.22 million) and is substantially shaped by staff
costs in the amount of EUR 0.80 million (previous year : EUR 0.69 million) and other operating income/expenses in the amount of
EUR 0.35 million (previous year : EUR 0.28 million). Concerning personnel costs it has to be considered that employees from the
finance and law sector as well as from the Competence Centre Renewable Energies are assigned to the parent Company. The
largest percentage within other operating income/expenses refers to legal and consulting costs and the inter-company billing of
services.
Starting from EBITDA higher depreciation and a lower financial result have contributed to the negative earnings effect that could
not be offset by lower tax expenses.
TO OUR SHAREHOLDERS | INTERIM GROUP MANAGEMENT REPORT | INTERIM CONSOLIDATED FINANCIAL STATEMENTS | FURTHER INFORMATION
14

–2,5
–2,0
–1,5
–1,0
–0,5
0,0
0,5
Earnings*EBITDASales
Q1 2012 Q2 2012 Q3 2012 Q4 2012 Q1 2013
–0.12
–2.20 –2.19
–0.49
–0.97
–0.22
–1.68
–2.18
–1.28
–1.10–1.14 –1.12 –1.16
–0.81 –0.78
*Group earnings Holding/Consolidation before profit transfer
Development (sales, EBITDA, earnings) — Holding/Consolidation in EUR million
TO OUR SHAREHOLDERS | INTERIM GROUP MANAGEMENT REPORT | INTERIM CONSOLIDATED FINANCIAL STATEMENTS | FURTHER INFORMATION
15

0
10
20
30
40
50
60
70
80
90
December 31, 2008 December 31, 2009 December 31, 2010 December 31, 2011 December 31, 2012 March 31, 2013
44.8947.75
51.67
82.49 82.41 81.57
Assets and financial position
The financial position of 3U HOLDING AG changed significantly in fiscal year 2012 due to the high investments and the loss of the
year. In the first quarter of 2013f, the Group has invested a total of EUR 0.29 million (previous year : EUR 9.68 million) in long-term
assets.
3U HOLDING AG invests its financial portfolio exclusively in call accounts and short-term time deposits.
Compared to December 31, 2012 cash and cash equivalents decreased by EUR 2.23 million from EUR 6.75 million to EUR 4.52.
3U HOLDING AG continues to post a very solid equity ratio. Due to the decline in total assets, the equity ratio of 81.57 % is only
slightly lower than at December 31, 2012 (82.41 %). The debt portion is only 18.43 % compared with 17.59 % for the same period last
year.
The decrease in equity is a result of the net loss of the first quarter 2013 in the amount of EUR –2.0 million (including the loss
attributable to the non-controlling shareholders).
Development in the equity ratio (in %)
TO OUR SHAREHOLDERS | INTERIM GROUP MANAGEMENT REPORT | INTERIM CONSOLIDATED FINANCIAL STATEMENTS | FURTHER INFORMATION
16

Overview balance sheet items March 31, 2013 December 31, 2012
TEUR % TEUR %
Long-term assets 43,246 72.4 43,438 70.6
Fixed assets 42,267 70.8 42,473 69.0
Deferred tax assets 637 1.1 599 1.0
Other non-current assets 342 0.5 366 0.6
Current assets 16,493 27.6 18,122 29.4
Inventories 2,301 3.9 2,000 3.2
Trade receivables 5,913 9.9 6,255 10.2
Other current assets 3,764 6.3 3,121 5.1
Cash and cash equivalents 4,515 7.5 6,746 10.9
Assets 59,739 100.0 61,560 100.0
Long-term liabilities 52,649 88.2 54,408 88.4
Equity attributable to 3U HOLDING AG shareholders 49,649 83.1 52,795 85.8
Interests of non-controlling shareholders –918 –1.5 –2,065 –3.4
Provisions and liabilities 3,918 6.6 3,678 6.0
Current liabilities 7,090 11.8 7,152 11.6
Trade payables 1,586 2.6 3,201 5.2
Other provisions and liabilities 5,504 9.2 3,951 6.4
Liabilities 59,739 100.0 61,560 100.0
The balance sheet total as at March 31, 2013 amounted to EUR 59.74 million (December 31, 2012 : EUR 61.56 million) and decreased
therefore by EUR 1.82 compared to change of fiscal year. The reasons for the changes compared to December 31, 2012 relate pri-
marily to the decline in cash and cash equivalents due to the loss in the first quarter of the business year 2013.
TO OUR SHAREHOLDERS | INTERIM GROUP MANAGEMENT REPORT | INTERIM CONSOLIDATED FINANCIAL STATEMENTS | FURTHER INFORMATION
17

Fixed assets in the amount of EUR 42.27 million (December 31, 2012 : EUR 42.47 million) comprises in addition to intangible assets
(EUR 0.95 million resp. EUR 0.84 million as at December 31, 2012), fixed assets (EUR 29.51 million resp. EUR 29.66 million as at
December 31, 2012) and financial assets (EUR 6.72 million resp. EUR 6.86 million as at December 31, 2012) also investment proper-
ties in the amount of EUR 5.10 million (December 31, 2012 : EUR 5.11 million). These relate to the parts of the properties to be rented
out in Adelebsen and Montabaur. Financial assets consist of EUR 6.26 million (December 31, 2012 : EUR 6.26 million) from a loan
granted to the former Subsidiary LambdaNet, which is to be repaid in annual instalments.
Further, within the non-current assets deferred taxes in particular increased by deferred taxes on tax losses carried forward. As
at March 31, 2013 current assets are approximately EUR 1.63 million less than at December 31, 2012. Another essential component
of current assets besides the liquid assets are receivables from goods and services, which decreased to 5.91 million (December 31,
2012 : EUR 6.27 million)
On the liabilities side, next to the reduction in equity due to the loss of the first quarter of fiscal year 2013, the liabilities from trade
accounts payable decreased to EUR 1.59 million (December 31, 2012 : EUR 3.20 million ).
Long-term financial liabilities increased by the addition of a loan to finance the site in Linz to EUR 3.66 million (December 31, 2012:
EUR 3.20 million).
Operating cash flow in the past quarter was EUR –2.26 million (previous year : EUR –2.89 million). The main reason for this is the
negative result for the period. Cash flow from investing activities is influenced by the costs of investment in tangible fixed assets.
Cash flow from investing activities amounted to EUR –0.21 million (previous year : EUR –9.62 million) and is EUR 9.41 million lower
than in the previous year. In the same period the previous year, investments in tangible fixed assets were dominated by the invest-
ments in the solar park Adelebsen.
Cash flow from financing activities is slightly positive with EUR 0.24 million (previous year : EUR –0.03 million). It results primarily
from the proceeds from the loan taken for the property at the site in Linz.
The 3U Group was in a position to meet its payment obligations at all times. The liquidity situation is however not as comfortable
at March 31, 2013 as it used to be. On February 28, 2013 a framework credit agreement to finance the PV project in Adelebsen was
signed. From that the Group will accrue up to EUR 14.0 million. This will improve the liquidity position of the Group significantly.
Up to 31 March 2013 these funds have not been called yet.
TO OUR SHAREHOLDERS | INTERIM GROUP MANAGEMENT REPORT | INTERIM CONSOLIDATED FINANCIAL STATEMENTS | FURTHER INFORMATION
18
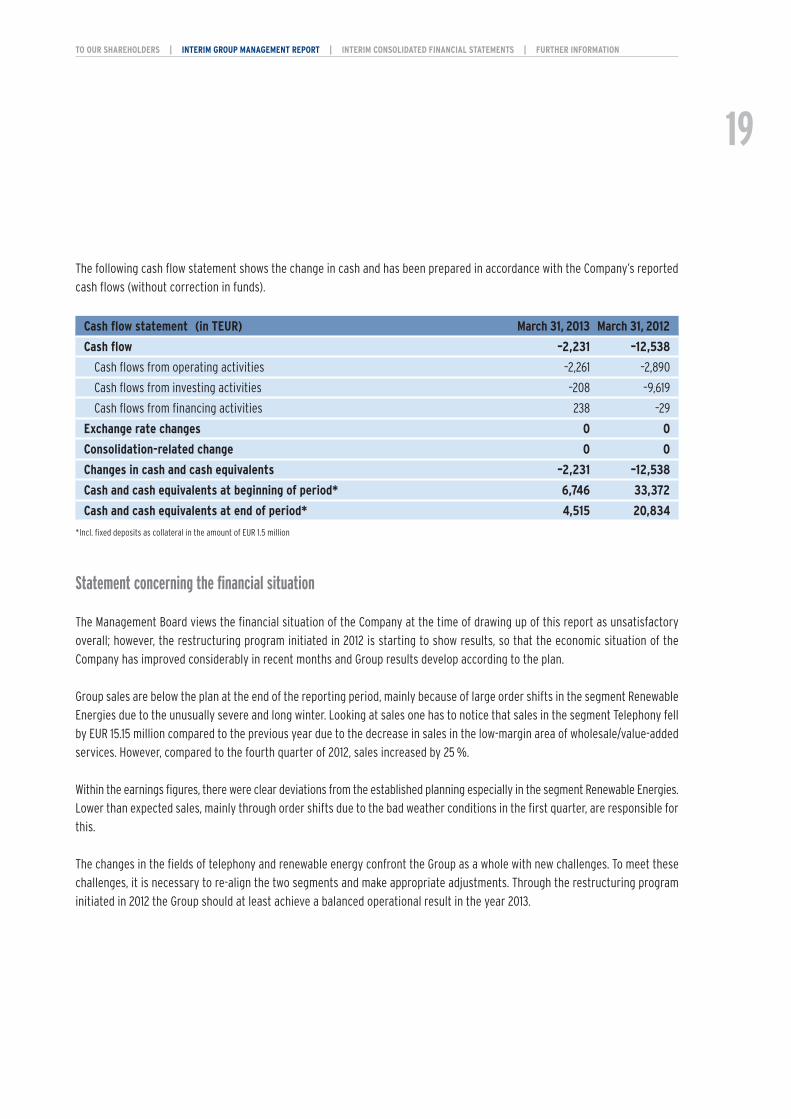
The following cash flow statement shows the change in cash and has been prepared in accordance with the Company’s reported
cash flows (without correction in funds).
Cash flow statement (in TEUR) March 31, 2013 March 31, 2012
Cash flow –2,231 –12,538
Cash flows from operating activities –2,261 –2,890
Cash flows from investing activities –208 –9,619
Cash flows from financing activities 238 –29
Exchange rate changes 0 0
Consolidation-related change 0 0
Changes in cash and cash equivalents –2,231 –12,538
Cash and cash equivalents at beginning of period* 6,746 33,372
Cash and cash equivalents at end of period* 4,515 20,834
*Incl. fixed deposits as collateral in the amount of EUR 1.5 million
Statement concerning the financial situation
The Management Board views the financial situation of the Company at the time of drawing up of this report as unsatisfactory
overall; however, the restructuring program initiated in 2012 is starting to show results, so that the economic situation of the
Company has improved considerably in recent months and Group results develop according to the plan.
Group sales are below the plan at the end of the reporting period, mainly because of large order shifts in the segment Renewable
Energies due to the unusually severe and long winter. Looking at sales one has to notice that sales in the segment Telephony fell
by EUR 15.15 million compared to the previous year due to the decrease in sales in the low-margin area of wholesale/value-added
services. However, compared to the fourth quarter of 2012, sales increased by 25 %.
Within the earnings figures, there were clear deviations from the established planning especially in the segment Renewable Energies.
Lower than expected sales, mainly through order shifts due to the bad weather conditions in the first quarter, are responsible for
this.
The changes in the fields of telephony and renewable energy confront the Group as a whole with new challenges. To meet these
challenges, it is necessary to re-align the two segments and make appropriate adjustments. Through the restructuring program
initiated in 2012 the Group should at least achieve a balanced operational result in the year 2013.
TO OUR SHAREHOLDERS | INTERIM GROUP MANAGEMENT REPORT | INTERIM CONSOLIDATED FINANCIAL STATEMENTS | FURTHER INFORMATION
19

0
2
4
6
8
10
12
2013*2012201120102009
Services Renewable Energies Holding/ConsolidationTelephony
0.07 0.110.270.000.13
10.289.39
0.340.07
7.95
2.51
0.130.17 0.50
3.40
0.040.16 0.00
2.07
0.29
*Until March 31, 2013
Investments/Divestments
Investments of EUR 0.29 million (previous year : EUR 9.68 million) in intangible assets, property and equipment were made within
the Group during the first quarter 2013.
EUR 0.02 million were invested in the segment Telephony (previous year : EUR 0.02 million). The investments in the segments
Services and Renewable Energies add up to EUR 0.00 million resp. EUR 0.08 million after EUR 0.08 million resp. EUR 4.12 million in
the responding time period of 2012. Investments in tangible assets of the Holding amounted to EUR 0.18 in the first quarter 2013
(previous year : EUR 5.46 million).
Investments of roughly EUR 3.83 million in the existing business segments are planned for the financial year 2013. Of these,
EUR 1.06 million will be invested in the segment Telephony, EUR 1.57 million in the segment Services, EUR 0.32 million in the seg-
ment Renewable Energies and EUR 0.88 million in the holding company.
Development of investments in EUR million
Non-financial performance indicators
It is above all the men and women that work for 3U HOLDING AG and its portfolio companies that are responsible for business
success. Their identification with the 3U Group and commitment to its goals is therefore a top priority.
TO OUR SHAREHOLDERS | INTERIM GROUP MANAGEMENT REPORT | INTERIM CONSOLIDATED FINANCIAL STATEMENTS | FURTHER INFORMATION
20
0
20
40
60
80
100
120
140
160
180
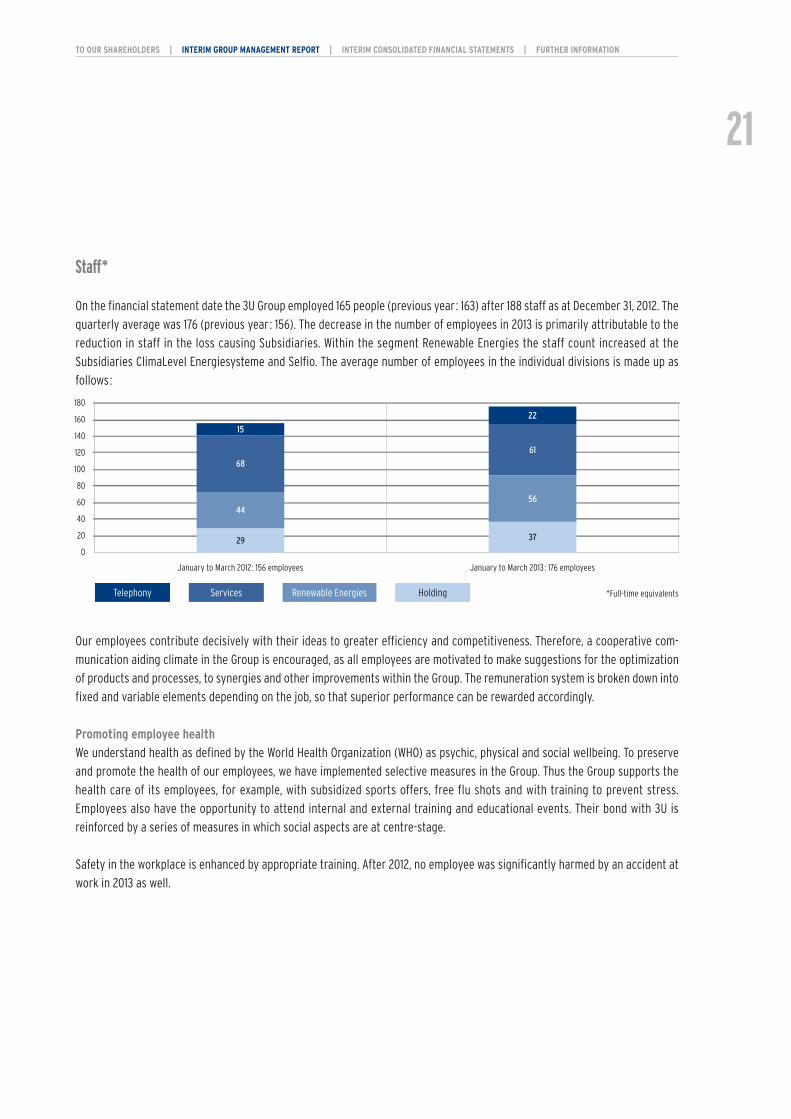
January to March 2013: 176 employeesJanuary to March 2012: 156 employees
Services Renewable Energies HoldingTelephony
37
56
61
22
29
44
68
15
*Full-time equivalents
Staff*
On the financial statement date the 3U Group employed 165 people (previous year : 163) after 188 staff as at December 31, 2012. The
quarterly average was 176 (previous year : 156). The decrease in the number of employees in 2013 is primarily attributable to the
reduction in staff in the loss causing Subsidiaries. Within the segment Renewable Energies the staff count increased at the
Subsidiaries ClimaLevel Energiesysteme and Selfio. The average number of employees in the individual divisions is made up as
follows :
Our employees contribute decisively with their ideas to greater efficiency and competitiveness. Therefore, a cooperative com-
munication aiding climate in the Group is encouraged, as all employees are motivated to make suggestions for the optimization
of products and processes, to synergies and other improvements within the Group. The remuneration system is broken down into
fixed and variable elements depending on the job, so that superior performance can be rewarded accordingly.
Promoting employee health
We understand health as defined by the World Health Organization (WHO) as psychic, physical and social wellbeing. To preserve
and promote the health of our employees, we have implemented selective measures in the Group. Thus the Group supports the
health care of its employees, for example, with subsidized sports offers, free flu shots and with training to prevent stress.
Employees also have the opportunity to attend internal and external training and educational events. Their bond with 3U is
reinforced by a series of measures in which social aspects are at centre-stage.
Safety in the workplace is enhanced by appropriate training. After 2012, no employee was significantly harmed by an accident at
work in 2013 as well.
TO OUR SHAREHOLDERS | INTERIM GROUP MANAGEMENT REPORT | INTERIM CONSOLIDATED FINANCIAL STATEMENTS | FURTHER INFORMATION
21

Detailed information on stock option plan
By way of resolution dated August 19, 2010, the Annual General Meeting authorised contingent capital of up to EUR 4,684,224.00
for issuing stock options to members of the Management Board, executives and employees in the context of a stock option plan
and authorised the Management Board accordingly. With the approval of the Supervisory Board, the Management Board made use
of this authorisation on February 7, 2011 and established a stock option plan for 2011.
Stock option plan 2011
The stock option plan (SOP) 2011 has the following key details :
The following are beneficiaries :
Group 1 : Members of the Company’s Management Board
Group 2 : Employees of the Company and affiliated companies in Germany and abroad in key positions at the first level of man-
agement below the Management Board as well as members of the management of affiliated companies in Germany
and abroad (Article 15 of the German Stock Corporation Act)
Group 3 : All other employees of the Company and of the affiliated companies in Germany and abroad (Article 15 of the German
Stock Corporation Act)
A total of 4,602,500 stock options were issued within the scope of the SOP 2011. The distribution between the individual groups is
as follows (the value in parentheses indicates the maximum number of shares to possibly be issued) :
Group 1 : 400,000 (of 468,422) stock options
Group 2 : 2,800,000 (of 2,810,535) stock options
Group 3 : 1,402,500 (of 1,405,267) stock options
Total : 4,602,500 (of 4,684,224) stock options
The SOP 2011 has a term of five years. The non-transferable option rights can be exercised after a four-year qualifying period on
February 7, 2015 at the earliest and no later than February 6, 2016. The option rights may only be exercised within a period of fif-
teen banking days in Frankfurt am Main following the publication of the annual financial statements and/or consolidated finan-
cial statements, the Annual General Meeting or the publication of a quarterly report and/or the annual report. The options are not
transferable. Each option right authorizes the purchase of a share in the company at the exercise price. The exercise price for the
options is EUR 1.00 per share. At the time of inception of the SOP on February 7, 2011 the share was quoted at EUR 0.66, the pre-
mium thus amounted to 51.5 %. The beneficiary may only sell shares received through the exercise of stock options within a
month of the publication of the quarterly reports or after the publication of periodical reporting.
Of the 4,602,500 options issued in the framework of the SOP 1,037,500 options were forfeited at the balance sheet date.
Forfeited are in:
• 2011 : 582,500 stock options
• 2012: 365,000 stock options
• 2013: 90,000 stock options (until March 31, 2013)
TO OUR SHAREHOLDERS | INTERIM GROUP MANAGEMENT REPORT | INTERIM CONSOLIDATED FINANCIAL STATEMENTS | FURTHER INFORMATION
22

Related parties report
There were no extraordinary changes or developments in business relations with related parties in the first three months of the
current financial year as against December 31, 2012. Please refer to our presentation in the Annual Report 2012. All transactions
with related parties were conducted on normal market conditions.
Report on risks and opportunities
As of March 31, 2013 there were no material changes in risks and their assessment as reported in detail in the Annual Report 2012.
Significant events since the end of the interim reporting period
The Management Board of 3U HOLDING AG has decided on the basis of the authorisation granted by the annual general meeting
of May 31, 2012 to repurchase up to 10 % of its own shares (up to 3,531,401 shares) on the stock exchange during the period from
May 1, 2013 until not later than May 30, 2017. During the time span of the share buyback program, the Management Board reserves
the right to suspend and resume the share buyback at any time, in accordance with the legal requirements to be observed.
There have been no other significant events since the end of the interim reporting period.
TO OUR SHAREHOLDERS | INTERIM GROUP MANAGEMENT REPORT | INTERIM CONSOLIDATED FINANCIAL STATEMENTS | FURTHER INFORMATION
23

Outlook
Economic outlook
In spring 2013 the world economy revived somewhat. The expectations of companies and consumers have improved since autumn
and both industrial production and world trade have picked up in recent months. This is due in no small measure to the percep-
tion that there is a lower risk of the Euro area breaking up after ECB intervention. The banking and financial crisis in Cyprus does
not seem to have fundamentally changed this perception. The conditions in the financial markets have improved significantly since
last autumn. Tensions in the Euro area, which mounted in the first six months of 2012 after a renewed intensification of the
government debt crisis, eased considerably. Share prices in the advanced economies have risen sharply since mid-2012 and
recently hit long-term highs in several countries.
The institutes making up the Projektgruppe Gemeinschaftsdiagnose expect the world economy to pick up somewhat this year and
in 2014. The economy should revive slowly in the Euro area too. The rise in world output looks set to increase by around 2.5 % in
2013 and 3 % in 2014, under the assumption that the crisis in the Euro area does not intensify again. There are no guarantees, how-
ever, that re-forms will be rigorously and successfully implemented in the crisis-afflicted countries. Should there be a noticeable
slowdown, or even a failure in the structural adjustment processes in the crisis states of the Euro area, a clear fall in confidence
could result that would heavily burden the economy.
An upwards trend re-emerged in the German economy in spring 2013. The business climate among German companies has improved
significantly since last autumn. This is not least due to the fact that the situation in the financial markets has eased due to sub-
siding uncertainty regarding the future of European Monetary Union. The headwind in the world economy has also died down, with
signals of a slight acceleration in growth outside the Euro area.
The leading economic institutes in Germany expect the economy to pick up over the course of this year. Moreover, concerns
related to elections in Italy and the banking crisis in Cyprus show that a risk of the crisis intensifying remains, although it is not
as great as last year.
However, annual average gross domestic product will only increase by 0.8 %. Employment will increase and the number of unem-
ployed will total just 2.9 million on annual average. The upsurge in prices subsided recently, with a fall in the price of crude oil
products. This is one reason why the inflation rate of 1.7 % should be somewhat lower than in 2012.
In 2014 the economy should pick up slightly. Overall, gross domestic product in 2014 is forecast to grow by 1.9 %. The number of
unemployed should decrease significantly to an annual average of 2.7 million persons. With the rise in capacity utilization, the infla-
tion rate should increase to 2.0 %.
TO OUR SHAREHOLDERS | INTERIM GROUP MANAGEMENT REPORT | INTERIM CONSOLIDATED FINANCIAL STATEMENTS | FURTHER INFORMATION
24
Outlook Telephony
In its ICT Market Report 2013, EITO (European Information Technology Observatory) forecasts that worldwide expenditure for IT and
telecommunications will increase by 5.1 % in 2013. The fastest growing countries include India, Brazil, China and the United States.
Considerably slower growth of 0.9 % is anticipated for the ICT markets in Europe; for Germany, the overall ICT market is expected
to grow by 1.6 %.
Since 2005 the sales in the total market of telecommunications services in Germany have been declining. This development is based
on strong sales decreases in the land-line sector and moderate decreases in the market of mobile telephony. Thus a displacement
market prevails in the telecommunications industry, which is shaped by innovations and technical progress, but above all is
characterised by a further price decline due also to the pronounced competitive situation. Regulatory decisions also contribute
to a significant degree to price erosion. Thus, the Federal Network Agency with effect from December 1, 2012, provisionally reduced
the transmission and termination rates in fixed lines by 20–40 % and the termination charges in mobile communications by
45–47 %. The strong fluctuations of the call-by-call market make a medium-term market forecast difficult. As in previous years,
the market is likely to shrink, even if this process may slow down. The relevant market went down by around 14 % in 2012, while
in previous years it shrank by 20–30 %.
Against this background, the Management Board expects a positive contribution of the segment Telephony both in 2013 and in 2014.
An even greater reduction in termination charges, which is currently being asked for by the European Commission from the Federal
Network Agency could adversely affect sales and earnings of the business unit. The 3U Group will continue to pursue its strategy
to recognise and occupy profitable niches in the segment Telephony.
Outlook Services
Especially with the topic cloud computing and IT and business consulting external customers are addressed. In cloud computing,
IT services are provided in the right quantities and flexible in real-time as a service via the Internet and billed according to use.
In cloud computing various technical improvements and innovations converge and create the potential for a base innovation in
the business field. Cost reduction, cost structure changes, cost variability, flexibility and entirely new business models are other
important arguments. It is expected that cloud computing will change the entire information economy, its technologies and its
business and therefore the relationship between suppliers and consumers for the long term. With a rapid adoption of cloud com-
puting in business, the demand for technical infrastructure expertise decreases. For software vendors the traditional licensing busi-
ness will shift in the direction of “software as a service”.
Market experts attest good growth prospects for the respective 3U service offers such as IT services, cloud computing, consult-
ing services and marketing and distribution support. The market acceptance of products of the segment Services is growing.
Among others a bank was won as a customer for system administration/IT security services with a six-figure contract value.
The Management Board of 3U HOLDING AG expects strong growing external sales from 2013 on, however, a positive contribution
of this segment only from 2014.
TO OUR SHAREHOLDERS | INTERIM GROUP MANAGEMENT REPORT | INTERIM CONSOLIDATED FINANCIAL STATEMENTS | FURTHER INFORMATION
25

Outlook Renewable Energies
The importance of renewable energies as an economic factor is increasing not only in Germany, but also globally. With the Renew-
able Energy segment, the Group participates in the progressive change in energy sustainability and the trend towards resource-
saving and thus improving energy efficiency. In the future, the Group will be more broadly positioned in this field and will expand
its product and service portfolio continuously. In addition to expanding the businesses already active in the market an increase
of the planning and project development activities appears promising. Pleasing is the current development of the activities around
the subject of heating, cooling and ventilation of buildings. In addition, other renewable energy projects are to be realized. Here,
both solar power plants and wind power projects play an important role. While we soon leave the research and development
phase at the SPP and enter into the active marketing phase, our available planning resources are also engaged in identifying
promising wind power projects. Suitable projects have a very good reward profile.
Overall, the Management Board expects a strong growth of this segment and a positive result for 2013. For 2014, this segment will
continue to grow and provide a correspondingly larger positive contribution to earnings.
Strategic direction
Lasting operative profitability in the segments is the top priority for the Group. Due to the unsatisfactory business development
in 2012 a number of measures had to be implemented to counteract this development in the fourth quarter of 2012 and the first
quarter of 2013. For this, among others, especially the sales and marketing resources for Telephony and Renewable Energies were
reduced in the segment Services. It also came to staff reductions in the segment Renewable Energies in the field services and con-
sultancy. The aim of these measures is a significant cost reduction and a focus on higher-margin sales.
While the segment Telephony will continue to shrink, the segments Services and Renewable Energies are expanded. In addition
to expanding the business through organic growth the comfortable level of capital and the associated good credit rating allows
the Group also inorganic growth especially in the segment Renewable Energies. The 3U Group pursues a strategy to retain success -
ful businesses in the long term, but also to sell them if attractive offers arise.
Outlook 3U Group
The 3U Group has launched a series of measures in the first quarter of 2013 that have resulted in the Group being better positioned
at the end of the first quarter 2013 to meet the challenges of the current financial year. For this purpose it was necessary to
separate from loss-making activities and in some instances in staff. With the already implemented resp. planned activities a turn-
around in earnings should be reached in the financial year 2013.
The forecast quality is subject to the influence of the very dynamic development of each business field. On top of that, the full or
partial sale of Subsidiaries belongs to the corporate purpose of 3U HOLDING AG as holding company. Hence, net earnings from this
can hardly be planned and are therefore excluded from the following forecast.
TO OUR SHAREHOLDERS | INTERIM GROUP MANAGEMENT REPORT | INTERIM CONSOLIDATED FINANCIAL STATEMENTS | FURTHER INFORMATION
26

That said the Management Board of 3U HOLDING AG expects Group sales of about EUR 45 million to 50 million, EBITDA of EUR –1 mil-
lion to 1 million and earnings of about EUR –3,0 million to –1,0 million in 2013.
For 2014, the Management Board anticipates sales of between EUR 50 million and 55 million, EBITDA between EUR 2 million and
5 million and earnings of between EUR 0 million to 2 million.
The goal of all activities is to sustainably enhance the value of the 3U Group for the shareholders, but also for our employees. The
success of those efforts will be reflected in a positive price trend for the 3U share.
With regard to the estimates and expectations presented, we point out that the actual future events can differ significantly from
our expectations concerning the probable development.
Marburg, May 2013
The Management Board
Michael Schmidt Christoph Hellrung Andreas Odenbreit
TO OUR SHAREHOLDERS | INTERIM GROUP MANAGEMENT REPORT | INTERIM CONSOLIDATED FINANCIAL STATEMENTS | FURTHER INFORMATION
27

Balance sheet as of March 31, 2013
Assets March 31, December 31, 3U Group (in TEUR) 2013 2012
Long-term assets 43,246 43,438
Intangible assets 946 842
Property, plant and equipment 29,506 29,662
Investment properties 5,100 5,109
Financial assets 6,256 6,256
Accounted investments using the equity method 459 604
Deferred tax assets 637 599
Other long-term assets 342 366
Current assets 16,493 18,122
Inventories 2,301 2,000
Trade receivables 5,913 6,255
Other current assets 3,764 3,121
Cash and cash equivalents 4,515 6,746
Total assets 59,739 61,560
TO OUR SHAREHOLDERS | INTERIM GROUP MANAGEMENT REPORT | INTERIM CONSOLIDATED FINANCIAL STATEMENTS | FURTHER INFORMATION
28
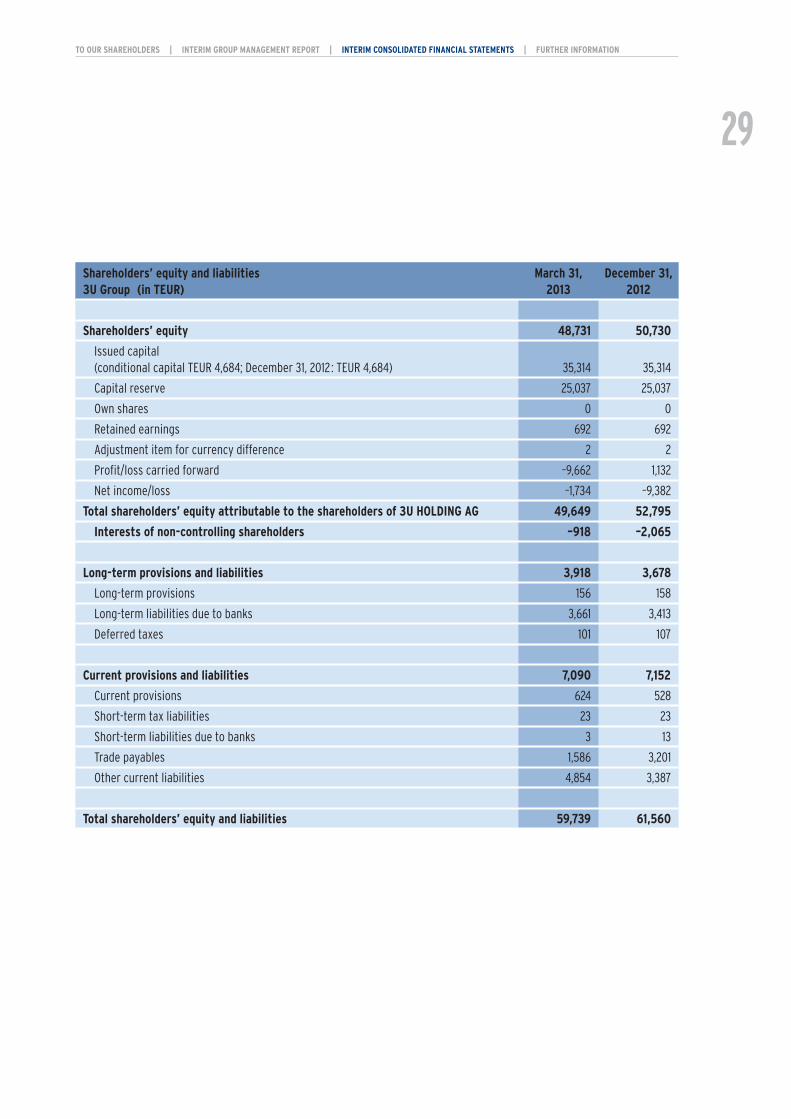
Shareholders’ equity and liabilities March 31, December 31, 3U Group (in TEUR) 2013 2012
Shareholders’ equity 48,731 50,730
Issued capital (conditional capital TEUR 4,684; December 31, 2012: TEUR 4,684) 35,314 35,314
Capital reserve 25,037 25,037
Own shares 0 0
Retained earnings 692 692
Adjustment item for currency difference 2 2
Profit/loss carried forward –9,662 1,132
Net income/loss –1,734 –9,382
Total shareholders’ equity attributable to the shareholders of 3U HOLDING AG 49,649 52,795
Interests of non-controlling shareholders –918 –2,065
Long-term provisions and liabilities 3,918 3,678
Long-term provisions 156 158
Long-term liabilities due to banks 3,661 3,413
Deferred taxes 101 107
Current provisions and liabilities 7,090 7,152
Current provisions 624 528
Short-term tax liabilities 23 23
Short-term liabilities due to banks 3 13
Trade payables 1,586 3,201
Other current liabilities 4,854 3,387
Total shareholders’ equity and liabilities 59,739 61,560
TO OUR SHAREHOLDERS | INTERIM GROUP MANAGEMENT REPORT | INTERIM CONSOLIDATED FINANCIAL STATEMENTS | FURTHER INFORMATION
29

Income statement
3U Group (in TEUR) 3-months reportJanuary 1– March 312013 2012
Sales 8,540 23,199
Other earnings 398 1,363
Changes in products and production work in progress –32 58
Other capitalised services 0 0
Costs of materials –6,128 –21,329
Gross profit or loss 2,778 3,291
Staff costs –2,885 –2,733
Other operating expenses –1,507 –1,449
EBITDA –1,614 –891
Depreciation and amortisation –453 –217
EBIT –2,067 –1,108
Income shares in companies that are accounted for using the equity method 34 50
Other financial result 9 110
EBT –2,024 –948
Income tax expense 24 –71
Earnings before non-controlling shareholder interests –2,000 –1,019
Net income/loss for the period –2,000 –1,019
Of which attributable to minority non-controlling shareholders –266 –241
Thereof Group earnings –1,734 –778
TO OUR SHAREHOLDERS | INTERIM GROUP MANAGEMENT REPORT | INTERIM CONSOLIDATED FINANCIAL STATEMENTS | FURTHER INFORMATION
30
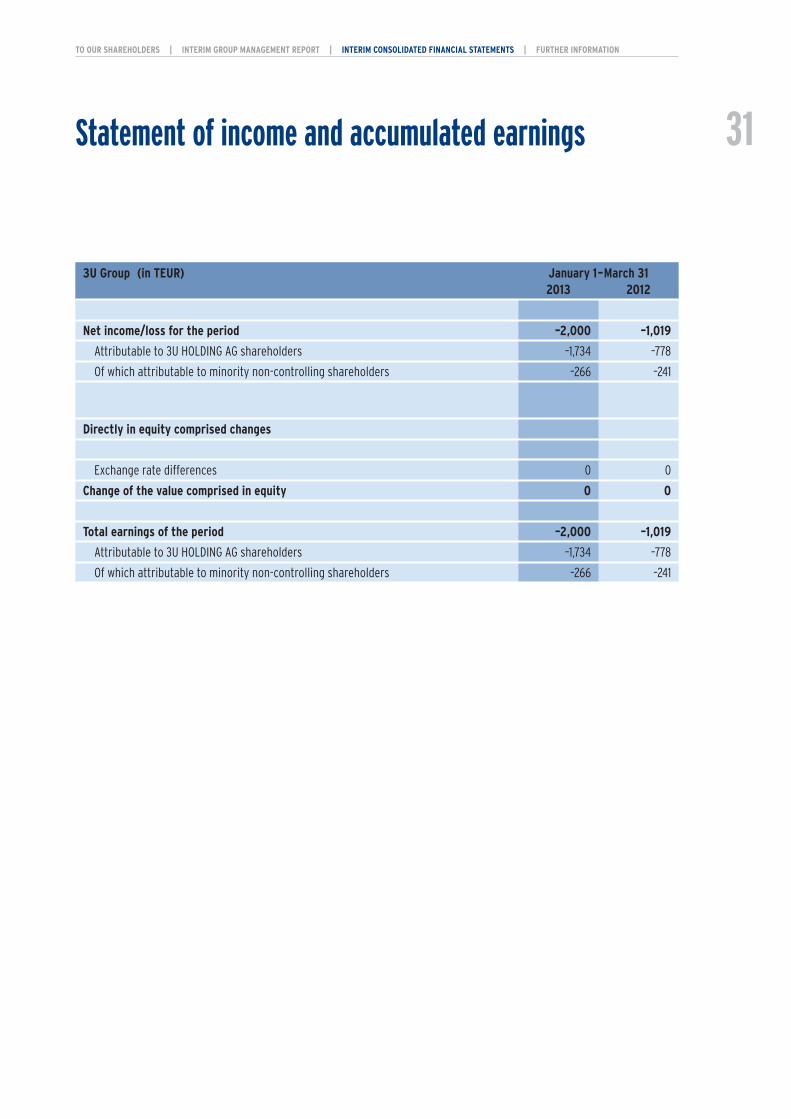
Statement of income and accumulated earnings
3U Group (in TEUR) January 1– March 312013 2012
Net income/loss for the period –2,000 –1,019
Attributable to 3U HOLDING AG shareholders –1,734 –778
Of which attributable to minority non-controlling shareholders –266 –241
Directly in equity comprised changes
Exchange rate differences 0 0
Change of the value comprised in equity 0 0
Total earnings of the period –2,000 –1,019
Attributable to 3U HOLDING AG shareholders –1,734 –778
Of which attributable to minority non-controlling shareholders –266 –241
TO OUR SHAREHOLDERS | INTERIM GROUP MANAGEMENT REPORT | INTERIM CONSOLIDATED FINANCIAL STATEMENTS | FURTHER INFORMATION
31

Statement of changes in equity
3U Group (in TEUR) Issued Capital Own Retained Reserve forcapital reserve shares earnings currency
differences
As of January 1, 2013 35,314 25,037 0 692 2
Rebooking Earnings 2012 0 0 0 0 0
Total earnings 0 0 0 0 0
Alteration basis of consolidation 0 0 0 0 0
As of March 31, 2013 35,314 25,037 0 692 2
3U Group (in TEUR) Issued Capital Own Retained Reserve forcapital reserve shares earnings currency
differences
As of January 1, 2012 39,238 24,269 –3,301 692 1
Rebooking Earnings 2011 0 0 0 0 0
Capital reduction of 3,923,770 shares –3,924 623 3,301 0 0
Dividend payment for financial year 2011 0 0 0 0 0
Stock option plan 2011 0 145 0 0 0
Total earnings 0 0 0 0 1
Alteration basis of consolidation 0 0 0 0 0
As of December 31, 2012 35,314 25,037 0 692 2
TO OUR SHAREHOLDERS | INTERIM GROUP MANAGEMENT REPORT | INTERIM CONSOLIDATED FINANCIAL STATEMENTS | FURTHER INFORMATION
32

Profit/loss Net income/loss Equity Interests of Totalcarried attributable to attributable to non-controlling shareholders’forward 3U HOLDING AG 3U HOLDING AG shareholders equity
shareholders shareholders
1,132 –9,382 52,795 –2,065 50,730
–9,382 9,382 0 0 0
0 –1,734 –1,734 –266 –2,000
–1,413 0 –1,413 1,413 0
–9,662 –1,734 49,649 –918 48,731
Profit/loss Net income/loss Equity Interests of Totalcarried attributable to attributable to non-controlling shareholders’forward 3U HOLDING AG 3U HOLDING AG shareholders equity
shareholders shareholders
–24,452 26,644 63,091 –826 62,265
26,644 –26,644 0 0 0
0 0 0 0 0
–1,059 0 –1,059 0 –1,059
0 0 145 0 145
0 –9,382 –9,381 –1,248 –10,629
–1 0 –1 9 8
1,132 –9,382 52,795 –2,065 50,730
TO OUR SHAREHOLDERS | INTERIM GROUP MANAGEMENT REPORT | INTERIM CONSOLIDATED FINANCIAL STATEMENTS | FURTHER INFORMATION
33

Cash flow statement
3U Group (in TEUR) January 1– March 312013 2012
Net income/loss for the period –2,000 –1,019
+/– Depreciation/write-ups of fixed assets 453 217
+/– Increase/decrease of provisions 94 –48
–/+ Profit/loss on disposal of long-term assets –4 0
–/+ Increase/decrease in inventories and trade receivables 41 –11,329
+/– Increase/decrease in trade payables –1,615 12,016
+/– Changes to other receivables –619 –905
+/– Changes to other payables 1,467 –1,742
+/– Change in tax assets/liabilities including deferred taxes –44 –60
+/– Other non-cash changes –34 –20
Cash flows from operating activities* –2,261 –2,890
+ Inflows from disposals of property, plant and equipment 131 0
– Outflows for investments in property, plant and equipment –275 –6,007
+ Inflows from disposals of intangible assets 0 0
– Outflows for investments in intangible assets –14 –2
– Outflows for investments properties 0 –3,545
+ Payments from earnings of associated companies 0 0
– Outflows from additions to financial assets 0 –121
+ Inflows from disposal of financial assets 0 0
–/+ Cash outflow/inflow from the purchase of consolidated companies and other business units –78 56
+ Cash inflow from acquisition of Subsidiaries 28 0
Cash flows from investing activities* –208 –9,619
Sum carried forward –2,469 –12,509
*Refer to followowing page
TO OUR SHAREHOLDERS | INTERIM GROUP MANAGEMENT REPORT | INTERIM CONSOLIDATED FINANCIAL STATEMENTS | FURTHER INFORMATION
34
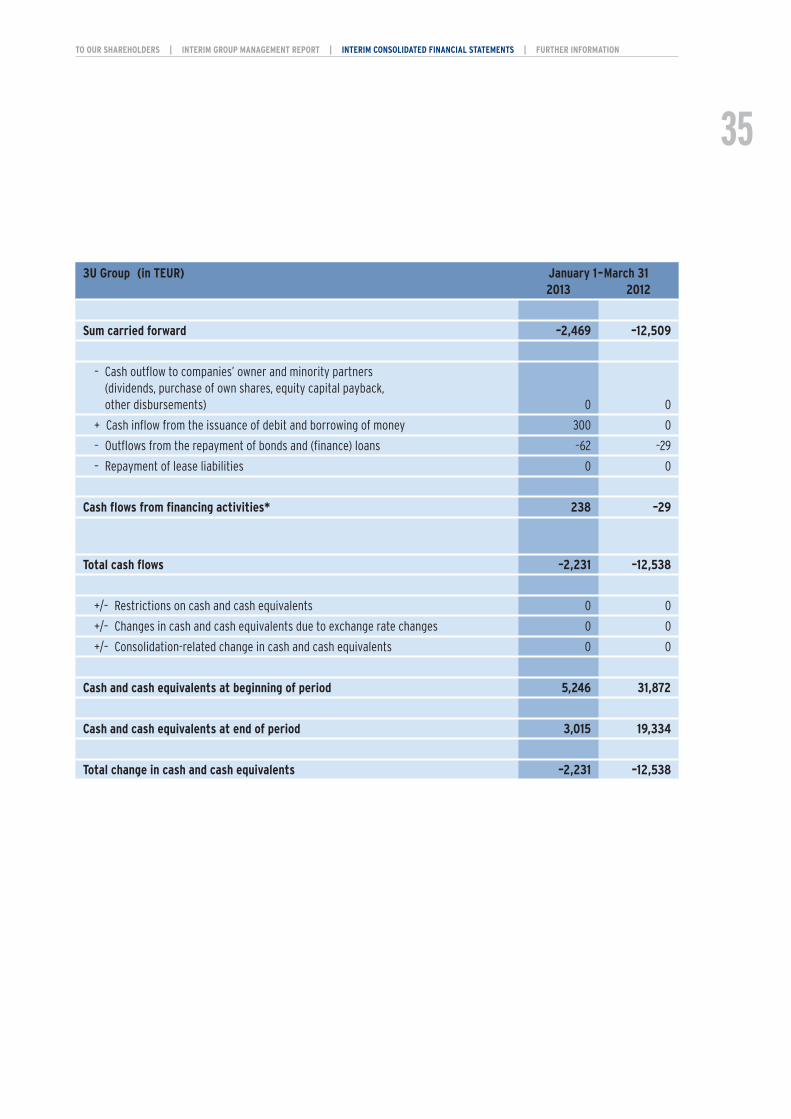
3U Group (in TEUR) January 1– March 312013 2012
Sum carried forward –2,469 –12,509
– Cash outflow to companies’ owner and minority partners (dividends, purchase of own shares, equity capital payback, other disbursements) 0 0
+ Cash inflow from the issuance of debit and borrowing of money 300 0
– Outflows from the repayment of bonds and (finance) loans –62 –29
– Repayment of lease liabilities 0 0
Cash flows from financing activities* 238 –29
Total cash flows –2,231 –12,538
+/– Restrictions on cash and cash equivalents 0 0
+/– Changes in cash and cash equivalents due to exchange rate changes 0 0
+/– Consolidation-related change in cash and cash equivalents 0 0
Cash and cash equivalents at beginning of period 5,246 31,872
Cash and cash equivalents at end of period 3,015 19,334
Total change in cash and cash equivalents –2,231 –12,538
TO OUR SHAREHOLDERS | INTERIM GROUP MANAGEMENT REPORT | INTERIM CONSOLIDATED FINANCIAL STATEMENTS | FURTHER INFORMATION
35

General information about the Group
3U HOLDING AG (subsequently also referred to as 3U or Company), headquartered in Marburg, is the holding company of the
3U Group and a listed stock corporation. It is registered in the Marburg Main District Court in the Register of Companies under HRB
number 4680.
The business activities of 3U HOLDING AG and its Subsidiaries comprise also the provision of telecommunication services in the
segment Telephony. In addition 3U expanded its activities in the field of Renewable Energies and Services. These are reported in
the segments Renewable Energies and Services.
The address of the registered office of the Company is : Frauenbergstraße 31–33, 35039 Marburg, Germany
Accounting principles
The interim financial report was prepared in accordance with the provisions of the International Financial Reporting Standards (IFRS).
The present interim report has not been reviewed by auditors.
Supplementary disclosures in accordance with IAS 34
The accounting policies and methods of calculation used in the consolidated financial statements as of December 31, 2012 were
applied unchanged for the interim statements as of March 31, 2013.
For details of the order situation and the development of costs and prices please refer to the section “Report on business
development” in the interim Group management report.
For details of the stock option program carried out at the beginning of 2011, we refer to the section “Detailed information on stock
option plan” of this interim report.
For details to the number of employees please refer to the section “Staff” in the interim Group management report.
For details to significant events since the end of the interim reporting period we refer to the section “Significant events since the
end of the interim reporting period” in the interim Group management report.
There were no extraordinary developments in business with related parties and the Company in the first three months of 2013 as
against the previous year. For information about individual business relations, please refer to our Annual Report of December 31,
2012, Section 8.3.
Explanatory notes to the consolidated financial statements as of March 31, 2013
TO OUR SHAREHOLDERS | INTERIM GROUP MANAGEMENT REPORT | INTERIM CONSOLIDATED FINANCIAL STATEMENTS | FURTHER INFORMATION
36

Basis of consolidation
Compared with December 31, 2012 the following changes to the basis of consolidation have arisen :
The segment Services expanded in early 2013 through the incorporation of a company in USA. weclapp Inc., based in Delaware, USA
and a branch office in San Francisco which should promote the development of the American market. The sales strategy for the
USA provides for direct sales online via www.weclapp.com and indirect sales via sales and service partners.
EuroSun Vacuum Solar Systems GmbH assumed all remaining shares of Tianjin EuroSun Solar Energy Technology Co., Ltd. from the
former joint venture partner Beijing Yongdong Brilliant Heat-pipe Solar Energy Technology Co., Ltd. on January 24, 2013. The com-
pany is thus 100 % owned by EuroSun Vacuum Solar Systems GmbH.
On February 18, 2013, the shareholders of 3U ENERGY AG agreed on a share purchase and transfer agreement. Content of the agree-
ment is the purchase of 12,500 shares (equals 25 % of the shares of the Company) in addition to all subsidiary rights by
3U HOLDING AG for a purchase price totalling EUR 1.00. Thus the share of 3U HOLDING AG in 3U ENERGY AG increases to 99.998 %.
As at March 31, 2013 in addition to 3U HOLDING AG 27 (December 31, 2012: 25) subsidiary companies both within the country and
outside its borders in which 3U HOLDING AG has a direct or indirect majority of votes or the ability to control, are comprised.
TO OUR SHAREHOLDERS | INTERIM GROUP MANAGEMENT REPORT | INTERIM CONSOLIDATED FINANCIAL STATEMENTS | FURTHER INFORMATION
37
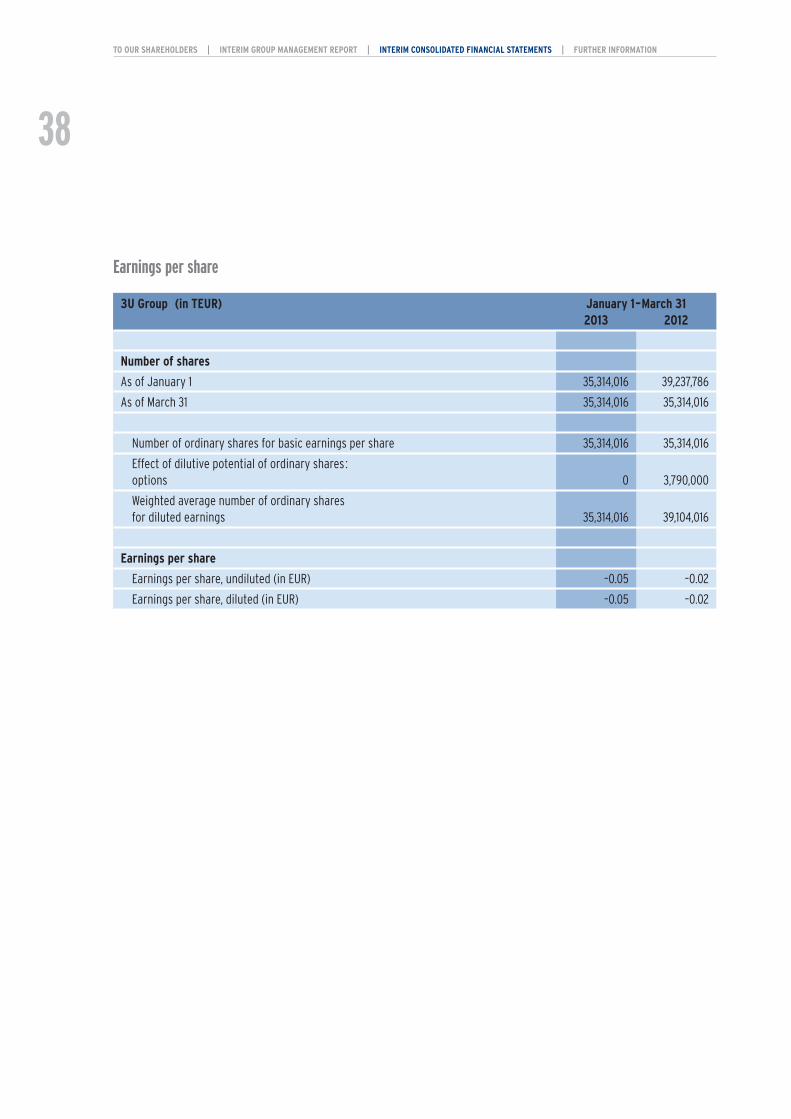
Earnings per share
3U Group (in TEUR) January 1– March 312013 2012
Number of shares
As of January 1 35,314,016 39,237,786
As of March 31 35,314,016 35,314,016
Number of ordinary shares for basic earnings per share 35,314,016 35,314,016
Effect of dilutive potential of ordinary shares: options 0 3,790,000
Weighted average number of ordinary shares for diluted earnings 35,314,016 39,104,016
Earnings per share
Earnings per share, undiluted (in EUR) –0.05 –0.02
Earnings per share, diluted (in EUR) –0.05 –0.02
TO OUR SHAREHOLDERS | INTERIM GROUP MANAGEMENT REPORT | INTERIM CONSOLIDATED FINANCIAL STATEMENTS | FURTHER INFORMATION
38

Segment reporting
In accordance with the regulations of IFRS 8, business segments, the segment reporting of 3U HOLDING AG applies the “Manage-
ment Approach” regarding segment identification.
The information that is regularly made available to the Management Board and Supervisory Board is therefore regarded to be
relevant for the segment presentation.
In accordance with internal reporting, 3U HOLDING AG covers the segments Telephony, Services, Renewable Energies and Holding/
Consolidation within its segment reporting.
The segment Telephony, which consists of the products call-by-call, preselection, added-value services and termination services
in the wholesale sector, is comprised of the original 3U bread and butter business Telephony.
The segment Services consists of IT services, systems development, marketing and consulting
In the segment Renewable Energies all activities of this sector are summarised. It consists of the development, production, trading
and operation of components from the renewable energies area as well as heating and cooling technology.
Holding activities, including the operations connected with the construction of the solar power plant (SPP), as well as the necessary
Group consolidating entries are summarised under Holding/Consolidation.
Segment reporting follows the intra-segment consolidation, while the inter-segment consolidation occurs on holding level.
A detailed description of the segments is available in the interim Group management report in the business performance
presentation.
TO OUR SHAREHOLDERS | INTERIM GROUP MANAGEMENT REPORT | INTERIM CONSOLIDATED FINANCIAL STATEMENTS | FURTHER INFORMATION
39

Segment reporting (in TEUR) Telephony Services Renew- Subtotal Holding/ GroupJanuary 1–March 31, 2013 able Consoli-
Energies dation
Total sales 7,628 731 3,066 11,425 –784 10,641
Intercompany sales (intra-segment sales) –1,540 –50 –511 –2,101 0 –2,101
Segment sales 6,088 681 2,555 9,324 –784 8,540
Other operating income 214 69 49 332 66 398
Change in inventory 0 0 –32 –32 0 –32
Other capitalised services 0 0 0 0 0 0
Costs of materials –4,466 –1 –1,661 –6,128 0 –6,128
Gross profit or loss 1,836 749 911 3,496 –718 2,778
Staff costs –410 –996 –682 –2,088 –797 –2,885
Other operating expense –790 –431 –700 –1,921 414 –1,507
EBITDA 636 –678 –471 –513 –1,101 –1,614
Depreciation –64 –5 –274 –343 –110 –453
EBIT 572 –683 –745 –856 –1,211 –2,067
EBIT (earnings before interest and income taxes) –2,067
Financial result 43
Profit/loss of companies included at equity 34
Other financial result 9
Income tax 24
Earnings for the period –2,000
Thereof attributable to the shareholders of 3U HOLDING AG –1,734
Of which attributable to minority non-controlling shareholders –266
TO OUR SHAREHOLDERS | INTERIM GROUP MANAGEMENT REPORT | INTERIM CONSOLIDATED FINANCIAL STATEMENTS | FURTHER INFORMATION
40

Segment reporting (in TEUR) Telephony Services Renew- Subtotal Holding/ GroupJanuary 1–March 31, 2012 able Consoli-
Energies dation
Total sales 23,901 1,283 1,983 27,167 –1,138 26,029
Intercompany sales (intra-segment sales) –2,662 –60 –108 –2,830 0 –2,830
Segment sales 21,239 1,223 1,875 24,337 –1,138 23,199
Other operating income 326 26 60 412 951 1,363
Change in inventory 0 0 58 58 0 58
Other capitalised services 0 0 0 0 0 0
Costs of materials –19,611 –27 –1,676 –21,314 –15 –21,329
Gross profit or loss 1,954 1,222 317 3,493 –202 3,291
Staff costs –305 –1,118 –625 –2,048 –685 –2,733
Other operating expense –1,448 –291 –378 –2,117 668 –1,449
EBITDA 201 –187 –686 –672 –219 –891
Depreciation –77 –26 –32 –135 –82 –217
EBIT 124 –213 –718 –807 –301 –1,108
EBIT (earnings before interest and income taxes) –1,108
Financial result 160
Profit/loss of companies included at equity 50
Other financial result 110
Income tax –71
Earnings for the period –1,019
Thereof attributable to the shareholders of 3U HOLDING AG –778
Of which attributable to minority non-controlling shareholders –241
TO OUR SHAREHOLDERS | INTERIM GROUP MANAGEMENT REPORT | INTERIM CONSOLIDATED FINANCIAL STATEMENTS | FURTHER INFORMATION
41

42
TO OUR SHAREHOLDERS | INTERIM GROUP MANAGEMENT REPORT | INTERIM CONSOLIDATED FINANCIAL STATEMENTS | FURTHER INFORMATION
The Management Board of 3U stipulates sales and the consolidated segment result before financing and income taxes as major
performance indicators for a segment’s business success, since it considers them crucial to a sector’s success.
Below EBIT, the transition to the Group result is included in the column Group. The financial result is composed of interest income
and interest expenses as well as the income of companies included according to the at-equity method. The interest income is the
result of investments of liquidity that are not allocated to the segments. The interest expense is largely based upon financing in
the Broadband/IP segment. The taxes on income are also not included in the segment result, as the tax expense may only be allo-
cated to legal entities.
The following cash flow data were produced for the 3U Group (all amounts in TEUR):
Cash flow data 2013 (in TEUR) Tele- Services Renew- Holding/ GroupJanuary 1–March 31, 2012 phony able Consoli-
Energies dation
Cash flows from operating activities –587 124 –463 –1,335 –2,261
Cash flows from investing activities –24 –3 2 –183 –208
Cash flows from financing activities –2 –6 292 –46 238
Cash flow data 2013 (in TEUR) Tele- Services Renew- Holding/ GroupJanuary 1–March 31, 2012 phony able Consoli-
Energies dation
Cash flows from operating activities –5,250 –490 –1,747 4,597 –2,890
Cash flows from investing activities 3,280 –59 –4,050 –8,790 –9,619
Cash flows from financing activities 2 311 5,479 –5,821 –29
For the purposes of monitoring earnings power and allocating resources between the segments, the Management Board scruti-
nizes the financial assets allocated to the individual segment. Liquid funds are not allocated to any segment.

43
TO OUR SHAREHOLDERS | INTERIM GROUP MANAGEMENT REPORT | INTERIM CONSOLIDATED FINANCIAL STATEMENTS | FURTHER INFORMATION
(In TEUR) Mar 31, 2013 Dec 31, 2012
Assets
Segment Telephony 10,042 9,935
Segment Services 485 439
Segment Renewable Energies 23,822 25,720
Holding/Consolidation 20,875 18,720
Total segment assets 55,224 54,814
Assets not allocated 4,515 6,746
Total consolidated assets 59,739 61,560
Liabilities
Segment Telephony 1,965 1,306
Segment Services 4,098 3,227
Segment Renewable Energies 32,540 33,702
Holding/Consolidation –27,595 –27,405
Total segment liabilities 11,008 10,830
Reconciliation (shareholder’s equity/interests of non-controlling shareholders) 48,731 50,730
Total consolidated liabilities/shareholder’s equity 59,739 61,560
The uniform Group accounting policies and methods of calculation were applied in the segment reporting. Services between
segments are subject to adherence of the arm’s length principle and therefore Group wide calculated at prices that would be
agreed with third parties. Essentially the cost plus method is applied. Administrative services are calculated as cost allocations.
Long-term assets are located entirely within the country.
(In TEUR) Depreciation and amortisation InvestmentsJanuary 1–March 31 January 1–March 31
2013 2012 2013 2012
Segment Telephony 64 77 24 22
Segment Services 5 26 3 83
Segment Renewable Energies 274 32 79 4,115
Holding/Consolidation 110 82 183 5,455
Total 453 217 289 9,675

44
TO OUR SHAREHOLDERS | INTERIM GROUP MANAGEMENT REPORT | INTERIM CONSOLIDATED FINANCIAL STATEMENTS | FURTHER INFORMATION
Responsibility statement according to § 37y WpHG i. V.m. § 37w Abs. 2 Nr. 3 WpHG
To the best of our knowledge, and in accordance with the applicable reporting principles for interim financial reporting, the interim
consolidated financial statements give a true and fair view of the assets, liabilities, financial position and profit or loss of the group,
and the interim management report of the Group includes a fair review of the development and performance of the business and
the position of the Group, together with a description of the principal opportunities and risks associated with the expected develop-
ment of the Group for the remaining months of the financial year.
Marburg, May 14, 2013
The Management Board
Michael Schmidt Christoph Hellrung Andreas Odenbreit
Responsibility statement

45
TO OUR SHAREHOLDERS | INTERIM GROUP MANAGEMENT REPORT | INTERIM CONSOLIDATED FINANCIAL STATEMENTS | FURTHER INFORMATION
Contact
Company address
3U HOLDING AG
Frauenbergstraße 31–33
35039 Marburg
Postal address
3U HOLDING AG
Postfach 22 60
35010 Marburg
Investor relations
Peter Alex
Tel.: +49 (0) 6421 999-1200
Fax: +49 (0) 6421 999-1222
www.3u.net
Financial calendar
• Annual General Meeting
May 29, 2013
• Publication of report on Q2 2013
August 15, 2013
• Publication of report on Q3 2013
November 11, 2013

Imprint Disclaimer
Published by
3U HOLDING AG
Frauenbergstraße 31–33
35039 Marburg
Photographs
Vladitto — Fotolia (title)
Font
Interstate by Tobias Frere-Jones
(manufacturer: The Font Bureau)
© 2013 3U HOLDING AG, Marburg
Printed in Germany
This quarterly report contains statements relating to the future which
are subject to risks and uncertainties and which are assessments of the
management of 3U HOLDING AG and reflect its current opinions with
regard to future events. Such predictive statements can be recognised by
the use of terms such as “expect”, “assume”, “estimate”, “anticipate”,
“intend”, “can”, “plan”, “project”, “will” and similar expressions. State-
ments relating to the future are based on current and valid plans, esti-
mates and expectations. Such statements are subject to risks and uncer-
tainties, most of which are difficult to estimate and which are generally
beyond the control of 3U HOLDING AG.
The following are — by no means exhaustive — examples of factors
that may trigger or affect a deviation: the development of demand for
our services, competitive factors — including price pressure —, techno-
logical changes, regulatory measures, risks in the integration of newly
acquired companies. If any of these or other risks and uncertain factors
occur, or if the assumptions on which the statements are based prove to
be incorrect, the actual results of 3U HOLDING AG may differ materially
from those outlined or implied in these statements. The company does
not undertake to update predictive statements of this nature.
This quarterly report contains a range of figures which are not part of
commercial regulations and the International Financial Reporting Stan-
dards (IFRS), such as EBT, EBIT, EBITDA and EBITDA adjusted for special
influences, adjusted EBITDA margin, investments (capex). These figures
are not intended to substitute the information for 3U HOLDING AG in
accordance with the German Commercial Code (HGB) or IFRS. It should be
noted that the figures for 3U HOLDING AG which are not part of commer-
cial regulations and the IFRS, can only be compared to the correspon-
ding figures of other companies to a certain extent.
TO OUR SHAREHOLDERS | INTERIM GROUP MANAGEMENT REPORT | INTERIM CONSOLIDATED FINANCIAL STATEMENTS | FURTHER INFORMATION
46
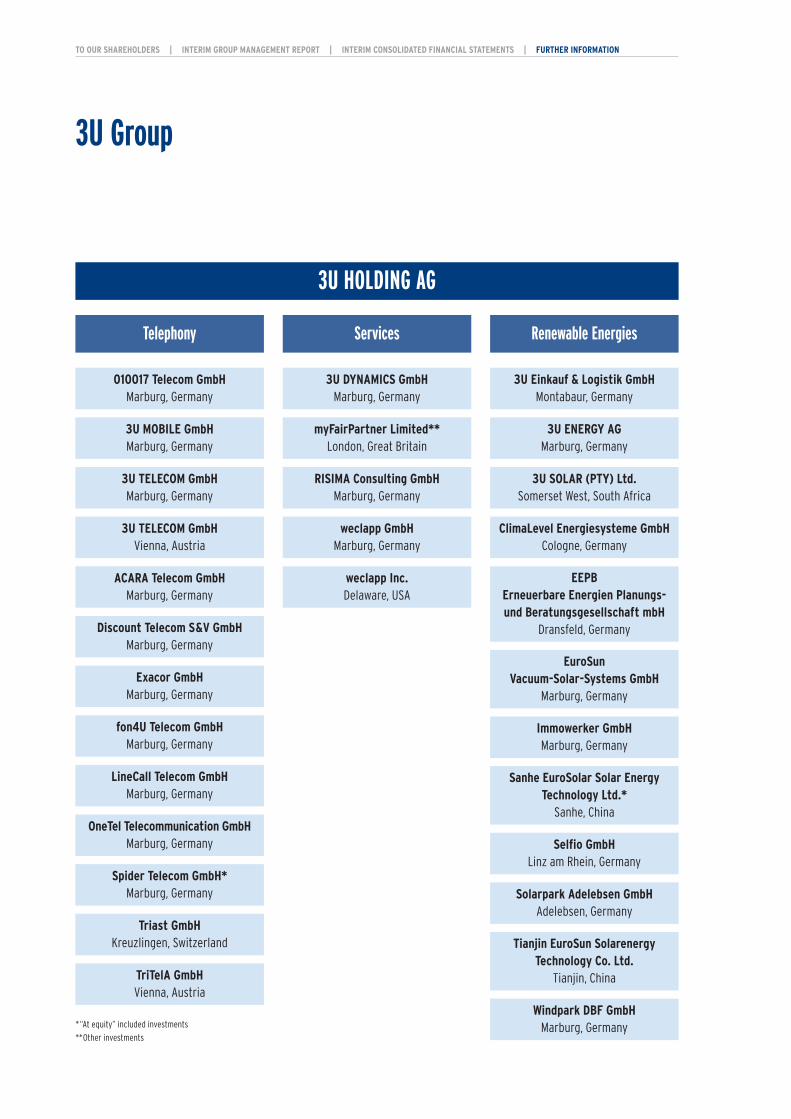
TO OUR SHAREHOLDERS | INTERIM GROUP MANAGEMENT REPORT | INTERIM CONSOLIDATED FINANCIAL STATEMENTS | FURTHER INFORMATION
3U Group
3U HOLDING AG
Telephony Services Renewable Energies
010017 Telecom GmbHMarburg, Germany
3U TELECOM GmbHMarburg, Germany
Discount Telecom S&V GmbHMarburg, Germany
LineCall Telecom GmbHMarburg, Germany
Spider Telecom GmbH*Marburg, Germany
Triast GmbHKreuzlingen, Switzerland
TriTelA GmbHVienna, Austria
ACARA Telecom GmbHMarburg, Germany
3U MOBILE GmbHMarburg, Germany
OneTel Telecommunication GmbHMarburg, Germany
3U TELECOM GmbHVienna, Austria
3U DYNAMICS GmbHMarburg, Germany
myFairPartner Limited**London, Great Britain
RISIMA Consulting GmbHMarburg, Germany
weclapp GmbHMarburg, Germany
weclapp Inc.Delaware, USA
EuroSun Vacuum-Solar-Systems GmbH
Marburg, Germany
EEPB Erneuerbare Energien Planungs- und Beratungsgesellschaft mbH
Dransfeld, Germany
Tianjin EuroSun SolarenergyTechnology Co. Ltd.
Tianjin, China
Sanhe EuroSolar Solar EnergyTechnology Ltd.*
Sanhe, China
ClimaLevel Energiesysteme GmbHCologne, Germany
Selfio GmbHLinz am Rhein, Germany
Windpark DBF GmbHMarburg, Germany
3U ENERGY AGMarburg, Germany
3U Einkauf & Logistik GmbHMontabaur, Germany
Immowerker GmbHMarburg, Germany
3U SOLAR (PTY) Ltd.Somerset West, South Africa
*“At equity” included investments
**Other investments
Exacor GmbHMarburg, Germany
fon4U Telecom GmbHMarburg, Germany
Solarpark Adelebsen GmbHAdelebsen, Germany

3013
/101
2
3U HOLDING AGPostfach 22 6035010 Marburg
Tel.: +49 (0) 6421 999-1200Fax: +49 (0) 6421 999-1222
[email protected] www.3u.net