Embed Size (px)
Citation preview
1
SM71 F Platform continued to deliver strong production results during the March 2020 quarter with Byron’s share of oil and gas production (net sales volume) for the March 2020 quarter, from SM71 and SM58 E1 well, being 89,010 barrels of oil and 235,794 mmbtu of gas;
Net revenue recorded for the March 2020 quarter, from SM71 and SM58, was approximately US$4.6 million (net to Byron after quality adjustments, transportation charges and royalties) with realised net prices of US$47.40 per barrel of oil and US$1.50 per mmbtu of natural gas during the period;
No material production or construction impacts due to COVID-19 outbreak during the March quarter;
Due to the oil price collapse, the Company announced on 31 March 2020 that SM71 oil production will be curtailed to more closely align with previously hedged volumes;
Supplemental hedges have been secured on both the LLS/WTI price differential and calendar month average Roll-Adjust price components, providing an all in fixed realised price of US$50.20 per barrel, prior to transportation costs, on 670 bopd hedged production for April-to-December 2020.
SM71 F4 well successfully drilled, completed and brought on production in March 2020 has flowed gas at an average rate of 9.0 mmcfpd with a very low liquid yield and declining flowing tubing pressure. The well has produced approximately 0.5 bcf of gas;
Post drill evaluation of the SM71 F5 well indicates the well encountered a stray 40 foot thick gas sand above the primary D5 sand target and may have penetrated the upper 20 feet of the D5 sand before hole conditions prevented the well from being drilled any deeper. Additionally, LWD logs indicate SM71 F5 intersected 36 feet TVT net gas pay in the primary D5 Sand target and 12 feet TVT net oil pay in the I3 Sand, and 20 feet TVT net oil pay in the J Sand with the well temporarily abandoned for use as a future side-track; and
SM58 platform construction is on schedule but in response to oil price volatility, platform and pipeline installation timing is under review which may result in a delay of platform and pipeline installation and consequently completion of SM58 G1 well, drilling of new wells and production start-up at SM58.
Name: Byron Energy Limited
ASX code: BYE
Shares on issue at 31 Mar 2020: 810.9 million
Quoted shares: 810.9 million
Options on issue (unquoted): 41.1 million
Cash at Bank31 Mar 2020: US$18.2 million
Borrowings 31 Mar 2020: US$18.3 million
Market Capitalisation at 31 Mar 2020:
A$93 million(@A$0.115 per share)
Quarterly Report for the Period Ended 31 March 2020
Summary
DirectorsDoug Battersby (Non-Executive Chairman)Maynard Smith (Chief Executive Officer)Prent Kallenberger (Chief Operating Officer)Charles Sands (Non-Executive Director)
Directors (continued)Paul Young (Non-Executive Director)
William Sack (Executive Director)Company Secretary and Chief Financial OfficerNick Filipovic
For
per
sona
l use
onl
y
2
Issued Capital
As at 31 March 2020, Byron’s issued capital comprised:-
Corporate
Securities Total issued Quoted UnquotedShares (ASX:BYE) 810,910,278 810,910,278 Nil
Options 41,100,000 Nil 41,100,000
Early in January 2020, all of the optionholders holding 9.5 million options expiring on 31 December 2019 (executive directors, senior staff and contractors) were issued with 9.5 million fully paid shares, at A$0.25 each, having exercised their options. The Company made available to each of the optionholders an interest free loan for the sole purpose of funding the exercise of the options. These loans were approved by shareholders at the Company’s Annual General Meeting on 29 November 2019. For additional information, see the Notice of Meeting released to the ASX on 29 October 2019.
Metgasco Limited (“Metgasco’’) (ASX:MEL) held approximately 40.9 million shares in the Company at the end of the March 2020 quarter. On 31 March 2020, Metgasco announced that the planned in-specie distribution of 20 million Byron shares, held by Metgasco, was deferred (refer to Metgasco’s ASX announcement dated 31 March 2020).
Equity Raising
At a general meeting of shareholders held on 20 January 2020, the shareholders approved the issue of 2,000,000 ordinary shares to interests associated with directors Doug Battersby and Paul Young at A$0.27 per share, raising A$0.54 million. This was part of the placement of shares by the Company announced on 15 November 2019.
Borrowings
As previously reported, in the December quarter 2019 Byron signed a binding Secured Promissory Note (“Promissory Note”) with Crimson Midstream Operating, LLC (“Crimson Midstream”), a portfolio company of The Carlyle Group, to borrow an initial amount of US$15.0 million. The first tranche of US$10.0 million under Promissory Note facility was drawn by the Byron group in December 2019. The second tranche of US$5.0 million under the Promissory Note was drawn in January 2020. The Promissory Note is secured over Byron’s SM71 and SM58 assets and guaranteed by the Company, bearing interest at a rate of 15% p.a., over a 3-year term, with the first-year being interest-only. For further details of the Promissory Note refer to the Company’s ASX release dated 4 December 2019.
In early January 2020, Byron repaid US$ 0.5 million to a director, in line with the loan agreement.
As at 31 March 2020, Byron’s loans comprised:-
Lender US$ M A$ M US$ Equivalent(@A$1=US$0.6175)
Directors 2.00 1.75 3.08
Shareholders - 0.35 0.22
Crimson Midstream 15.00 - 15.00Total 17.50 2.10 18.30* as at 31 March 2020, Byron also had US$0.45 million in insurance premium financing outstanding
For
per
sona
l use
onl
y
3
Corporate (cont.)COVID-19
On 30 March 2020, Byron provided an update on the impact of COVID-19 on the Company operations. Consistent with that update, Byron has not experienced any material interruptions from COVID-19 to the Byron operated SM71 platform, in the Gulf of Mexico, or the ongoing construction work on Byron’s SM58 G platform, in Abbeville, Louisiana. Byron’s Lafayette, Louisiana based team and the Australian based team continue working from home, as advised by the respective governments.
Crude Oil Price Decline
On 31 March 2020 Byron provided comprehensive business update, outlining the Company’s financial position as of 29 February 2020 and noting action taken and being considered by the Company in response to the severe fall in oil prices. For additional details refer to the Company’s ASX release, Business Update, dated 31 March 2020.
Further details on the Company’s response to the oil price fall are included below, under Hedging and Projects Update.
Hedging
Byron’s realised prices for oil are a combination of hedged and unhedged volumes. The Company’s current oil hedging position is governed by a forward sale agreement which specifies a price per barrel in advance for each delivery period during the term of the contract.
The hedging counterparty, one of the global oil industry’s “supermajors”, is also the purchaser of Byron’s oil production under a mutually agreed long term purchase arrangement, which provides Byron with a stable, aligned counterparty.
The market is continually being surveilled for attractive positions on additional hedging opportunities. In the near term, South Marsh Island 71 (“SM71”) production levels are being managed by Byron, as operator, to minimise unhedged exposure. Byron’s estimated gross revenue for the currently hedged volumes only, prior to transportation, is estimated to be US$9.1 million dollars for April through to December 2020, approximately US$1.0 million per month.
Byron’s realised prices for oil are made up of the following components: WTI Calendar Month Average (“CMA”) Base Price, the Light Louisiana Sweet/West Texas Intermediate (“LLS/WTI”) price differential and, CMA Roll-Adjust (“Roll”) which are combined then adjusted downward for transportation costs, pipeline allowance, and qualityadjustments (collectively referred to as “Transportation”).
In December 2019, Byron entered into an oil hedging program on 670 bopd, approximately 50% of the Company’s net SM71 proved producing forecast production. This was implemented through a counterparty, at a preferred customer rate, using a fixed-price forward sale agreement (the “December 2019 Hedge Agreement”).
During April 2020, Byron placed additional hedge layers on the two other pricing components, the LLS/WTI price differential and the Roll. When combined, all three hedging components result in an attractive fixed realised price, prior to Transportation, of US$50.20/barrel on the existing 670 barrels of oil per day (“bopd”) hedged volume for the June 1-Dec 31, 2020 period. The near months of April and May, while negatively affected by current high price volatility in the LLS/WTI differential and the Roll, are being managed by limiting production to the hedge position.
In response to the dislocation in the global and local crude oil markets and the unprecedented volatility in prices, Byron has further enhanced and protected its fixed WTI CMA Base Price hedge position by placing the following hedges on two previously floating components:
For
per
sona
l use
onl
y
4
Period
Daily Hedged Volume (bopd)
Period Hedged Volume
(bbl)
NYMEX WTI Fixed
Base Price
Crude Oil*
CMA Roll Adjust
LLS/WTI Price
Differential
Realised Price on Hedged
Production prior to Transportation (Transportation est. @ US$4.70)
Estimated Period Hedged Oil Sales Revenue (excluding Transportation and Royalty)
April 2020 670 20,100 US$54.78 -US$0.42 (estimated)
-US$5.00 (estimated) US$49.36**
US$1.0 Million (estimate only)
May 2020 670 20,770 US$54.78 -US$8.20 (estimated)
-US$2.78 (fixed) US$43.80**
US$0.9 Million(estimate only)
Jun-Dec 2020 670 143,380 US$54.78 -US$1.80
(fixed)-US$2.78
(fixed) US$50.20US$7.2 Million
(~US$1.0 Million per month)
Jan-Dec 2021 450 164,250 US$52.86 Unhedged Unhedged To be determined To be determined
Jan-Dec 2022 400 146,000 US$52.70 Unhedged Unhedged To be determined To be determined
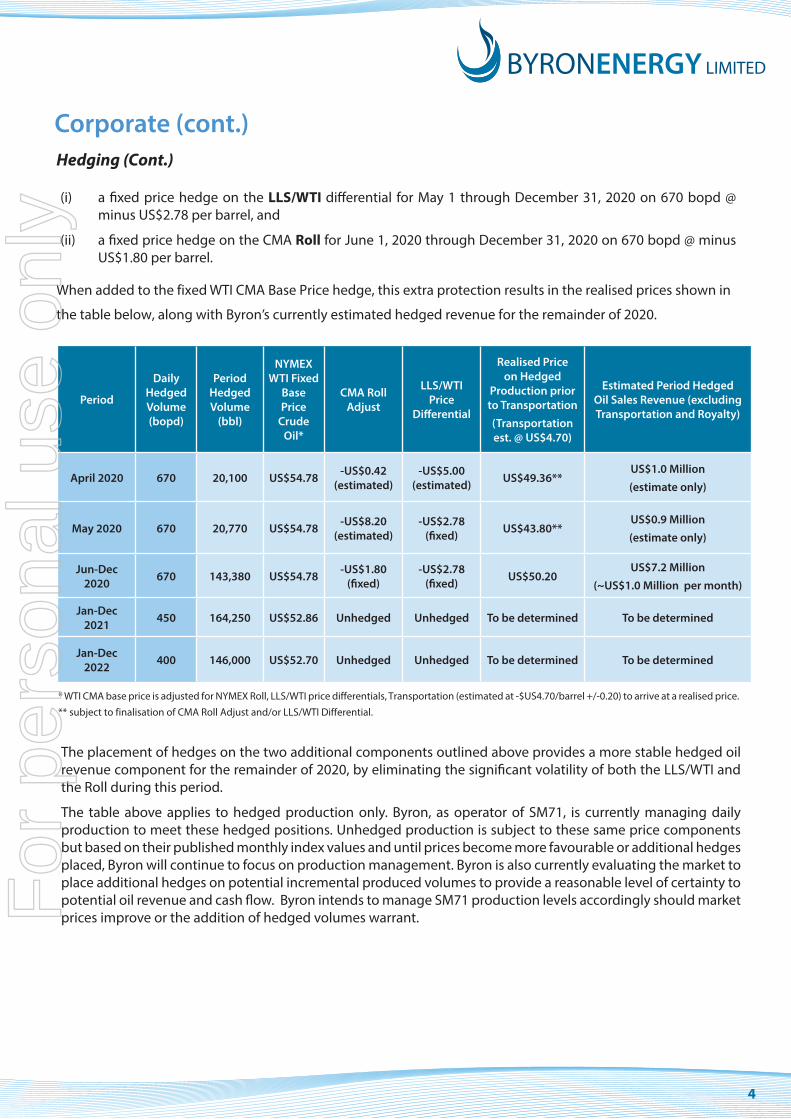
Corporate (cont.)Hedging (Cont.)
a fixed price hedge on the LLS/WTI differential for May 1 through December 31, 2020 on 670 bopd @ minus US$2.78 per barrel, and
a fixed price hedge on the CMA Roll for June 1, 2020 through December 31, 2020 on 670 bopd @ minus US$1.80 per barrel.
(i)
(ii)
When added to the fixed WTI CMA Base Price hedge, this extra protection results in the realised prices shown in
the table below, along with Byron’s currently estimated hedged revenue for the remainder of 2020.
* WTI CMA base price is adjusted for NYMEX Roll, LLS/WTI price differentials, Transportation (estimated at -$US4.70/barrel +/-0.20) to arrive at a realised price.
** subject to finalisation of CMA Roll Adjust and/or LLS/WTI Differential.
The placement of hedges on the two additional components outlined above provides a more stable hedged oil revenue component for the remainder of 2020, by eliminating the significant volatility of both the LLS/WTI and the Roll during this period.
The table above applies to hedged production only. Byron, as operator of SM71, is currently managing daily production to meet these hedged positions. Unhedged production is subject to these same price components but based on their published monthly index values and until prices become more favourable or additional hedges placed, Byron will continue to focus on production management. Byron is also currently evaluating the market to place additional hedges on potential incremental produced volumes to provide a reasonable level of certainty to potential oil revenue and cash flow. Byron intends to manage SM71 production levels accordingly should market prices improve or the addition of hedged volumes warrant. F
or p
erso
nal u
se o
nly
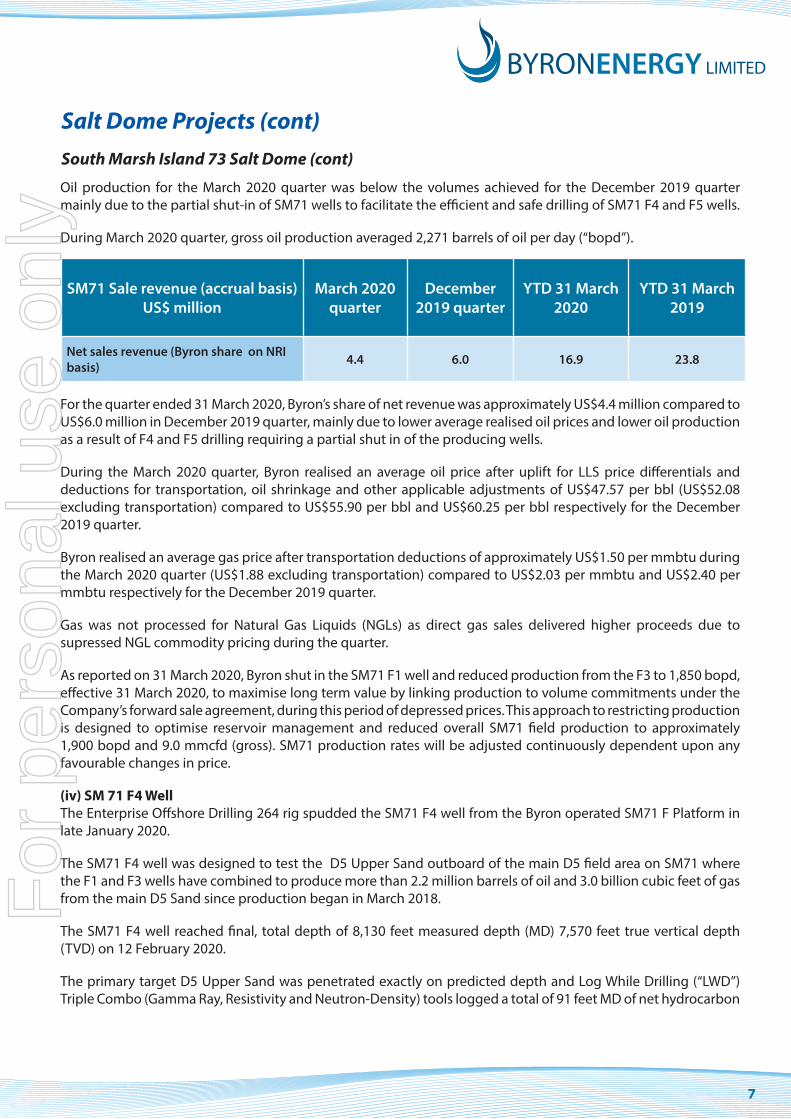
5
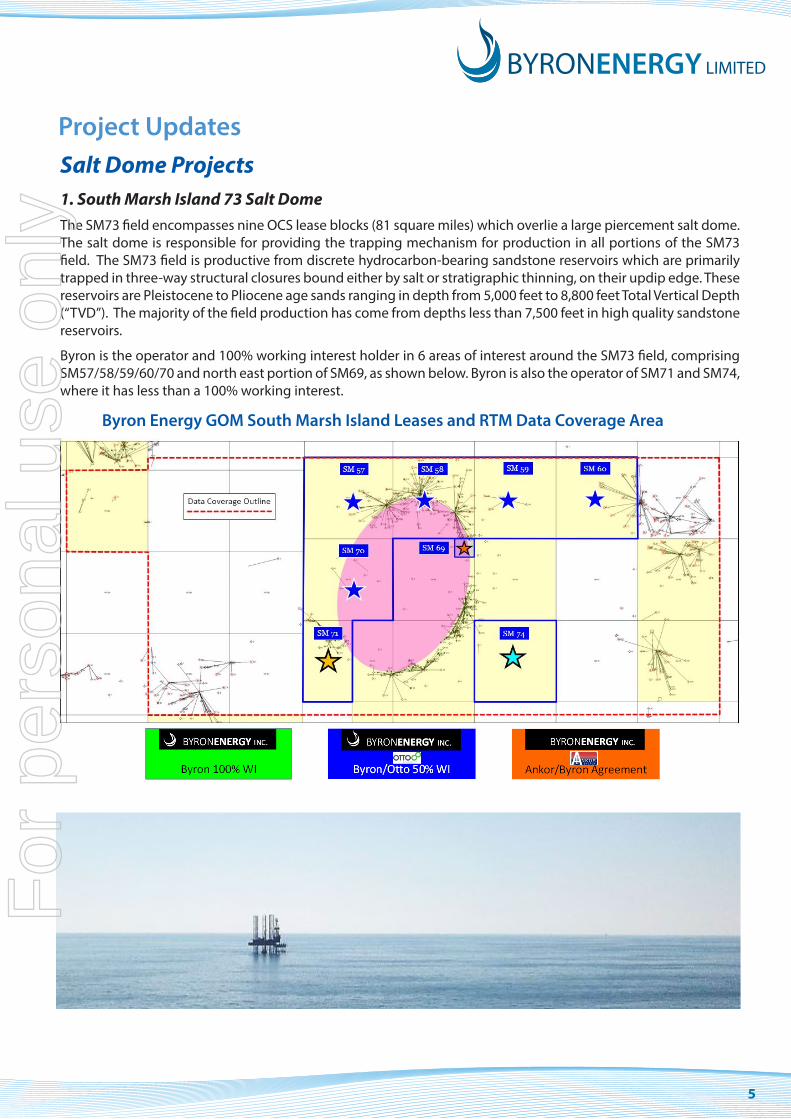
Salt Dome Projects 1. South Marsh Island 73 Salt DomeThe SM73 field encompasses nine OCS lease blocks (81 square miles) which overlie a large piercement salt dome. The salt dome is responsible for providing the trapping mechanism for production in all portions of the SM73 field. The SM73 field is productive from discrete hydrocarbon-bearing sandstone reservoirs which are primarily trapped in three-way structural closures bound either by salt or stratigraphic thinning, on their updip edge. These reservoirs are Pleistocene to Pliocene age sands ranging in depth from 5,000 feet to 8,800 feet Total Vertical Depth (“TVD”). The majority of the field production has come from depths less than 7,500 feet in high quality sandstone reservoirs.
Byron is the operator and 100% working interest holder in 6 areas of interest around the SM73 field, comprising SM57/58/59/60/70 and north east portion of SM69, as shown below. Byron is also the operator of SM71 and SM74, where it has less than a 100% working interest.
Project Updates
Byron Energy GOM South Marsh Island Leases and RTM Data Coverage Area
For
per
sona
l use
onl
y
6
Salt Dome Projects (cont)South Marsh Island 73 Salt Dome (cont)
(a) South Marsh Island 71
Byron owns the South Marsh Island block 71 (“SM71”) a lease in the South Marsh Island Block 73 (“SM73”) field. Byron is the designated operator of SM71 and owns a 50% Working Interest (“WI”) and a 40.625% Net Revenue Interest (“NRI”) in the block, with Otto Energy Limited (“Otto”) group holding an equivalent WI and NRI in the block.
As Otto did not participate in the drilling of the SM71 F4 well Byron is entitled to 100% WI/81.25% NRI in SM 71 F4 well, until payout.
Water depth in the area is approximately 137 feet.
Oil and gas production from the Byron operated SM71 F platform began on 23 March 2018 from three wells, F1, F2 and F3. Production from the F4 well, successfully drilled and completed in March 2020, commenced production in in mid-March 2020.
(i) SM 71 ProductionThe F1 and F3 wells are producing in the primary D5 Sand reservoir and the F2 well is producing from the B55Sand. The recently completed F4 well is also producing from the D5 Sand reservoir.
As of 31 March 2020, the SM71 F facility has produced over 2.2 million barrels of oil (gross) since initial production began. The facility has also produced over 3.0 billion cubic feet of gas (gross).
(ii) Current ProductionAs of 31 March 2020, the SM71 platform gross production rate was approximately 1,900 barrels of oil per day andapproximately 9 million cubic feet of gas per day and no water from any of the wells, except for F2 well whichproduces from the B55 sand.
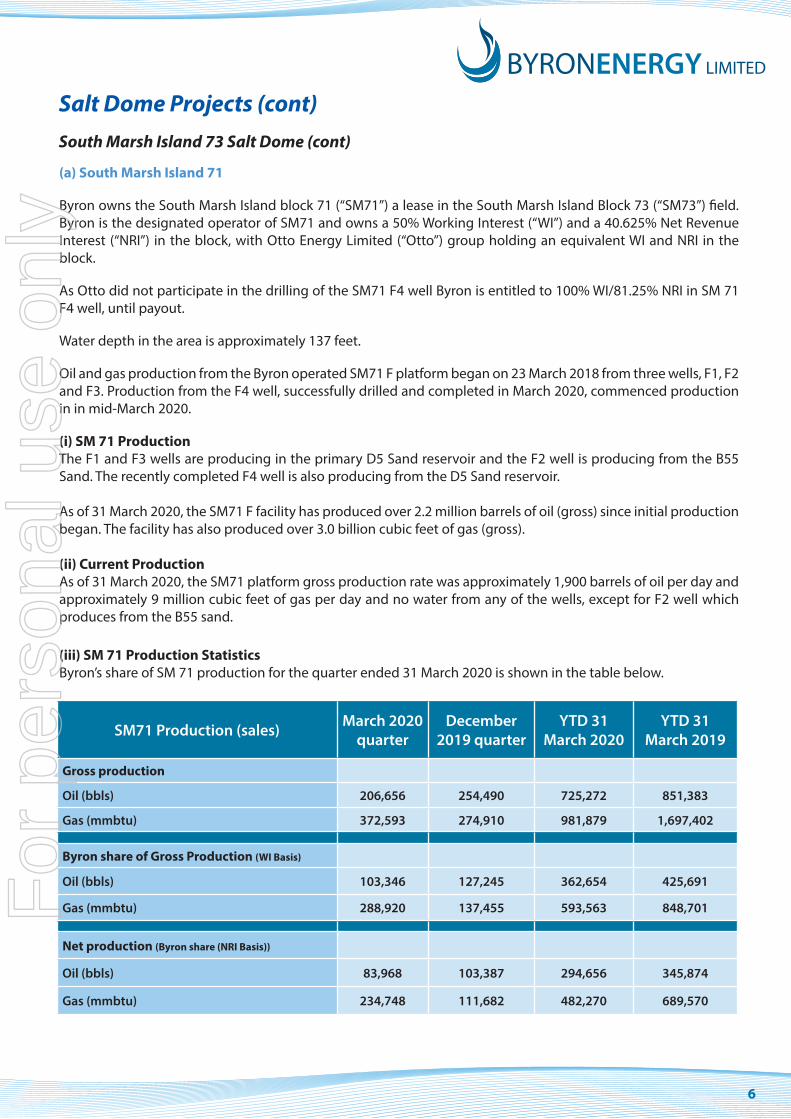
(iii) SM 71 Production StatisticsByron’s share of SM 71 production for the quarter ended 31 March 2020 is shown in the table below.
SM71 Production (sales) March 2020 quarter
December 2019 quarter
YTD 31 March 2020
YTD 31 March 2019
Gross production
Oil (bbls) 206,656 254,490 725,272 851,383
Gas (mmbtu) 372,593 274,910 981,879 1,697,402
Byron share of Gross Production (WI Basis)
Oil (bbls) 103,346 127,245 362,654 425,691
Gas (mmbtu) 288,920 137,455 593,563 848,701
Net production (Byron share (NRI Basis))
Oil (bbls) 83,968 103,387 294,656 345,874
Gas (mmbtu) 234,748 111,682 482,270 689,570
For
per
sona
l use
onl
y
7
Salt Dome Projects (cont)South Marsh Island 73 Salt Dome (cont)
Oil production for the March 2020 quarter was below the volumes achieved for the December 2019 quarter mainly due to the partial shut-in of SM71 wells to facilitate the efficient and safe drilling of SM71 F4 and F5 wells.
During March 2020 quarter, gross oil production averaged 2,271 barrels of oil per day (“bopd”).
SM71 Sale revenue (accrual basis) US$ million
March 2020 quarter
December 2019 quarter
YTD 31 March 2020
YTD 31 March 2019
Net sales revenue (Byron share on NRI basis) 4.4 6.0 16.9 23.8
For the quarter ended 31 March 2020, Byron’s share of net revenue was approximately US$4.4 million compared to US$6.0 million in December 2019 quarter, mainly due to lower average realised oil prices and lower oil production as a result of F4 and F5 drilling requiring a partial shut in of the producing wells.
During the March 2020 quarter, Byron realised an average oil price after uplift for LLS price differentials and deductions for transportation, oil shrinkage and other applicable adjustments of US$47.57 per bbl (US$52.08 excluding transportation) compared to US$55.90 per bbl and US$60.25 per bbl respectively for the December 2019 quarter.
Byron realised an average gas price after transportation deductions of approximately US$1.50 per mmbtu during the March 2020 quarter (US$1.88 excluding transportation) compared to US$2.03 per mmbtu and US$2.40 per mmbtu respectively for the December 2019 quarter.
Gas was not processed for Natural Gas Liquids (NGLs) as direct gas sales delivered higher proceeds due to supressed NGL commodity pricing during the quarter.
As reported on 31 March 2020, Byron shut in the SM71 F1 well and reduced production from the F3 to 1,850 bopd, effective 31 March 2020, to maximise long term value by linking production to volume commitments under the Company’s forward sale agreement, during this period of depressed prices. This approach to restricting production is designed to optimise reservoir management and reduced overall SM71 field production to approximately 1,900 bopd and 9.0 mmcfd (gross). SM71 production rates will be adjusted continuously dependent upon any favourable changes in price.
(iv) SM 71 F4 WellThe Enterprise Offshore Drilling 264 rig spudded the SM71 F4 well from the Byron operated SM71 F Platform inlate January 2020.
The SM71 F4 well was designed to test the D5 Upper Sand outboard of the main D5 field area on SM71 where the F1 and F3 wells have combined to produce more than 2.2 million barrels of oil and 3.0 billion cubic feet of gas from the main D5 Sand since production began in March 2018.
The SM71 F4 well reached final, total depth of 8,130 feet measured depth (MD) 7,570 feet true vertical depth (TVD) on 12 February 2020.
The primary target D5 Upper Sand was penetrated exactly on predicted depth and Log While Drilling (“LWD”) Triple Combo (Gamma Ray, Resistivity and Neutron-Density) tools logged a total of 91 feet MD of net hydrocarbon
For
per
sona
l use
onl
y
8
Salt Dome Projects (cont)South Marsh Island 73 Salt Dome (cont)
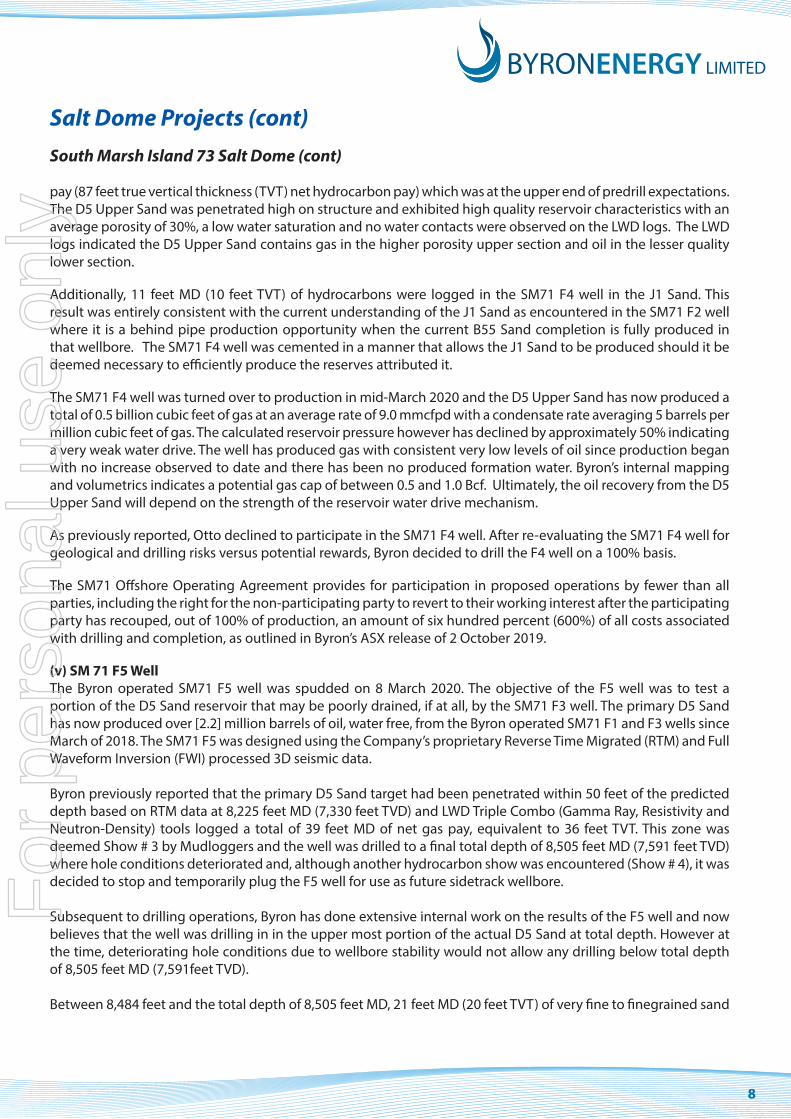
pay (87 feet true vertical thickness (TVT) net hydrocarbon pay) which was at the upper end of predrill expectations. The D5 Upper Sand was penetrated high on structure and exhibited high quality reservoir characteristics with an average porosity of 30%, a low water saturation and no water contacts were observed on the LWD logs. The LWD logs indicated the D5 Upper Sand contains gas in the higher porosity upper section and oil in the lesser quality lower section.
Additionally, 11 feet MD (10 feet TVT) of hydrocarbons were logged in the SM71 F4 well in the J1 Sand. This result was entirely consistent with the current understanding of the J1 Sand as encountered in the SM71 F2 well where it is a behind pipe production opportunity when the current B55 Sand completion is fully produced in that wellbore. The SM71 F4 well was cemented in a manner that allows the J1 Sand to be produced should it be deemed necessary to efficiently produce the reserves attributed it.
The SM71 F4 well was turned over to production in mid-March 2020 and the D5 Upper Sand has now produced a total of 0.5 billion cubic feet of gas at an average rate of 9.0 mmcfpd with a condensate rate averaging 5 barrels per million cubic feet of gas. The calculated reservoir pressure however has declined by approximately 50% indicating a very weak water drive. The well has produced gas with consistent very low levels of oil since production began with no increase observed to date and there has been no produced formation water. Byron’s internal mapping and volumetrics indicates a potential gas cap of between 0.5 and 1.0 Bcf. Ultimately, the oil recovery from the D5 Upper Sand will depend on the strength of the reservoir water drive mechanism.
As previously reported, Otto declined to participate in the SM71 F4 well. After re-evaluating the SM71 F4 well for geological and drilling risks versus potential rewards, Byron decided to drill the F4 well on a 100% basis.
The SM71 Offshore Operating Agreement provides for participation in proposed operations by fewer than all parties, including the right for the non-participating party to revert to their working interest after the participating party has recouped, out of 100% of production, an amount of six hundred percent (600%) of all costs associated with drilling and completion, as outlined in Byron’s ASX release of 2 October 2019.
(v) SM 71 F5 WellThe Byron operated SM71 F5 well was spudded on 8 March 2020. The objective of the F5 well was to test aportion of the D5 Sand reservoir that may be poorly drained, if at all, by the SM71 F3 well. The primary D5 Sandhas now produced over [2.2] million barrels of oil, water free, from the Byron operated SM71 F1 and F3 wells sinceMarch of 2018. The SM71 F5 was designed using the Company’s proprietary Reverse Time Migrated (RTM) and Full Waveform Inversion (FWI) processed 3D seismic data.
Byron previously reported that the primary D5 Sand target had been penetrated within 50 feet of the predicted depth based on RTM data at 8,225 feet MD (7,330 feet TVD) and LWD Triple Combo (Gamma Ray, Resistivity and Neutron-Density) tools logged a total of 39 feet MD of net gas pay, equivalent to 36 feet TVT. This zone was deemed Show # 3 by Mudloggers and the well was drilled to a final total depth of 8,505 feet MD (7,591 feet TVD) where hole conditions deteriorated and, although another hydrocarbon show was encountered (Show # 4), it was decided to stop and temporarily plug the F5 well for use as future sidetrack wellbore.
Subsequent to drilling operations, Byron has done extensive internal work on the results of the F5 well and now believes that the well was drilling in in the upper most portion of the actual D5 Sand at total depth. However at the time, deteriorating hole conditions due to wellbore stability would not allow any drilling below total depth of 8,505 feet MD (7,591feet TVD).
Between 8,484 feet and the total depth of 8,505 feet MD, 21 feet MD (20 feet TVT) of very fine to finegrained sand
For
per
sona
l use
onl
y
9
Salt Dome Projects (cont)South Marsh Island 73 Salt Dome (cont)
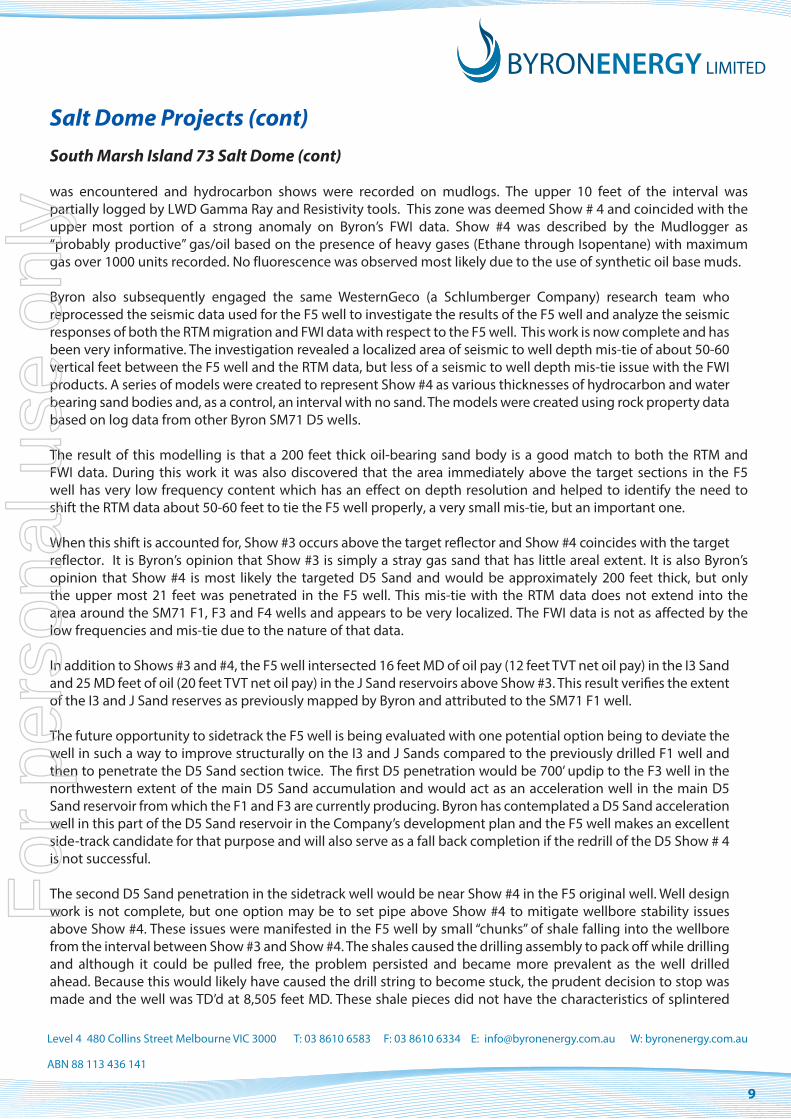
was encountered and hydrocarbon shows were recorded on mudlogs. The upper 10 feet of the interval was partially logged by LWD Gamma Ray and Resistivity tools. This zone was deemed Show # 4 and coincided with the upper most portion of a strong anomaly on Byron’s FWI data. Show #4 was described by the Mudlogger as “probably productive” gas/oil based on the presence of heavy gases (Ethane through Isopentane) with maximum gas over 1000 units recorded. No fluorescence was observed most likely due to the use of synthetic oil base muds.
Byron also subsequently engaged the same WesternGeco (a Schlumberger Company) research team who reprocessed the seismic data used for the F5 well to investigate the results of the F5 well and analyze the seismic responses of both the RTM migration and FWI data with respect to the F5 well. This work is now complete and has been very informative. The investigation revealed a localized area of seismic to well depth mis-tie of about 50-60 vertical feet between the F5 well and the RTM data, but less of a seismic to well depth mis-tie issue with the FWI products. A series of models were created to represent Show #4 as various thicknesses of hydrocarbon and water bearing sand bodies and, as a control, an interval with no sand. The models were created using rock property data based on log data from other Byron SM71 D5 wells.
The result of this modelling is that a 200 feet thick oil-bearing sand body is a good match to both the RTM and FWI data. During this work it was also discovered that the area immediately above the target sections in the F5 well has very low frequency content which has an effect on depth resolution and helped to identify the need to shift the RTM data about 50-60 feet to tie the F5 well properly, a very small mis-tie, but an important one.
When this shift is accounted for, Show #3 occurs above the target reflector and Show #4 coincides with the target reflector. It is Byron’s opinion that Show #3 is simply a stray gas sand that has little areal extent. It is also Byron’s opinion that Show #4 is most likely the targeted D5 Sand and would be approximately 200 feet thick, but only the upper most 21 feet was penetrated in the F5 well. This mis-tie with the RTM data does not extend into the area around the SM71 F1, F3 and F4 wells and appears to be very localized. The FWI data is not as affected by the low frequencies and mis-tie due to the nature of that data.
In addition to Shows #3 and #4, the F5 well intersected 16 feet MD of oil pay (12 feet TVT net oil pay) in the I3 Sand and 25 MD feet of oil (20 feet TVT net oil pay) in the J Sand reservoirs above Show #3. This result verifies the extent of the I3 and J Sand reserves as previously mapped by Byron and attributed to the SM71 F1 well.
The future opportunity to sidetrack the F5 well is being evaluated with one potential option being to deviate the well in such a way to improve structurally on the I3 and J Sands compared to the previously drilled F1 well and then to penetrate the D5 Sand section twice. The first D5 penetration would be 700’ updip to the F3 well in the northwestern extent of the main D5 Sand accumulation and would act as an acceleration well in the main D5 Sand reservoir from which the F1 and F3 are currently producing. Byron has contemplated a D5 Sand acceleration well in this part of the D5 Sand reservoir in the Company’s development plan and the F5 well makes an excellent side-track candidate for that purpose and will also serve as a fall back completion if the redrill of the D5 Show # 4 is not successful.
The second D5 Sand penetration in the sidetrack well would be near Show #4 in the F5 original well. Well design work is not complete, but one option may be to set pipe above Show #4 to mitigate wellbore stability issues above Show #4. These issues were manifested in the F5 well by small “chunks” of shale falling into the wellbore from the interval between Show #3 and Show #4. The shales caused the drilling assembly to pack off while drilling and although it could be pulled free, the problem persisted and became more prevalent as the well drilled ahead. Because this would likely have caused the drill string to become stuck, the prudent decision to stop was made and the well was TD’d at 8,505 feet MD. These shale pieces did not have the characteristics of splintered
Level 4 480 Collins Street Melbourne VIC 3000 T: 03 8610 6583 F: 03 8610 6334 E: [email protected] W: byronenergy.com.au
ABN 88 113 436 141
For
per
sona
l use
onl
y
10
Salt Dome Projects (cont)South Marsh Island 73 Salt Dome (cont)
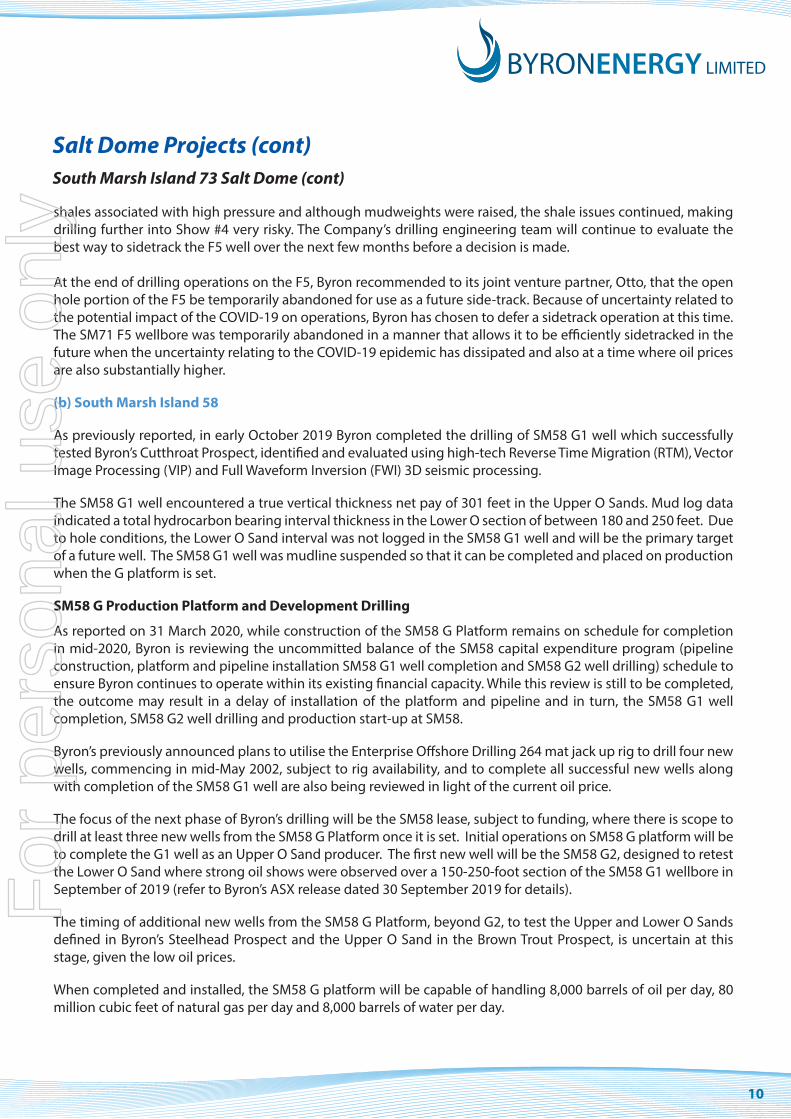
shales associated with high pressure and although mudweights were raised, the shale issues continued, making drilling further into Show #4 very risky. The Company’s drilling engineering team will continue to evaluate the best way to sidetrack the F5 well over the next few months before a decision is made.
At the end of drilling operations on the F5, Byron recommended to its joint venture partner, Otto, that the open hole portion of the F5 be temporarily abandoned for use as a future side-track. Because of uncertainty related to the potential impact of the COVID-19 on operations, Byron has chosen to defer a sidetrack operation at this time. The SM71 F5 wellbore was temporarily abandoned in a manner that allows it to be efficiently sidetracked in the future when the uncertainty relating to the COVID-19 epidemic has dissipated and also at a time where oil prices are also substantially higher.
(b) South Marsh Island 58
As previously reported, in early October 2019 Byron completed the drilling of SM58 G1 well which successfully tested Byron’s Cutthroat Prospect, identified and evaluated using high-tech Reverse Time Migration (RTM), Vector Image Processing (VIP) and Full Waveform Inversion (FWI) 3D seismic processing.
The SM58 G1 well encountered a true vertical thickness net pay of 301 feet in the Upper O Sands. Mud log data indicated a total hydrocarbon bearing interval thickness in the Lower O section of between 180 and 250 feet. Due to hole conditions, the Lower O Sand interval was not logged in the SM58 G1 well and will be the primary target of a future well. The SM58 G1 well was mudline suspended so that it can be completed and placed on production when the G platform is set.
SM58 G Production Platform and Development Drilling
As reported on 31 March 2020, while construction of the SM58 G Platform remains on schedule for completion in mid-2020, Byron is reviewing the uncommitted balance of the SM58 capital expenditure program (pipeline construction, platform and pipeline installation SM58 G1 well completion and SM58 G2 well drilling) schedule to ensure Byron continues to operate within its existing financial capacity. While this review is still to be completed, the outcome may result in a delay of installation of the platform and pipeline and in turn, the SM58 G1 well completion, SM58 G2 well drilling and production start-up at SM58.
Byron’s previously announced plans to utilise the Enterprise Offshore Drilling 264 mat jack up rig to drill four new wells, commencing in mid-May 2002, subject to rig availability, and to complete all successful new wells along with completion of the SM58 G1 well are also being reviewed in light of the current oil price.
The focus of the next phase of Byron’s drilling will be the SM58 lease, subject to funding, where there is scope to drill at least three new wells from the SM58 G Platform once it is set. Initial operations on SM58 G platform will be to complete the G1 well as an Upper O Sand producer. The first new well will be the SM58 G2, designed to retest the Lower O Sand where strong oil shows were observed over a 150-250-foot section of the SM58 G1 wellbore in September of 2019 (refer to Byron’s ASX release dated 30 September 2019 for details).
The timing of additional new wells from the SM58 G Platform, beyond G2, to test the Upper and Lower O Sands defined in Byron’s Steelhead Prospect and the Upper O Sand in the Brown Trout Prospect, is uncertain at this stage, given the low oil prices.
When completed and installed, the SM58 G platform will be capable of handling 8,000 barrels of oil per day, 80 million cubic feet of natural gas per day and 8,000 barrels of water per day.
For
per
sona
l use
onl
y
11
Salt Dome Projects (cont)
South Marsh Island 73 Salt Dome (cont)
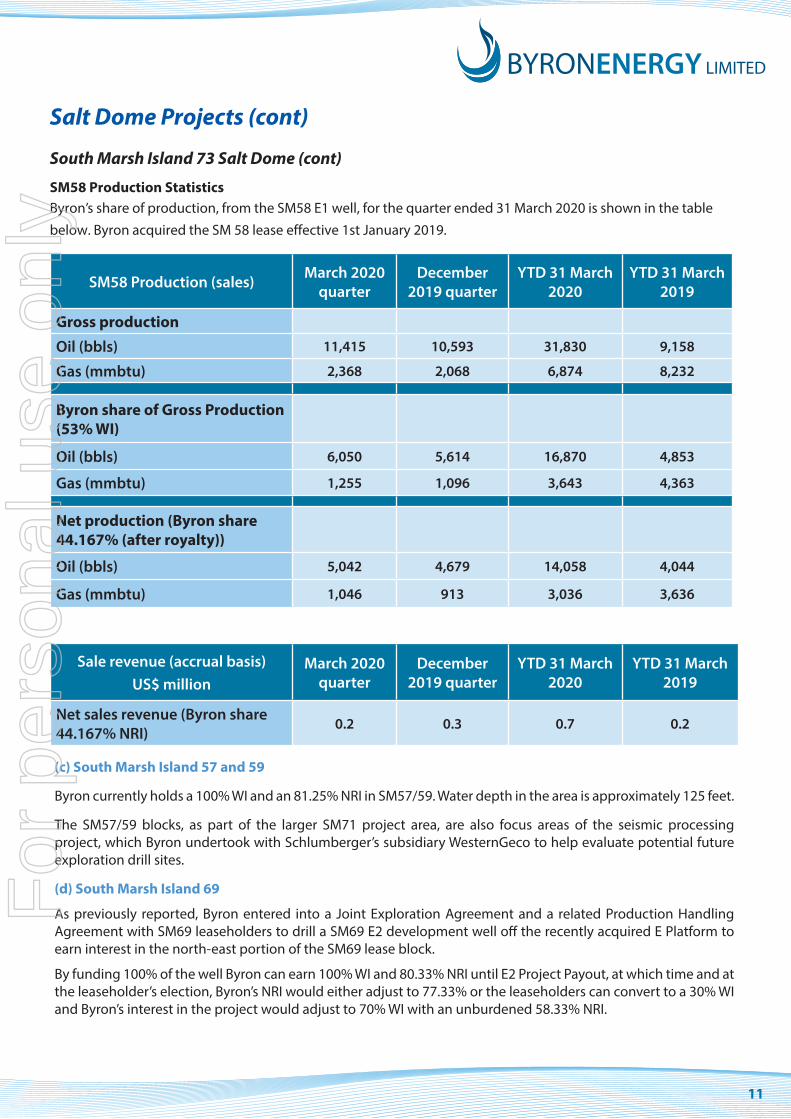
SM58 Production StatisticsByron’s share of production, from the SM58 E1 well, for the quarter ended 31 March 2020 is shown in the table
below. Byron acquired the SM 58 lease effective 1st January 2019.
SM58 Production (sales) March 2020 quarter
December 2019 quarter
YTD 31 March 2020
YTD 31 March 2019
Gross productionOil (bbls) 11,415 10,593 31,830 9,158
Gas (mmbtu) 2,368 2,068 6,874 8,232
Byron share of Gross Production (53% WI)
Oil (bbls) 6,050 5,614 16,870 4,853
Gas (mmbtu) 1,255 1,096 3,643 4,363
Net production (Byron share 44.167% (after royalty))
Oil (bbls) 5,042 4,679 14,058 4,044
Gas (mmbtu) 1,046 913 3,036 3,636
Sale revenue (accrual basis) US$ million
March 2020 quarter
December 2019 quarter
YTD 31 March 2020
YTD 31 March 2019
Net sales revenue (Byron share 44.167% NRI)
0.2 0.3 0.7 0.2
(c) South Marsh Island 57 and 59
Byron currently holds a 100% WI and an 81.25% NRI in SM57/59. Water depth in the area is approximately 125 feet.
The SM57/59 blocks, as part of the larger SM71 project area, are also focus areas of the seismic processing project, which Byron undertook with Schlumberger’s subsidiary WesternGeco to help evaluate potential future exploration drill sites.
(d) South Marsh Island 69
As previously reported, Byron entered into a Joint Exploration Agreement and a related Production Handling Agreement with SM69 leaseholders to drill a SM69 E2 development well off the recently acquired E Platform to earn interest in the north-east portion of the SM69 lease block.
By funding 100% of the well Byron can earn 100% WI and 80.33% NRI until E2 Project Payout, at which time and at the leaseholder’s election, Byron’s NRI would either adjust to 77.33% or the leaseholders can convert to a 30% WI and Byron’s interest in the project would adjust to 70% WI with an unburdened 58.33% NRI.
For
per
sona
l use
onl
y
12
Salt Dome Projects (cont)South Marsh Island 73 Salt Dome (cont)Byron’s plans to drill the SM69 E2 well from SM69 E Platform, where Byron owns a 53% working interest in the SM58 E1 producing well, have been deferred to focus the Company’s financial resources on SM58 development, following the oil price fall.
For additional information of the SM69 E2 development well agreement, refer to the Company’s ASX releases dated 1 April 2019.
(e) South Marsh Island 60
Byron Energy Inc, a wholly owned subsidiary of the Company, acquired the South Marsh Island 60 lease (“SM60")at the Gulf of Mexico, Outer Continental Shelf (“OCS”) Lease Sale 252 held in New Orleans, Louisiana on 20 March 2019.
From 1978 through 2006, nine wells completed for production on SM60 produced a combined total of 385 billion cubic feet of gas and 787,000 barrels of oil. SM60 lies within the area of Byron’s RTM reprocessing project which was used to evaluate the prospect potential on the block.
(f) South Marsh Island 70
Byron has a 100% WI and 87.5% NRI (royalty rate of 12.5%) South Marsh Island 70 (“SM 70”) at the Gulf of Mexico OCS Lease Sale 250 held on 21 March 2018 in New Orleans, Louisiana.
Byron has identified several higher risk exploratory leads on SM70. These leads are being evaluated following completion Byron’s South Marsh Island project seismic reprocessing work in late 2018.
No material activity was undertaken on SM70 during the March 2020 quarter.
2. Eugene Island blocks 62, 63, 76 and 77Byron acquired Eugene Island blocks 62, 63, 76 and 77 (“EI62/63/76/77”), at Gulf of Mexico OCS Lease Sale 250 held on 21 March 2018 in New Orleans, Louisiana. Water depth in the area is approximately 20 feet.
Byron currently holds a 100% WI and an 87.5% NRI in EI62/63/76/77, reflecting the recently reduced Federal Government Royalty of 12.5% versus pre-2017 rate of 18.75%.
EI62/63/76/77 were designated as the Eugene Island 77 Field in the 1960’s and have produced 362 billion cubic feet of gas and 6.5 million barrels of oil from sands trapped by the Eugene Island 77 salt dome. Initial production from the field began in 1957. There is no production on these blocks currently.
On the basis of proprietary RTM, undertaken by WesternGeco (a Schlumberger group company) in 2014 of 3D seismic data over the entire four block Eugene Island 77 Field, Byron acquired EI62/63/76/77 at the OCS Lease Sale 250. As a result of this detailed work Byron significantly upgraded the reserve potential of EI62/63/76/77.
In the September 2018 quarter, Byron began a reprocessing effort similar that undertaken on the SM71 Project Area with WesternGeco over all four Eugene Island blocks leased by the Company. Final deliverables were received during the June quarter 2019. Analysis of the reprocessed data is continuing.
3. Main Pass 293, 305 & 306Byron currently holds a 100% WI and an 87.50% NRI in Main Pass 293, 305 & 306 (“MP 306 Field”) acquired at the Gulf of Mexico, Outer Continental Shelf (“OCS”) Lease Sale 251 (“Lease Sale 251”) held in New Orleans, Louisiana on 15 August 2018.
For
per
sona
l use
onl
y
13
Main Pass 293, 305 & 306 (cont)The three leases comprise the MP306 field as formerly designated by the Bureau of Ocean Energy Management (“BOEM”). The MP 306 Field was discovered in 1969 and lies in approximately 200 feet of water. Total produced hydrocarbons from the field are 96 million barrels of oil and 107 bcf of gas from 172 of the 249 total wells drilled. The field ceased production in late 2009 and the last well drilled on any of these blocks was in 2004. The production was from a number of sands ranging from a depth of 4,000 to 9,000 feet.
The structural complexity of the salt dome combined with the stratigraphic variation of the trapping sands and possible deeper stratigraphic targets makes this salt dome an ideal candidate for RTM seismic imaging, similar to Byron’s operated SM71 salt dome project.
While no material activity was undertaken during the March 2020 quarter, the Company will shortly start scoping an RTM seismic imaging project over the MP306 field.
Salt Dome Projects (cont)
Non-Salt Dome Projects (Byron Operated)1. Grand Isle Block 95Grand Isle Block 95 (“GI95”) is located in US Federal waters, approximately 100 miles southeast of New Orleans, Louisiana, at a water depth of approximately 201 feet. The Company has a 100% operated WI and an 87.5% NRI, reflecting the recently reduced Federal Government Royalty of 12.5% versus pre- 2017 rate of 18.75%. Water depth in the area is approximately 197 feet.
Byron acquired the GI95 lease at Central Gulf of Mexico OCS Lease Sale 249 held on 16 August 2017 in New Orleans, Louisiana.
No material activity was undertaken on GI 95 during March 2020 quarter.
For
per
sona
l use
onl
y
14
Properties Operator Interest WI/NRI* (%)
Lease Expiry Date
Area(Km2)
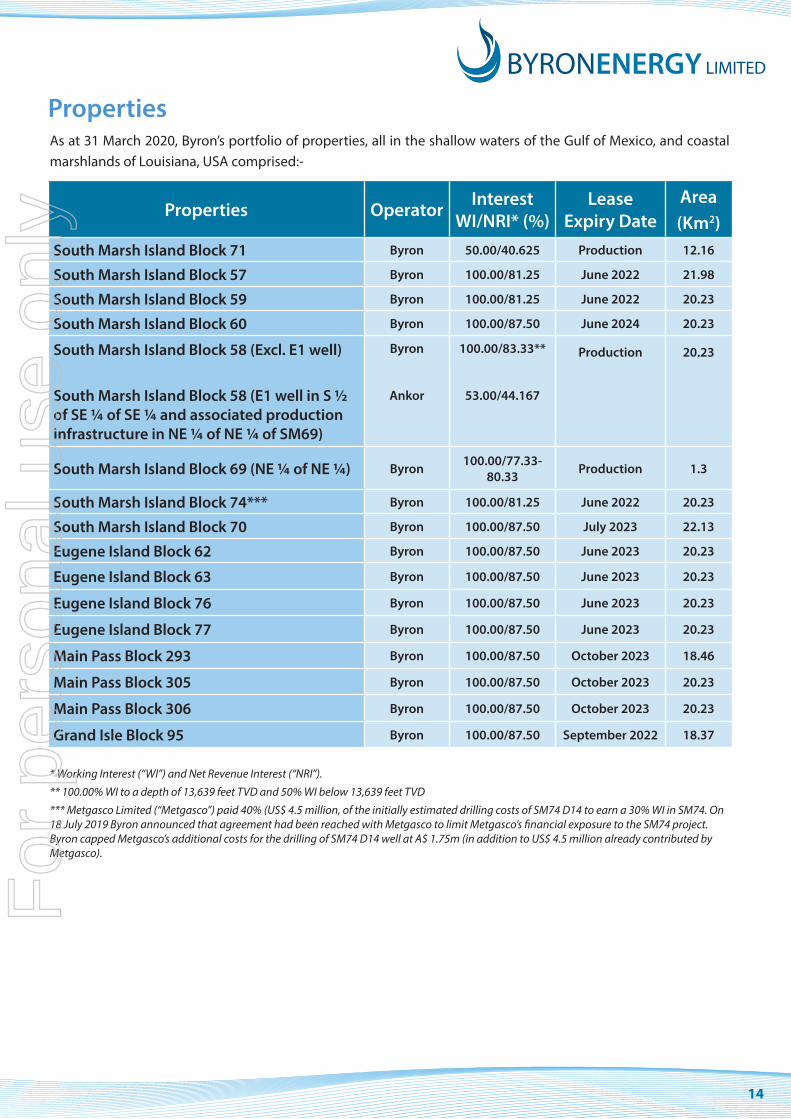
South Marsh Island Block 71 Byron 50.00/40.625 Production 12.16
South Marsh Island Block 57 Byron 100.00/81.25 June 2022 21.98
South Marsh Island Block 59 Byron 100.00/81.25 June 2022 20.23
South Marsh Island Block 60 Byron 100.00/87.50 June 2024 20.23
South Marsh Island Block 58 (Excl. E1 well)
South Marsh Island Block 58 (E1 well in S ½ of SE ¼ of SE ¼ and associated production infrastructure in NE ¼ of NE ¼ of SM69)
Byron
Ankor
100.00/83.33**
53.00/44.167
Production 20.23
South Marsh Island Block 69 (NE ¼ of NE ¼) Byron 100.00/77.33-80.33 Production 1.3
South Marsh Island Block 74*** Byron 100.00/81.25 June 2022 20.23
South Marsh Island Block 70 Byron 100.00/87.50 July 2023 22.13
Eugene Island Block 62 Byron 100.00/87.50 June 2023 20.23
Eugene Island Block 63 Byron 100.00/87.50 June 2023 20.23
Eugene Island Block 76 Byron 100.00/87.50 June 2023 20.23
Eugene Island Block 77 Byron 100.00/87.50 June 2023 20.23
Main Pass Block 293 Byron 100.00/87.50 October 2023 18.46
Main Pass Block 305 Byron 100.00/87.50 October 2023 20.23
Main Pass Block 306 Byron 100.00/87.50 October 2023 20.23
Grand Isle Block 95 Byron 100.00/87.50 September 2022 18.37
PropertiesAs at 31 March 2020, Byron’s portfolio of properties, all in the shallow waters of the Gulf of Mexico, and coastal marshlands of Louisiana, USA comprised:-
* Working Interest (“WI”) and Net Revenue Interest (“NRI”).
** 100.00% WI to a depth of 13,639 feet TVD and 50% WI below 13,639 feet TVD
*** Metgasco Limited (“Metgasco”) paid 40% (US$ 4.5 million, of the initially estimated drilling costs of SM74 D14 to earn a 30% WI in SM74. On 18 July 2019 Byron announced that agreement had been reached with Metgasco to limit Metgasco’s financial exposure to the SM74 project. Byron capped Metgasco’s additional costs for the drilling of SM74 D14 well at A$ 1.75m (in addition to US$ 4.5 million already contributed by Metgasco).
For
per
sona
l use
onl
y
15
Glossary
1P = Proved Reserves2P = Proved and Probable Reserves3P = Proved, Probable and Possible ReservesBbl = barrelsbcf = billion cubic feetBopd = barrels of oil per daybtu = British Thermal Unitsmcfg = thousand cubic of gasmcfgpd = thousand cubic feet of gas per day mcf = thousand cubic feetmmcf = million cubic feetmmbtu = million British Thermal UnitsMbo = thousand barrels of oilMmbo = million barrels of oilNGL = Natural gas Liquids, such as ethane, propane and butaneTcf = trillion cubic feet
Conversions6:1 BOE conversion ratio for gas to oil; 6:1 conversion ratio is based on an energy equivalency conversion method and does not represent value equivalency.
1 mcfg equals approximately 1.09 btu’s currently for SM 71 production; the heat content of SM 71 gas may vary over time.
For
per
sona
l use
onl
y
Appendix 5B Mining exploration entity and oil and gas exploration entity quarterly report
ASX Listing Rules Appendix 5B (01/12/19) 16 + See chapter 19 of the ASX Listing Rules for defined terms.
Appendix 5B
Mining exploration entity or oil and gas exploration entity quarterly cash flow report
Name of entity
Byron Energy Limited
ABN Quarter ended (“current quarter”)
88 113 436 141 31 March 2020
Consolidated statement of cash flows Current quarter US$’000
Year to date (9 months)
US$’000
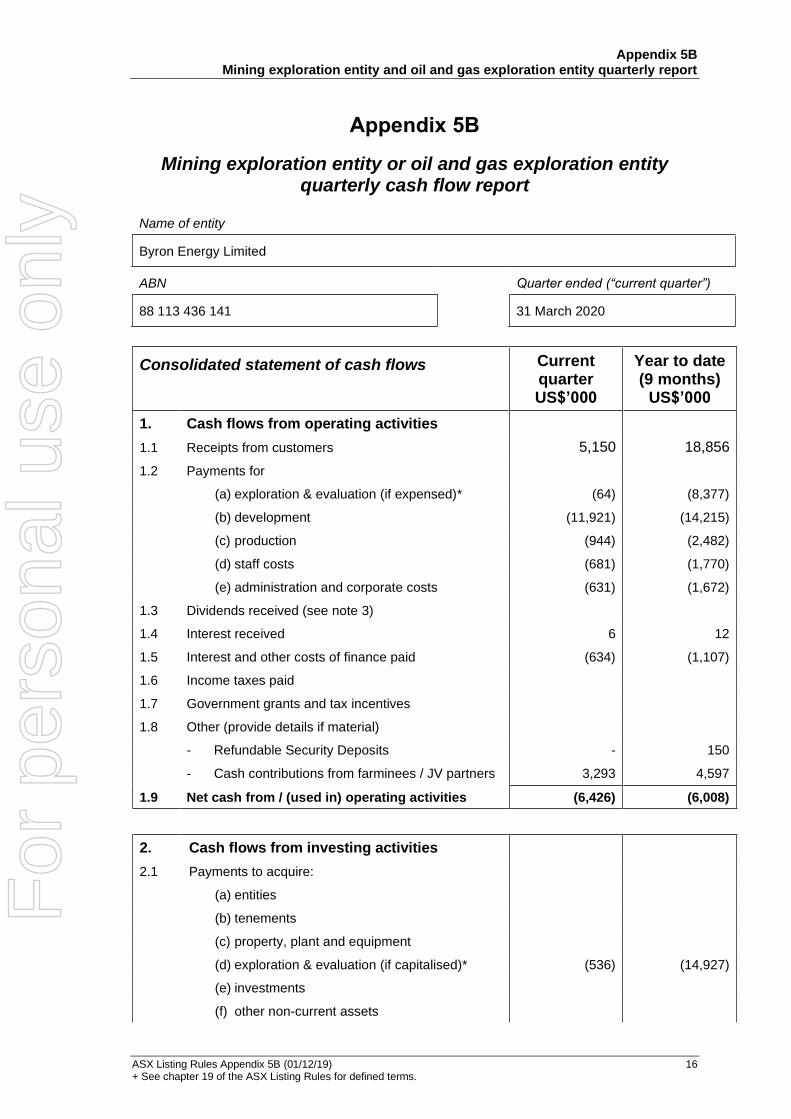
1. Cash flows from operating activities
5,150 18,856 1.1 Receipts from customers
1.2 Payments for
(64) (8,377) (a) exploration & evaluation (if expensed)*
(b) development (11,921) (14,215)
(c) production (944) (2,482)
(d) staff costs (681) (1,770)
(e) administration and corporate costs (631) (1,672)
1.3 Dividends received (see note 3)
1.4 Interest received 6 12
1.5 Interest and other costs of finance paid (634) (1,107)
1.6 Income taxes paid
1.7 Government grants and tax incentives
1.8 Other (provide details if material)
- Refundable Security Deposits - 150
- Cash contributions from farminees / JV partners 3,293 4,597
1.9 Net cash from / (used in) operating activities (6,426) (6,008)
2. Cash flows from investing activities
2.1 Payments to acquire:
(a) entities
(b) tenements
(c) property, plant and equipment
(d) exploration & evaluation (if capitalised)* (536) (14,927)
(e) investments
(f) other non-current assets
For
per
sona
l use
onl
y
Appendix 5B Mining exploration entity and oil and gas exploration entity quarterly report
ASX Listing Rules Appendix 5B (01/12/19) 17 + See chapter 19 of the ASX Listing Rules for defined terms.
Consolidated statement of cash flows Current quarter US$’000
Year to date (9 months)
US$’000
2.2 Proceeds from the disposal of:
(a) entities
(b) tenements
(c) property, plant and equipment
(d) investments
(e) other non-current assets
2.3 Cash flows from loans to other entities
2.4 Dividends received (see note 3)
2.5 Other (provide details if material)
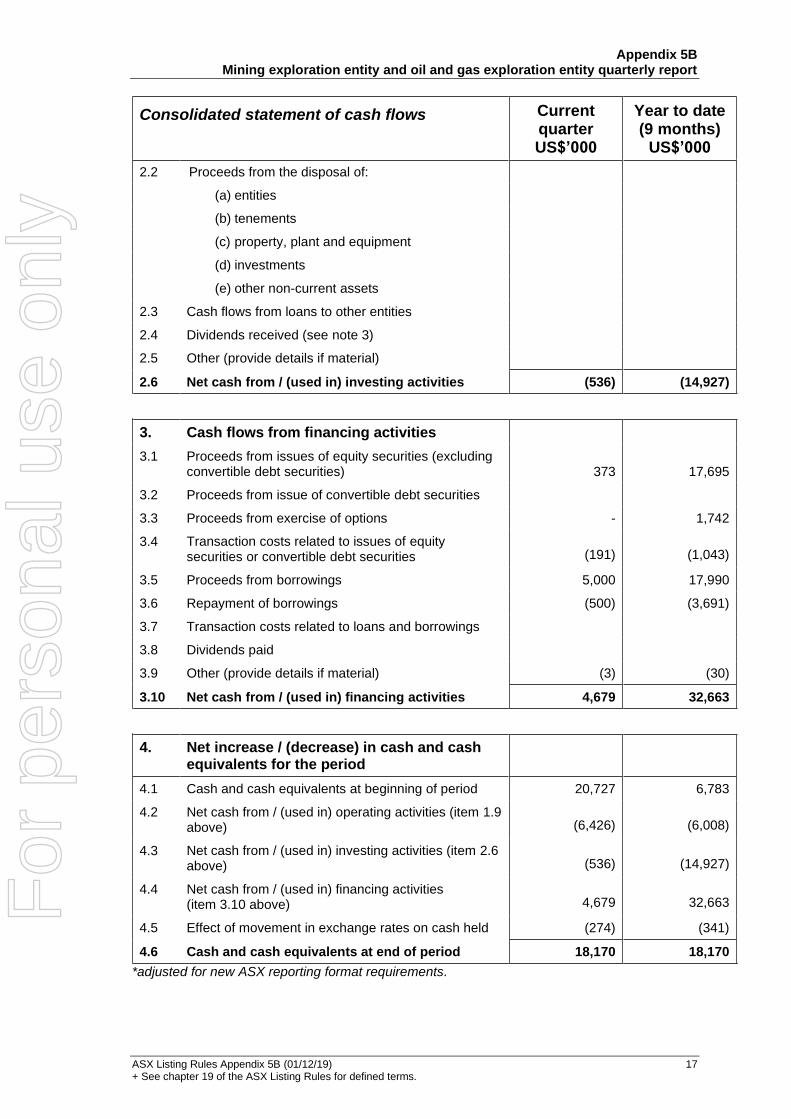
2.6 Net cash from / (used in) investing activities (536) (14,927)
3. Cash flows from financing activities
373 17,695 3.1 Proceeds from issues of equity securities (excluding
convertible debt securities)
3.2 Proceeds from issue of convertible debt securities
3.3 Proceeds from exercise of options - 1,742
3.4 Transaction costs related to issues of equitysecurities or convertible debt securities (191) (1,043)
3.5 Proceeds from borrowings 5,000 17,990
3.6 Repayment of borrowings (500) (3,691)
3.7 Transaction costs related to loans and borrowings
3.8 Dividends paid
3.9 Other (provide details if material) (3) (30)
3.10 Net cash from / (used in) financing activities 4,679 32,663
4. Net increase / (decrease) in cash and cashequivalents for the period
4.1 Cash and cash equivalents at beginning of period 20,727 6,783
4.2 Net cash from / (used in) operating activities (item 1.9 above) (6,426) (6,008)
4.3 Net cash from / (used in) investing activities (item 2.6 above) (536) (14,927)
4.4 Net cash from / (used in) financing activities (item 3.10 above) 4,679 32,663
4.5 Effect of movement in exchange rates on cash held (274) (341)
4.6 Cash and cash equivalents at end of period 18,170 18,170
*adjusted for new ASX reporting format requirements.
For
per
sona
l use
onl
y
Appendix 5B Mining exploration entity and oil and gas exploration entity quarterly report
ASX Listing Rules Appendix 5B (01/12/19) 18 + See chapter 19 of the ASX Listing Rules for defined terms.
5. Reconciliation of cash and cashequivalentsat the end of the quarter (as shown in theconsolidated statement of cash flows) to therelated items in the accounts
Current quarter US$’000
Previous quarter US$’000
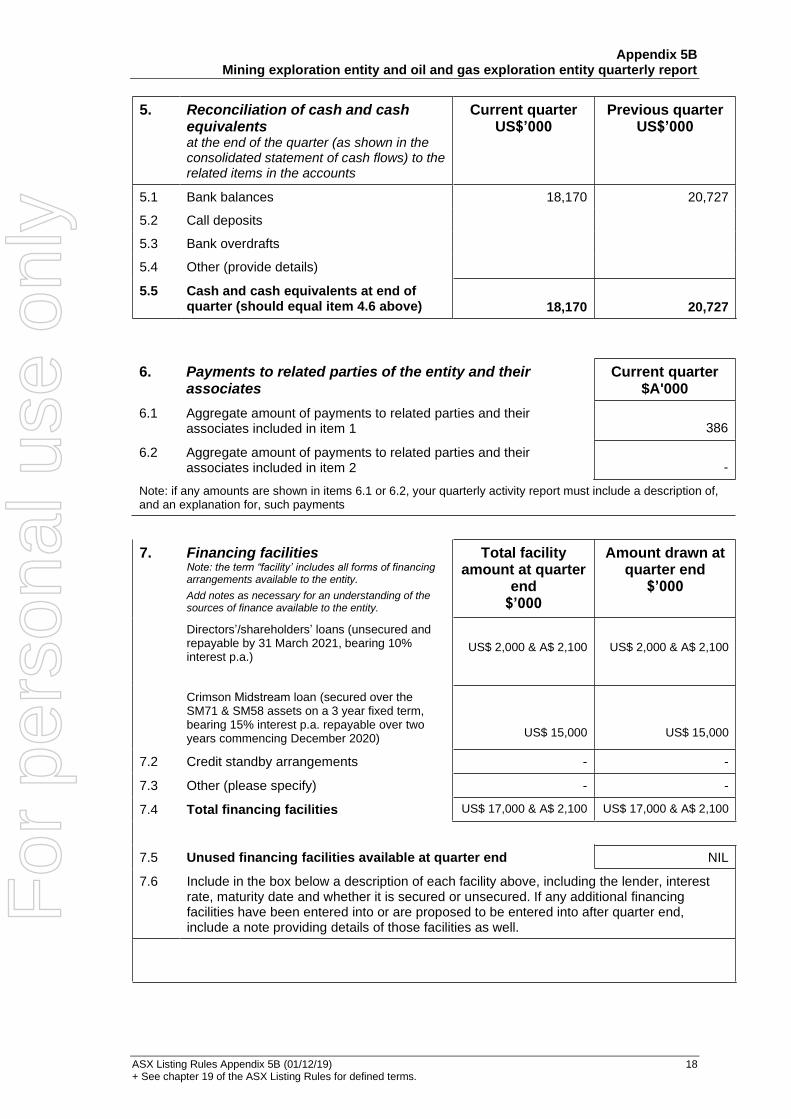
5.1 Bank balances 18,170 20,727
5.2 Call deposits
5.3 Bank overdrafts
5.4 Other (provide details)
5.5 Cash and cash equivalents at end of quarter (should equal item 4.6 above) 18,170 20,727
6. Payments to related parties of the entity and theirassociates
Current quarter $A'000
6.1 Aggregate amount of payments to related parties and theirassociates included in item 1 386
6.2 Aggregate amount of payments to related parties and theirassociates included in item 2 -
Note: if any amounts are shown in items 6.1 or 6.2, your quarterly activity report must include a description of, and an explanation for, such payments
7. Financing facilities Total facility amount at quarter
end $’000
Amount drawn at quarter end
$’000
US$ 2,000 & A$ 2,100 US$ 2,000 & A$ 2,100
US$ 15,000 US$ 15,000
7.2 - -
7.3 - -
7.4
Note: the term “facility’ includes all forms of financingarrangements available to the entity.
Add notes as necessary for an understanding of thesources of finance available to the entity.
Directors’/shareholders’ loans (unsecured andrepayable by 31 March 2021, bearing 10%interest p.a.)
Crimson Midstream loan (secured over theSM71 & SM58 assets on a 3 year fixed term, bearing 15% interest p.a. repayable over two years commencing December 2020)
Credit standby arrangements
Other (please specify)
Total financing facilities US$ 17,000 & A$ 2,100 US$ 17,000 & A$ 2,100
7.5 Unused financing facilities available at quarter end NIL
7.6 Include in the box below a description of each facility above, including the lender, interest rate, maturity date and whether it is secured or unsecured. If any additional financing facilities have been entered into or are proposed to be entered into after quarter end, include a note providing details of those facilities as well.
For
per
sona
l use
onl
y
Appendix 5B Mining exploration entity and oil and gas exploration entity quarterly report
ASX Listing Rules Appendix 5B (01/12/19) 19 + See chapter 19 of the ASX Listing Rules for defined terms.
8. Estimated cash available for future operating activities US$’000
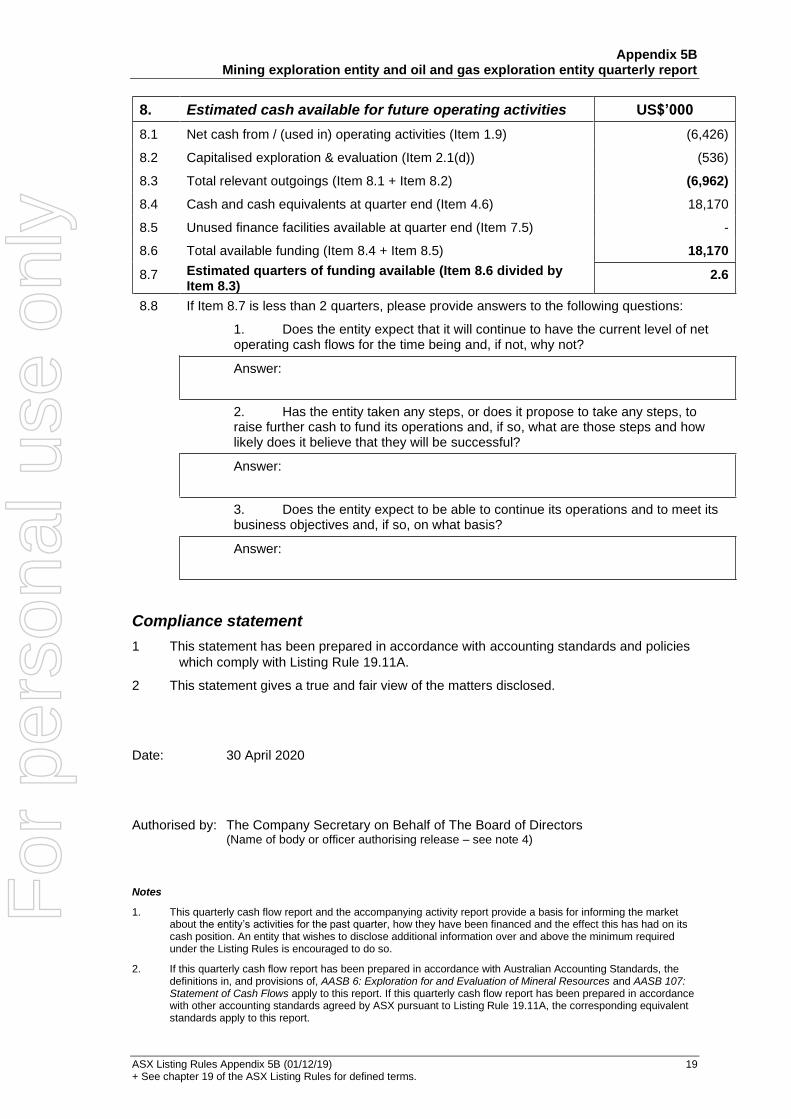
8.1 Net cash from / (used in) operating activities (Item 1.9) (6,426)
8.2 Capitalised exploration & evaluation (Item 2.1(d)) (536)
8.3 Total relevant outgoings (Item 8.1 + Item 8.2) (6,962)
8.4 Cash and cash equivalents at quarter end (Item 4.6) 18,170
8.5 Unused finance facilities available at quarter end (Item 7.5) -
8.6 Total available funding (Item 8.4 + Item 8.5) 18,170
8.7 Estimated quarters of funding available (Item 8.6 divided by Item 8.3)
2.6
8.8 If Item 8.7 is less than 2 quarters, please provide answers to the following questions:
1. Does the entity expect that it will continue to have the current level of netoperating cash flows for the time being and, if not, why not?
Answer:
2. Has the entity taken any steps, or does it propose to take any steps, toraise further cash to fund its operations and, if so, what are those steps and howlikely does it believe that they will be successful?
Answer:
3. Does the entity expect to be able to continue its operations and to meet itsbusiness objectives and, if so, on what basis?
Answer:
Compliance statement
1 This statement has been prepared in accordance with accounting standards and policies
which comply with Listing Rule 19.11A.
2 This statement gives a true and fair view of the matters disclosed.
Date: 30 April 2020
Authorised by: The Company Secretary on Behalf of The Board of Directors (Name of body or officer authorising release – see note 4)
Notes
1. This quarterly cash flow report and the accompanying activity report provide a basis for informing the marketabout the entity’s activities for the past quarter, how they have been financed and the effect this has had on itscash position. An entity that wishes to disclose additional information over and above the minimum requiredunder the Listing Rules is encouraged to do so.
2. If this quarterly cash flow report has been prepared in accordance with Australian Accounting Standards, thedefinitions in, and provisions of, AASB 6: Exploration for and Evaluation of Mineral Resources and AASB 107:Statement of Cash Flows apply to this report. If this quarterly cash flow report has been prepared in accordancewith other accounting standards agreed by ASX pursuant to Listing Rule 19.11A, the corresponding equivalentstandards apply to this report.
For
per
sona
l use
onl
y

Appendix 5B Mining exploration entity and oil and gas exploration entity quarterly report
ASX Listing Rules Appendix 5B (01/12/19) 20 + See chapter 19 of the ASX Listing Rules for defined terms.
3. Dividends received may be classified either as cash flows from operating activities or cash flows from investingactivities, depending on the accounting policy of the entity.
4. If this report has been authorised for release to the market by your board of directors, you can insert here: “Bythe board”. If it has been authorised for release to the market by a committee of your board of directors, you caninsert here: “By the [name of board committee – eg Audit and Risk Committee]”. If it has been authorised forrelease to the market by a disclosure committee, you can insert here: “By the Disclosure Committee”.
5. If this report has been authorised for release to the market by your board of directors and you wish to holdyourself out as complying with recommendation 4.2 of the ASX Corporate Governance Council’s CorporateGovernance Principles and Recommendations, the board should have received a declaration from its CEO andCFO that, in their opinion, the financial records of the entity have been properly maintained, that this reportcomplies with the appropriate accounting standards and gives a true and fair view of the cash flows of the entity,and that their opinion has been formed on the basis of a sound system of risk management and internal controlwhich is operating effectively.
For
per
sona
l use
onl
y