Embed Size (px)
Citation preview

Quarterly report
January-September 2014We work for a better future for people
3Q14
3Q14

Contents 2 BBVA Group Highlights
3 Group information Relevant events ........................................................................................................................................................................................................................................................... 3
Earnings ................................................................................................................................................................................................................................................................................ 4
Balance sheet and business activity ................................................................................................................................................................................................ 10
Capital base .................................................................................................................................................................................................................................................................... 12
Risk management ................................................................................................................................................................................................................................................... 13
The BBVA share ......................................................................................................................................................................................................................................................... 16
Environmental and Social Governance ......................................................................................................................................................................................... 17
18 Business areas Banking activity in Spain ............................................................................................................................................................................................................................... 20
Real-estate activity in Spain ........................................................................................................................................................................................................................ 24
The United States .................................................................................................................................................................................................................................................. 26
Eurasia ................................................................................................................................................................................................................................................................................ 29
Mexico .................................................................................................................................................................................................................................................................................. 33
South America ........................................................................................................................................................................................................................................................... 36
Corporate Center .................................................................................................................................................................................................................................................... 40
Other information: Corporate & Investment Banking ................................................................................................................................................ 42
46 Annex
January-September2014
Quarterly report
2 BBVA Group Highlights
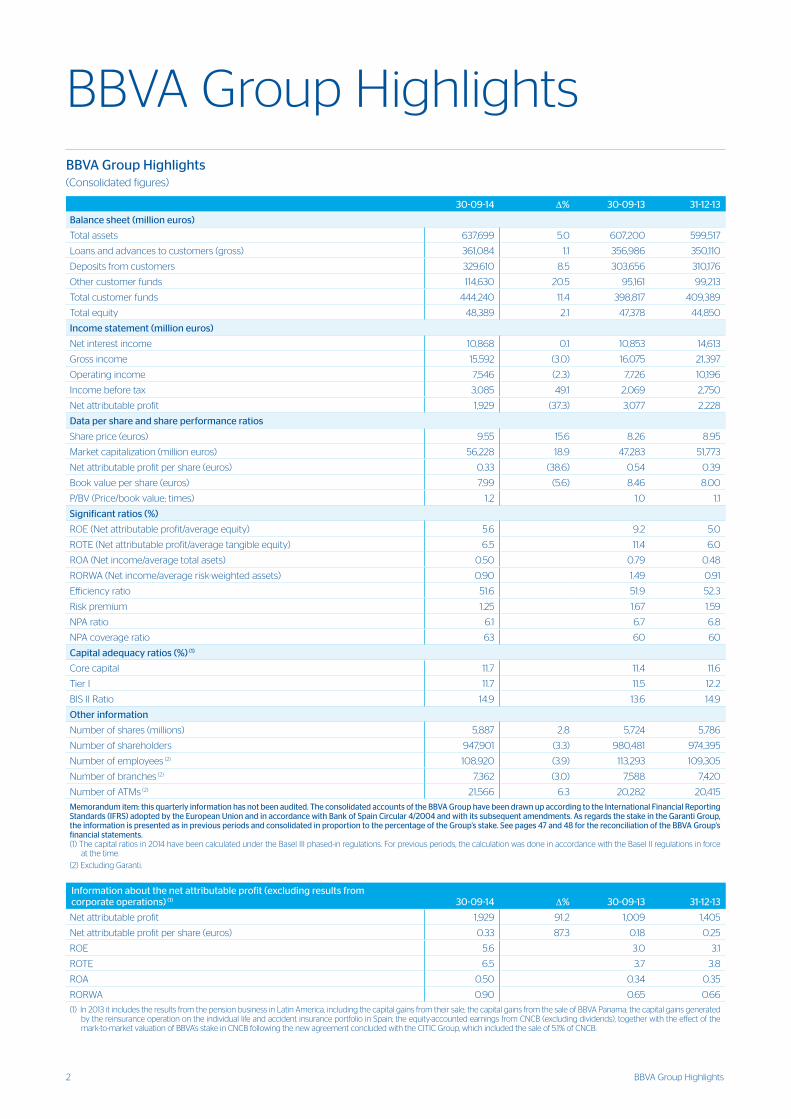
BBVA Group HighlightsBBVA Group Highlights (Consolidated figures)
30-09-14 ∆% 30-09-13 31-12-13
Balance sheet (million euros)
Total assets 637,699 5.0 607,200 599,517
Loans and advances to customers (gross) 361,084 1.1 356,986 350,110
Deposits from customers 329,610 8.5 303,656 310,176
Other customer funds 114,630 20.5 95,161 99,213
Total customer funds 444,240 11.4 398,817 409,389
Total equity 48,389 2.1 47,378 44,850
Income statement (million euros)
Net interest income 10,868 0.1 10,853 14,613
Gross income 15,592 (3.0) 16,075 21,397
Operating income 7,546 (2.3) 7,726 10,196
Income before tax 3,085 49.1 2,069 2,750
Net attributable profit 1,929 (37.3) 3,077 2,228
Data per share and share performance ratios
Share price (euros) 9.55 15.6 8.26 8.95
Market capitalization (million euros) 56,228 18.9 47,283 51,773
Net attributable profit per share (euros) 0.33 (38.6) 0.54 0.39
Book value per share (euros) 7.99 (5.6) 8.46 8.00
P/BV (Price/book value; times) 1.2 1.0 1.1
Significant ratios (%)
ROE (Net attributable profit/average equity) 5.6 9.2 5.0
ROTE (Net attributable profit/average tangible equity) 6.5 11.4 6.0
ROA (Net income/average total asets) 0.50 0.79 0.48
RORWA (Net income/average risk-weighted assets) 0.90 1.49 0.91
Efficiency ratio 51.6 51.9 52.3
Risk premium 1.25 1.67 1.59
NPA ratio 6.1 6.7 6.8
NPA coverage ratio 63 60 60
Capital adequacy ratios (%) (1)
Core capital 11.7 11.4 11.6
Tier I 11.7 11.5 12.2
BIS II Ratio 14.9 13.6 14.9
Other information
Number of shares (millions) 5,887 2.8 5,724 5,786
Number of shareholders 947,901 (3.3) 980,481 974,395
Number of employees (2) 108,920 (3.9) 113,293 109,305
Number of branches (2) 7,362 (3.0) 7,588 7,420
Number of ATMs (2) 21,566 6.3 20,282 20,415
Memorandum item: this quarterly information has not been audited. The consolidated accounts of the BBVA Group have been drawn up according to the International Financial Reporting Standards (IFRS) adopted by the European Union and in accordance with Bank of Spain Circular 4/2004 and with its subsequent amendments. As regards the stake in the Garanti Group, the information is presented as in previous periods and consolidated in proportion to the percentage of the Group’s stake. See pages 47 and 48 for the reconciliation of the BBVA Group’s financial statements.(1) The capital ratios in 2014 have been calculated under the Basel III phased-in regulations. For previous periods, the calculation was done in accordance with the Basel II regulations in force
at the time.
(2) Excluding Garanti.
Information about the net attributable profit (excluding results from corporate operations) (1) 30-09-14 ∆% 30-09-13 31-12-13
Net attributable profit 1,929 91.2 1,009 1,405
Net attributable profit per share (euros) 0.33 87.3 0.18 0.25
ROE 5.6 3.0 3.1
ROTE 6.5 3.7 3.8
ROA 0.50 0.34 0.35
RORWA 0.90 0.65 0.66
(1) In 2013 it includes the results from the pension business in Latin America, including the capital gains from their sale; the capital gains from the sale of BBVA Panama; the capital gains generated by the reinsurance operation on the individual life and accident insurance portfolio in Spain; the equity-accounted earnings from CNCB (excluding dividends), together with the effect of the mark-to-market valuation of BBVA’s stake in CNCB following the new agreement concluded with the CITIC Group, which included the sale of 5.1% of CNCB.
3Relevant events
The outstanding features of the BBVA Group’s earnings in the
third quarter of 2014 are in line with the previous quarter:
1. The recovery in exchange rates of most currencies against
the euro continues, easing the cumulative negative effect
over the last 12 months.
2. The most relevant aspect as regards earnings is once more
the positive performance of the more recurring revenue. Net
trading income (NTI) is slightly higher than in the previous
quarter, while the negative impact of hyperinflation in
Venezuela is very similar. Meanwhile, operating expenses
and loan-loss provisions were up slightly, though their
year-on-year growth is limited. As a result, the quarterly net
profit after tax for ongoing operations was €733m. There
was no significant revenue from dividends, as those from
Telefónica and China Citic Bank (CNCB) were registered in
the previous quarter. The net attributable profit for the first
nine months of the year stands at €1,929m.
3. With respect to business activity, the loan book in South
America, Mexico and the United States has maintained its
positive growth rate. In Eurasia, lending in Garanti continues
to increase notably, while in Spain the recovery of new
lending from some business segments is making progress,
although at moderate levels. The trend in customer funds
remains favorable in all geographical areas.
4. The Group’s liquidity position and funding structure
continue to improve, due to a number of factors: the current
positive situation of the wholesale funding markets; the
new targeted longer-term refinancing operations (TLTRO)
program announced by the European Central Bank (ECB);
continued access to the market by BBVA and its franchises;
and the increased weighting in the volume of retail deposits.
BBVA borrowed €2.6 billion at the TLTRO auction held in
September.
5. In solvency, BBVA maintains its capital ratios well above
the minimum levels required by the new regulations. It
closed September 2014 with core capital and Tier I at 11.7%,
Tier II at 3.2% and a BIS III ratio of 14.7% (all phased-in). The
Group’s leverage ratio (fully-loaded) stands at 5.7%, which
compares favorably with its peer group. As a result, it has
been confident about the outcome of the comprehensive
assessment process. Its results, published on October 26,
show that BBVA has surpassed the stress test easily, both the
base and the adverse scenarios.
6. The main risk indicators continue their positive trend, with
a 28 basis-point reduction in the Group’s NPA ratio over the
last three months to 6.1%, thanks to the continued decline
in the non-performing portfolio. The Group’s coverage ratio
has also improved to 63% and the accumulated cost of risk
through September fell to 1.25%.
7. Other highlights in the period include:
• With respect to shareholder remuneration, a bonus
share issue was carried out at the start of October
to implement the “dividend option”. The holders of
85.1% of the free allocation rights chose to receive new
shares, which once more confirms the success of this
remuneration system.
• BBVA continues to make progress in its digital
transformation, designed to develop new distribution
channels and increase the Group’s profitability by
reducing costs and raising productivity ratios per
customer.
– The number of active customers using mobile devices
stands at 3.6 million, according to the latest available
data at the close of August. The figure rises to 8.4
million taking into account customers active on digital
platforms.
– In South America, the bank already has more than
3 million digital customers, a year-on-year increase
of 30%. Meanwhile, customers using cell phones for
making payments number a million, three times the
figure 12 months previously.
– The mobile payment application BBVA Wallet has
incorporated additional features and now registers
280,000 downloads in Spain. BBVA is also the first
financial group in the world to launch a NFC mobile
payment solution that uses the cloud-based Visa
specification. The new system allows BBVA customers
with Android NFC-equipped terminals to make
contactless purchases by simply downloading the
updated application.
– Lastly, it is worth highlighting that the Group currently
has one of the best technological platforms in the
banking industry, allowing 260 million transactions to
be processed every day (compared with 90 million in
2006).
Group information
Relevant events
4 Group information
Earnings in the third quarter of 2014 for the
BBVA Group are marked in general by the
same elements present in previous quarters, in
addition to the recovery of the exchange rates
of most currencies against the euro in recent
months, which has offset some of its negative
effect early in the year. These key factors are:
1. Positive performance of more recurring
revenue, particularly net interest income
in all the geographical areas, although the
improvement in income from fees and
commissions has also been significant.
2. NTI slightly higher than in the second
quarter.
3. No significant revenue from dividends.
4. Negative impact of the adjustment for
hyperinflation in Venezuela, very similar to
the preceding quarter.
5. Operating expenses and loan-loss
provisions were somewhat higher than those
registered between April and June, although
with a limited year-on-year growth rate.
Earnings
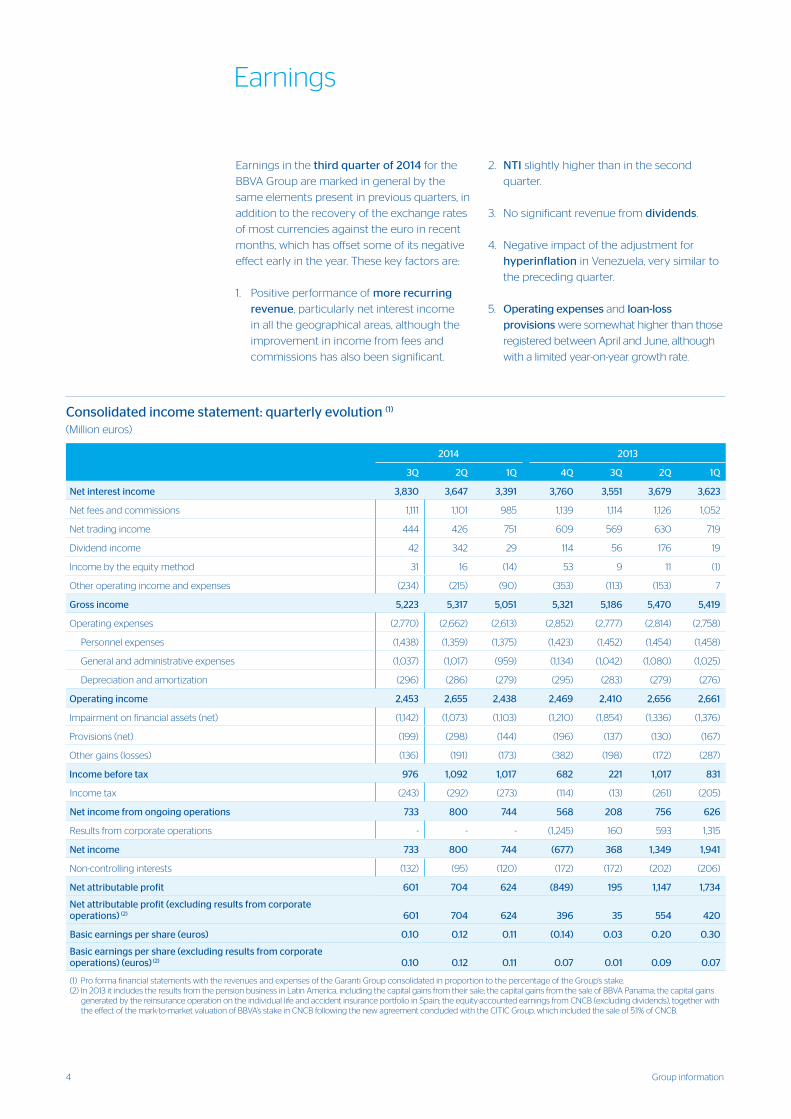
Consolidated income statement: quarterly evolution (1)
(Million euros)
2014 2013
3Q 2Q 1Q 4Q 3Q 2Q 1Q
Net interest income 3,830 3,647 3,391 3,760 3,551 3,679 3,623
Net fees and commissions 1,111 1,101 985 1,139 1,114 1,126 1,052
Net trading income 444 426 751 609 569 630 719
Dividend income 42 342 29 114 56 176 19
Income by the equity method 31 16 (14) 53 9 11 (1)
Other operating income and expenses (234) (215) (90) (353) (113) (153) 7
Gross income 5,223 5,317 5,051 5,321 5,186 5,470 5,419
Operating expenses (2,770) (2,662) (2,613) (2,852) (2,777) (2,814) (2,758)
Personnel expenses (1,438) (1,359) (1,375) (1,423) (1,452) (1,454) (1,458)
General and administrative expenses (1,037) (1,017) (959) (1,134) (1,042) (1,080) (1,025)
Depreciation and amortization (296) (286) (279) (295) (283) (279) (276)
Operating income 2,453 2,655 2,438 2,469 2,410 2,656 2,661
Impairment on financial assets (net) (1,142) (1,073) (1,103) (1,210) (1,854) (1,336) (1,376)
Provisions (net) (199) (298) (144) (196) (137) (130) (167)
Other gains (losses) (136) (191) (173) (382) (198) (172) (287)
Income before tax 976 1,092 1,017 682 221 1,017 831
Income tax (243) (292) (273) (114) (13) (261) (205)
Net income from ongoing operations 733 800 744 568 208 756 626
Results from corporate operations - - - (1,245) 160 593 1,315
Net income 733 800 744 (677) 368 1,349 1,941
Non-controlling interests (132) (95) (120) (172) (172) (202) (206)
Net attributable profit 601 704 624 (849) 195 1,147 1,734
Net attributable profit (excluding results from corporate operations) (2) 601 704 624 396 35 554 420
Basic earnings per share (euros) 0.10 0.12 0.11 (0.14) 0.03 0.20 0.30
Basic earnings per share (excluding results from corporate operations) (euros) (2) 0.10 0.12 0.11 0.07 0.01 0.09 0.07
(1) Pro forma financial statements with the revenues and expenses of the Garanti Group consolidated in proportion to the percentage of the Group’s stake.(2) In 2013 it includes the results from the pension business in Latin America, including the capital gains from their sale; the capital gains from the sale of BBVA Panama; the capital gains
generated by the reinsurance operation on the individual life and accident insurance portfolio in Spain; the equity-accounted earnings from CNCB (excluding dividends), together with the effect of the mark-to-market valuation of BBVA’s stake in CNCB following the new agreement concluded with the CITIC Group, which included the sale of 5.1% of CNCB.
5Earnings
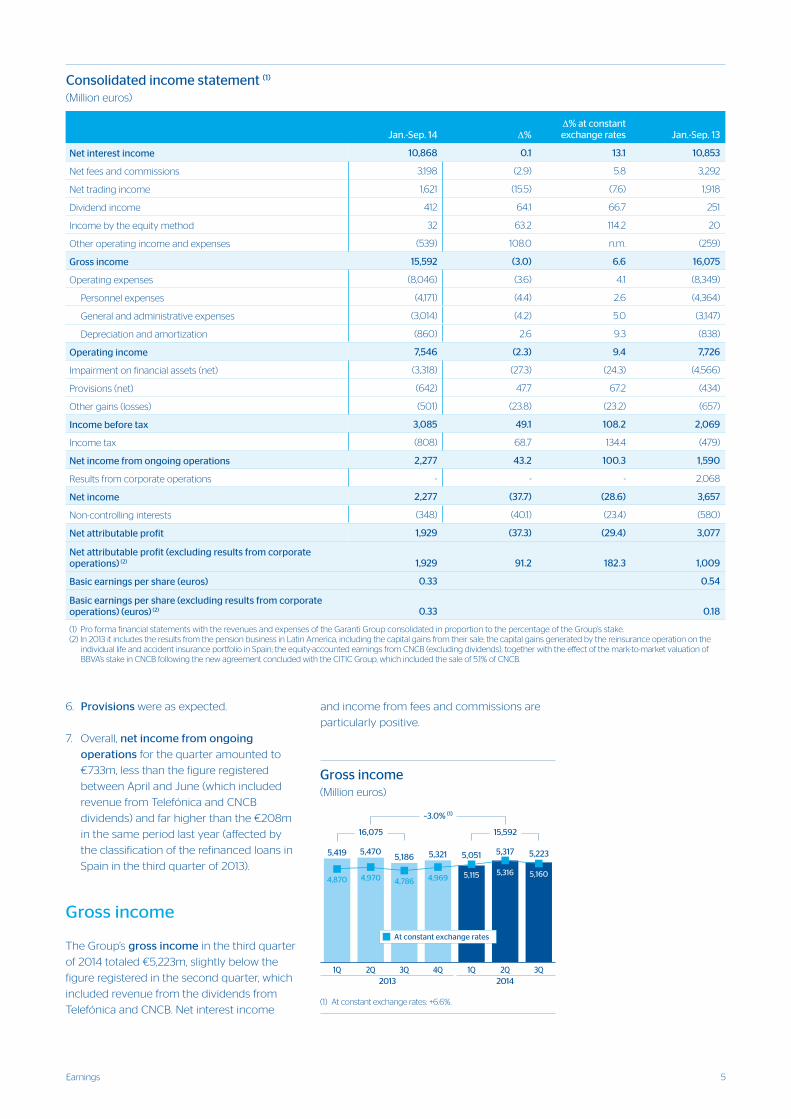
6. Provisions were as expected.
7. Overall, net income from ongoing
operations for the quarter amounted to
€733m, less than the figure registered
between April and June (which included
revenue from Telefónica and CNCB
dividends) and far higher than the €208m
in the same period last year (affected by
the classification of the refinanced loans in
Spain in the third quarter of 2013).
Gross income
The Group’s gross income in the third quarter
of 2014 totaled €5,223m, slightly below the
figure registered in the second quarter, which
included revenue from the dividends from
Telefónica and CNCB. Net interest income
and income from fees and commissions are
particularly positive.
Consolidated income statement (1) (Million euros)
Jan.-Sep. 14 ∆%∆% at constant exchange rates Jan.-Sep. 13
Net interest income 10,868 0.1 13.1 10,853
Net fees and commissions 3,198 (2.9) 5.8 3,292
Net trading income 1,621 (15.5) (7.6) 1,918
Dividend income 412 64.1 66.7 251
Income by the equity method 32 63.2 114.2 20
Other operating income and expenses (539) 108.0 n.m. (259)
Gross income 15,592 (3.0) 6.6 16,075
Operating expenses (8,046) (3.6) 4.1 (8,349)
Personnel expenses (4,171) (4.4) 2.6 (4,364)
General and administrative expenses (3,014) (4.2) 5.0 (3,147)
Depreciation and amortization (860) 2.6 9.3 (838)
Operating income 7,546 (2.3) 9.4 7,726
Impairment on financial assets (net) (3,318) (27.3) (24.3) (4,566)
Provisions (net) (642) 47.7 67.2 (434)
Other gains (losses) (501) (23.8) (23.2) (657)
Income before tax 3,085 49.1 108.2 2,069
Income tax (808) 68.7 134.4 (479)
Net income from ongoing operations 2,277 43.2 100.3 1,590
Results from corporate operations - - - 2,068
Net income 2,277 (37.7) (28.6) 3,657
Non-controlling interests (348) (40.1) (23.4) (580)
Net attributable profit 1,929 (37.3) (29.4) 3,077
Net attributable profit (excluding results from corporate operations) (2) 1,929 91.2 182.3 1,009
Basic earnings per share (euros) 0.33 0.54
Basic earnings per share (excluding results from corporate operations) (euros) (2) 0.33 0.18
(1) Pro forma financial statements with the revenues and expenses of the Garanti Group consolidated in proportion to the percentage of the Group’s stake.(2) In 2013 it includes the results from the pension business in Latin America, including the capital gains from their sale; the capital gains generated by the reinsurance operation on the
individual life and accident insurance portfolio in Spain; the equity-accounted earnings from CNCB (excluding dividends), together with the effect of the mark-to-market valuation of BBVA’s stake in CNCB following the new agreement concluded with the CITIC Group, which included the sale of 5.1% of CNCB.
���� �������� ����
���� ���� ���� ����
�
�����
�����
�����
�����
�����
�����
���� ��������
��������
�������� ����
�
�����
�����
�����
�����
�����
�����
�������� ������������������
��� ��������������� ���������������
� � � �
��������
����
���������� ���������� �����
�����
�����
�
������ ������
����� ����� ����� ����� ����� �����
�����
�
�����
��� ���������� �����������
6 Group information
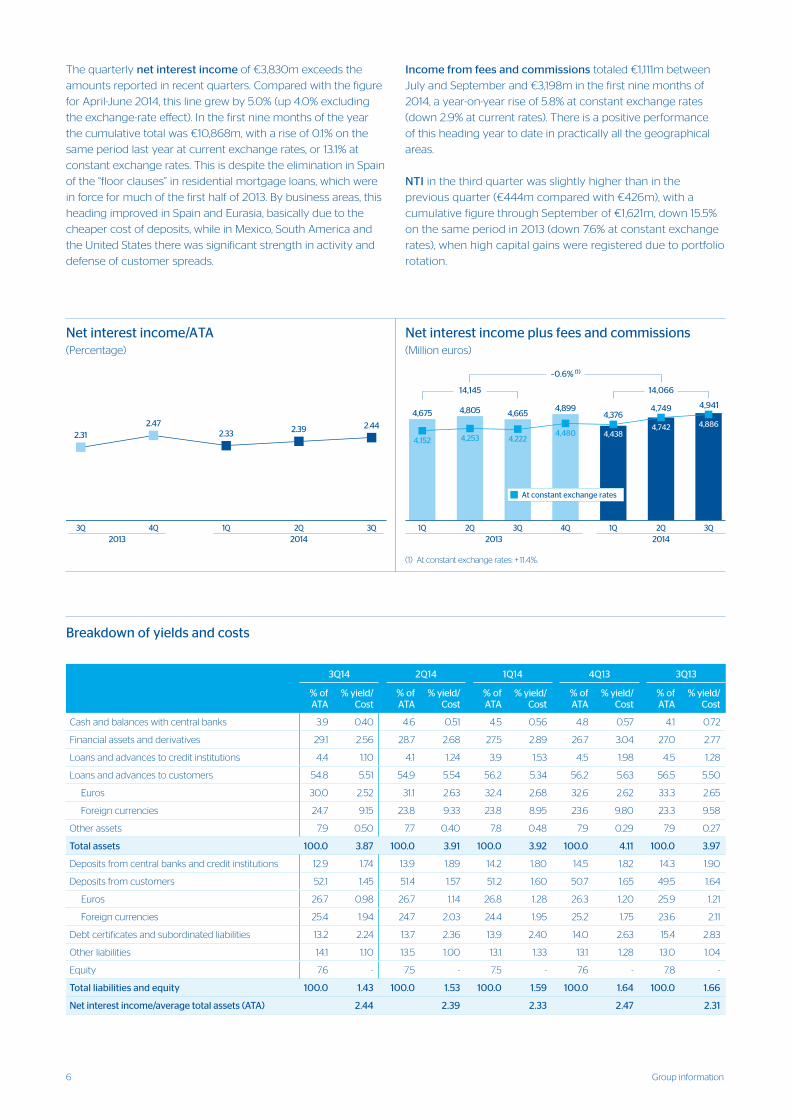
The quarterly net interest income of €3,830m exceeds the
amounts reported in recent quarters. Compared with the figure
for April-June 2014, this line grew by 5.0% (up 4.0% excluding
the exchange-rate effect). In the first nine months of the year
the cumulative total was €10,868m, with a rise of 0.1% on the
same period last year at current exchange rates, or 13.1% at
constant exchange rates. This is despite the elimination in Spain
of the “floor clauses” in residential mortgage loans, which were
in force for much of the first half of 2013. By business areas, this
heading improved in Spain and Eurasia, basically due to the
cheaper cost of deposits, while in Mexico, South America and
the United States there was significant strength in activity and
defense of customer spreads.
Income from fees and commissions totaled €1,111m between
July and September and €3,198m in the first nine months of
2014, a year-on-year rise of 5.8% at constant exchange rates
(down 2.9% at current rates). There is a positive performance
of this heading year to date in practically all the geographical
areas.
NTI in the third quarter was slightly higher than in the
previous quarter (€444m compared with €426m), with a
cumulative figure through September of €1,621m, down 15.5%
on the same period in 2013 (down 7.6% at constant exchange
rates), when high capital gains were registered due to portfolio
rotation.
�����������������������������������
�� �� ��� �� � ��
����
���
�������
����
�
�
�
�������
��
���
��
��������
���� ���� ��������
�������� ���� ����
����
���������������������������������������������
���������� ���������� ���� �������� ��� ���������������
��� ��������������� ������������ ����
���� ���� �������� ����
���� ���� ����
�
�����
�����
�����
�����
�����
�� �� �� ��
���������
����
���������� ����� �����
�����
������
�����
��
������ ������
����� ����� ���������� �����
�����
�����
��
�����
������ ����������� ������
Breakdown of yields and costs
3Q14 2Q14 1Q14 4Q13 3Q13
% of ATA
% yield/ Cost
% of ATA
% yield/ Cost
% of ATA
% yield/ Cost
% of ATA
% yield/ Cost
% of ATA
% yield/ Cost
Cash and balances with central banks 3.9 0.40 4.6 0.51 4.5 0.56 4.8 0.57 4.1 0.72
Financial assets and derivatives 29.1 2.56 28.7 2.68 27.5 2.89 26.7 3.04 27.0 2.77
Loans and advances to credit institutions 4.4 1.10 4.1 1.24 3.9 1.53 4.5 1.98 4.5 1.28
Loans and advances to customers 54.8 5.51 54.9 5.54 56.2 5.34 56.2 5.63 56.5 5.50
Euros 30.0 2.52 31.1 2.63 32.4 2.68 32.6 2.62 33.3 2.65
Foreign currencies 24.7 9.15 23.8 9.33 23.8 8.95 23.6 9.80 23.3 9.58
Other assets 7.9 0.50 7.7 0.40 7.8 0.48 7.9 0.29 7.9 0.27
Total assets 100.0 3.87 100.0 3.91 100.0 3.92 100.0 4.11 100.0 3.97
Deposits from central banks and credit institutions 12.9 1.74 13.9 1.89 14.2 1.80 14.5 1.82 14.3 1.90
Deposits from customers 52.1 1.45 51.4 1.57 51.2 1.60 50.7 1.65 49.5 1.64
Euros 26.7 0.98 26.7 1.14 26.8 1.28 26.3 1.20 25.9 1.21
Foreign currencies 25.4 1.94 24.7 2.03 24.4 1.95 25.2 1.75 23.6 2.11
Debt certificates and subordinated liabilities 13.2 2.24 13.7 2.36 13.9 2.40 14.0 2.63 15.4 2.83
Other liabilities 14.1 1.10 13.5 1.00 13.1 1.33 13.1 1.28 13.0 1.04
Equity 7.6 - 7.5 - 7.5 - 7.6 - 7.8 -
Total liabilities and equity 100.0 1.43 100.0 1.53 100.0 1.59 100.0 1.64 100.0 1.66
Net interest income/average total assets (ATA) 2.44 2.39 2.33 2.47 2.31
7Earnings
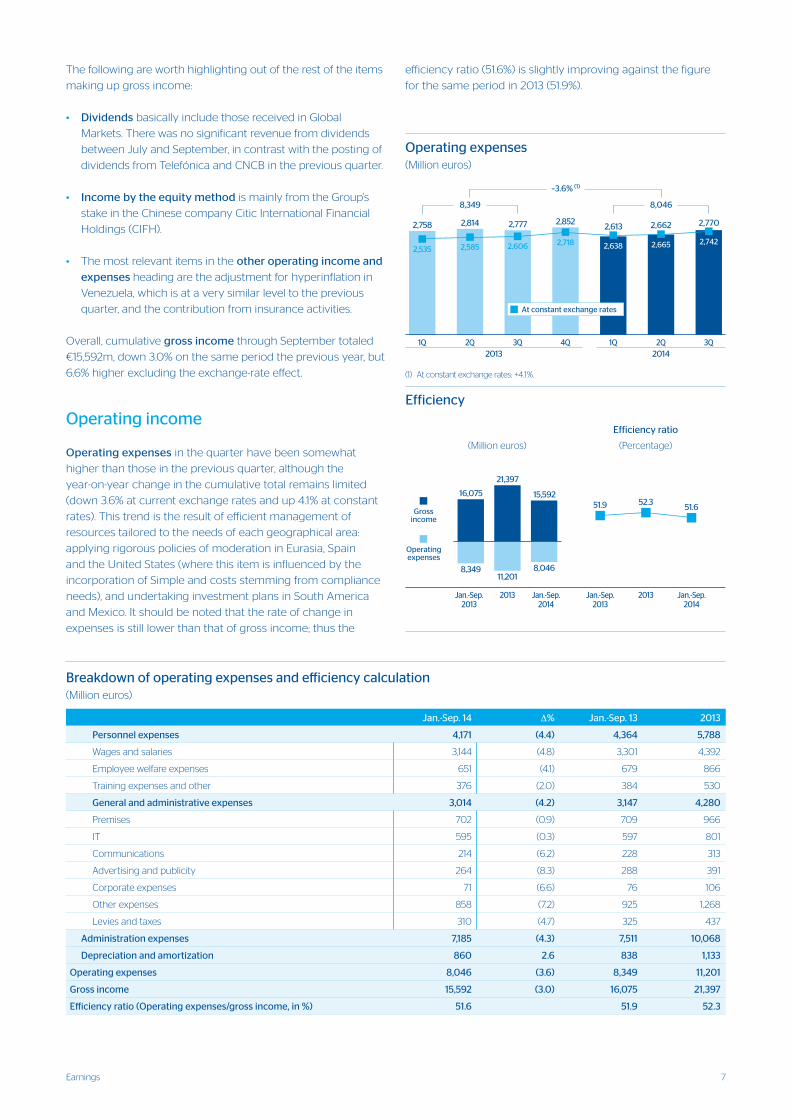
The following are worth highlighting out of the rest of the items
making up gross income:
• Dividends basically include those received in Global
Markets. There was no significant revenue from dividends
between July and September, in contrast with the posting of
dividends from Telefónica and CNCB in the previous quarter.
• Income by the equity method is mainly from the Group’s
stake in the Chinese company Citic International Financial
Holdings (CIFH).
• The most relevant items in the other operating income and
expenses heading are the adjustment for hyperinflation in
Venezuela, which is at a very similar level to the previous
quarter, and the contribution from insurance activities.
Overall, cumulative gross income through September totaled
€15,592m, down 3.0% on the same period the previous year, but
6.6% higher excluding the exchange-rate effect.
Operating income
Operating expenses in the quarter have been somewhat
higher than those in the previous quarter, although the
year-on-year change in the cumulative total remains limited
(down 3.6% at current exchange rates and up 4.1% at constant
rates). This trend is the result of efficient management of
resources tailored to the needs of each geographical area:
applying rigorous policies of moderation in Eurasia, Spain
and the United States (where this item is influenced by the
incorporation of Simple and costs stemming from compliance
needs), and undertaking investment plans in South America
and Mexico. It should be noted that the rate of change in
expenses is still lower than that of gross income; thus the
efficiency ratio (51.6%) is slightly improving against the figure
for the same period in 2013 (51.9%).
Breakdown of operating expenses and efficiency calculation(Million euros)
Jan.-Sep. 14 ∆% Jan.-Sep. 13 2013
Personnel expenses 4,171 (4.4) 4,364 5,788
Wages and salaries 3,144 (4.8) 3,301 4,392
Employee welfare expenses 651 (4.1) 679 866
Training expenses and other 376 (2.0) 384 530
General and administrative expenses 3,014 (4.2) 3,147 4,280
Premises 702 (0.9) 709 966
IT 595 (0.3) 597 801
Communications 214 (6.2) 228 313
Advertising and publicity 264 (8.3) 288 391
Corporate expenses 71 (6.6) 76 106
Other expenses 858 (7.2) 925 1,268
Levies and taxes 310 (4.7) 325 437
Administration expenses 7,185 (4.3) 7,511 10,068
Depreciation and amortization 860 2.6 838 1,133
Operating expenses 8,046 (3.6) 8,349 11,201
Gross income 15,592 (3.0) 16,075 21,397
Efficiency ratio (Operating expenses/gross income, in %) 51.6 51.9 52.3
���� ���� ���� �������� ���� ���� ����
�
���
�����
�����
�����
�����
�����
�������� ����������������������
��� ��������������� ����������������
���� ���� ��������
���� �������� ����
�
�����
�����
�����
� � � �
���������
����
���������� ����� ����� �����
�����
�����
�
����� �����
����� ����� ����� ����� ����� �����
�����
�
�����
����������������� ������
����������
���� ���� ����
��
��
��
�����
�����
����
������
��� �
������������
�������
������
�
�����
������
������
������
������
���������������
���� �
�����
������
�����������
�����
����������
����������
����
��� ��� ���
����������
����������
����
�����������
�����������������
������������
����������������
8 Group information
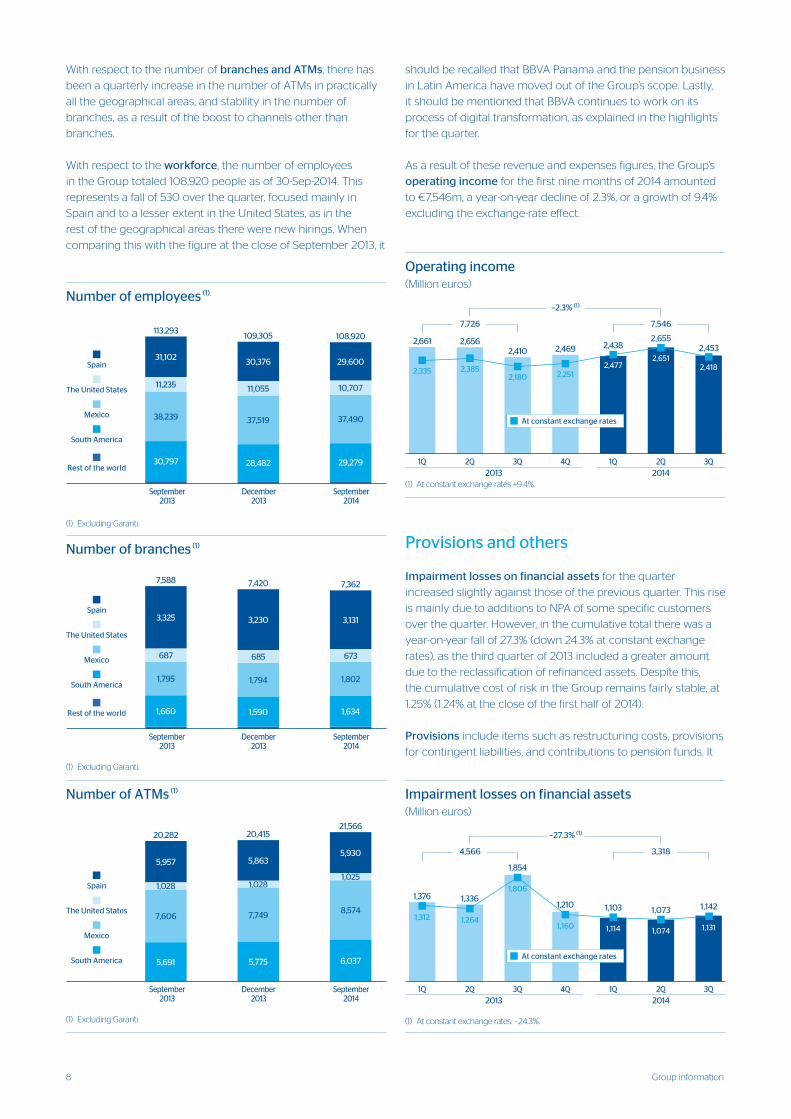
should be recalled that BBVA Panama and the pension business
in Latin America have moved out of the Group’s scope. Lastly,
it should be mentioned that BBVA continues to work on its
process of digital transformation, as explained in the highlights
for the quarter.
As a result of these revenue and expenses figures, the Group’s
operating income for the first nine months of 2014 amounted
to €7,546m, a year-on-year decline of 2.3%, or a growth of 9.4%
excluding the exchange-rate effect.
Provisions and others
Impairment losses on financial assets for the quarter
increased slightly against those of the previous quarter. This rise
is mainly due to additions to NPA of some specific customers
over the quarter. However, in the cumulative total there was a
year-on-year fall of 27.3% (down 24.3% at constant exchange
rates), as the third quarter of 2013 included a greater amount
due to the reclassification of refinanced assets. Despite this,
the cumulative cost of risk in the Group remains fairly stable, at
1.25% (1.24% at the close of the first half of 2014).
Provisions include items such as restructuring costs, provisions
for contingent liabilities, and contributions to pension funds. It
���� ����
����
�������� ���� ���� ����
�������������
������������������������������
��������� ������������������ ���������������
��� ��������������� �����������������
���� ����
����
���� ���� ���� ���� ����
�
�����
�����
�� �� �� ��
����������
����
���������� �����
�����
�����
������
�����
��
����� �����
����� �����
�����
����� ����� �����
�����
��
�����
� ��� �� ������������ �
With respect to the number of branches and ATMs, there has
been a quarterly increase in the number of ATMs in practically
all the geographical areas, and stability in the number of
branches, as a result of the boost to channels other than
branches.
With respect to the workforce, the number of employees
in the Group totaled 108,920 people as of 30-Sep-2014. This
represents a fall of 530 over the quarter, focused mainly in
Spain and to a lesser extent in the United States, as in the
rest of the geographical areas there were new hirings. When
comparing this with the figure at the close of September 2013, it
�����������������������
���� ��
�������� ��
����
��� ��
�����
��� ��
�����
�������� ��
�����
������
����
�����
��� ������������������
����
�������� ��
���
�����
�� ��
���� � �������������� ��� ������������������
��� �� ������
�������������� �� � ��
�������� ����� � �����
�� � �� ������� ��� ���
������ �� ��� �������
�����
�����
����
�����
������
������
�����
������
���������� ���
�������������
������������
������������������
��� ��
�����������
����
�� ��
�����
����
������
�����������
�� �
�����
����
�����
�����
������������
����
�����
���
�����
��� ������������������
� ����� ��� ���� ���������������������� ����������
������� ���� ����� ���
������ ������������
������� ��������������
������� ������� ��� ���
�
�����
������
������
�����
�����
����
������
������������
�������� �����
����������������������
� ���
�����������
� ���
� ���
� ���
���
� ���
������������
� ���
� ���
� ���
���
� ���
�����������
� ���
� ���
� ���
���
��� ������������������
� ����� ��� ���� ���������������������� ����������������� ������� �������
�� �� ����� � ���
�� ��� �� ��� �������
������� ������ �������
����� ����� ������
�����
�����
�����
�����
�����
�����
����
�����
���
������������
�����������������
��������������
������
���� �������� ���� ����
�������� ����
�
���
�����
�����
�����
�����
�����
�������� ��������������������
��� ��������������� ��������������
���� �������� ����
��������
���� ����
�
�����
�����
�����
�� �� �� ��
���������
����
���������� �����
����� �����
������
�����
��
����� �����
����� ���������� �����
����� �����
�����
��
�����
����������������� �������
9Earnings
���
���
���
���
������
��� ���
�
���
���
���
���
���
���
���
���
����������� �����������������������������������
��� ��������������� �����������������
���
���
��
���
������
��� ���
�
���
���
���
���
���
���
���
���
�� �� �� ��
����������
����
���
���
���
���
���
������
���
��
����� �����
���
��
���
������
���
��
������
�����������������������
����
����
����
����
��������
���� ����
����
����
����
����
����
����
����
���������� ������ ��������������������������� ������� ���������������
�� �� � ��
����
���
����
����
����
����
����
�����
����
��
���� ��
����
��
���
���
���
��
���
������
��� ���
����
�
���
���
���
���
���
���
���
���
��������� ��� ���������������������������������� ������� ����������������������
�� ������������������������������������
���
���
���
���
���
���
��� ���
����
�
���
���
���
���
���
���
���
���
����������
���
���
���
��
���
���
����� �����
���
���
����
���
������
���
�� �� �� ������
������
�� ��
���
����������������� �������
should be recalled that between April and June this heading
was higher due to the greater volume of restructuring costs
associated with the digitization and transformation process
being undertaken by the Group.
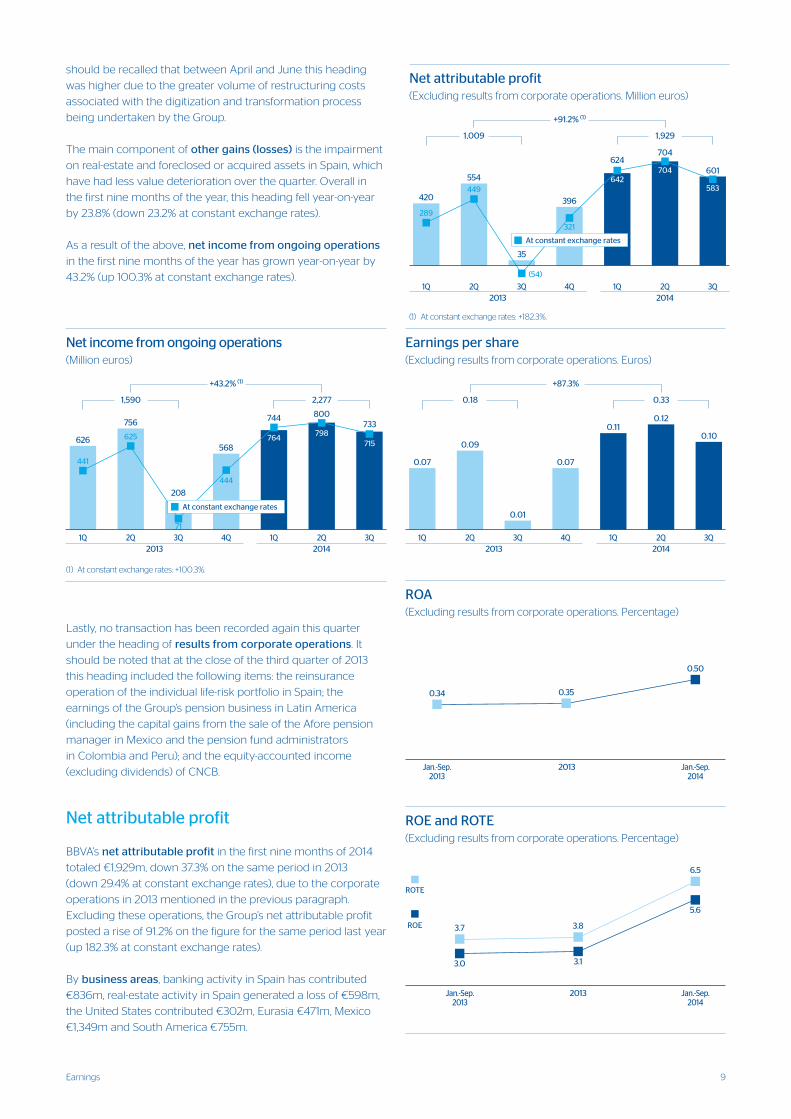
The main component of other gains (losses) is the impairment
on real-estate and foreclosed or acquired assets in Spain, which
have had less value deterioration over the quarter. Overall in
the first nine months of the year, this heading fell year-on-year
by 23.8% (down 23.2% at constant exchange rates).
As a result of the above, net income from ongoing operations
in the first nine months of the year has grown year-on-year by
43.2% (up 100.3% at constant exchange rates).
Lastly, no transaction has been recorded again this quarter
under the heading of results from corporate operations. It
should be noted that at the close of the third quarter of 2013
this heading included the following items: the reinsurance
operation of the individual life-risk portfolio in Spain; the
earnings of the Group’s pension business in Latin America
(including the capital gains from the sale of the Afore pension
manager in Mexico and the pension fund administrators
in Colombia and Peru); and the equity-accounted income
(excluding dividends) of CNCB.
Net attributable profit
BBVA’s net attributable profit in the first nine months of 2014
totaled €1,929m, down 37.3% on the same period in 2013
(down 29.4% at constant exchange rates), due to the corporate
operations in 2013 mentioned in the previous paragraph.
Excluding these operations, the Group’s net attributable profit
posted a rise of 91.2% on the figure for the same period last year
(up 182.3% at constant exchange rates).
By business areas, banking activity in Spain has contributed
€836m, real-estate activity in Spain generated a loss of €598m,
the United States contributed €302m, Eurasia €471m, Mexico
€1,349m and South America €755m.
������������������������������ ������� �������������������
���� ����
����
���
���
���� ����
����
�������������
���� �������������
��������������������������������������� ������� �������������������
�������������
���� ������������
��� ��
��
��� ���
���
�
�
��
��
��� ���
��
���
����
��� ��
��
10 Group information
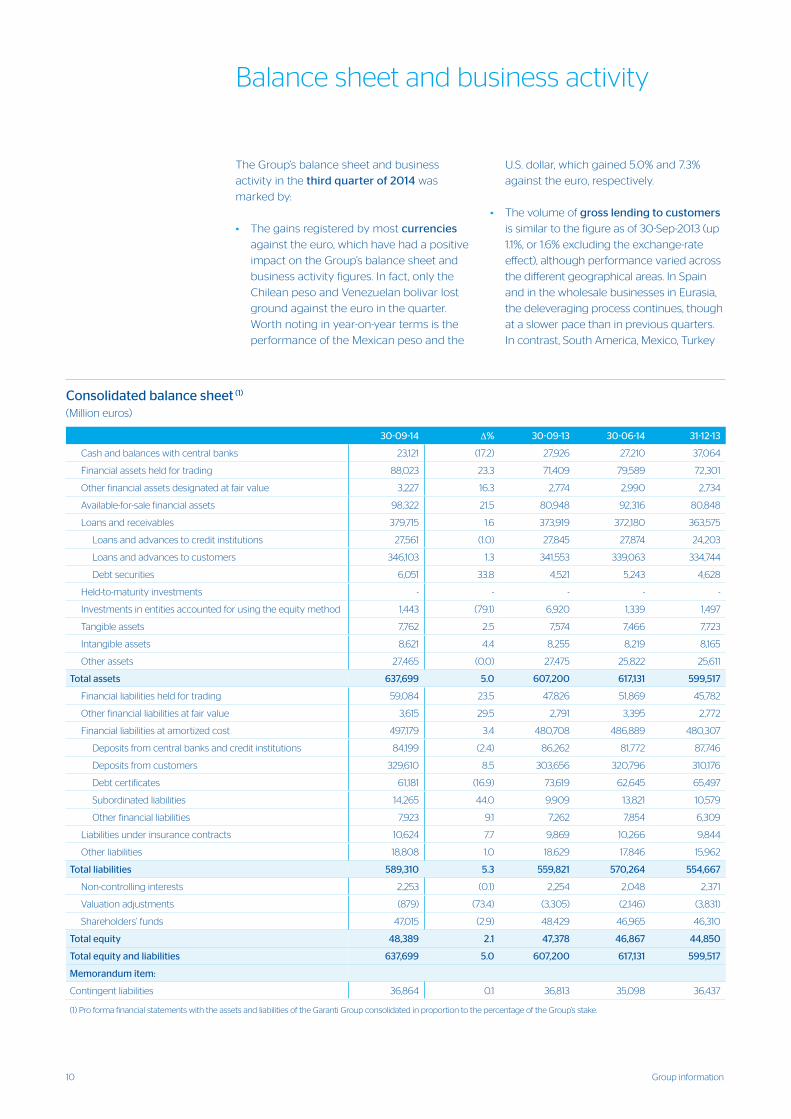
The Group’s balance sheet and business
activity in the third quarter of 2014 was
marked by:
• The gains registered by most currencies
against the euro, which have had a positive
impact on the Group’s balance sheet and
business activity figures. In fact, only the
Chilean peso and Venezuelan bolivar lost
ground against the euro in the quarter.
Worth noting in year-on-year terms is the
performance of the Mexican peso and the
U.S. dollar, which gained 5.0% and 7.3%
against the euro, respectively.
• The volume of gross lending to customers
is similar to the figure as of 30-Sep-2013 (up
1.1%, or 1.6% excluding the exchange-rate
effect), although performance varied across
the different geographical areas. In Spain
and in the wholesale businesses in Eurasia,
the deleveraging process continues, though
at a slower pace than in previous quarters.
In contrast, South America, Mexico, Turkey
Balance sheet and business activity
Consolidated balance sheet (1)
(Million euros)
30-09-14 ∆% 30-09-13 30-06-14 31-12-13
Cash and balances with central banks 23,121 (17.2) 27,926 27,210 37,064
Financial assets held for trading 88,023 23.3 71,409 79,589 72,301
Other financial assets designated at fair value 3,227 16.3 2,774 2,990 2,734
Available-for-sale financial assets 98,322 21.5 80,948 92,316 80,848
Loans and receivables 379,715 1.6 373,919 372,180 363,575
Loans and advances to credit institutions 27,561 (1.0) 27,845 27,874 24,203
Loans and advances to customers 346,103 1.3 341,553 339,063 334,744
Debt securities 6,051 33.8 4,521 5,243 4,628
Held-to-maturity investments - - - - -
Investments in entities accounted for using the equity method 1,443 (79.1) 6,920 1,339 1,497
Tangible assets 7,762 2.5 7,574 7,466 7,723
Intangible assets 8,621 4.4 8,255 8,219 8,165
Other assets 27,465 (0.0) 27,475 25,822 25,611
Total assets 637,699 5.0 607,200 617,131 599,517
Financial liabilities held for trading 59,084 23.5 47,826 51,869 45,782
Other financial liabilities at fair value 3,615 29.5 2,791 3,395 2,772
Financial liabilities at amortized cost 497,179 3.4 480,708 486,889 480,307
Deposits from central banks and credit institutions 84,199 (2.4) 86,262 81,772 87,746
Deposits from customers 329,610 8.5 303,656 320,796 310,176
Debt certificates 61,181 (16.9) 73,619 62,645 65,497
Subordinated liabilities 14,265 44.0 9,909 13,821 10,579
Other financial liabilities 7,923 9.1 7,262 7,854 6,309
Liabilities under insurance contracts 10,624 7.7 9,869 10,266 9,844
Other liabilities 18,808 1.0 18,629 17,846 15,962
Total liabilities 589,310 5.3 559,821 570,264 554,667
Non-controlling interests 2,253 (0.1) 2,254 2,048 2,371
Valuation adjustments (879) (73.4) (3,305) (2,146) (3,831)
Shareholders’ funds 47,015 (2.9) 48,429 46,965 46,310
Total equity 48,389 2.1 47,378 46,867 44,850
Total equity and liabilities 637,699 5.0 607,200 617,131 599,517
Memorandum item:
Contingent liabilities 36,864 0.1 36,813 35,098 36,437
(1) Pro forma financial statements with the assets and liabilities of the Garanti Group consolidated in proportion to the percentage of the Group’s stake.
11Balance sheet and business activity
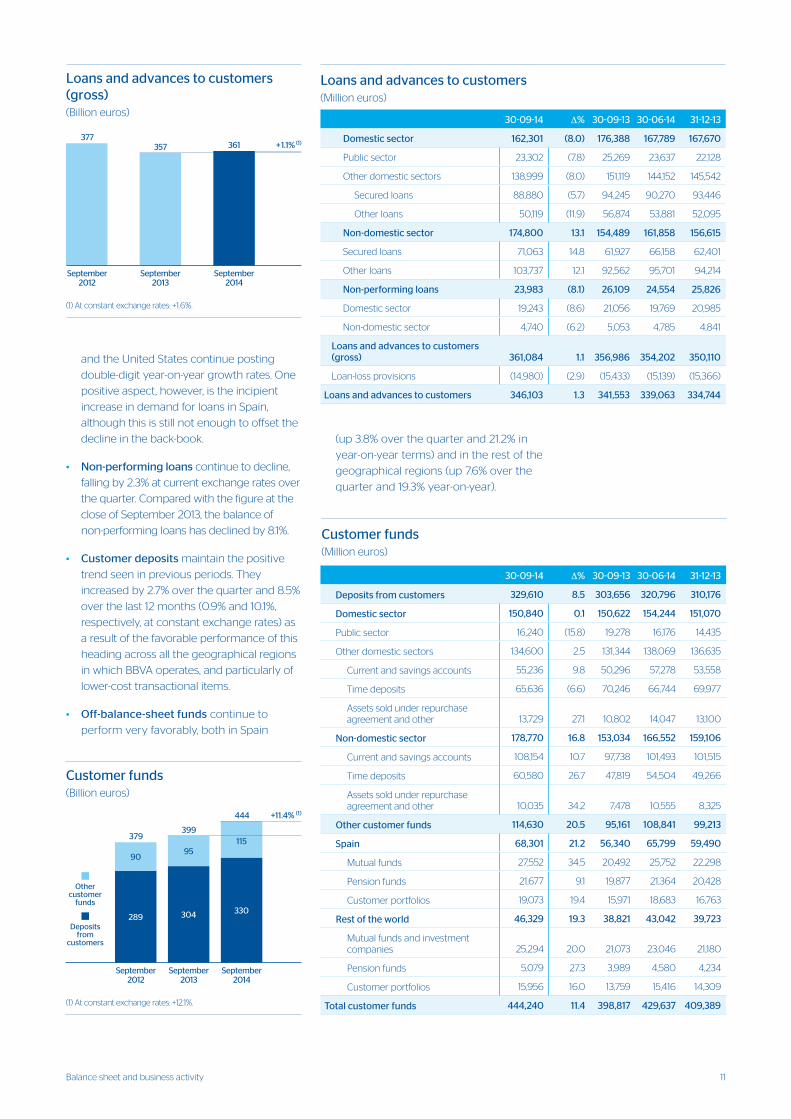
and the United States continue posting
double-digit year-on-year growth rates. One
positive aspect, however, is the incipient
increase in demand for loans in Spain,
although this is still not enough to offset the
decline in the back-book.
• Non-performing loans continue to decline,
falling by 2.3% at current exchange rates over
the quarter. Compared with the figure at the
close of September 2013, the balance of
non-performing loans has declined by 8.1%.
• Customer deposits maintain the positive
trend seen in previous periods. They
increased by 2.7% over the quarter and 8.5%
over the last 12 months (0.9% and 10.1%,
respectively, at constant exchange rates) as
a result of the favorable performance of this
heading across all the geographical regions
in which BBVA operates, and particularly of
lower-cost transactional items.
• Off-balance-sheet funds continue to
perform very favorably, both in Spain
(up 3.8% over the quarter and 21.2% in
year-on-year terms) and in the rest of the
geographical regions (up 7.6% over the
quarter and 19.3% year-on-year).
�����������������������������������������������������
� �
�����������
���
�����������
�����������
������������������� ���������������
��������� ���� ����
�
��
���
���
���
���
���
���
������
�����������������������������
���
���������� ��
���
���������� ��
���������� �
������������������� �����������������
��������
� ��
���
����
��
�
��
���
���
���
���
���
���
���
���
���
���
� �����
�������������
�����
������������
���������
Loans and advances to customers(Million euros)
30-09-14 ∆% 30-09-13 30-06-14 31-12-13
Domestic sector 162,301 (8.0) 176,388 167,789 167,670
Public sector 23,302 (7.8) 25,269 23,637 22,128
Other domestic sectors 138,999 (8.0) 151,119 144,152 145,542
Secured loans 88,880 (5.7) 94,245 90,270 93,446
Other loans 50,119 (11.9) 56,874 53,881 52,095
Non-domestic sector 174,800 13.1 154,489 161,858 156,615
Secured loans 71,063 14.8 61,927 66,158 62,401
Other loans 103,737 12.1 92,562 95,701 94,214
Non-performing loans 23,983 (8.1) 26,109 24,554 25,826
Domestic sector 19,243 (8.6) 21,056 19,769 20,985
Non-domestic sector 4,740 (6.2) 5,053 4,785 4,841
Loans and advances to customers (gross) 361,084 1.1 356,986 354,202 350,110
Loan-loss provisions (14,980) (2.9) (15,433) (15,139) (15,366)
Loans and advances to customers 346,103 1.3 341,553 339,063 334,744
Customer funds (Million euros)
30-09-14 ∆% 30-09-13 30-06-14 31-12-13
Deposits from customers 329,610 8.5 303,656 320,796 310,176
Domestic sector 150,840 0.1 150,622 154,244 151,070
Public sector 16,240 (15.8) 19,278 16,176 14,435
Other domestic sectors 134,600 2.5 131,344 138,069 136,635
Current and savings accounts 55,236 9.8 50,296 57,278 53,558
Time deposits 65,636 (6.6) 70,246 66,744 69,977
Assets sold under repurchase agreement and other 13,729 27.1 10,802 14,047 13,100
Non-domestic sector 178,770 16.8 153,034 166,552 159,106
Current and savings accounts 108,154 10.7 97,738 101,493 101,515
Time deposits 60,580 26.7 47,819 54,504 49,266
Assets sold under repurchase agreement and other 10,035 34.2 7,478 10,555 8,325
Other customer funds 114,630 20.5 95,161 108,841 99,213
Spain 68,301 21.2 56,340 65,799 59,490
Mutual funds 27,552 34.5 20,492 25,752 22,298
Pension funds 21,677 9.1 19,877 21,364 20,428
Customer portfolios 19,073 19.4 15,971 18,683 16,763
Rest of the world 46,329 19.3 38,821 43,042 39,723
Mutual funds and investment companies 25,294 20.0 21,073 23,046 21,180
Pension funds 5,079 27.3 3,989 4,580 4,234
Customer portfolios 15,956 16.0 13,759 15,416 14,309
Total customer funds 444,240 11.4 398,817 429,637 409,389
12 Group information
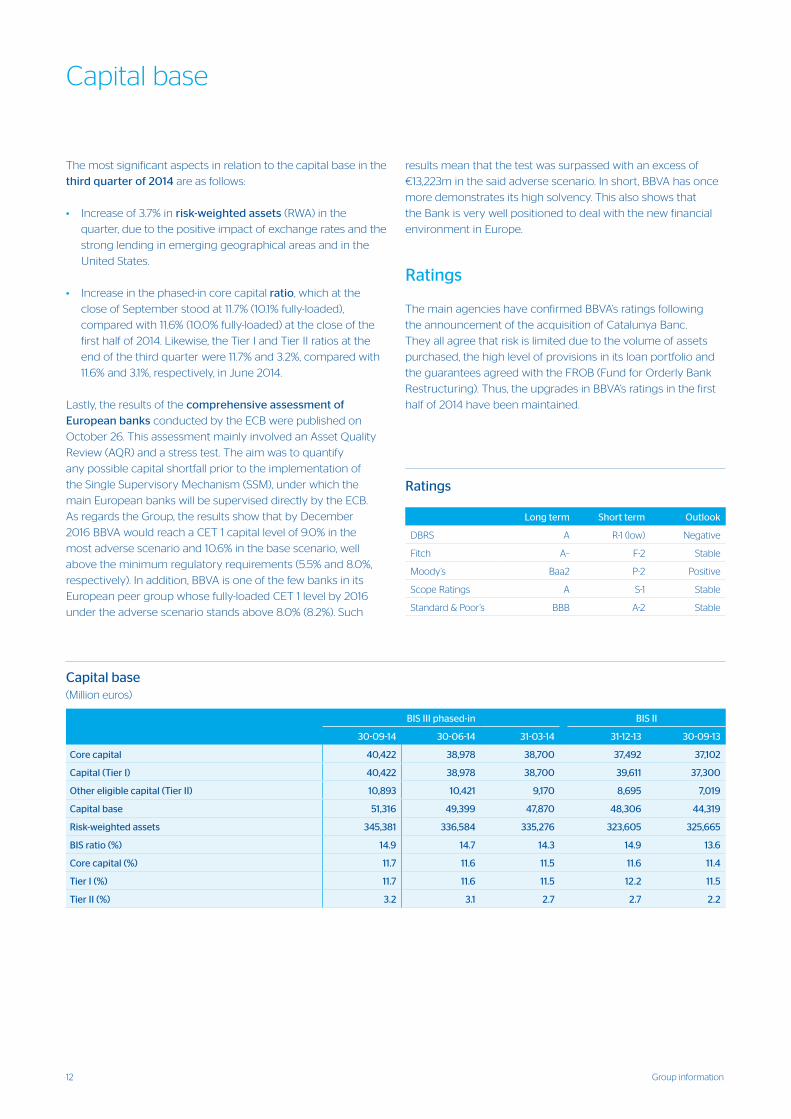
The most significant aspects in relation to the capital base in the
third quarter of 2014 are as follows:
• Increase of 3.7% in risk-weighted assets (RWA) in the
quarter, due to the positive impact of exchange rates and the
strong lending in emerging geographical areas and in the
United States.
• Increase in the phased-in core capital ratio, which at the
close of September stood at 11.7% (10.1% fully-loaded),
compared with 11.6% (10.0% fully-loaded) at the close of the
first half of 2014. Likewise, the Tier I and Tier II ratios at the
end of the third quarter were 11.7% and 3.2%, compared with
11.6% and 3.1%, respectively, in June 2014.
Lastly, the results of the comprehensive assessment of
European banks conducted by the ECB were published on
October 26. This assessment mainly involved an Asset Quality
Review (AQR) and a stress test. The aim was to quantify
any possible capital shortfall prior to the implementation of
the Single Supervisory Mechanism (SSM), under which the
main European banks will be supervised directly by the ECB.
As regards the Group, the results show that by December
2016 BBVA would reach a CET 1 capital level of 9.0% in the
most adverse scenario and 10.6% in the base scenario, well
above the minimum regulatory requirements (5.5% and 8.0%,
respectively). In addition, BBVA is one of the few banks in its
European peer group whose fully-loaded CET 1 level by 2016
under the adverse scenario stands above 8.0% (8.2%). Such
results mean that the test was surpassed with an excess of
€13,223m in the said adverse scenario. In short, BBVA has once
more demonstrates its high solvency. This also shows that
the Bank is very well positioned to deal with the new financial
environment in Europe.
Ratings
The main agencies have confirmed BBVA’s ratings following
the announcement of the acquisition of Catalunya Banc.
They all agree that risk is limited due to the volume of assets
purchased, the high level of provisions in its loan portfolio and
the guarantees agreed with the FROB (Fund for Orderly Bank
Restructuring). Thus, the upgrades in BBVA’s ratings in the first
half of 2014 have been maintained.
Capital base
Capital base(Million euros)
BIS III phased-in BIS II
30-09-14 30-06-14 31-03-14 31-12-13 30-09-13
Core capital 40,422 38,978 38,700 37,492 37,102
Capital (Tier I) 40,422 38,978 38,700 39,611 37,300
Other eligible capital (Tier II) 10,893 10,421 9,170 8,695 7,019
Capital base 51,316 49,399 47,870 48,306 44,319
Risk-weighted assets 345,381 336,584 335,276 323,605 325,665
BIS ratio (%) 14.9 14.7 14.3 14.9 13.6
Core capital (%) 11.7 11.6 11.5 11.6 11.4
Tier I (%) 11.7 11.6 11.5 12.2 11.5
Tier II (%) 3.2 3.1 2.7 2.7 2.2
Ratings
Long term Short term Outlook
DBRS A R-1 (low) Negative
Fitch A– F-2 Stable
Moody’s Baa2 P-2 Positive
Scope Ratings A S-1 Stable
Standard & Poor’s BBB A-2 Stable
13Risk management
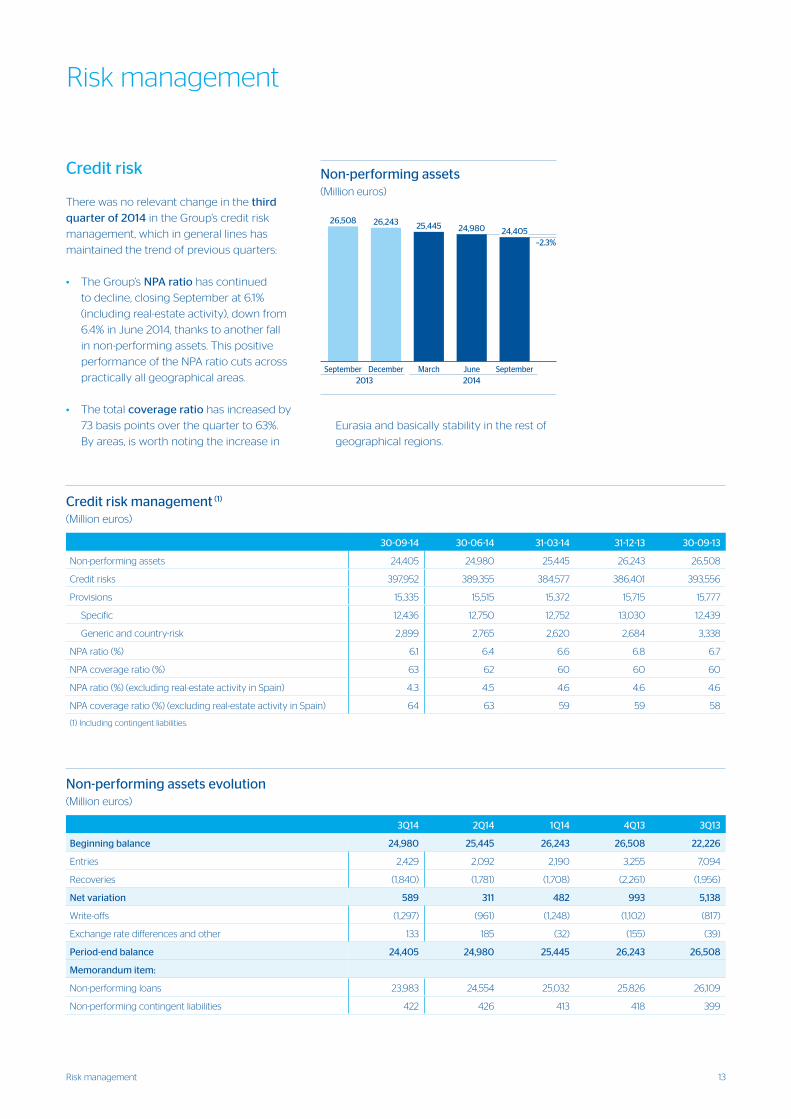
Credit risk
There was no relevant change in the third
quarter of 2014 in the Group’s credit risk
management, which in general lines has
maintained the trend of previous quarters:
• The Group’s NPA ratio has continued
to decline, closing September at 6.1%
(including real-estate activity), down from
6.4% in June 2014, thanks to another fall
in non-performing assets. This positive
performance of the NPA ratio cuts across
practically all geographical areas.
• The total coverage ratio has increased by
73 basis points over the quarter to 63%.
By areas, is worth noting the increase in
Eurasia and basically stability in the rest of
geographical regions.
Risk management
Non-performing assets evolution(Million euros)
3Q14 2Q14 1Q14 4Q13 3Q13
Beginning balance 24,980 25,445 26,243 26,508 22,226
Entries 2,429 2,092 2,190 3,255 7,094
Recoveries (1,840) (1,781) (1,708) (2,261) (1,956)
Net variation 589 311 482 993 5,138
Write-offs (1,297) (961) (1,248) (1,102) (817)
Exchange rate differences and other 133 185 (32) (155) (39)
Period-end balance 24,405 24,980 25,445 26,243 26,508
Memorandum item:
Non-performing loans 23,983 24,554 25,032 25,826 26,109
Non-performing contingent liabilities 422 426 413 418 399
Credit risk management (1)
(Million euros)
30-09-14 30-06-14 31-03-14 31-12-13 30-09-13
Non-performing assets 24,405 24,980 25,445 26,243 26,508
Credit risks 397,952 389,355 384,577 386,401 393,556
Provisions 15,335 15,515 15,372 15,715 15,777
Specific 12,436 12,750 12,752 13,030 12,439
Generic and country-risk 2,899 2,765 2,620 2,684 3,338
NPA ratio (%) 6.1 6.4 6.6 6.8 6.7
NPA coverage ratio (%) 63 62 60 60 60
NPA ratio (%) (excluding real-estate activity in Spain) 4.3 4.5 4.6 4.6 4.6
NPA coverage ratio (%) (excluding real-estate activity in Spain) 64 63 59 59 58
(1) Including contingent liabilities.
������������������������������������
��� � ��������� ��� ��� �
�
�����
������
������
������
������
������
�����������������
�����
�����
������
���������
���� �
����
����
����
��� ������������������� ������������������
� ����
�� �
� � � ��
���� �
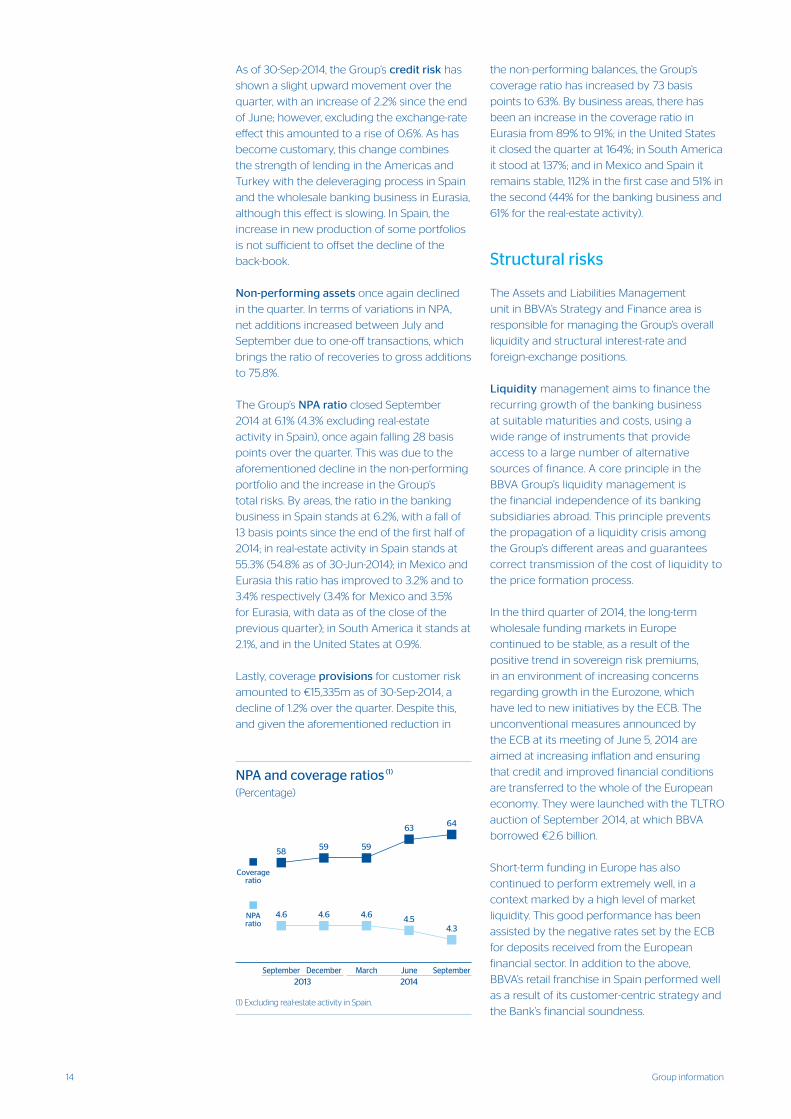
14 Group information
the non-performing balances, the Group’s
coverage ratio has increased by 73 basis
points to 63%. By business areas, there has
been an increase in the coverage ratio in
Eurasia from 89% to 91%; in the United States
it closed the quarter at 164%; in South America
it stood at 137%; and in Mexico and Spain it
remains stable, 112% in the first case and 51% in
the second (44% for the banking business and
61% for the real-estate activity).
Structural risks
The Assets and Liabilities Management
unit in BBVA’s Strategy and Finance area is
responsible for managing the Group’s overall
liquidity and structural interest-rate and
foreign-exchange positions.
Liquidity management aims to finance the
recurring growth of the banking business
at suitable maturities and costs, using a
wide range of instruments that provide
access to a large number of alternative
sources of finance. A core principle in the
BBVA Group’s liquidity management is
the financial independence of its banking
subsidiaries abroad. This principle prevents
the propagation of a liquidity crisis among
the Group’s different areas and guarantees
correct transmission of the cost of liquidity to
the price formation process.
In the third quarter of 2014, the long-term
wholesale funding markets in Europe
continued to be stable, as a result of the
positive trend in sovereign risk premiums,
in an environment of increasing concerns
regarding growth in the Eurozone, which
have led to new initiatives by the ECB. The
unconventional measures announced by
the ECB at its meeting of June 5, 2014 are
aimed at increasing inflation and ensuring
that credit and improved financial conditions
are transferred to the whole of the European
economy. They were launched with the TLTRO
auction of September 2014, at which BBVA
borrowed €2.6 billion.
Short-term funding in Europe has also
continued to perform extremely well, in a
context marked by a high level of market
liquidity. This good performance has been
assisted by the negative rates set by the ECB
for deposits received from the European
financial sector. In addition to the above,
BBVA’s retail franchise in Spain performed well
as a result of its customer-centric strategy and
the Bank’s financial soundness.
As of 30-Sep-2014, the Group’s credit risk has
shown a slight upward movement over the
quarter, with an increase of 2.2% since the end
of June; however, excluding the exchange-rate
effect this amounted to a rise of 0.6%. As has
become customary, this change combines
the strength of lending in the Americas and
Turkey with the deleveraging process in Spain
and the wholesale banking business in Eurasia,
although this effect is slowing. In Spain, the
increase in new production of some portfolios
is not sufficient to offset the decline of the
back-book.
Non-performing assets once again declined
in the quarter. In terms of variations in NPA,
net additions increased between July and
September due to one-off transactions, which
brings the ratio of recoveries to gross additions
to 75.8%.
The Group’s NPA ratio closed September
2014 at 6.1% (4.3% excluding real-estate
activity in Spain), once again falling 28 basis
points over the quarter. This was due to the
aforementioned decline in the non-performing
portfolio and the increase in the Group’s
total risks. By areas, the ratio in the banking
business in Spain stands at 6.2%, with a fall of
13 basis points since the end of the first half of
2014; in real-estate activity in Spain stands at
55.3% (54.8% as of 30-Jun-2014); in Mexico and
Eurasia this ratio has improved to 3.2% and to
3.4% respectively (3.4% for Mexico and 3.5%
for Eurasia, with data as of the close of the
previous quarter); in South America it stands at
2.1%, and in the United States at 0.9%.
Lastly, coverage provisions for customer risk
amounted to €15,335m as of 30-Sep-2014, a
decline of 1.2% over the quarter. Despite this,
and given the aforementioned reduction in
��������������������������
������������
�� �� ���� ��
�
��
��
��
��
��
��
��
��
�� �� �� ����
�
�
�
�
�
�
�
�
�
������������
�� �� ��
��� ��� ���
��
���
������������� �����������
����
������������������ �����������������������
��
���
��������
������������
15Risk management
The situation outside Europe has also
been very positive. BBVA has once again
strengthened its liquidity position in all the
jurisdictions in which the Group operates.
Of particular note is the senior debt issue by
BBVA Compass, which after seven years out of
the market has placed 1 billion dollars at 3 and
5-year maturities with an excellent uptake by
investors.
To sum up, BBVA’s proactive policy in its
liquidity management, the outstanding
performance of customer funds in all
geographical areas, its proven ability to access
the market, even in difficult environments, its
retail business model, and the lower volume
of maturities compared with its competitors,
all give it a comparative advantage against
its peers. Moreover, the increased proportion
of retail deposits continues to strengthen the
Group’s liquidity position and to improve its
financing structure.
Foreign-exchange risk management of BBVA’s
long-term investments, basically stemming
from its franchises abroad, aims to preserve
the Group’s capital adequacy ratios and ensure
the stability of its income statement.
The third quarter of this year saw reduced
exchange-rate volatility in emerging
currencies, in an environment marked by a
return of flows to emerging markets, stability
in U.S. interest rates and gains by the dollar
against the euro. In this context, BBVA has
maintained a policy of actively hedging its
investments in Mexico, Chile, Colombia,
Turkey and the dollar area. In addition to
this corporate-level hedging, dollar positions
are held at a local level by some of the
subsidiary banks. The foreign-exchange
risk of the earnings expected from abroad
for 2014 is also managed. Accordingly, the
impact of variations in exchange rates in the
third quarter of 2014, including the hedging
positions held, has been positive on the
Group’s capital ratios and less negative on the
income statement than in previous quarters.
The unit also actively manages the structural
interest-rate exposure on the Group’s
balance sheet. This aims to maintain a steady
growth in net interest income in the short
and medium term, regardless of interest-rate
fluctuations.
In the third quarter of 2014, the results of this
management have been very satisfactory,
with strategies limiting risk in Europe, the
United States and Mexico. These strategies are
managed both with hedging derivatives (caps,
floors, swaps and FRAs) and with balance-sheet
instruments (mainly government bonds with
the highest credit ratings and liquidity). The
amount of NTI generated in Spain, Mexico
and the United States is the result of prudent
portfolio management strategies, particularly
in terms of sovereign debt, in a context marked
by low interest rates.
Economic capital
Attributable economic risk capital (ERC)
consumption at the close of September
amounted to €30,511m, closely in line with
the figure at the close of June 2014, with a
quarterly rise of only 1.0%.
As is to be expected from BBVA’s profile,
the largest allocation to ERC (51.9%) relates
to credit risk on portfolios originated in
the Group’s branch network from its own
customer base. This amount was basically
unchanged over the period (down 0.1%). The
reduction in the stock of credit in Spain and in
the wholesale banking businesses in Eurasia
offsets the increased volume of loans in South
America, Mexico, Turkey and the United States.
Equity risk, in other words from the portfolio of
holdings in industrial and financial companies,
the stake in the CNCB group and consumption
of economic capital from goodwill, has
increased slightly as a proportion of total risks
to 17.8%.
Structural balance-sheet risk, which originates
from the management of both structural
interest-rate risk and exchange-rate risk,
accounts for 6.9% of all ERC, and has increased
by 13.7% during the period.
Operational risk remains stable, and accounts
for 6.8% of the total, while fixed-asset risk has
reduced its share to 12.4%.
Lastly, trading risk, which is of less importance
given the nature of the business and BBVA’s
policy of minimal proprietary trading, stands
at 2.9%.
16 Group information
Global growth has slowed, according to the latest available
figures for the first half of 2014. This slowdown is largely due
to the reduction in U.S. GDP in the first quarter of the year,
and eases, but does not halt the growth which is expected
in the world economy this and the following year. The latest
cyclical confidence and financial volatility indicators are
consistent with a gradual improvement. However, uncertainty
remains weighted to the downside due to the reappearance
of geopolitical risks and doubts about the impact which the
forthcoming interest rate hike in the United States will have on
capital flows and on financial asset prices.
Between July and September 2014, the main stock market
indices have reported weaker performance than in the previous
quarter. In Europe, the general European Stoxx 50 index
registered a slight 0.1% decline and the Ibex 35 was down 0.9%.
However, the Eurozone’s banking sector index, Euro Stoxx
Banks, was up 1.8% over the same period, largely because of the
latest measures applied by the ECB.
BBVA’s earnings for the first half of 2014, published on July 30,
2014, confirm the positive performance in recurring revenue
and the fall in the Group’s risk premium. More specifically,
in Spain asset quality continues to improve, and in fact the
balance of nonperforming assets was down again for the third
quarter in a row.
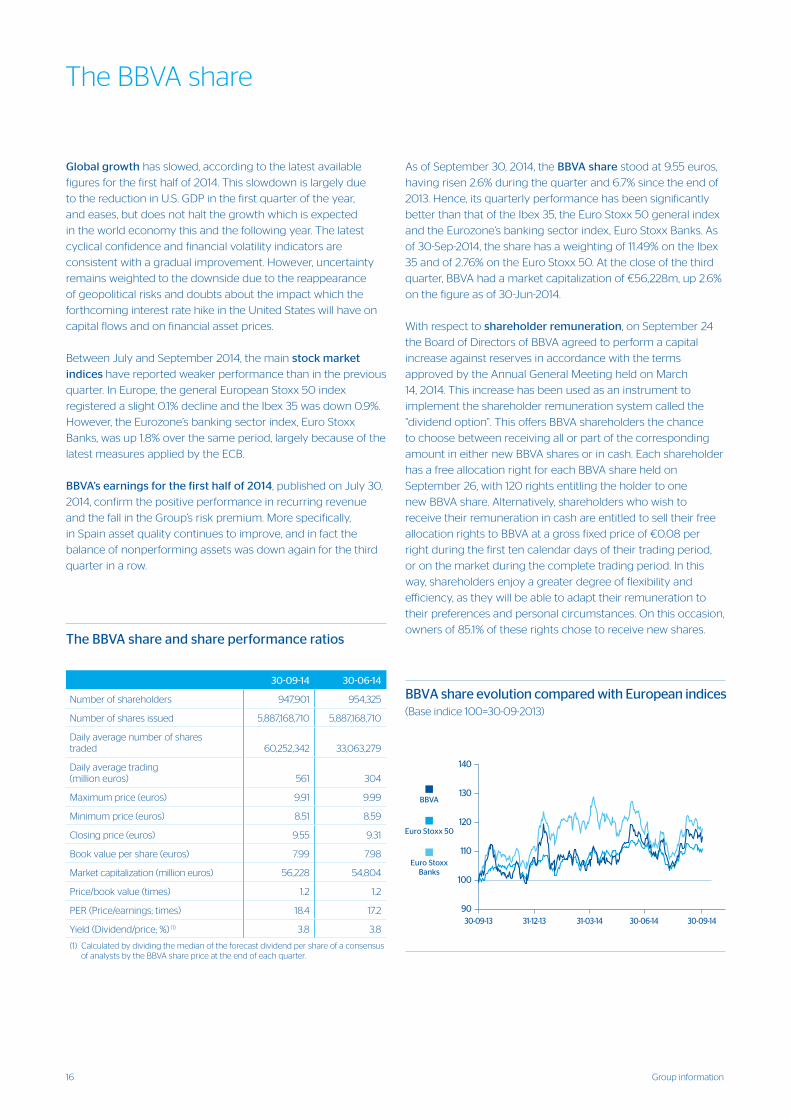
As of September 30, 2014, the BBVA share stood at 9.55 euros,
having risen 2.6% during the quarter and 6.7% since the end of
2013. Hence, its quarterly performance has been significantly
better than that of the Ibex 35, the Euro Stoxx 50 general index
and the Eurozone’s banking sector index, Euro Stoxx Banks. As
of 30-Sep-2014, the share has a weighting of 11.49% on the Ibex
35 and of 2.76% on the Euro Stoxx 50. At the close of the third
quarter, BBVA had a market capitalization of €56,228m, up 2.6%
on the figure as of 30-Jun-2014.
With respect to shareholder remuneration, on September 24
the Board of Directors of BBVA agreed to perform a capital
increase against reserves in accordance with the terms
approved by the Annual General Meeting held on March
14, 2014. This increase has been used as an instrument to
implement the shareholder remuneration system called the
“dividend option”. This offers BBVA shareholders the chance
to choose between receiving all or part of the corresponding
amount in either new BBVA shares or in cash. Each shareholder
has a free allocation right for each BBVA share held on
September 26, with 120 rights entitling the holder to one
new BBVA share. Alternatively, shareholders who wish to
receive their remuneration in cash are entitled to sell their free
allocation rights to BBVA at a gross fixed price of €0.08 per
right during the first ten calendar days of their trading period,
or on the market during the complete trading period. In this
way, shareholders enjoy a greater degree of flexibility and
efficiency, as they will be able to adapt their remuneration to
their preferences and personal circumstances. On this occasion,
owners of 85.1% of these rights chose to receive new shares.
The BBVA share
The BBVA share and share performance ratios
30-09-14 30-06-14
Number of shareholders 947,901 954,325
Number of shares issued 5,887,168,710 5,887,168,710
Daily average number of shares traded 60,252,342 33,063,279
Daily average trading (million euros) 561 304
Maximum price (euros) 9.91 9.99
Minimum price (euros) 8.51 8.59
Closing price (euros) 9.55 9.31
Book value per share (euros) 7.99 7.98
Market capitalization (million euros) 56,228 54,804
Price/book value (times) 1.2 1.2
PER (Price/earnings; times) 18.4 17.2
Yield (Dividend/price; %) (1) 3.8 3.8
(1) Calculated by dividing the median of the forecast dividend per share of a consensus of analysts by the BBVA share price at the end of each quarter.
��
���
���
���
���
���
��������������� ������������������ ���������������������������������������
�������� ���������������� �������� ��������
� �����������
����
� ������������
��
���
���
���
���
���
�������������������������������
17Environmental and Social Governance
The highlights in environmental and social governance (ESG)
for the third quarter of 2014 demonstrate that BBVA believes
in a different approach to banking: a responsible model based
on principles of integrity, prudence and transparency. BBVA
repeats its listing on the Dow Jones Sustainability Index for the
ninth year in a row and improves the overall score obtained in
2013, according to the analysis conducted by the RobecoSAM
agency. The Bank has also been selected by Triodos Investment
Management, the Triodos Group subsidiary that manages
socially responsible mutual funds, as part of its investor universe.
It is the only Spanish Bank on this list. Other highlights in the
period are:
Transparent, Clear and Responsible (TCR) communicationBBVA has implemented the Digital TCR project to extend the
TCR communication initiative to the digital world, as part of the
Group’s digitization strategy. An analysis has been conducted
with the aim of developing best practices in this area. At a later
stage, the countries will choose the most suitable ones and the
way of implementing them.
EducationFinancial literacy is one of the priorities of the Bank’s Responsible
Business Plan. 2.4 million people, both customers and
non-customers, have already benefited from the educational
programs.
Since 2010, BBVA has contributed with the OECD to the funding
of the PISA assessment, whose latest report on the financial skills
of 15-year-old students in OECD countries was presented in July
2014.
Products with a high social impactThe BBVA Microfinance Foundation has released its 2013
Performance Report, which shows that since its creation in 2007
it has provided $6,058m in loans for productive activities to 4.4
million underprivileged people. It currently serves 1.5 million
people and has an impact on the lives of 8 million.
In addition, a master agreement has been signed between the
BBVA Microfinance Foundation and the Secretary General for
International Development Cooperation to work together and
undertake joint actions aimed at the financial inclusion of the
most underprivileged groups.
Yo Soy Empleo (I am employment) has already helped over
4,500 businesses create 6,325 jobs in Spain. Starting in July,
1,000 of these aid packages were extended to the self-employed.
Of these, 673 €1,500 packages have already been granted.
Other lines
ESG RisksBBVA has signed the 2014 Global Investor Statement on
Climate Change. This statement recognizes the role played
by investors in the funding of clean energy projects. Signed by
some 350 investors, with over $24 billion in assets, the statement
is available on: http://investorsonclimatechange.org/.
Science and cultureThe BBVA Foundation has selected Asociación Trashumancia
y Naturaleza (Transhumance and Nature Association) as the
winner of the 9th BBVA Foundation Award for Biodiversity
Conservation Actions in Spain. Its aim is to promote
transhumance, a very valuable age-old practice for the
conservation of the natural, sociocultural and economic heritage
of the Iberian Peninsula. In the Biodiversity Conservation Actions
in Latin America category, the award went to the Smithsonian
Tropical Research Institute in Panama.
BBVA in the Sustainability Indices BBVA has a notable position on the main international
sustainability indices, with a weight as of 30-Sep-2014 as follows:
Environmental and Social Governance
For more information and contact details, see the chapter on
Business areas and www.bbvaresponsiblebanking.com
Main sustainability indices in which BBVA participates
Weighting (%)
DJSI World 0.79
DJSI Europe 1.80
DJSI Eurozone 3.75
MSCI World ESG 0.43
MSCI EX USA ESG 0.99
MSCI AC Europe ESG 1.67
FTSE4Good Global 0.41
FTSE4Good Global 100 0.69
FTSE4Good Europe 1.04
FTSE4Good Europe 50 1.80
Euronext-Vigeo Europe 120 0.82
Euronext-Vigeo Eurozone 120 0.87
STOXX Global ESG Environmental Leaders 0.45
STOXX Global ESG Social Leaders 0.45
EURO STOXX ESG Leaders 50 2.10
STOXX Europe ESG Leaders 50 2.10
STOXX Global ESG Leaders 0.30
18 Business areas
This section presents and analyzes the most relevant aspects
of the Group’s different areas. Specifically, it shows the
income statement, the balance sheet, the business activity
and the most significant ratios in each of them: loans under
management, customer deposits under management, mutual
funds and pension funds, efficiency ratio, NPA ratio, coverage
ratio and risk premium.
In 2014, the reporting structure of the BBVA Group’s business
areas is basically the same as that reported in 2013:
• Banking activity in Spain, which as in previous years
includes: The Retail network, with the segments of individual
customers, private banking and small businesses; Corporate
and Business Banking (CBB), which handles the SMEs,
corporations and institutions in the country; Corporate &
Investment Banking (CIB), which includes business with
large corporations and multinational groups and the trading
floor and distribution business in the same geographical
area; and other units, among them BBVA Seguros and Asset
Management (management of mutual and pension funds in
Spain). It also includes the portfolios, finance and structural
interest-rate positions of the euro balance sheet.
• Real-estate activity in Spain. This area basically covers
lending to real-estate developers and foreclosed real-estate
assets in the country.
• The United States encompasses the Group’s businesses in
the United States.
• Eurasia, which includes the business carried out in the rest
of Europe and Asia, i.e. the Group’s retail and wholesale
businesses in the area. It also includes BBVA’s stakes in the
Turkish bank Garanti and the Chinese banks CNCB and CIFH.
However, the equity-accounted income of CNCB (excluding
the dividends) from its acquisition until the conclusion of the
new agreement with the CITIC Group in the fourth quarter
of 2013 (which included the sale of 5.1% of the stake in CNCB)
has been reclassified in the Corporate Center under the
heading “Results from corporate operations”.
• Mexico includes the banking and insurance businesses in
the country.
• South America includes the banking and insurance businesses
that BBVA carries out in the region. In the first quarter of 2014,
the historical series in this area has been reconstructed to
exclude the business in Panama, which was sold in the fourth
quarter of 2013, and include it in the Corporate Center.
In addition to the above, all the areas include a remainder
made up of other businesses and of a supplement that
includes deletions and allocations not assigned to the units
making up the above areas.
Lastly, the Corporate Center is an aggregate that contains
the rest of the items that have not been allocated to the
business areas, as it basically corresponds to the Group’s
holding function. It groups together the costs of the head
offices that have a corporate function; management of
structural exchange-rate positions, carried out by BBVA’s
financial area; specific issues of capital instruments to
ensure adequate management of the Group’s global
solvency; portfolios and their corresponding results, whose
management is not linked to customer relations, such as
industrial holdings; certain tax assets and liabilities; funds
due to commitments with pensioners; goodwill and other
intangibles. It also comprises the result from certain corporate
operations carried out in 2013, such as the earnings and
capital gains from the pension business disposals in Latin
America during 2013; those from BBVA Panama taking into
consideration the capital gain from its disposal (in the fourth
quarter); and the effect of the repricing of the stake in CNCB
to market value following the signing in the fourth quarter
of 2013 of the new agreement with the CITIC group, which
includes the sale of 5.1% of the stake in CNCB. It also includes
the equity-accounted earnings from CNCB (excluding the
dividends).
In addition to this geographical breakdown, supplementary
information is provided for all the wholesale businesses
carried out by BBVA, i.e. Corporate & Investment Banking
(CIB). This aggregate business is considered relevant to better
understand the BBVA Group because of the characteristics of
the customers served, the type of products offered and the
risks assumed.
Lastly, as usual, in the case of the Americas and Eurasia
(basically Garanti), the results of applying constant exchange
rates are given in addition to the year-on-year variations at
current exchange rates.
The Group compiles information by areas based on units
at the same level, and all the accounting data related to the
business they manage are recorded in full. These basic units
are then aggregated in accordance with the organizational
structure established by the Group for higher-level units
and, finally, the business areas themselves. Similarly, all the
companies making up the Group are also assigned to the
different units according to the geographical area of their
activity.
Once the composition of each business area has been defined,
certain management criteria are applied, of which the
following are particularly important:
Business areas
19Business areas
• Capital. Capital is allocated to each business according to
economic risk capital (ERC) criteria. This is based on the
concept of unexpected loss at a specific confidence level,
depending on the Group’s capital adequacy targets. The
calculation of the ERC combines credit risk, market risk,
structural balance-sheet risk, equity positions, operational
risk, fixed-asset risk and technical risks in the case of
insurance companies. These calculations are carried out
using internal models that have been defined following the
guidelines and requirements established under the Basel
III capital accord, with economic criteria taking precedence
over regulatory ones.
ERC is risk-sensitive and thus linked to the management
policies of the businesses themselves. It standardizes
capital allocation between them in accordance with the
risks incurred. In other words, it is calculated in a way that
is standard and integrated for all kinds of risks and for each
operation, balance or risk position, allowing its risk-adjusted
return to be assessed and an aggregate to be calculated for
profitability by client, product, segment, unit or business area.
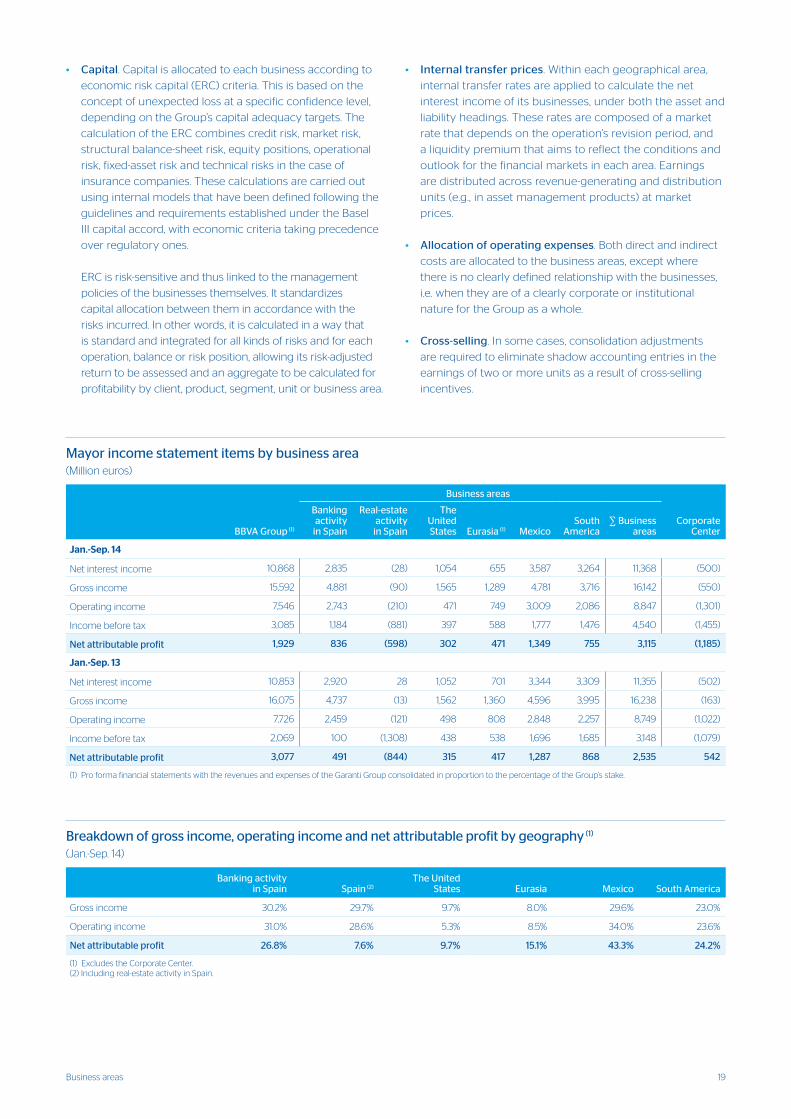
Breakdown of gross income, operating income and net attributable profit by geography (1)
(Jan.-Sep. 14)
Banking activityin Spain Spain (2)
The United States Eurasia Mexico South America
Gross income 30.2% 29.7% 9.7% 8.0% 29.6% 23.0%
Operating income 31.0% 28.6% 5.3% 8.5% 34.0% 23.6%
Net attributable profit 26.8% 7.6% 9.7% 15.1% 43.3% 24.2%
(1) Excludes the Corporate Center. (2) Including real-estate activity in Spain.
• Internal transfer prices. Within each geographical area,
internal transfer rates are applied to calculate the net
interest income of its businesses, under both the asset and
liability headings. These rates are composed of a market
rate that depends on the operation’s revision period, and
a liquidity premium that aims to reflect the conditions and
outlook for the financial markets in each area. Earnings
are distributed across revenue-generating and distribution
units (e.g., in asset management products) at market
prices.
• Allocation of operating expenses. Both direct and indirect
costs are allocated to the business areas, except where
there is no clearly defined relationship with the businesses,
i.e. when they are of a clearly corporate or institutional
nature for the Group as a whole.
• Cross-selling. In some cases, consolidation adjustments
are required to eliminate shadow accounting entries in the
earnings of two or more units as a result of cross-selling
incentives.
Mayor income statement items by business area(Million euros)
Business areas
BBVA Group (1)
Banking activity
in Spain
Real-estate activity
in Spain
The United States Eurasia (1) Mexico
South America
∑ Business areas
Corporate Center
Jan.-Sep. 14
Net interest income 10,868 2,835 (28) 1,054 655 3,587 3,264 11,368 (500)
Gross income 15,592 4,881 (90) 1,565 1,289 4,781 3,716 16,142 (550)
Operating income 7,546 2,743 (210) 471 749 3,009 2,086 8,847 (1,301)
Income before tax 3,085 1,184 (881) 397 588 1,777 1,476 4,540 (1,455)
Net attributable profit 1,929 836 (598) 302 471 1,349 755 3,115 (1,185)
Jan.-Sep. 13
Net interest income 10,853 2,920 28 1,052 701 3,344 3,309 11,355 (502)
Gross income 16,075 4,737 (13) 1,562 1,360 4,596 3,995 16,238 (163)
Operating income 7,726 2,459 (121) 498 808 2,848 2,257 8,749 (1,022)
Income before tax 2,069 100 (1,308) 438 538 1,696 1,685 3,148 (1,079)
Net attributable profit 3,077 491 (844) 315 417 1,287 868 2,535 542
(1) Pro forma financial statements with the revenues and expenses of the Garanti Group consolidated in proportion to the percentage of the Group’s stake.
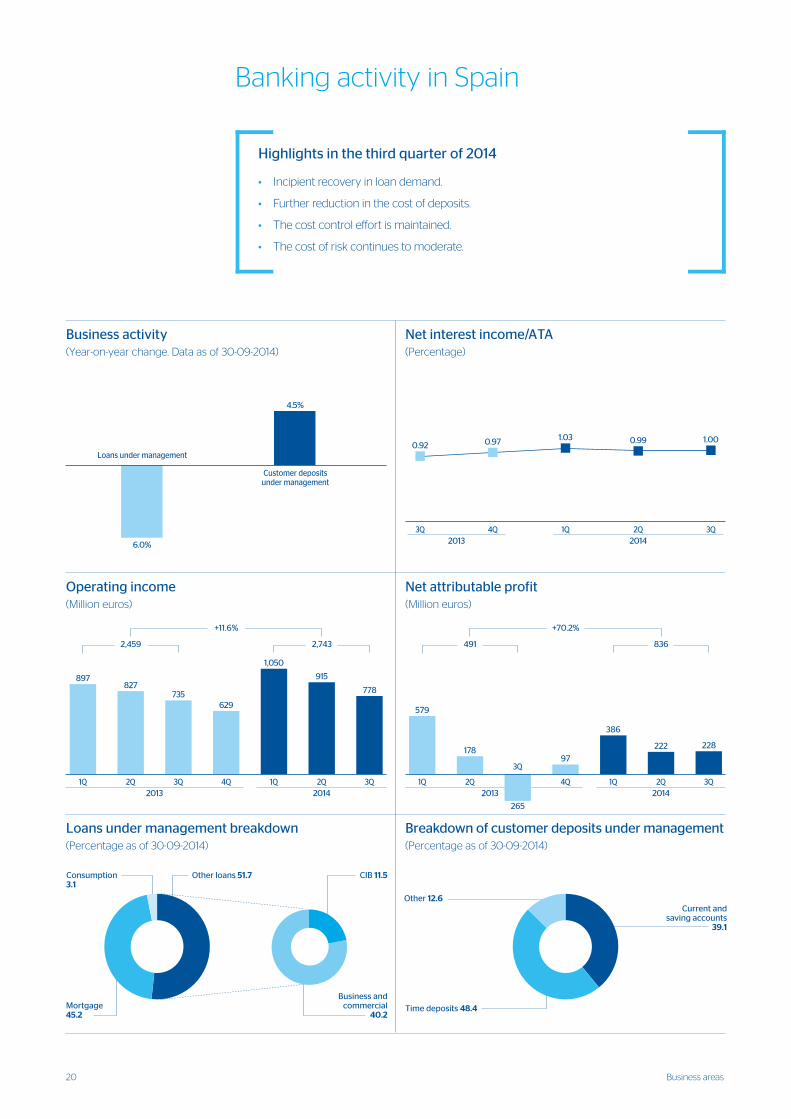
20 Business areas
Banking activity in Spain
Highlights in the third quarter of 2014
• Incipient recovery in loan demand.
• Further reduction in the cost of deposits.
• The cost control effort is maintained.
• The cost of risk continues to moderate.
��������������������������������������
������
�� ���
� ��
������
��
���
��
��
������������
�
�
�
�
�
�
��
���
�������������������������������
�� �� �� ��
������
���
������
�����
���
�����
��
��
��� � �����
��
�� �� ��
��
��
�����
���
���
��
���
��
��
�����
���
��
��� ���
���
��
��������������������������
�����
����������� ������������������������������������������������������������� ��
�����������������
���������
���������������������������������������������������������� ��
������������
��������
����������������������
����
��������������
���������������
�����������������������������������
�� �� ��� �� � ��
�� �
�� � � ��
�
�
��
��
�
��
�� � �� �
�������������������������������������������������� ��������
����
�������� ������������
���
��������� ��������� ������������
���
������
��
��
�
�
�
�
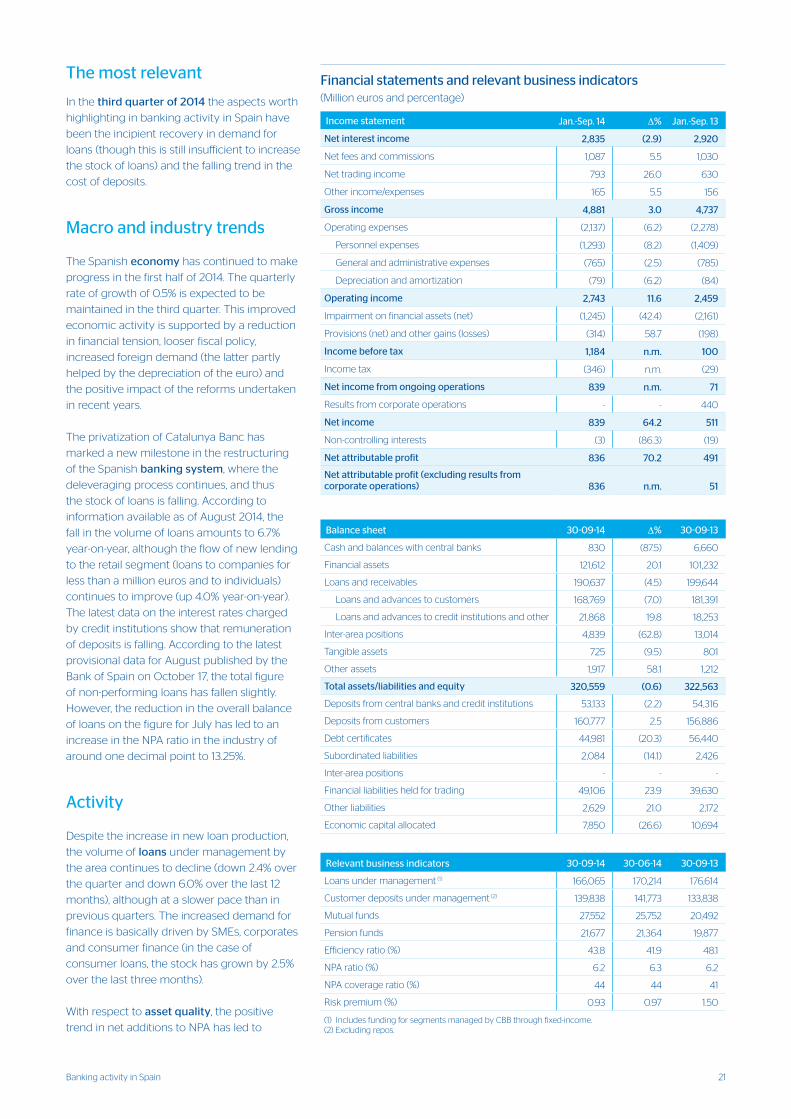
21Banking activity in Spain
Balance sheet 30-09-14 ∆% 30-09-13
Cash and balances with central banks 830 (87.5) 6,660
Financial assets 121,612 20.1 101,232
Loans and receivables 190,637 (4.5) 199,644
Loans and advances to customers 168,769 (7.0) 181,391
Loans and advances to credit institutions and other 21,868 19.8 18,253
Inter-area positions 4,839 (62.8) 13,014
Tangible assets 725 (9.5) 801
Other assets 1,917 58.1 1,212
Total assets/liabilities and equity 320,559 (0.6) 322,563
Deposits from central banks and credit institutions 53,133 (2.2) 54,316
Deposits from customers 160,777 2.5 156,886
Debt certificates 44,981 (20.3) 56,440
Subordinated liabilities 2,084 (14.1) 2,426
Inter-area positions - - -
Financial liabilities held for trading 49,106 23.9 39,630
Other liabilities 2,629 21.0 2,172
Economic capital allocated 7,850 (26.6) 10,694
Relevant business indicators 30-09-14 30-06-14 30-09-13
Loans under management (1) 166,065 170,214 176,614
Customer deposits under management (2) 139,838 141,773 133,838
Mutual funds 27,552 25,752 20,492
Pension funds 21,677 21,364 19,877
Efficiency ratio (%) 43.8 41.9 48.1
NPA ratio (%) 6.2 6.3 6.2
NPA coverage ratio (%) 44 44 41
Risk premium (%) 0.93 0.97 1.50
(1) Includes funding for segments managed by CBB through fixed-income.(2) Excluding repos.
Financial statements and relevant business indicators (Million euros and percentage)
Income statement Jan.-Sep. 14 ∆% Jan.-Sep. 13
Net interest income 2,835 (2.9) 2,920
Net fees and commissions 1,087 5.5 1,030
Net trading income 793 26.0 630
Other income/expenses 165 5.5 156
Gross income 4,881 3.0 4,737
Operating expenses (2,137) (6.2) (2,278)
Personnel expenses (1,293) (8.2) (1,409)
General and administrative expenses (765) (2.5) (785)
Depreciation and amortization (79) (6.2) (84)
Operating income 2,743 11.6 2,459
Impairment on financial assets (net) (1,245) (42.4) (2,161)
Provisions (net) and other gains (losses) (314) 58.7 (198)
Income before tax 1,184 n.m. 100
Income tax (346) n.m. (29)
Net income from ongoing operations 839 n.m. 71
Results from corporate operations - - 440
Net income 839 64.2 511
Non-controlling interests (3) (86.3) (19)
Net attributable profit 836 70.2 491
Net attributable profit (excluding results from corporate operations) 836 n.m. 51
The most relevant
In the third quarter of 2014 the aspects worth
highlighting in banking activity in Spain have
been the incipient recovery in demand for
loans (though this is still insufficient to increase
the stock of loans) and the falling trend in the
cost of deposits.
Macro and industry trends
The Spanish economy has continued to make
progress in the first half of 2014. The quarterly
rate of growth of 0.5% is expected to be
maintained in the third quarter. This improved
economic activity is supported by a reduction
in financial tension, looser fiscal policy,
increased foreign demand (the latter partly
helped by the depreciation of the euro) and
the positive impact of the reforms undertaken
in recent years.
The privatization of Catalunya Banc has
marked a new milestone in the restructuring
of the Spanish banking system, where the
deleveraging process continues, and thus
the stock of loans is falling. According to
information available as of August 2014, the
fall in the volume of loans amounts to 6.7%
year-on-year, although the flow of new lending
to the retail segment (loans to companies for
less than a million euros and to individuals)
continues to improve (up 4.0% year-on-year).
The latest data on the interest rates charged
by credit institutions show that remuneration
of deposits is falling. According to the latest
provisional data for August published by the
Bank of Spain on October 17, the total figure
of non-performing loans has fallen slightly.
However, the reduction in the overall balance
of loans on the figure for July has led to an
increase in the NPA ratio in the industry of
around one decimal point to 13.25%.
Activity
Despite the increase in new loan production,
the volume of loans under management by
the area continues to decline (down 2.4% over
the quarter and down 6.0% over the last 12
months), although at a slower pace than in
previous quarters. The increased demand for
finance is basically driven by SMEs, corporates
and consumer finance (in the case of
consumer loans, the stock has grown by 2.5%
over the last three months).
With respect to asset quality, the positive
trend in net additions to NPA has led to
22 Business areas
another improvement in the NPA ratio to 6.2%. The coverage
ratio has remained stable in the quarter, at 44%.
On the liabilities side, customer deposits under management
have performed particularly well. Their balance as of
30-Sep-2014 is up by 4.5% over the year. There has also been
a significant correction in the entry cost of on-balance-sheet
funds, closely in line with the current situation on the financial
markets. This has led to a shift of deposits over the quarter
toward off-balance-sheet funds (basically mutual funds). As a
result of the above, there has been a significant improvement
in the average cost, which is positively influencing net interest
income in the area.
As mentioned, off-balance-sheet funds have grown over the
quarter by 3.8%, largely due to the increase in mutual funds,
whose balance as of 30-Sep-2014 was up by 7.0% since the
end of the first half of 2014. As a result, the Group in Spain has
maintained its clear leading position as a fund manager.
Earnings
The year-on-year comparison of earnings in the area is strongly
influenced by the following factors from last year:
• Elimination of the “floor clauses” in residential mortgage
loans in May 2013, which were in place throughout most of
the first half of 2013 and had a positive effect on net interest
income.
• The capital gains generated in March 2013 by the
reinsurance operation on the individual life and accident
insurance portfolio.
In the first nine months of 2014, net interest income was 2.9%
down on the figure for the same period the previous year,
strongly influenced by the elimination of the “floor clauses”
explained above. Excluding this effect, this heading was
positive, despite the reduction in the stock of loans and the
environment of very low interest rates. It was boosted by the
good management of customer fund prices, which has helped
improve the customer spread. It is worth highlighting in this
respect that net interest income for the quarter is 3.6% higher
than the previous quarter; in other words, it has maintained
the quarterly growth trend of the last five quarters (since the
elimination of the “floor clauses”). In addition, there has been an
improvement in cumulative income from fees and commissions
through September (up 5.5% year-on-year) due to the positive
trend in fees from fund management, credit cards, securities
and wholesale banking operations. As a result, the more
recurring revenue has shown a high level of resilience, with the
cumulative total through September barely 0.7% down on the
figure for the same period in 2013.
NTI for the quarter is significantly down on the high figures for
the first and second quarters. However, the cumulative figure
for the year still shows a very positive trend (up 26.0%
year-on-year) thanks to the good performance of Global
Markets and the good management of structural risks on the
balance sheet.
The other income/expenses heading rose 5.5% year-on-year
between January and September 2014. Income from insurance
activities continues its positive trend, with a quarterly figure
that is very similar to those in previous quarters, despite the
negative seasonal factors for the period. Over the quarter,
dividends received in the Global Markets unit are significantly
down on those between April and June 2014, when this item
was exceptionally high.
Overall, accumulated gross income figures for banking activity
in Spain to September show a positive performance, with a
year-on-year rise of 3.0%.
Cumulative operating expenses through September remain in
check and have fallen 6.2% over the last 12 months, due to the
digitization and transformation process implemented by the
Group.
As a result of all the above, operating income totaled €2,743m
in the first nine months of 2014, a double-digit year-on-year
increase of 11.6%.
There has been a significant reduction in impairment losses on
financial assets. In the third quarter of 2014, €386m were set
aside for this item, a similar figure to the previous quarter. The
cumulative figure for the first nine months of the year amounts
to €1,245, a year-on-year decline of 42.4%. This is explained
by two factors: first, the good performance of NPA flows; and
second, the provisions made in 2013 due to the adoption of
recommendations on the classification of refinanced loans. The
cumulative cost of risk continues to improve, falling to 0.93%
(0.97% in the first half of 2014).
Lastly, provisions (net) and other gains/losses have performed
as expected in the quarter. However, the increase in the second
quarter due to restructuring costs, derived from the digitization
and transformation process underway in the Group (as
mentioned above), explains the year-on-year rise of 58.7%.
To sum up, and given the absence this year of one-off earnings,
the net attributable profit generated in the first nine months
of 2014 from banking activity in Spain is €836m. This compares
with the figure of €491m in the same period in 2013, which
included the capital gains from the reinsurance operation
mentioned earlier.
Main highlights
BBVA aims to continue to strengthen its franchise in Spain by
attracting customers and increasing their levels of satisfaction
and loyalty. In 2014 it improved its market share by 40 basis
points (according to the FRS Inmark study). It has also launched
the “Quiero” Campaign, which sums up the way it aims to
achieve this goal: BBVA wants to offer each customer what they
need and demand.
A number of lines of action have been undertaken in
commercial products and services for individual customers in
order to support this goal:
23Banking activity in Spain
• In savings, and within a context of low interest rates, BBVA
continues committed to the marketing of products whose
aim is to achieve returns that are in line with customer risk
profiles, making full use of the Bank’s extensive mutual fund
portfolio, and supported by the campaign offering bonuses
for transferring funds from other institutions, and savings
insurance.
• The area of pensions has gained importance following the
Government’s announcement of its Social Security reforms.
BBVA has renewed its range of products, adapting them to
each retirement time horizon and risk profile. In addition,
the bank acknowledges its responsibility in making people
aware of the need to save for retirement. That is why it has
launched a range of measures to inform the population and
to make it easier to make decisions in advance. This quarter
it has launched a total pension estimate simulator
(www.jubilaciondefuturo.es).
• In an environment of improving economic expectations,
and following the reduction in the price of housing in recent
years, BBVA has launched the new “Quiero” Mortgage, at
a special rate for customers who meet certain minimum
requirements of solvency and loyalty.
In addition, the aim is to boost finance and make it more
available for companies, and in particular for SMEs. Working
together with the risks area in this segment has enabled 80,000
customers to be offered finance. The range of asset products is
complemented with very competitive deposits and insurance.
The Bank also aims to strengthen its leading position in the
SME and Corporate Banking segment. To this end, in 2014 it
has adapted its business model: it has extended the capacity
of the sales force to deal with customers and boosted advice
through product specialists. These are key elements against
the current backdrop to respond to customer demands and
growing competition.
In addition, technological innovations and changes in
customer behavior demand the development of new forms
of relationship and digital channels. In the third quarter, the
results of the 2014 FRS satisfaction survey show that customers
consider that the BBVA website in Spain and its mobile app
are the most highly valued among its main competitors.
This recognition from customers coincides with the process
of improvement and incorporation of new services and
commercial capabilities.
The world of payment channels is undergoing a profound
process of transformation. In addition to the appearance of new
entrants from the technological industry, there is the pressure
on margins resulting from the new regulations governing
interchange rates. To deal with these challenges the “Bono TPV”
(credit card reader flat fee) has been adjusted, and now allows
different fixed charges to be set according to the revenue. In
addition, BBVA has added its weight to the development of
new digital payment channels. As an example, the BBVA Wallet
application is the most commonly used and extended mobile
payment banking app in Spain. Currently it has more than
280,000 users.
Lastly, initiatives have been taken within the responsible
business area that once more demonstrate BBVA’s
commitment to customers and society. Apart from the “Yo
Soy Empleo” (I am Employment) initiative, which has been
mentioned in the chapter on Environmental and Social
Governance, it is worth mentioning BBVA’s social housing policy
in Spain. It is the result of the Bank’s concern for customers who
find it difficult to pay their mortgages. They are offered a free
employment plan with the Adecco Foundation. The program
is combined with a training and job search plan lasting nine
months for either the customer or one of the customer’s family
members. Currently 619 customers benefit from the BBVA
Adecco Foundation Plan and 31% of them have found a job at
some point during the program.
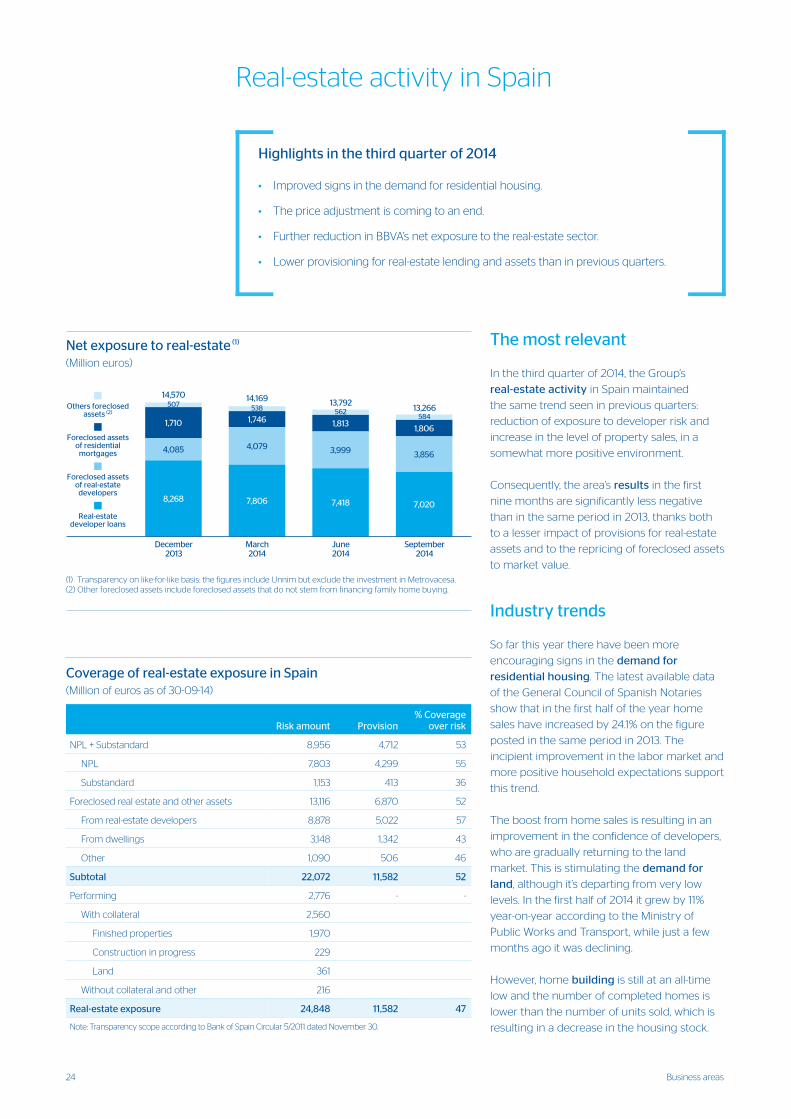
24 Business areas
Real-estate activity in Spain
Highlights in the third quarter of 2014
• Improved signs in the demand for residential housing.
• The price adjustment is coming to an end.
• Further reduction in BBVA’s net exposure to the real-estate sector.
• Lower provisioning for real-estate lending and assets than in previous quarters.
Coverage of real-estate exposure in Spain (Million of euros as of 30-09-14)
Risk amount Provision% Coverage
over risk
NPL + Substandard 8,956 4,712 53
NPL 7,803 4,299 55
Substandard 1,153 413 36
Foreclosed real estate and other assets 13,116 6,870 52
From real-estate developers 8,878 5,022 57
From dwellings 3,148 1,342 43
Other 1,090 506 46
Subtotal 22,072 11,582 52
Performing 2,776 - -
With collateral 2,560
Finished properties 1,970
Construction in progress 229
Land 361
Without collateral and other 216
Real-estate exposure 24,848 11,582 47
Note: Transparency scope according to Bank of Spain Circular 5/2011 dated November 30.
�������������������������������
���������������
���������� �����
��������� �
����� �����
�� � �� �� �� ���
������ ����
��� �� �
����� �� � �
��
��
�
�
� �
���
���
��
��� ������������������ �������� ����������������������������������������������������������������������������� ����������������������������������������������������������������������������������������������������
���������� ��
����
��
���
�� �
��
��������� ��
�����
����
�� �
��
� �
������ ��
�����
����
�� ��
��
��
����� ��
������
����
�����
����
��
��������� ������������� ���������������
��������� �������������������� ���������
����������� ��������������
��������������� ����������
The most relevant
In the third quarter of 2014, the Group’s
real-estate activity in Spain maintained
the same trend seen in previous quarters:
reduction of exposure to developer risk and
increase in the level of property sales, in a
somewhat more positive environment.
Consequently, the area’s results in the first
nine months are significantly less negative
than in the same period in 2013, thanks both
to a lesser impact of provisions for real-estate
assets and to the repricing of foreclosed assets
to market value.
Industry trends
So far this year there have been more
encouraging signs in the demand for
residential housing. The latest available data
of the General Council of Spanish Notaries
show that in the first half of the year home
sales have increased by 24.1% on the figure
posted in the same period in 2013. The
incipient improvement in the labor market and
more positive household expectations support
this trend.
The boost from home sales is resulting in an
improvement in the confidence of developers,
who are gradually returning to the land
market. This is stimulating the demand for
land, although it’s departing from very low
levels. In the first half of 2014 it grew by 11%
year-on-year according to the Ministry of
Public Works and Transport, while just a few
months ago it was declining.
However, home building is still at an all-time
low and the number of completed homes is
lower than the number of units sold, which is
resulting in a decrease in the housing stock.
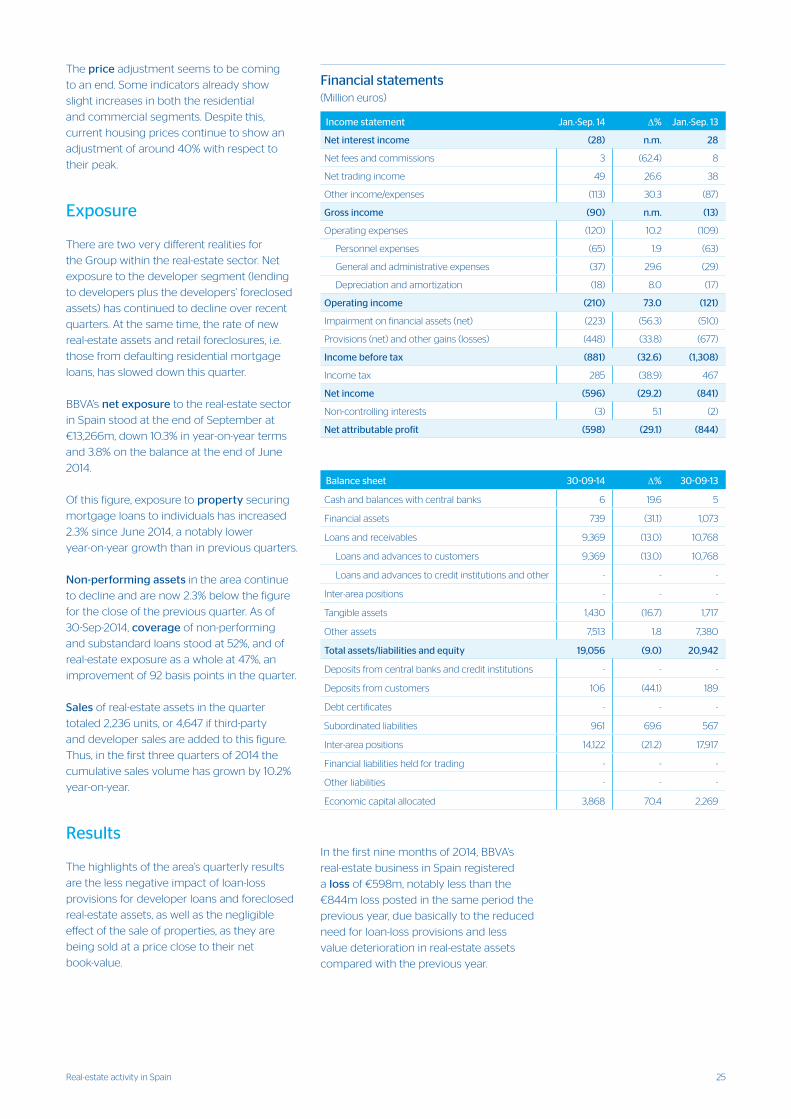
25Real-estate activity in Spain
The price adjustment seems to be coming
to an end. Some indicators already show
slight increases in both the residential
and commercial segments. Despite this,
current housing prices continue to show an
adjustment of around 40% with respect to
their peak.
Exposure
There are two very different realities for
the Group within the real-estate sector. Net
exposure to the developer segment (lending
to developers plus the developers’ foreclosed
assets) has continued to decline over recent
quarters. At the same time, the rate of new
real-estate assets and retail foreclosures, i.e.
those from defaulting residential mortgage
loans, has slowed down this quarter.
BBVA’s net exposure to the real-estate sector
in Spain stood at the end of September at
€13,266m, down 10.3% in year-on-year terms
and 3.8% on the balance at the end of June
2014.
Of this figure, exposure to property securing
mortgage loans to individuals has increased
2.3% since June 2014, a notably lower
year-on-year growth than in previous quarters.
Non-performing assets in the area continue
to decline and are now 2.3% below the figure
for the close of the previous quarter. As of
30-Sep-2014, coverage of non-performing
and substandard loans stood at 52%, and of
real-estate exposure as a whole at 47%, an
improvement of 92 basis points in the quarter.
Sales of real-estate assets in the quarter
totaled 2,236 units, or 4,647 if third-party
and developer sales are added to this figure.
Thus, in the first three quarters of 2014 the
cumulative sales volume has grown by 10.2%
year-on-year.
Results
The highlights of the area’s quarterly results
are the less negative impact of loan-loss
provisions for developer loans and foreclosed
real-estate assets, as well as the negligible
effect of the sale of properties, as they are
being sold at a price close to their net
book-value.
In the first nine months of 2014, BBVA’s
real-estate business in Spain registered
a loss of €598m, notably less than the
€844m loss posted in the same period the
previous year, due basically to the reduced
need for loan-loss provisions and less
value deterioration in real-estate assets
compared with the previous year.
Balance sheet 30-09-14 ∆% 30-09-13
Cash and balances with central banks 6 19.6 5
Financial assets 739 (31.1) 1,073
Loans and receivables 9,369 (13.0) 10,768
Loans and advances to customers 9,369 (13.0) 10,768
Loans and advances to credit institutions and other - - -
Inter-area positions - - -
Tangible assets 1,430 (16.7) 1,717
Other assets 7,513 1.8 7,380
Total assets/liabilities and equity 19,056 (9.0) 20,942
Deposits from central banks and credit institutions - - -
Deposits from customers 106 (44.1) 189
Debt certificates - - -
Subordinated liabilities 961 69.6 567
Inter-area positions 14,122 (21.2) 17,917
Financial liabilities held for trading - - -
Other liabilities - - -
Economic capital allocated 3,868 70.4 2,269
Financial statements (Million euros)
Income statement Jan.-Sep. 14 ∆% Jan.-Sep. 13
Net interest income (28) n.m. 28
Net fees and commissions 3 (62.4) 8
Net trading income 49 26.6 38
Other income/expenses (113) 30.3 (87)
Gross income (90) n.m. (13)
Operating expenses (120) 10.2 (109)
Personnel expenses (65) 1.9 (63)
General and administrative expenses (37) 29.6 (29)
Depreciation and amortization (18) 8.0 (17)
Operating income (210) 73.0 (121)
Impairment on financial assets (net) (223) (56.3) (510)
Provisions (net) and other gains (losses) (448) (33.8) (677)
Income before tax (881) (32.6) (1,308)
Income tax 285 (38.9) 467
Net income (596) (29.2) (841)
Non-controlling interests (3) 5.1 (2)
Net attributable profit (598) (29.1) (844)
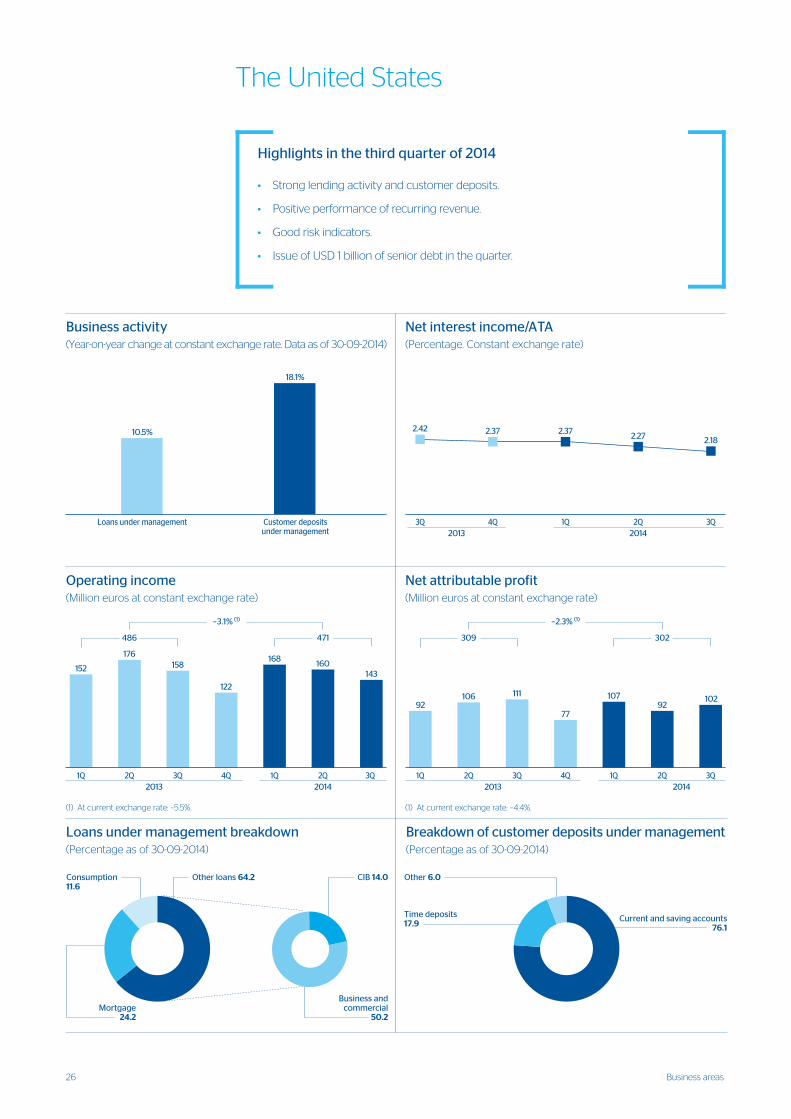
26 Business areas
The United States
Highlights in the third quarter of 2014
• Strong lending activity and customer deposits.
• Positive performance of recurring revenue.
• Good risk indicators.
• Issue of USD 1 billion of senior debt in the quarter.
������
���
���
��� ������ ���
����� ���
�����
�� ��� ���
�
���
���
���
�������� ����������������������������������������������
���������������������������������������������������������������
� � �����������������������������
�� �� �� ��
���������
����
������
������
���
������
���
��
��� ���
� � �������������������������������
�� �� �� ��
���������
����
�����
��� ���
��
������
���
��
��� ���
���
��
��
��
�������������������������������
����������� ������������������������������������������������������������� ��
����������������
��������
���������������������������������������������������������� ��
������������
��������
����������������������
����
���������������
���������������
�����������������������������������������������������������
���� ��� ��� ���
����
�
�
�
�� ����� ��
���
�� �� ����� ���
�� ��
����
����
�
�
�
�
�
��
��
��
��
��
��
�������������������������������������������������������������������������� ����������
�����
� �����������������
�����
���� ������ �����������������
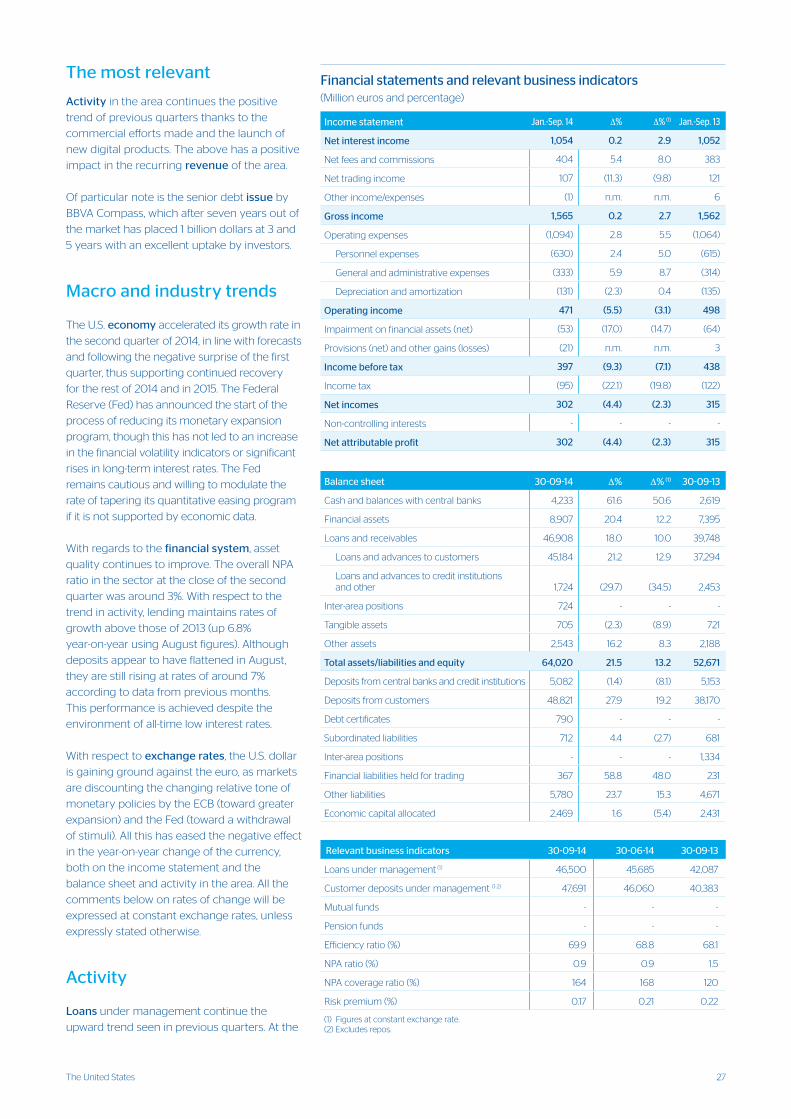
27The United States
The most relevant
Activity in the area continues the positive
trend of previous quarters thanks to the
commercial efforts made and the launch of
new digital products. The above has a positive
impact in the recurring revenue of the area.
Of particular note is the senior debt issue by
BBVA Compass, which after seven years out of
the market has placed 1 billion dollars at 3 and
5 years with an excellent uptake by investors.
Macro and industry trends
The U.S. economy accelerated its growth rate in
the second quarter of 2014, in line with forecasts
and following the negative surprise of the first
quarter, thus supporting continued recovery
for the rest of 2014 and in 2015. The Federal
Reserve (Fed) has announced the start of the
process of reducing its monetary expansion
program, though this has not led to an increase
in the financial volatility indicators or significant
rises in long-term interest rates. The Fed
remains cautious and willing to modulate the
rate of tapering its quantitative easing program
if it is not supported by economic data.
With regards to the financial system, asset
quality continues to improve. The overall NPA
ratio in the sector at the close of the second
quarter was around 3%. With respect to the
trend in activity, lending maintains rates of
growth above those of 2013 (up 6.8%
year-on-year using August figures). Although
deposits appear to have flattened in August,
they are still rising at rates of around 7%
according to data from previous months.
This performance is achieved despite the
environment of all-time low interest rates.
With respect to exchange rates, the U.S. dollar
is gaining ground against the euro, as markets
are discounting the changing relative tone of
monetary policies by the ECB (toward greater
expansion) and the Fed (toward a withdrawal
of stimuli). All this has eased the negative effect
in the year-on-year change of the currency,
both on the income statement and the
balance sheet and activity in the area. All the
comments below on rates of change will be
expressed at constant exchange rates, unless
expressly stated otherwise.
Activity
Loans under management continue the
upward trend seen in previous quarters. At the
Balance sheet 30-09-14 ∆% ∆% (1) 30-09-13
Cash and balances with central banks 4,233 61.6 50.6 2,619
Financial assets 8,907 20.4 12.2 7,395
Loans and receivables 46,908 18.0 10.0 39,748
Loans and advances to customers 45,184 21.2 12.9 37,294
Loans and advances to credit institutions and other 1,724 (29.7) (34.5) 2,453
Inter-area positions 724 - - -
Tangible assets 705 (2.3) (8.9) 721
Other assets 2,543 16.2 8.3 2,188
Total assets/liabilities and equity 64,020 21.5 13.2 52,671
Deposits from central banks and credit institutions 5,082 (1.4) (8.1) 5,153
Deposits from customers 48,821 27.9 19.2 38,170
Debt certificates 790 - - -
Subordinated liabilities 712 4.4 (2.7) 681
Inter-area positions - - - 1,334
Financial liabilities held for trading 367 58.8 48.0 231
Other liabilities 5,780 23.7 15.3 4,671
Economic capital allocated 2,469 1.6 (5.4) 2,431
Relevant business indicators 30-09-14 30-06-14 30-09-13
Loans under management (1) 46,500 45,685 42,087
Customer deposits under management (1-2) 47,691 46,060 40,383
Mutual funds - - -
Pension funds - - -
Efficiency ratio (%) 69.9 68.8 68.1
NPA ratio (%) 0.9 0.9 1.5
NPA coverage ratio (%) 164 168 120
Risk premium (%) 0.17 0.21 0.22
(1) Figures at constant exchange rate.(2) Excludes repos.
Financial statements and relevant business indicators (Million euros and percentage)
Income statement Jan.-Sep. 14 ∆% ∆% (1) Jan.-Sep. 13
Net interest income 1,054 0.2 2.9 1,052
Net fees and commissions 404 5.4 8.0 383
Net trading income 107 (11.3) (9.8) 121
Other income/expenses (1) n.m. n.m. 6
Gross income 1,565 0.2 2.7 1,562
Operating expenses (1,094) 2.8 5.5 (1,064)
Personnel expenses (630) 2.4 5.0 (615)
General and administrative expenses (333) 5.9 8.7 (314)
Depreciation and amortization (131) (2.3) 0.4 (135)
Operating income 471 (5.5) (3.1) 498
Impairment on financial assets (net) (53) (17.0) (14.7) (64)
Provisions (net) and other gains (losses) (21) n.m. n.m. 3
Income before tax 397 (9.3) (7.1) 438
Income tax (95) (22.1) (19.8) (122)
Net incomes 302 (4.4) (2.3) 315
Non-controlling interests - - - -
Net attributable profit 302 (4.4) (2.3) 315
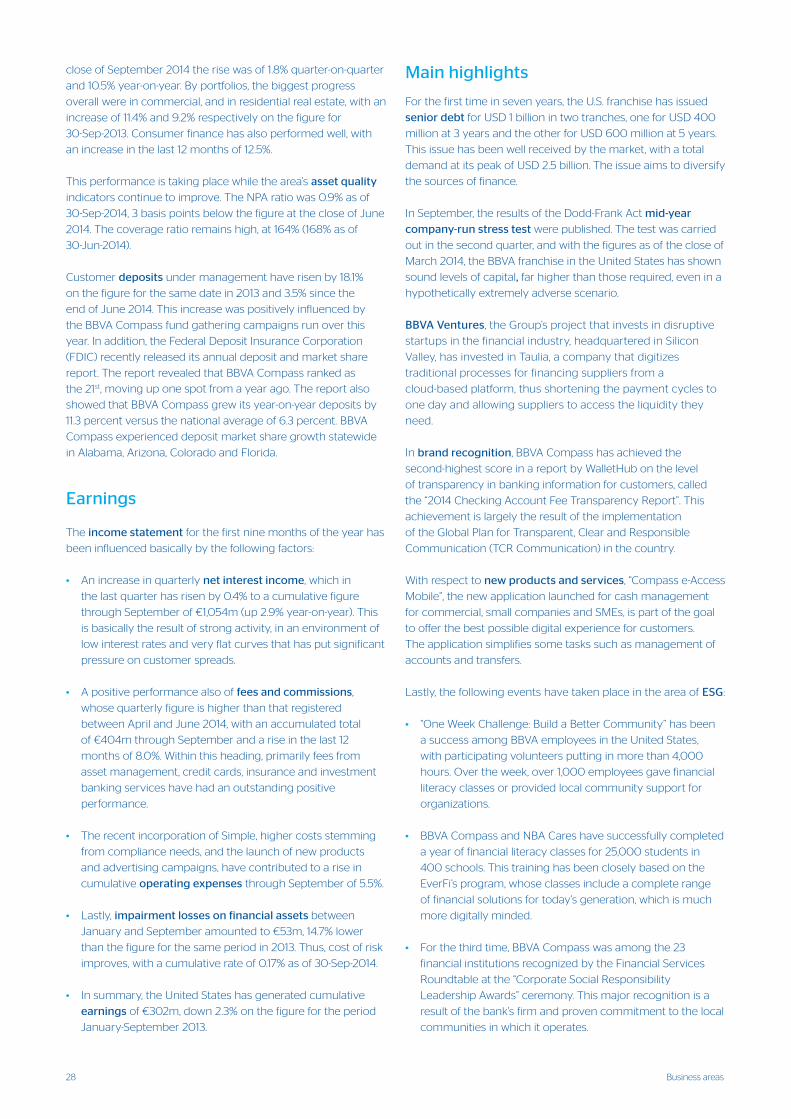
28 Business areas
Main highlights
For the first time in seven years, the U.S. franchise has issued
senior debt for USD 1 billion in two tranches, one for USD 400
million at 3 years and the other for USD 600 million at 5 years.
This issue has been well received by the market, with a total
demand at its peak of USD 2.5 billion. The issue aims to diversify
the sources of finance.
In September, the results of the Dodd-Frank Act mid-year
company-run stress test were published. The test was carried
out in the second quarter, and with the figures as of the close of
March 2014, the BBVA franchise in the United States has shown
sound levels of capital, far higher than those required, even in a
hypothetically extremely adverse scenario.
BBVA Ventures, the Group’s project that invests in disruptive
startups in the financial industry, headquartered in Silicon
Valley, has invested in Taulia, a company that digitizes
traditional processes for financing suppliers from a
cloud-based platform, thus shortening the payment cycles to
one day and allowing suppliers to access the liquidity they
need.
In brand recognition, BBVA Compass has achieved the
second-highest score in a report by WalletHub on the level
of transparency in banking information for customers, called
the “2014 Checking Account Fee Transparency Report”. This
achievement is largely the result of the implementation
of the Global Plan for Transparent, Clear and Responsible
Communication (TCR Communication) in the country.
With respect to new products and services, “Compass e-Access
Mobile”, the new application launched for cash management
for commercial, small companies and SMEs, is part of the goal
to offer the best possible digital experience for customers.
The application simplifies some tasks such as management of
accounts and transfers.
Lastly, the following events have taken place in the area of ESG:
• “One Week Challenge: Build a Better Community” has been
a success among BBVA employees in the United States,
with participating volunteers putting in more than 4,000
hours. Over the week, over 1,000 employees gave financial
literacy classes or provided local community support for
organizations.
• BBVA Compass and NBA Cares have successfully completed
a year of financial literacy classes for 25,000 students in
400 schools. This training has been closely based on the
EverFi’s program, whose classes include a complete range
of financial solutions for today’s generation, which is much
more digitally minded.
• For the third time, BBVA Compass was among the 23
financial institutions recognized by the Financial Services
Roundtable at the “Corporate Social Responsibility
Leadership Awards” ceremony. This major recognition is a
result of the bank’s firm and proven commitment to the local
communities in which it operates.
close of September 2014 the rise was of 1.8% quarter-on-quarter
and 10.5% year-on-year. By portfolios, the biggest progress
overall were in commercial, and in residential real estate, with an
increase of 11.4% and 9.2% respectively on the figure for
30-Sep-2013. Consumer finance has also performed well, with
an increase in the last 12 months of 12.5%.
This performance is taking place while the area’s asset quality
indicators continue to improve. The NPA ratio was 0.9% as of
30-Sep-2014, 3 basis points below the figure at the close of June
2014. The coverage ratio remains high, at 164% (168% as of
30-Jun-2014).
Customer deposits under management have risen by 18.1%
on the figure for the same date in 2013 and 3.5% since the
end of June 2014. This increase was positively influenced by
the BBVA Compass fund gathering campaigns run over this
year. In addition, the Federal Deposit Insurance Corporation
(FDIC) recently released its annual deposit and market share
report. The report revealed that BBVA Compass ranked as
the 21st, moving up one spot from a year ago. The report also
showed that BBVA Compass grew its year-on-year deposits by
11.3 percent versus the national average of 6.3 percent. BBVA
Compass experienced deposit market share growth statewide
in Alabama, Arizona, Colorado and Florida.
Earnings
The income statement for the first nine months of the year has
been influenced basically by the following factors:
• An increase in quarterly net interest income, which in
the last quarter has risen by 0.4% to a cumulative figure
through September of €1,054m (up 2.9% year-on-year). This
is basically the result of strong activity, in an environment of
low interest rates and very flat curves that has put significant
pressure on customer spreads.
• A positive performance also of fees and commissions,
whose quarterly figure is higher than that registered
between April and June 2014, with an accumulated total
of €404m through September and a rise in the last 12
months of 8.0%. Within this heading, primarily fees from
asset management, credit cards, insurance and investment
banking services have had an outstanding positive
performance.
• The recent incorporation of Simple, higher costs stemming
from compliance needs, and the launch of new products
and advertising campaigns, have contributed to a rise in
cumulative operating expenses through September of 5.5%.
• Lastly, impairment losses on financial assets between
January and September amounted to €53m, 14.7% lower
than the figure for the same period in 2013. Thus, cost of risk
improves, with a cumulative rate of 0.17% as of 30-Sep-2014.
• In summary, the United States has generated cumulative
earnings of €302m, down 2.3% on the figure for the period
January-September 2013.
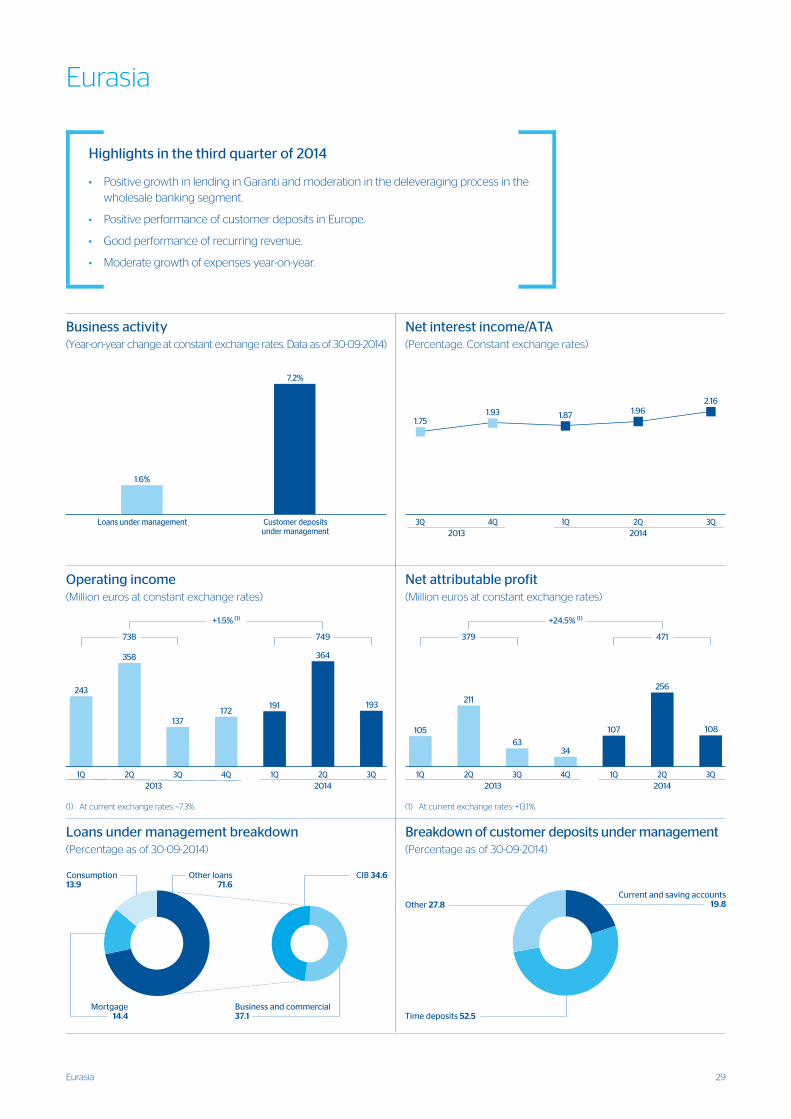
29Eurasia
Eurasia
Highlights in the third quarter of 2014
• Positive growth in lending in Garanti and moderation in the deleveraging process in the wholesale banking segment.
• Positive performance of customer deposits in Europe.
• Good performance of recurring revenue.
• Moderate growth of expenses year-on-year.
���
���
������
���
���
��� ���
���
���
����
���
���
������
�
��
���
���
���
���
���
���
���
���������� ����������������������������������������������������
���������������������������������������������������������
� � �������������������������������� � � ����������������������������� �� ��
�� �� �� ��
���������
����
���
���
���
������
������
���
��
��� ���
�� �� �� ��
����������
����
������
���
����
������
���
��
��� ���
���
��
���
��
�������������������������������
����������� ������������������������������������������������������������� ��
�����������������
���������
���������������������������������������������������������� ��
������������
��������
���������������������������
���������������
���������������
������������������������������������������������������������
����
�� � ������
��
�
�
�
������ ����
���� �
�� �� ����� ���
�� �
��������������������������������������������������������������������������� ����������
����
�������� ������������
���
��������� ��������� ������������
���
���
�
�
�
�
�
�
�
�
�
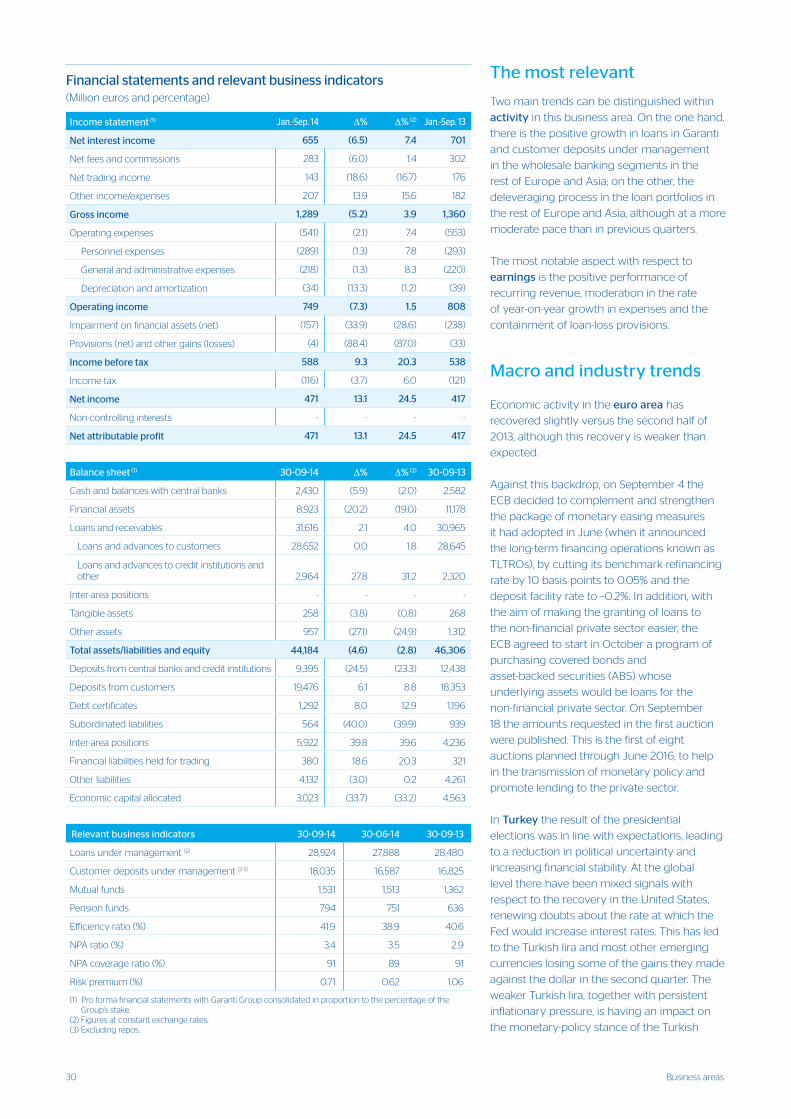
30 Business areas
The most relevant
Two main trends can be distinguished within
activity in this business area. On the one hand,
there is the positive growth in loans in Garanti
and customer deposits under management
in the wholesale banking segments in the
rest of Europe and Asia; on the other, the
deleveraging process in the loan portfolios in
the rest of Europe and Asia, although at a more
moderate pace than in previous quarters.
The most notable aspect with respect to
earnings is the positive performance of
recurring revenue, moderation in the rate
of year-on-year growth in expenses and the
containment of loan-loss provisions.
Macro and industry trends
Economic activity in the euro area has
recovered slightly versus the second half of
2013, although this recovery is weaker than
expected.
Against this backdrop, on September 4 the
ECB decided to complement and strengthen
the package of monetary easing measures
it had adopted in June (when it announced
the long-term financing operations known as
TLTROs), by cutting its benchmark refinancing
rate by 10 basis points to 0.05% and the
deposit facility rate to –0.2%. In addition, with
the aim of making the granting of loans to
the non-financial private sector easier, the
ECB agreed to start in October a program of
purchasing covered bonds and
asset-backed securities (ABS) whose
underlying assets would be loans for the
non-financial private sector. On September
18 the amounts requested in the first auction
were published. This is the first of eight
auctions planned through June 2016, to help
in the transmission of monetary policy and
promote lending to the private sector.
In Turkey the result of the presidential
elections was in line with expectations, leading
to a reduction in political uncertainty and
increasing financial stability. At the global
level there have been mixed signals with
respect to the recovery in the United States,
renewing doubts about the rate at which the
Fed would increase interest rates. This has led
to the Turkish lira and most other emerging
currencies losing some of the gains they made
against the dollar in the second quarter. The
weaker Turkish lira, together with persistent
inflationary pressure, is having an impact on
the monetary-policy stance of the Turkish
Balance sheet (1) 30-09-14 ∆% ∆% (2) 30-09-13
Cash and balances with central banks 2,430 (5.9) (2.0) 2,582
Financial assets 8,923 (20.2) (19.0) 11,178
Loans and receivables 31,616 2.1 4.0 30,965
Loans and advances to customers 28,652 0.0 1.8 28,645
Loans and advances to credit institutions and other 2,964 27.8 31.2 2,320
Inter-area positions - - - -
Tangible assets 258 (3.8) (0.8) 268
Other assets 957 (27.1) (24.9) 1,312
Total assets/liabilities and equity 44,184 (4.6) (2.8) 46,306
Deposits from central banks and credit institutions 9,395 (24.5) (23.3) 12,438
Deposits from customers 19,476 6.1 8.8 18,353
Debt certificates 1,292 8.0 12.9 1,196
Subordinated liabilities 564 (40.0) (39.9) 939
Inter-area positions 5,922 39.8 39.6 4,236
Financial liabilities held for trading 380 18.6 20.3 321
Other liabilities 4,132 (3.0) 0.2 4,261
Economic capital allocated 3,023 (33.7) (33.2) 4,563
Relevant business indicators 30-09-14 30-06-14 30-09-13
Loans under management (2) 28,924 27,888 28,480
Customer deposits under management (2-3) 18,035 16,587 16,825
Mutual funds 1,531 1,513 1,362
Pension funds 794 751 636
Efficiency ratio (%) 41.9 38.9 40.6
NPA ratio (%) 3.4 3.5 2.9
NPA coverage ratio (%) 91 89 91
Risk premium (%) 0.71 0.62 1.06
(1) Pro forma financial statements with Garanti Group consolidated in proportion to the percentage of the Group’s stake.
(2) Figures at constant exchange rates.(3) Excluding repos.
Financial statements and relevant business indicators(Million euros and percentage)
Income statement (1) Jan.-Sep. 14 ∆% ∆% (2) Jan.-Sep. 13
Net interest income 655 (6.5) 7.4 701
Net fees and commissions 283 (6.0) 1.4 302
Net trading income 143 (18.6) (16.7) 176
Other income/expenses 207 13.9 15.6 182
Gross income 1,289 (5.2) 3.9 1,360
Operating expenses (541) (2.1) 7.4 (553)
Personnel expenses (289) (1.3) 7.8 (293)
General and administrative expenses (218) (1.3) 8.3 (220)
Depreciation and amortization (34) (13.3) (1.2) (39)
Operating income 749 (7.3) 1.5 808
Impairment on financial assets (net) (157) (33.9) (28.6) (238)
Provisions (net) and other gains (losses) (4) (88.4) (87.0) (33)
Income before tax 588 9.3 20.3 538
Income tax (116) (3.7) 6.0 (121)
Net income 471 13.1 24.5 417
Non-controlling interests - - - -
Net attributable profit 471 13.1 24.5 417
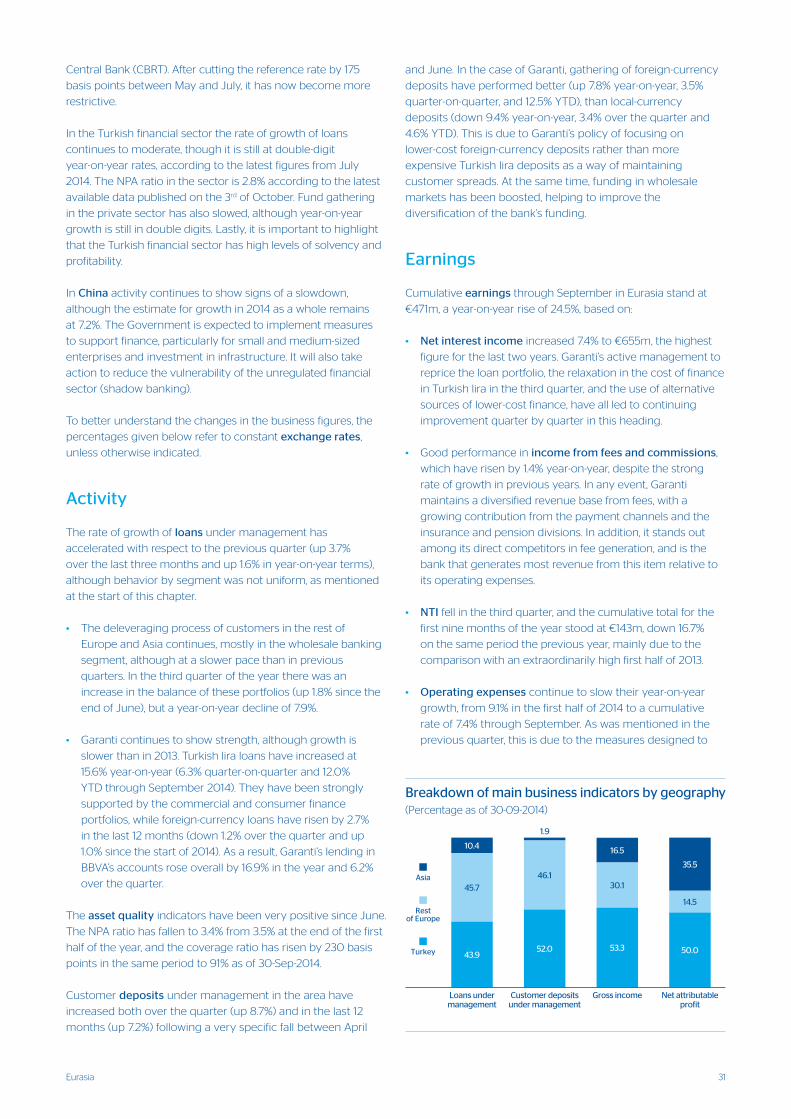
31Eurasia
Central Bank (CBRT). After cutting the reference rate by 175
basis points between May and July, it has now become more
restrictive.
In the Turkish financial sector the rate of growth of loans
continues to moderate, though it is still at double-digit
year-on-year rates, according to the latest figures from July
2014. The NPA ratio in the sector is 2.8% according to the latest
available data published on the 3rd of October. Fund gathering
in the private sector has also slowed, although year-on-year
growth is still in double digits. Lastly, it is important to highlight
that the Turkish financial sector has high levels of solvency and
profitability.
In China activity continues to show signs of a slowdown,
although the estimate for growth in 2014 as a whole remains
at 7.2%. The Government is expected to implement measures
to support finance, particularly for small and medium-sized
enterprises and investment in infrastructure. It will also take
action to reduce the vulnerability of the unregulated financial
sector (shadow banking).
To better understand the changes in the business figures, the
percentages given below refer to constant exchange rates,
unless otherwise indicated.
Activity
The rate of growth of loans under management has
accelerated with respect to the previous quarter (up 3.7%
over the last three months and up 1.6% in year-on-year terms),
although behavior by segment was not uniform, as mentioned
at the start of this chapter.
• The deleveraging process of customers in the rest of
Europe and Asia continues, mostly in the wholesale banking
segment, although at a slower pace than in previous
quarters. In the third quarter of the year there was an
increase in the balance of these portfolios (up 1.8% since the
end of June), but a year-on-year decline of 7.9%.
• Garanti continues to show strength, although growth is
slower than in 2013. Turkish lira loans have increased at
15.6% year-on-year (6.3% quarter-on-quarter and 12.0%
YTD through September 2014). They have been strongly
supported by the commercial and consumer finance
portfolios, while foreign-currency loans have risen by 2.7%
in the last 12 months (down 1.2% over the quarter and up
1.0% since the start of 2014). As a result, Garanti’s lending in
BBVA’s accounts rose overall by 16.9% in the year and 6.2%
over the quarter.
The asset quality indicators have been very positive since June.
The NPA ratio has fallen to 3.4% from 3.5% at the end of the first
half of the year, and the coverage ratio has risen by 230 basis
points in the same period to 91% as of 30-Sep-2014.
Customer deposits under management in the area have
increased both over the quarter (up 8.7%) and in the last 12
months (up 7.2%) following a very specific fall between April
and June. In the case of Garanti, gathering of foreign-currency
deposits have performed better (up 7.8% year-on-year, 3.5%
quarter-on-quarter, and 12.5% YTD), than local-currency
deposits (down 9.4% year-on-year, 3.4% over the quarter and
4.6% YTD). This is due to Garanti’s policy of focusing on
lower-cost foreign-currency deposits rather than more
expensive Turkish lira deposits as a way of maintaining
customer spreads. At the same time, funding in wholesale
markets has been boosted, helping to improve the
diversification of the bank’s funding.
Earnings
Cumulative earnings through September in Eurasia stand at
€471m, a year-on-year rise of 24.5%, based on:
• Net interest income increased 7.4% to €655m, the highest
figure for the last two years. Garanti’s active management to
reprice the loan portfolio, the relaxation in the cost of finance
in Turkish lira in the third quarter, and the use of alternative
sources of lower-cost finance, have all led to continuing
improvement quarter by quarter in this heading.
• Good performance in income from fees and commissions,
which have risen by 1.4% year-on-year, despite the strong
rate of growth in previous years. In any event, Garanti
maintains a diversified revenue base from fees, with a
growing contribution from the payment channels and the
insurance and pension divisions. In addition, it stands out
among its direct competitors in fee generation, and is the
bank that generates most revenue from this item relative to
its operating expenses.
• NTI fell in the third quarter, and the cumulative total for the
first nine months of the year stood at €143m, down 16.7%
on the same period the previous year, mainly due to the
comparison with an extraordinarily high first half of 2013.
• Operating expenses continue to slow their year-on-year
growth, from 9.1% in the first half of 2014 to a cumulative
rate of 7.4% through September. As was mentioned in the
previous quarter, this is due to the measures designed to
���
����
����
����
����
����
����
����
����
�������� ����� ���� ���� ���������������������������������������������� ��
���
�������������
������
���������������� ����� ���� �
�� ��� ���� ���� �
����� ���
����
����
����
��������������������
����� ���� ����� �����
�����
�����
�����
�����
�����
����� ����������
�
��
��
��
��
��
��
��
��
��
���
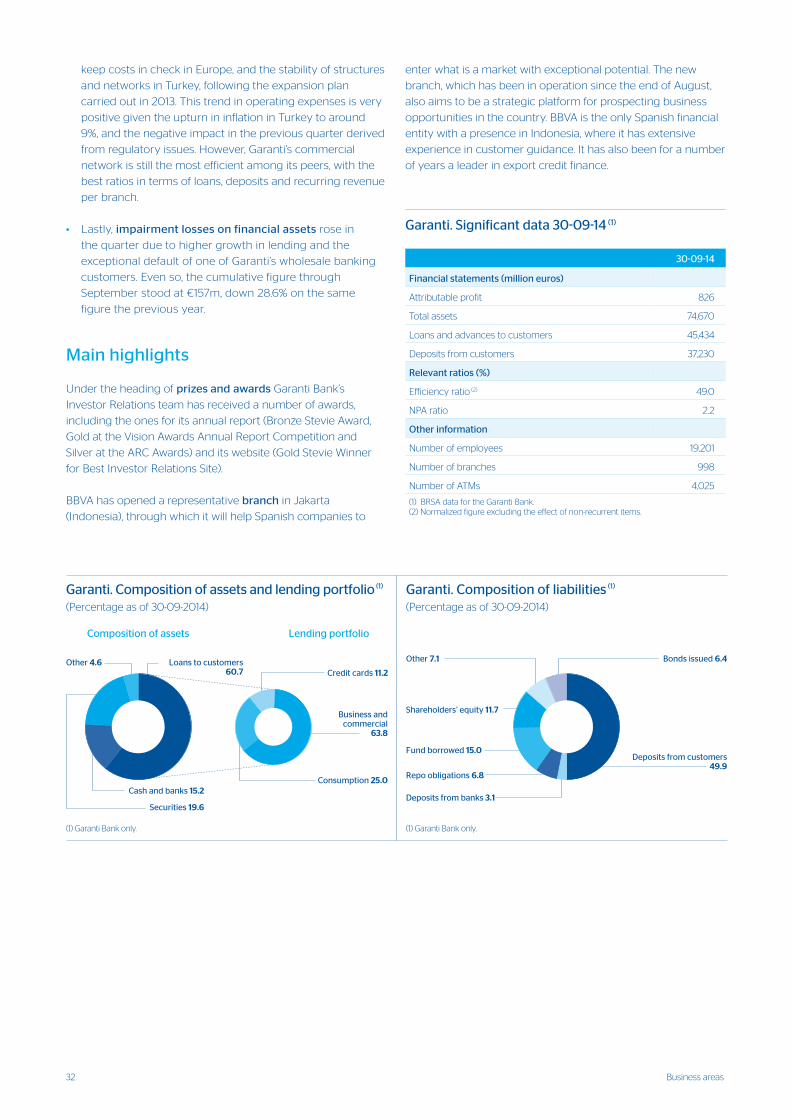
32 Business areas
Garanti. Significant data 30-09-14 (1)
30-09-14
Financial statements (million euros)
Attributable profit 826
Total assets 74,670
Loans and advances to customers 45,434
Deposits from customers 37,230
Relevant ratios (%)
Efficiency ratio (2) 49.0
NPA ratio 2.2
Other information
Number of employees 19,201
Number of branches 998
Number of ATMs 4,025
(1) BRSA data for the Garanti Bank.(2) Normalized figure excluding the effect of non-recurrent items.
keep costs in check in Europe, and the stability of structures
and networks in Turkey, following the expansion plan
carried out in 2013. This trend in operating expenses is very
positive given the upturn in inflation in Turkey to around
9%, and the negative impact in the previous quarter derived
from regulatory issues. However, Garanti’s commercial
network is still the most efficient among its peers, with the
best ratios in terms of loans, deposits and recurring revenue
per branch.
• Lastly, impairment losses on financial assets rose in
the quarter due to higher growth in lending and the
exceptional default of one of Garanti’s wholesale banking
customers. Even so, the cumulative figure through
September stood at €157m, down 28.6% on the same
figure the previous year.
Main highlights
Under the heading of prizes and awards Garanti Bank’s
Investor Relations team has received a number of awards,
including the ones for its annual report (Bronze Stevie Award,
Gold at the Vision Awards Annual Report Competition and
Silver at the ARC Awards) and its website (Gold Stevie Winner
for Best Investor Relations Site).
BBVA has opened a representative branch in Jakarta
(Indonesia), through which it will help Spanish companies to
enter what is a market with exceptional potential. The new
branch, which has been in operation since the end of August,
also aims to be a strategic platform for prospecting business
opportunities in the country. BBVA is the only Spanish financial
entity with a presence in Indonesia, where it has extensive
experience in customer guidance. It has also been for a number
of years a leader in export credit finance.
����������������������������������������������������� ��
�������������������������� ������������������������������������� ��
�������������������������� ��
�����������������
����������������������
�����
���������������
�����������������
����������������
��������������������� �����������������
�������� ����������������������
�����������������������
���������������������������
����������������
�����������������
�������������������
����������������������
��������
� ������������������ � ������������������
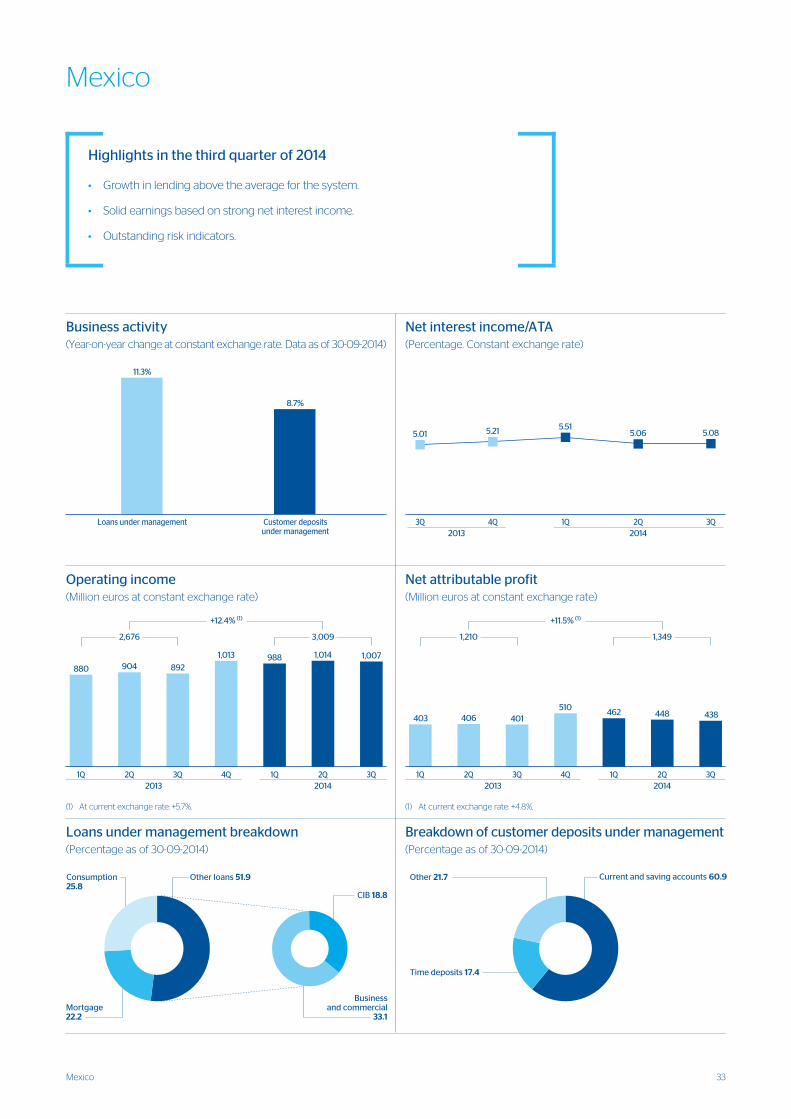
33Mexico
Mexico
����������������������������
������������������������
�
���
���
���
���
�����
�����
��������� ��� ������������������������������������������������
�������������������������������������������������������
� � ������������������������������� � � ��������������������������������
�� �� �� ��
����������
����
�����
��� ��� ��������
������
���
��
����� �����
�� �� �� ��
����������
����
������ ��� ������
������
���
��
����� �����
�����
��
���
��
��������������������������������
����������� ������������������������������������������������������������� ��
�����������������
���������
���������������������������������������������������������� ��
������������
��������
����������������������
����
���������������
���������������
�����������������������������������������������������������
���� �� �����
���� ����
�
�
�
�
�
�
�
��
���� ��������
������ �
� � � �� ��
�� �
�������������������������������������������������������������������������� ����������
�����
�������� ������������
���
��������� ��������� ������������
���
����
�
�
�
�
�
��
��
Highlights in the third quarter of 2014
• Growth in lending above the average for the system.
• Solid earnings based on strong net interest income.
• Outstanding risk indicators.
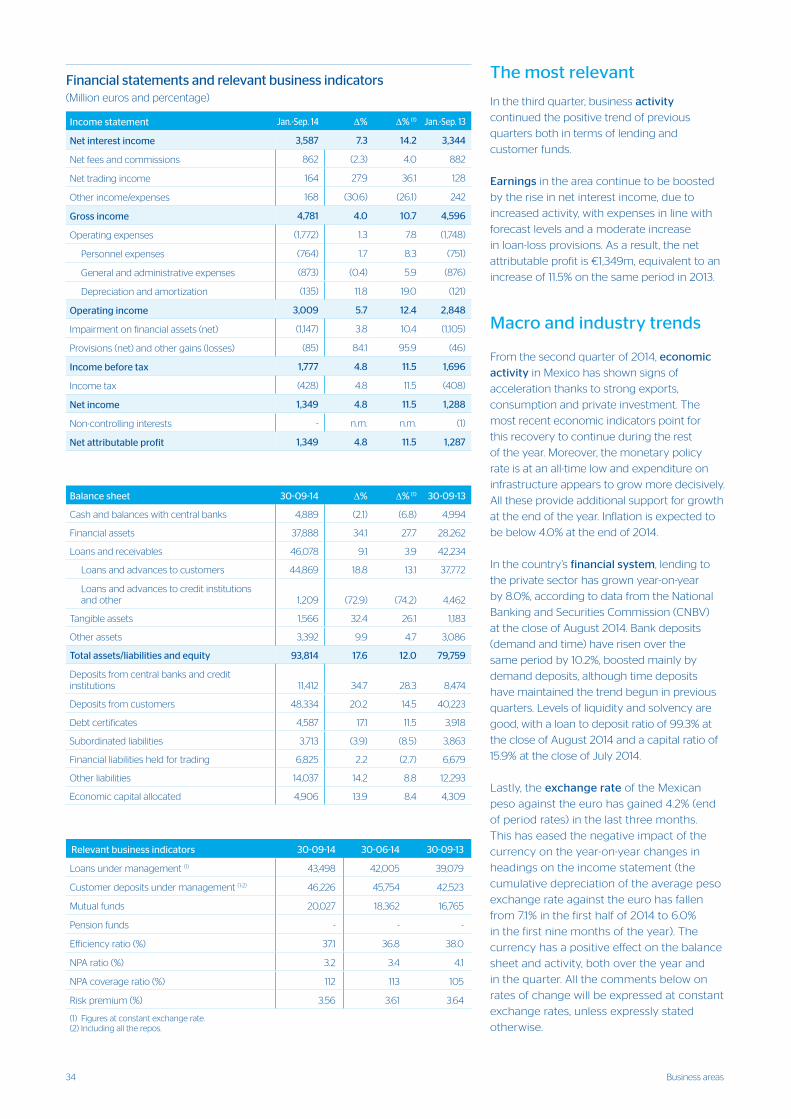
34 Business areas
The most relevant
In the third quarter, business activity
continued the positive trend of previous
quarters both in terms of lending and
customer funds.
Earnings in the area continue to be boosted
by the rise in net interest income, due to
increased activity, with expenses in line with
forecast levels and a moderate increase
in loan-loss provisions. As a result, the net
attributable profit is €1,349m, equivalent to an
increase of 11.5% on the same period in 2013.
Macro and industry trends
From the second quarter of 2014, economic
activity in Mexico has shown signs of
acceleration thanks to strong exports,
consumption and private investment. The
most recent economic indicators point for
this recovery to continue during the rest
of the year. Moreover, the monetary policy
rate is at an all-time low and expenditure on
infrastructure appears to grow more decisively.
All these provide additional support for growth
at the end of the year. Inflation is expected to
be below 4.0% at the end of 2014.
In the country’s financial system, lending to
the private sector has grown year-on-year
by 8.0%, according to data from the National
Banking and Securities Commission (CNBV)
at the close of August 2014. Bank deposits
(demand and time) have risen over the
same period by 10.2%, boosted mainly by
demand deposits, although time deposits
have maintained the trend begun in previous
quarters. Levels of liquidity and solvency are
good, with a loan to deposit ratio of 99.3% at
the close of August 2014 and a capital ratio of
15.9% at the close of July 2014.
Lastly, the exchange rate of the Mexican
peso against the euro has gained 4.2% (end
of period rates) in the last three months.
This has eased the negative impact of the
currency on the year-on-year changes in
headings on the income statement (the
cumulative depreciation of the average peso
exchange rate against the euro has fallen
from 7.1% in the first half of 2014 to 6.0%
in the first nine months of the year). The
currency has a positive effect on the balance
sheet and activity, both over the year and
in the quarter. All the comments below on
rates of change will be expressed at constant
exchange rates, unless expressly stated
otherwise.
Balance sheet 30-09-14 ∆% ∆% (1) 30-09-13
Cash and balances with central banks 4,889 (2.1) (6.8) 4,994
Financial assets 37,888 34.1 27.7 28,262
Loans and receivables 46,078 9.1 3.9 42,234
Loans and advances to customers 44,869 18.8 13.1 37,772
Loans and advances to credit institutions and other 1,209 (72.9) (74.2) 4,462
Tangible assets 1,566 32.4 26.1 1,183
Other assets 3,392 9.9 4.7 3,086
Total assets/liabilities and equity 93,814 17.6 12.0 79,759
Deposits from central banks and credit institutions 11,412 34.7 28.3 8,474
Deposits from customers 48,334 20.2 14.5 40,223
Debt certificates 4,587 17.1 11.5 3,918
Subordinated liabilities 3,713 (3.9) (8.5) 3,863
Financial liabilities held for trading 6,825 2.2 (2.7) 6,679
Other liabilities 14,037 14.2 8.8 12,293
Economic capital allocated 4,906 13.9 8.4 4,309
Relevant business indicators 30-09-14 30-06-14 30-09-13
Loans under management (1) 43,498 42,005 39,079
Customer deposits under management (1-2) 46,226 45,754 42,523
Mutual funds 20,027 18,362 16,765
Pension funds - - -
Efficiency ratio (%) 37.1 36.8 38.0
NPA ratio (%) 3.2 3.4 4.1
NPA coverage ratio (%) 112 113 105
Risk premium (%) 3.56 3.61 3.64
(1) Figures at constant exchange rate.(2) Including all the repos.
Financial statements and relevant business indicators (Million euros and percentage)
Income statement Jan.-Sep. 14 ∆% ∆% (1) Jan.-Sep. 13
Net interest income 3,587 7.3 14.2 3,344
Net fees and commissions 862 (2.3) 4.0 882
Net trading income 164 27.9 36.1 128
Other income/expenses 168 (30.6) (26.1) 242
Gross income 4,781 4.0 10.7 4,596
Operating expenses (1,772) 1.3 7.8 (1,748)
Personnel expenses (764) 1.7 8.3 (751)
General and administrative expenses (873) (0.4) 5.9 (876)
Depreciation and amortization (135) 11.8 19.0 (121)
Operating income 3,009 5.7 12.4 2,848
Impairment on financial assets (net) (1,147) 3.8 10.4 (1,105)
Provisions (net) and other gains (losses) (85) 84.1 95.9 (46)
Income before tax 1,777 4.8 11.5 1,696
Income tax (428) 4.8 11.5 (408)
Net income 1,349 4.8 11.5 1,288
Non-controlling interests - n.m. n.m. (1)
Net attributable profit 1,349 4.8 11.5 1,287
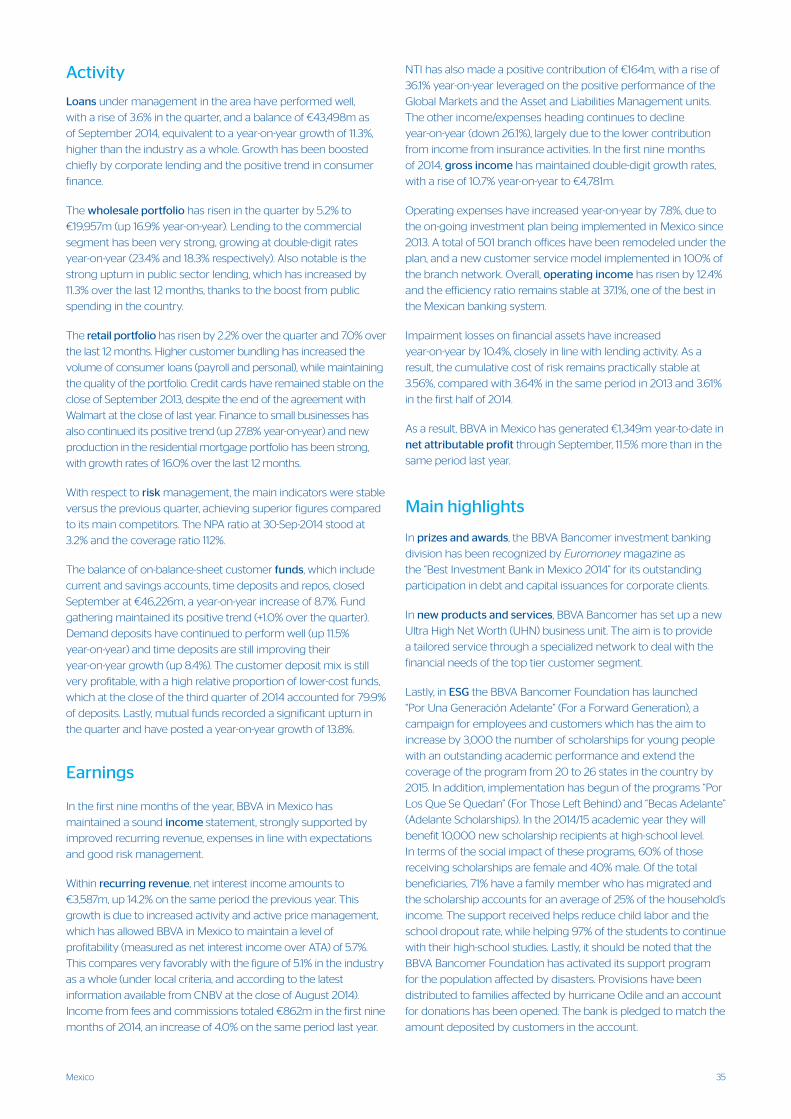
35Mexico
NTI has also made a positive contribution of €164m, with a rise of
36.1% year-on-year leveraged on the positive performance of the
Global Markets and the Asset and Liabilities Management units.
The other income/expenses heading continues to decline
year-on-year (down 26.1%), largely due to the lower contribution
from income from insurance activities. In the first nine months
of 2014, gross income has maintained double-digit growth rates,
with a rise of 10.7% year-on-year to €4,781m.
Operating expenses have increased year-on-year by 7.8%, due to
the on-going investment plan being implemented in Mexico since
2013. A total of 501 branch offices have been remodeled under the
plan, and a new customer service model implemented in 100% of
the branch network. Overall, operating income has risen by 12.4%
and the efficiency ratio remains stable at 37.1%, one of the best in
the Mexican banking system.
Impairment losses on financial assets have increased
year-on-year by 10.4%, closely in line with lending activity. As a
result, the cumulative cost of risk remains practically stable at
3.56%, compared with 3.64% in the same period in 2013 and 3.61%
in the first half of 2014.
As a result, BBVA in Mexico has generated €1,349m year-to-date in
net attributable profit through September, 11.5% more than in the
same period last year.
Main highlights
In prizes and awards, the BBVA Bancomer investment banking
division has been recognized by Euromoney magazine as
the “Best Investment Bank in Mexico 2014” for its outstanding
participation in debt and capital issuances for corporate clients.
In new products and services, BBVA Bancomer has set up a new
Ultra High Net Worth (UHN) business unit. The aim is to provide
a tailored service through a specialized network to deal with the
financial needs of the top tier customer segment.
Lastly, in ESG the BBVA Bancomer Foundation has launched
“Por Una Generación Adelante” (For a Forward Generation), a
campaign for employees and customers which has the aim to
increase by 3,000 the number of scholarships for young people
with an outstanding academic performance and extend the
coverage of the program from 20 to 26 states in the country by
2015. In addition, implementation has begun of the programs “Por
Los Que Se Quedan” (For Those Left Behind) and “Becas Adelante”
(Adelante Scholarships). In the 2014/15 academic year they will
benefit 10,000 new scholarship recipients at high-school level.
In terms of the social impact of these programs, 60% of those
receiving scholarships are female and 40% male. Of the total
beneficiaries, 71% have a family member who has migrated and
the scholarship accounts for an average of 25% of the household’s
income. The support received helps reduce child labor and the
school dropout rate, while helping 97% of the students to continue
with their high-school studies. Lastly, it should be noted that the
BBVA Bancomer Foundation has activated its support program
for the population affected by disasters. Provisions have been
distributed to families affected by hurricane Odile and an account
for donations has been opened. The bank is pledged to match the
amount deposited by customers in the account.
Activity
Loans under management in the area have performed well,
with a rise of 3.6% in the quarter, and a balance of €43,498m as
of September 2014, equivalent to a year-on-year growth of 11.3%,
higher than the industry as a whole. Growth has been boosted
chiefly by corporate lending and the positive trend in consumer
finance.
The wholesale portfolio has risen in the quarter by 5.2% to
€19,957m (up 16.9% year-on-year). Lending to the commercial
segment has been very strong, growing at double-digit rates
year-on-year (23.4% and 18.3% respectively). Also notable is the
strong upturn in public sector lending, which has increased by
11.3% over the last 12 months, thanks to the boost from public
spending in the country.
The retail portfolio has risen by 2.2% over the quarter and 7.0% over
the last 12 months. Higher customer bundling has increased the
volume of consumer loans (payroll and personal), while maintaining
the quality of the portfolio. Credit cards have remained stable on the
close of September 2013, despite the end of the agreement with
Walmart at the close of last year. Finance to small businesses has
also continued its positive trend (up 27.8% year-on-year) and new
production in the residential mortgage portfolio has been strong,
with growth rates of 16.0% over the last 12 months.
With respect to risk management, the main indicators were stable
versus the previous quarter, achieving superior figures compared
to its main competitors. The NPA ratio at 30-Sep-2014 stood at
3.2% and the coverage ratio 112%.
The balance of on-balance-sheet customer funds, which include
current and savings accounts, time deposits and repos, closed
September at €46,226m, a year-on-year increase of 8.7%. Fund
gathering maintained its positive trend (+1.0% over the quarter).
Demand deposits have continued to perform well (up 11.5%
year-on-year) and time deposits are still improving their
year-on-year growth (up 8.4%). The customer deposit mix is still
very profitable, with a high relative proportion of lower-cost funds,
which at the close of the third quarter of 2014 accounted for 79.9%
of deposits. Lastly, mutual funds recorded a significant upturn in
the quarter and have posted a year-on-year growth of 13.8%.
Earnings
In the first nine months of the year, BBVA in Mexico has
maintained a sound income statement, strongly supported by
improved recurring revenue, expenses in line with expectations
and good risk management.
Within recurring revenue, net interest income amounts to
€3,587m, up 14.2% on the same period the previous year. This
growth is due to increased activity and active price management,
which has allowed BBVA in Mexico to maintain a level of
profitability (measured as net interest income over ATA) of 5.7%.
This compares very favorably with the figure of 5.1% in the industry
as a whole (under local criteria, and according to the latest
information available from CNBV at the close of August 2014).
Income from fees and commissions totaled €862m in the first nine
months of 2014, an increase of 4.0% on the same period last year.
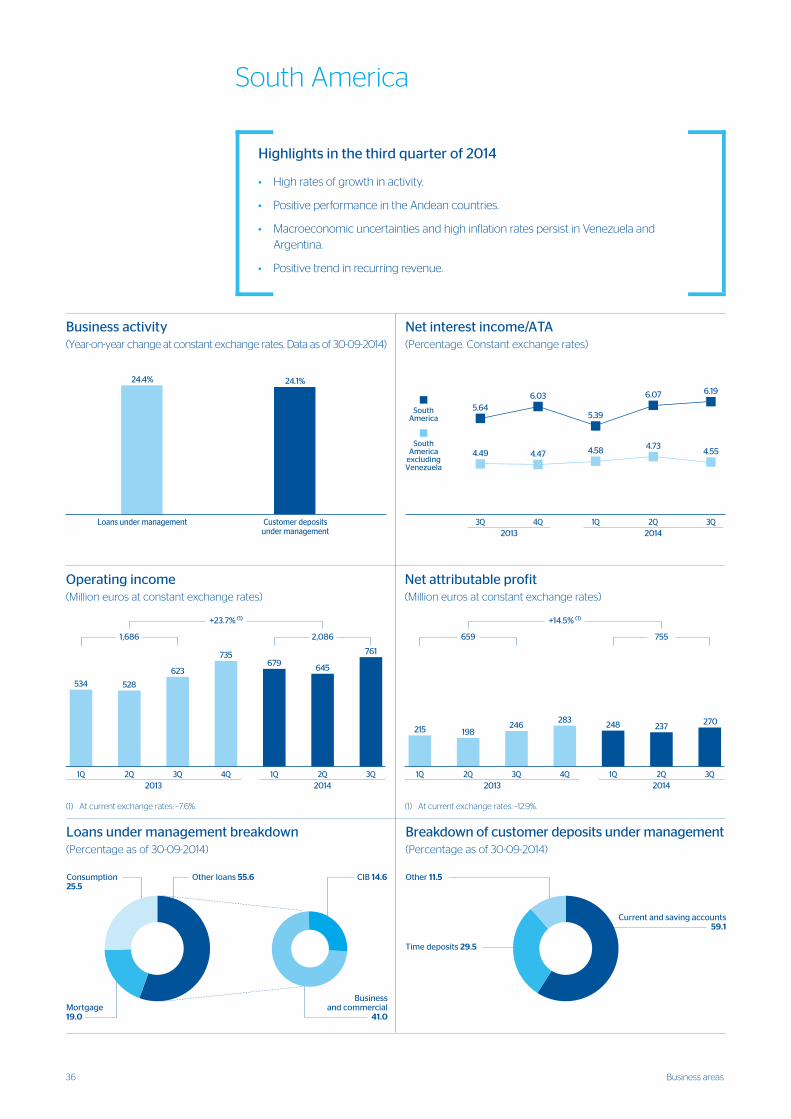
36 Business areas
South America
Highlights in the third quarter of 2014
• High rates of growth in activity.
• Positive performance in the Andean countries.
• Macroeconomic uncertainties and high inflation rates persist in Venezuela and Argentina.
• Positive trend in recurring revenue.
������
���
������
���
��� ���
��� ������
���������������
�
���
���
���
���
���
���
���
���
�������� �����������������������������������������������
����������������������������������������������������������������
� � �������������������������������� � � ���������������������������� �����
�� �� �� ��
����������
����
���
��� ���
���
���
������
���
��
����� �����
�� �� �� ��
����������
����
������ ���
������
������
���
��
��� ���
���
��
���
��
��������������������������������
����������� ������������������������������������������������������������� ��
�����������������
���������
���������������������������������������������������������� ��
������������
��������
����������������������
����
���������������
���������������
������������������������������������������������������������
������ �
����
�� ���
���� ���� ���� ��������
�
�
�
�
�
����
��
����
����� �
����������� �������
������������
������������������������������
�� �� ��� � � �
� ��
��������������������������������������������������������������������������� ����������
�����
�������� ������������
����
��������� ��������� ������������
��������
�
�
��
��
��
��
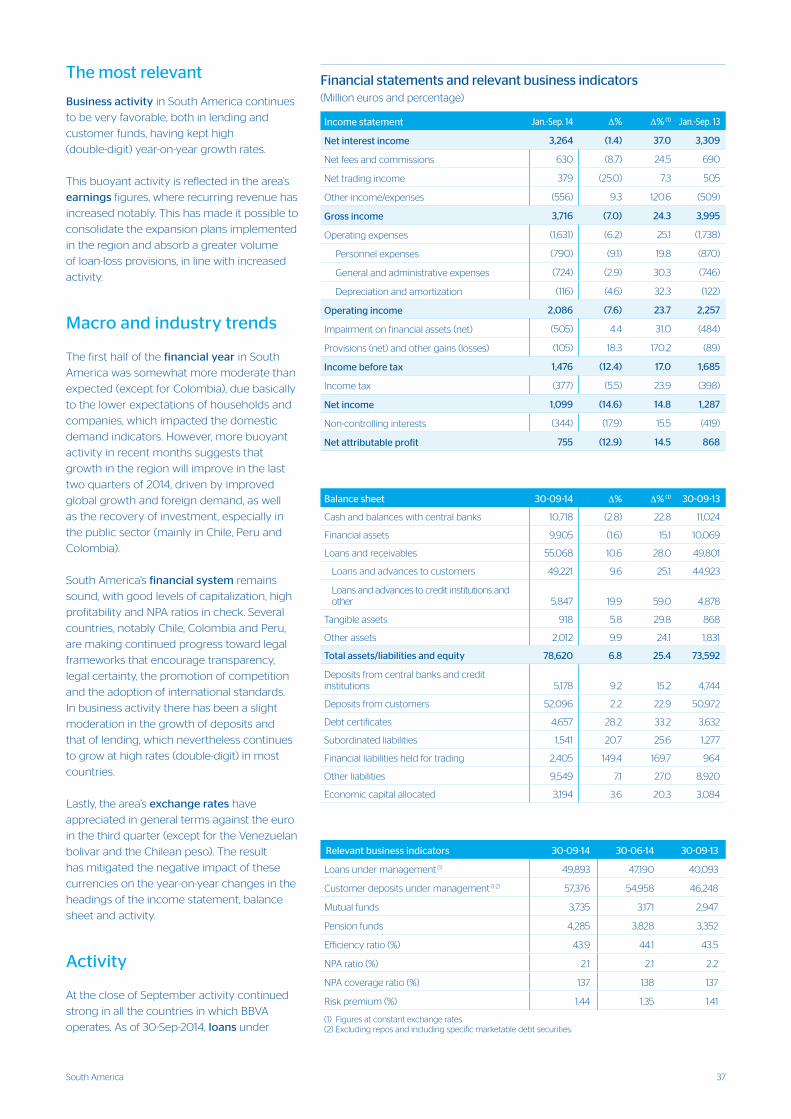
37South America
The most relevant
Business activity in South America continues
to be very favorable, both in lending and
customer funds, having kept high
(double-digit) year-on-year growth rates.
This buoyant activity is reflected in the area’s
earnings figures, where recurring revenue has
increased notably. This has made it possible to
consolidate the expansion plans implemented
in the region and absorb a greater volume
of loan-loss provisions, in line with increased
activity.
Macro and industry trends
The first half of the financial year in South
America was somewhat more moderate than
expected (except for Colombia), due basically
to the lower expectations of households and
companies, which impacted the domestic
demand indicators. However, more buoyant
activity in recent months suggests that
growth in the region will improve in the last
two quarters of 2014, driven by improved
global growth and foreign demand, as well
as the recovery of investment, especially in
the public sector (mainly in Chile, Peru and
Colombia).
South America’s financial system remains
sound, with good levels of capitalization, high
profitability and NPA ratios in check. Several
countries, notably Chile, Colombia and Peru,
are making continued progress toward legal
frameworks that encourage transparency,
legal certainty, the promotion of competition
and the adoption of international standards.
In business activity there has been a slight
moderation in the growth of deposits and
that of lending, which nevertheless continues
to grow at high rates (double-digit) in most
countries.
Lastly, the area’s exchange rates have
appreciated in general terms against the euro
in the third quarter (except for the Venezuelan
bolivar and the Chilean peso). The result
has mitigated the negative impact of these
currencies on the year-on-year changes in the
headings of the income statement, balance
sheet and activity.
Activity
At the close of September activity continued
strong in all the countries in which BBVA
operates. As of 30-Sep-2014, loans under
Balance sheet 30-09-14 ∆% ∆% (1) 30-09-13
Cash and balances with central banks 10,718 (2.8) 22.8 11,024
Financial assets 9,905 (1.6) 15.1 10,069
Loans and receivables 55,068 10.6 28.0 49,801
Loans and advances to customers 49,221 9.6 25.1 44,923
Loans and advances to credit institutions and other 5,847 19.9 59.0 4,878
Tangible assets 918 5.8 29.8 868
Other assets 2,012 9.9 24.1 1,831
Total assets/liabilities and equity 78,620 6.8 25.4 73,592
Deposits from central banks and credit institutions 5,178 9.2 15.2 4,744
Deposits from customers 52,096 2.2 22.9 50,972
Debt certificates 4,657 28.2 33.2 3,632
Subordinated liabilities 1,541 20.7 25.6 1,277
Financial liabilities held for trading 2,405 149.4 169.7 964
Other liabilities 9,549 7.1 27.0 8,920
Economic capital allocated 3,194 3.6 20.3 3,084
Relevant business indicators 30-09-14 30-06-14 30-09-13
Loans under management (1) 49,893 47,190 40,093
Customer deposits under management (1-2) 57,376 54,958 46,248
Mutual funds 3,735 3,171 2,947
Pension funds 4,285 3,828 3,352
Efficiency ratio (%) 43.9 44.1 43.5
NPA ratio (%) 2.1 2.1 2.2
NPA coverage ratio (%) 137 138 137
Risk premium (%) 1.44 1.35 1.41
(1) Figures at constant exchange rates. (2) Excluding repos and including specific marketable debt securities.
Financial statements and relevant business indicators (Million euros and percentage)
Income statement Jan.-Sep. 14 ∆% ∆% (1) Jan.-Sep. 13
Net interest income 3,264 (1.4) 37.0 3,309
Net fees and commissions 630 (8.7) 24.5 690
Net trading income 379 (25.0) 7.3 505
Other income/expenses (556) 9.3 120.6 (509)
Gross income 3,716 (7.0) 24.3 3,995
Operating expenses (1,631) (6.2) 25.1 (1,738)
Personnel expenses (790) (9.1) 19.8 (870)
General and administrative expenses (724) (2.9) 30.3 (746)
Depreciation and amortization (116) (4.6) 32.3 (122)
Operating income 2,086 (7.6) 23.7 2,257
Impairment on financial assets (net) (505) 4.4 31.0 (484)
Provisions (net) and other gains (losses) (105) 18.3 170.2 (89)
Income before tax 1,476 (12.4) 17.0 1,685
Income tax (377) (5.5) 23.9 (398)
Net income 1,099 (14.6) 14.8 1,287
Non-controlling interests (344) (17.9) 15.5 (419)
Net attributable profit 755 (12.9) 14.5 868
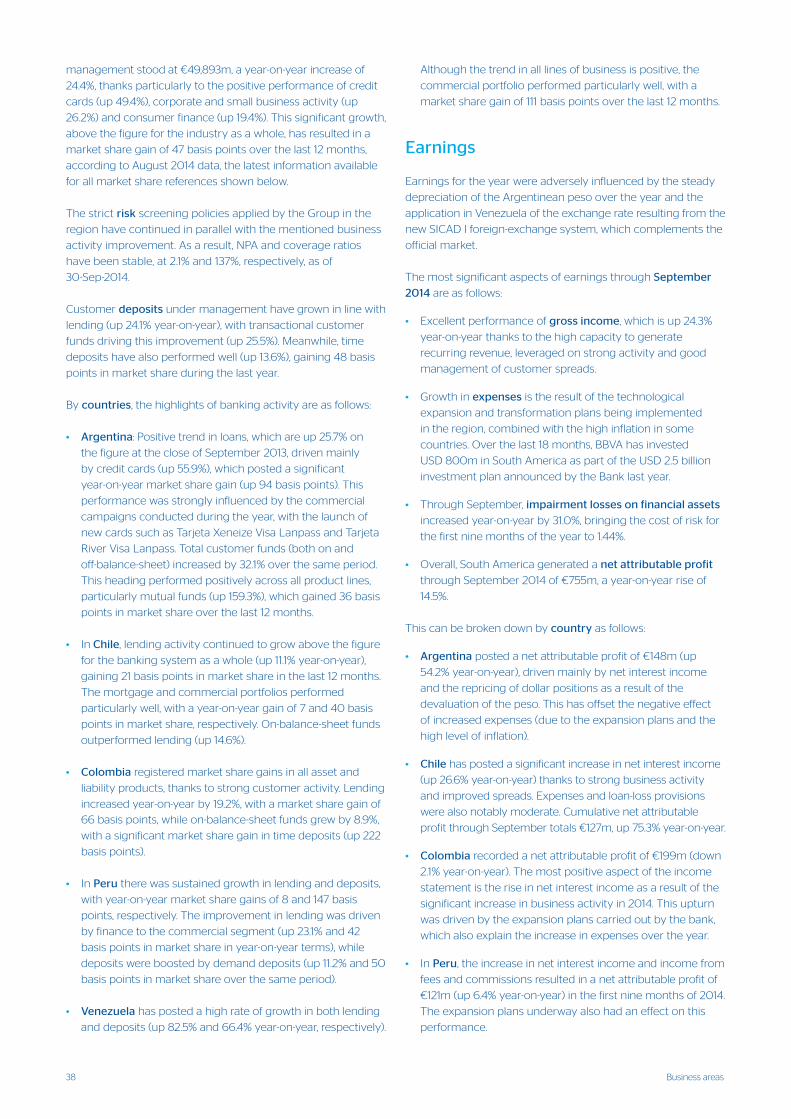
38 Business areas
Although the trend in all lines of business is positive, the
commercial portfolio performed particularly well, with a
market share gain of 111 basis points over the last 12 months.
Earnings
Earnings for the year were adversely influenced by the steady
depreciation of the Argentinean peso over the year and the
application in Venezuela of the exchange rate resulting from the
new SICAD I foreign-exchange system, which complements the
official market.
The most significant aspects of earnings through September
2014 are as follows:
• Excellent performance of gross income, which is up 24.3%
year-on-year thanks to the high capacity to generate
recurring revenue, leveraged on strong activity and good
management of customer spreads.
• Growth in expenses is the result of the technological
expansion and transformation plans being implemented
in the region, combined with the high inflation in some
countries. Over the last 18 months, BBVA has invested
USD 800m in South America as part of the USD 2.5 billion
investment plan announced by the Bank last year.
• Through September, impairment losses on financial assets
increased year-on-year by 31.0%, bringing the cost of risk for
the first nine months of the year to 1.44%.
• Overall, South America generated a net attributable profit
through September 2014 of €755m, a year-on-year rise of
14.5%.
This can be broken down by country as follows:
• Argentina posted a net attributable profit of €148m (up
54.2% year-on-year), driven mainly by net interest income
and the repricing of dollar positions as a result of the
devaluation of the peso. This has offset the negative effect
of increased expenses (due to the expansion plans and the
high level of inflation).
• Chile has posted a significant increase in net interest income
(up 26.6% year-on-year) thanks to strong business activity
and improved spreads. Expenses and loan-loss provisions
were also notably moderate. Cumulative net attributable
profit through September totals €127m, up 75.3% year-on-year.
• Colombia recorded a net attributable profit of €199m (down
2.1% year-on-year). The most positive aspect of the income
statement is the rise in net interest income as a result of the
significant increase in business activity in 2014. This upturn
was driven by the expansion plans carried out by the bank,
which also explain the increase in expenses over the year.
• In Peru, the increase in net interest income and income from
fees and commissions resulted in a net attributable profit of
€121m (up 6.4% year-on-year) in the first nine months of 2014.
The expansion plans underway also had an effect on this
performance.
management stood at €49,893m, a year-on-year increase of
24.4%, thanks particularly to the positive performance of credit
cards (up 49.4%), corporate and small business activity (up
26.2%) and consumer finance (up 19.4%). This significant growth,
above the figure for the industry as a whole, has resulted in a
market share gain of 47 basis points over the last 12 months,
according to August 2014 data, the latest information available
for all market share references shown below.
The strict risk screening policies applied by the Group in the
region have continued in parallel with the mentioned business
activity improvement. As a result, NPA and coverage ratios
have been stable, at 2.1% and 137%, respectively, as of
30-Sep-2014.
Customer deposits under management have grown in line with
lending (up 24.1% year-on-year), with transactional customer
funds driving this improvement (up 25.5%). Meanwhile, time
deposits have also performed well (up 13.6%), gaining 48 basis
points in market share during the last year.
By countries, the highlights of banking activity are as follows:
• Argentina: Positive trend in loans, which are up 25.7% on
the figure at the close of September 2013, driven mainly
by credit cards (up 55.9%), which posted a significant
year-on-year market share gain (up 94 basis points). This
performance was strongly influenced by the commercial
campaigns conducted during the year, with the launch of
new cards such as Tarjeta Xeneize Visa Lanpass and Tarjeta
River Visa Lanpass. Total customer funds (both on and
off-balance-sheet) increased by 32.1% over the same period.
This heading performed positively across all product lines,
particularly mutual funds (up 159.3%), which gained 36 basis
points in market share over the last 12 months.
• In Chile, lending activity continued to grow above the figure
for the banking system as a whole (up 11.1% year-on-year),
gaining 21 basis points in market share in the last 12 months.
The mortgage and commercial portfolios performed
particularly well, with a year-on-year gain of 7 and 40 basis
points in market share, respectively. On-balance-sheet funds
outperformed lending (up 14.6%).
• Colombia registered market share gains in all asset and
liability products, thanks to strong customer activity. Lending
increased year-on-year by 19.2%, with a market share gain of
66 basis points, while on-balance-sheet funds grew by 8.9%,
with a significant market share gain in time deposits (up 222
basis points).
• In Peru there was sustained growth in lending and deposits,
with year-on-year market share gains of 8 and 147 basis
points, respectively. The improvement in lending was driven
by finance to the commercial segment (up 23.1% and 42
basis points in market share in year-on-year terms), while
deposits were boosted by demand deposits (up 11.2% and 50
basis points in market share over the same period).
• Venezuela has posted a high rate of growth in both lending
and deposits (up 82.5% and 66.4% year-on-year, respectively).
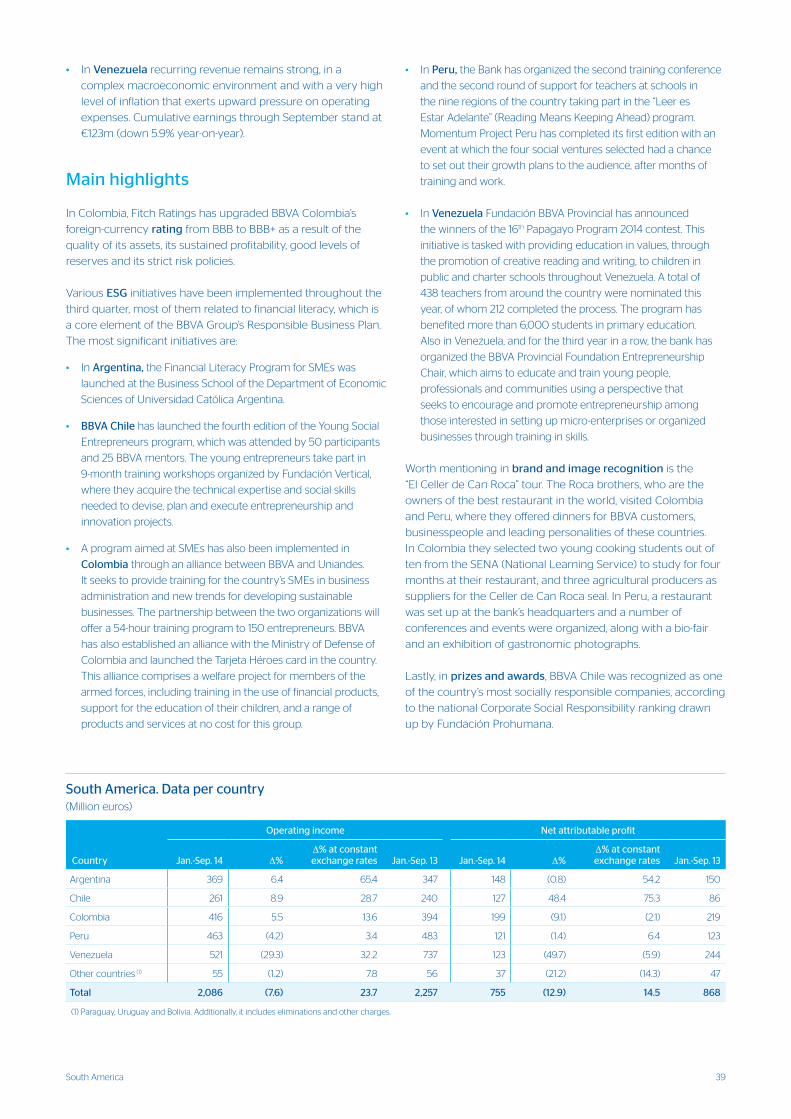
39South America
• In Venezuela recurring revenue remains strong, in a
complex macroeconomic environment and with a very high
level of inflation that exerts upward pressure on operating
expenses. Cumulative earnings through September stand at
€123m (down 5.9% year-on-year).
Main highlights
In Colombia, Fitch Ratings has upgraded BBVA Colombia’s
foreign-currency rating from BBB to BBB+ as a result of the
quality of its assets, its sustained profitability, good levels of
reserves and its strict risk policies.
Various ESG initiatives have been implemented throughout the
third quarter, most of them related to financial literacy, which is
a core element of the BBVA Group’s Responsible Business Plan.
The most significant initiatives are:
• In Argentina, the Financial Literacy Program for SMEs was
launched at the Business School of the Department of Economic
Sciences of Universidad Católica Argentina.
• BBVA Chile has launched the fourth edition of the Young Social
Entrepreneurs program, which was attended by 50 participants
and 25 BBVA mentors. The young entrepreneurs take part in
9-month training workshops organized by Fundación Vertical,
where they acquire the technical expertise and social skills
needed to devise, plan and execute entrepreneurship and
innovation projects.
• A program aimed at SMEs has also been implemented in
Colombia through an alliance between BBVA and Uniandes.
It seeks to provide training for the country’s SMEs in business
administration and new trends for developing sustainable
businesses. The partnership between the two organizations will
offer a 54-hour training program to 150 entrepreneurs. BBVA
has also established an alliance with the Ministry of Defense of
Colombia and launched the Tarjeta Héroes card in the country.
This alliance comprises a welfare project for members of the
armed forces, including training in the use of financial products,
support for the education of their children, and a range of
products and services at no cost for this group.
• In Peru, the Bank has organized the second training conference
and the second round of support for teachers at schools in
the nine regions of the country taking part in the “Leer es
Estar Adelante” (Reading Means Keeping Ahead) program.
Momentum Project Peru has completed its first edition with an
event at which the four social ventures selected had a chance
to set out their growth plans to the audience, after months of
training and work.
• In Venezuela Fundación BBVA Provincial has announced
the winners of the 16th Papagayo Program 2014 contest. This
initiative is tasked with providing education in values, through
the promotion of creative reading and writing, to children in
public and charter schools throughout Venezuela. A total of
438 teachers from around the country were nominated this
year, of whom 212 completed the process. The program has
benefited more than 6,000 students in primary education.
Also in Venezuela, and for the third year in a row, the bank has
organized the BBVA Provincial Foundation Entrepreneurship
Chair, which aims to educate and train young people,
professionals and communities using a perspective that
seeks to encourage and promote entrepreneurship among
those interested in setting up micro-enterprises or organized
businesses through training in skills.
Worth mentioning in brand and image recognition is the
“El Celler de Can Roca” tour. The Roca brothers, who are the
owners of the best restaurant in the world, visited Colombia
and Peru, where they offered dinners for BBVA customers,
businesspeople and leading personalities of these countries.
In Colombia they selected two young cooking students out of
ten from the SENA (National Learning Service) to study for four
months at their restaurant, and three agricultural producers as
suppliers for the Celler de Can Roca seal. In Peru, a restaurant
was set up at the bank’s headquarters and a number of
conferences and events were organized, along with a bio-fair
and an exhibition of gastronomic photographs.
Lastly, in prizes and awards, BBVA Chile was recognized as one
of the country’s most socially responsible companies, according
to the national Corporate Social Responsibility ranking drawn
up by Fundación Prohumana.
South America. Data per country(Million euros)
Operating income Net attributable profit
Country Jan.-Sep. 14 ∆% ∆% at constant exchange rates Jan.-Sep. 13 Jan.-Sep. 14 ∆%
∆% at constant exchange rates Jan.-Sep. 13
Argentina 369 6.4 65.4 347 148 (0.8) 54.2 150
Chile 261 8.9 28.7 240 127 48.4 75.3 86
Colombia 416 5.5 13.6 394 199 (9.1) (2.1) 219
Peru 463 (4.2) 3.4 483 121 (1.4) 6.4 123
Venezuela 521 (29.3) 32.2 737 123 (49.7) (5.9) 244
Other countries (1) 55 (1.2) 7.8 56 37 (21.2) (14.3) 47
Total 2,086 (7.6) 23.7 2,257 755 (12.9) 14.5 868
(1) Paraguay, Uruguay and Bolivia. Additionally, it includes eliminations and other charges.
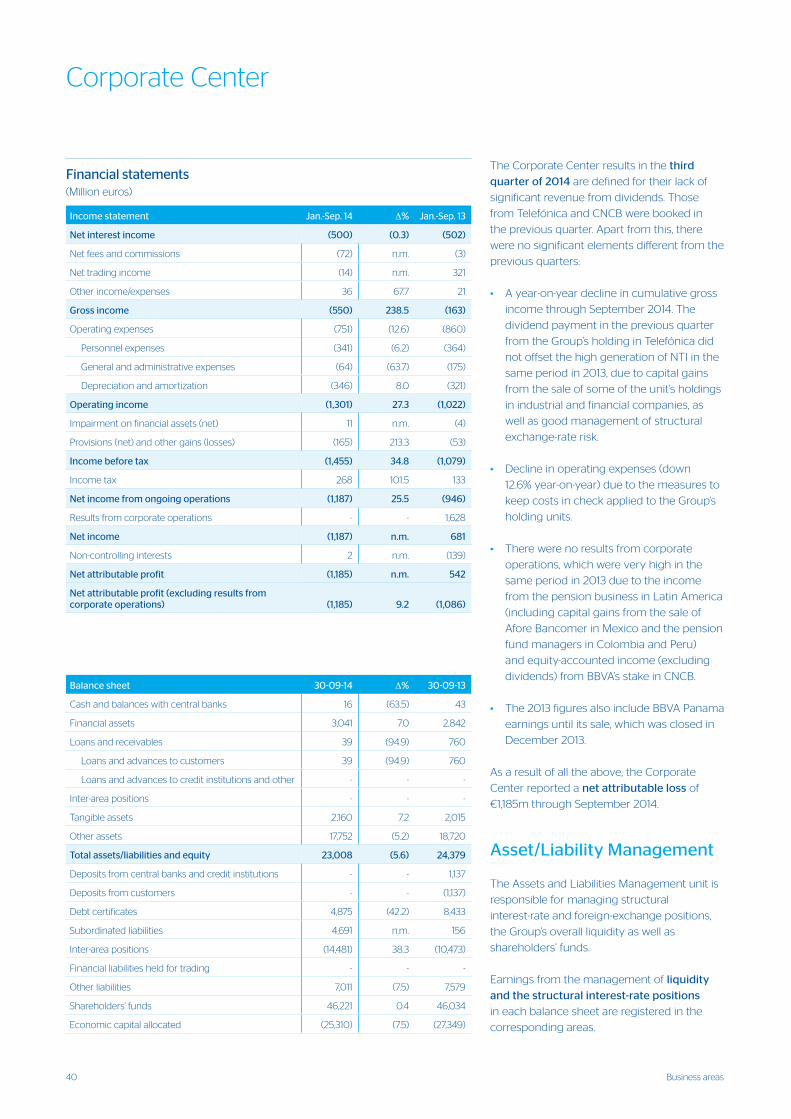
40 Business areas
Corporate Center
Balance sheet 30-09-14 ∆% 30-09-13
Cash and balances with central banks 16 (63.5) 43
Financial assets 3,041 7.0 2,842
Loans and receivables 39 (94.9) 760
Loans and advances to customers 39 (94.9) 760
Loans and advances to credit institutions and other - - -
Inter-area positions - - -
Tangible assets 2,160 7.2 2,015
Other assets 17,752 (5.2) 18,720
Total assets/liabilities and equity 23,008 (5.6) 24,379
Deposits from central banks and credit institutions - - 1,137
Deposits from customers - - (1,137)
Debt certificates 4,875 (42.2) 8,433
Subordinated liabilities 4,691 n.m. 156
Inter-area positions (14,481) 38.3 (10,473)
Financial liabilities held for trading - - -
Other liabilities 7,011 (7.5) 7,579
Shareholders' funds 46,221 0.4 46,034
Economic capital allocated (25,310) (7.5) (27,349)
The Corporate Center results in the third
quarter of 2014 are defined for their lack of
significant revenue from dividends. Those
from Telefónica and CNCB were booked in
the previous quarter. Apart from this, there
were no significant elements different from the
previous quarters:
• A year-on-year decline in cumulative gross
income through September 2014. The
dividend payment in the previous quarter
from the Group’s holding in Telefónica did
not offset the high generation of NTI in the
same period in 2013, due to capital gains
from the sale of some of the unit’s holdings
in industrial and financial companies, as
well as good management of structural
exchange-rate risk.
• Decline in operating expenses (down
12.6% year-on-year) due to the measures to
keep costs in check applied to the Group’s
holding units.
• There were no results from corporate
operations, which were very high in the
same period in 2013 due to the income
from the pension business in Latin America
(including capital gains from the sale of
Afore Bancomer in Mexico and the pension
fund managers in Colombia and Peru)
and equity-accounted income (excluding
dividends) from BBVA’s stake in CNCB.
• The 2013 figures also include BBVA Panama
earnings until its sale, which was closed in
December 2013.
As a result of all the above, the Corporate
Center reported a net attributable loss of
€1,185m through September 2014.
Asset/Liability Management
The Assets and Liabilities Management unit is
responsible for managing structural
interest-rate and foreign-exchange positions,
the Group’s overall liquidity as well as
shareholders’ funds.
Earnings from the management of liquidity
and the structural interest-rate positions
in each balance sheet are registered in the
corresponding areas.
Financial statements (Million euros)
Income statement Jan.-Sep. 14 ∆% Jan.-Sep. 13
Net interest income (500) (0.3) (502)
Net fees and commissions (72) n.m. (3)
Net trading income (14) n.m. 321
Other income/expenses 36 67.7 21
Gross income (550) 238.5 (163)
Operating expenses (751) (12.6) (860)
Personnel expenses (341) (6.2) (364)
General and administrative expenses (64) (63.7) (175)
Depreciation and amortization (346) 8.0 (321)
Operating income (1,301) 27.3 (1,022)
Impairment on financial assets (net) 11 n.m. (4)
Provisions (net) and other gains (losses) (165) 213.3 (53)
Income before tax (1,455) 34.8 (1,079)
Income tax 268 101.5 133
Net income from ongoing operations (1,187) 25.5 (946)
Results from corporate operations - - 1,628
Net income (1,187) n.m. 681
Non-controlling interests 2 n.m. (139)
Net attributable profit (1,185) n.m. 542
Net attributable profit (excluding results from corporate operations) (1,185) 9.2 (1,086)
41Corporate Center
With respect to the management of
exchange-rate risk of the BBVA Group’s
long-term corporate investments, the results
are included in the Corporate Center and
explained in detail in the Risk Management
section, under the sub-section Structural
Risks.
The bank’s capital management has a
twofold aim: to maintain levels of capitalization
appropriate to the business targets in all the
countries in which it operates and, at the same
time, to maximize return on shareholders’
funds through the efficient allocation of capital
to the various units, good management of the
balance sheet and proportionate use of the
various instruments that comprise the Group’s
equity: common stock, preferred securities,
conditional convertible bonds and subordinate
debt.
In the third quarter of 2014 the following
capital management actions were carried out:
• BBVA Continental in Peru issued USD
300m in subordinated debt, with a coupon
of 5.25%.
• The Group has reported to the market its
intention of redeeming two subordinated
debt issues at their next call date on
October 20. The outstanding balances of
these issues amount to €633m and €26m,
respectively.
• In addition, in October the system of flexible
remuneration called the “dividend option”
was implemented for a gross €0.08 per
share, offering shareholders the possibility
of receiving their remuneration in new
BBVA shares, or in cash, as they choose. The
percentage of shareholders choosing to
receive new BBVA shares was 85.1%. This high
percentage again confirms the confidence
of shareholders in the future evolution of the
share. The number of ordinary BBVA shares
issued under the bonus issue was 41,746,041,
representing a saving in the Group’s capital
base of 12 basis points.
These measures mean that the current levels
of the Group’s capitalization easily meet the
legal limits and enable appropriate compliance
with all the capital targets, as has been
reflected in the Capital Base chapter.
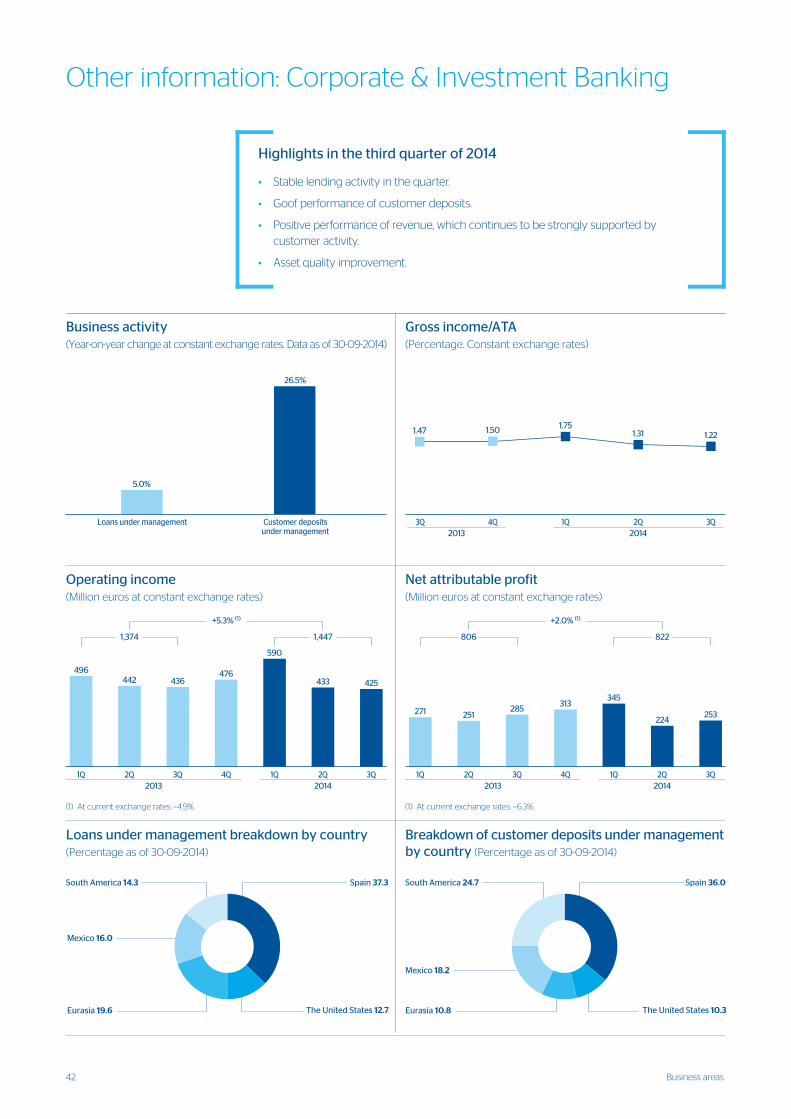
42 Business areas
Other information: Corporate & Investment Banking
Highlights in the third quarter of 2014
• Stable lending activity in the quarter.
• Goof performance of customer deposits.
• Positive performance of revenue, which continues to be strongly supported by customer activity.
• Asset quality improvement.
����������������������������������������������������������
�����������������������������������������������������������������
�� �
��
���
� �
�� ����
� �
��
�
���
��
��
��
���
���
� � ������������������������������� � � ��������������������������������
�� � � �
��������
��
�
�� �
��
���
���
��
��� �� �
�� � � �
��������
��
��� ���� �
���
�
��
��� �
�
�
����������������������������������������� ������������������������������������������ ��
��������������� ���������������������������������������������������� ��
���������
������������
�����������������
���������������������
�����������
���������
������������
�����������������
���������������������
�����������
�����������������������������������������������������
���� ��� ����
���� ����
�
�
�
�
�
�
���� ��������
�������
�� �� ��� �� � ��
�� ��
��������������������������������������������������������������������������� ����������
����
�������� ������������
����
��������� ��������� ������������
����
���
�
�
��
��
��
��
��
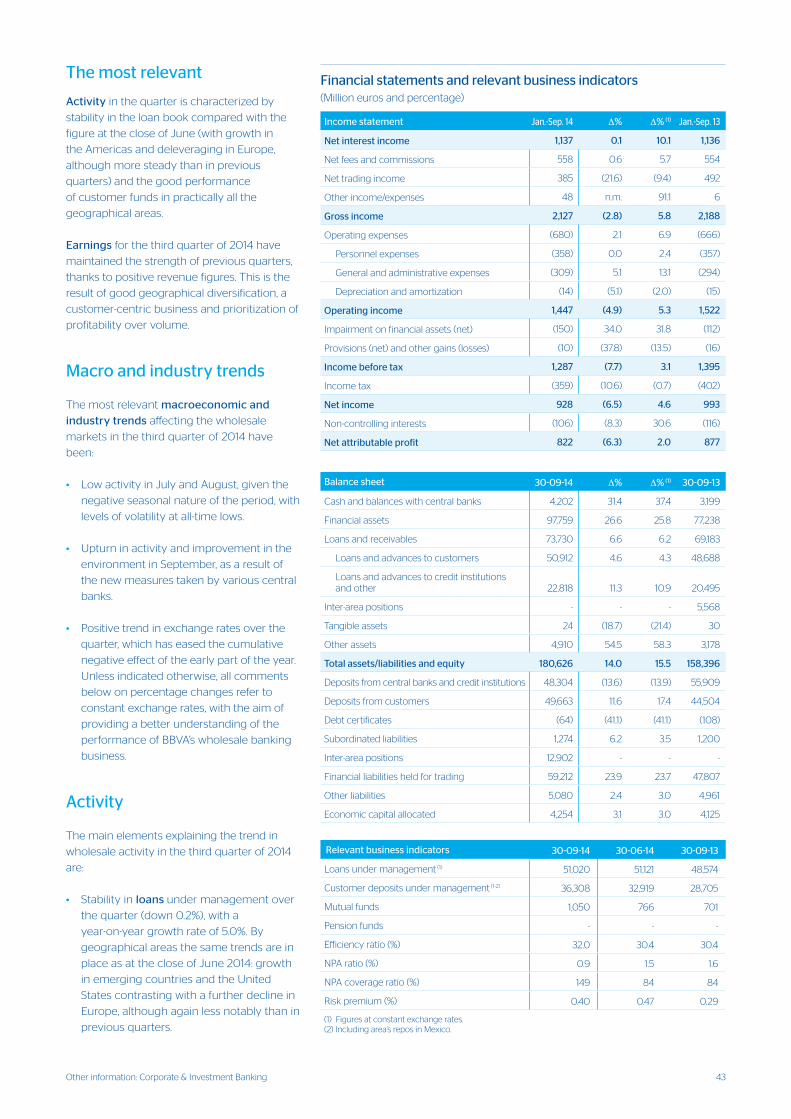
43Other information: Corporate & Investment Banking
The most relevant
Activity in the quarter is characterized by
stability in the loan book compared with the
figure at the close of June (with growth in
the Americas and deleveraging in Europe,
although more steady than in previous
quarters) and the good performance
of customer funds in practically all the
geographical areas.
Earnings for the third quarter of 2014 have
maintained the strength of previous quarters,
thanks to positive revenue figures. This is the
result of good geographical diversification, a
customer-centric business and prioritization of
profitability over volume.
Macro and industry trends
The most relevant macroeconomic and
industry trends affecting the wholesale
markets in the third quarter of 2014 have
been:
• Low activity in July and August, given the
negative seasonal nature of the period, with
levels of volatility at all-time lows.
• Upturn in activity and improvement in the
environment in September, as a result of
the new measures taken by various central
banks.
• Positive trend in exchange rates over the
quarter, which has eased the cumulative
negative effect of the early part of the year.
Unless indicated otherwise, all comments
below on percentage changes refer to
constant exchange rates, with the aim of
providing a better understanding of the
performance of BBVA’s wholesale banking
business.
Activity
The main elements explaining the trend in
wholesale activity in the third quarter of 2014
are:
• Stability in loans under management over
the quarter (down 0.2%), with a
year-on-year growth rate of 5.0%. By
geographical areas the same trends are in
place as at the close of June 2014: growth
in emerging countries and the United
States contrasting with a further decline in
Europe, although again less notably than in
previous quarters.
Balance sheet 30-09-14 ∆% ∆% (1) 30-09-13
Cash and balances with central banks 4,202 31.4 37.4 3,199
Financial assets 97,759 26.6 25.8 77,238
Loans and receivables 73,730 6.6 6.2 69,183
Loans and advances to customers 50,912 4.6 4.3 48,688
Loans and advances to credit institutions and other 22,818 11.3 10.9 20,495
Inter-area positions - - - 5,568
Tangible assets 24 (18.7) (21.4) 30
Other assets 4,910 54.5 58.3 3,178
Total assets/liabilities and equity 180,626 14.0 15.5 158,396
Deposits from central banks and credit institutions 48,304 (13.6) (13.9) 55,909
Deposits from customers 49,663 11.6 17.4 44,504
Debt certificates (64) (41.1) (41.1) (108)
Subordinated liabilities 1,274 6.2 3.5 1,200
Inter-area positions 12,902 - - -
Financial liabilities held for trading 59,212 23.9 23.7 47,807
Other liabilities 5,080 2.4 3.0 4,961
Economic capital allocated 4,254 3.1 3.0 4,125
Relevant business indicators 30-09-14 30-06-14 30-09-13
Loans under management (1) 51,020 51,121 48,574
Customer deposits under management (1-2) 36,308 32,919 28,705
Mutual funds 1,050 766 701
Pension funds - - -
Efficiency ratio (%) 32.0 30.4 30.4
NPA ratio (%) 0.9 1.5 1.6
NPA coverage ratio (%) 149 84 84
Risk premium (%) 0.40 0.47 0.29
(1) Figures at constant exchange rates. (2) Including area’s repos in Mexico.
Financial statements and relevant business indicators (Million euros and percentage)
Income statement Jan.-Sep. 14 ∆% ∆% (1) Jan.-Sep. 13
Net interest income 1,137 0.1 10.1 1,136
Net fees and commissions 558 0.6 5.7 554
Net trading income 385 (21.6) (9.4) 492
Other income/expenses 48 n.m. 91.1 6
Gross income 2,127 (2.8) 5.8 2,188
Operating expenses (680) 2.1 6.9 (666)
Personnel expenses (358) 0.0 2.4 (357)
General and administrative expenses (309) 5.1 13.1 (294)
Depreciation and amortization (14) (5.1) (2.0) (15)
Operating income 1,447 (4.9) 5.3 1,522
Impairment on financial assets (net) (150) 34.0 31.8 (112)
Provisions (net) and other gains (losses) (10) (37.8) (13.5) (16)
Income before tax 1,287 (7.7) 3.1 1,395
Income tax (359) (10.6) (0.7) (402)
Net income 928 (6.5) 4.6 993
Non-controlling interests (106) (8.3) 30.6 (116)
Net attributable profit 822 (6.3) 2.0 877
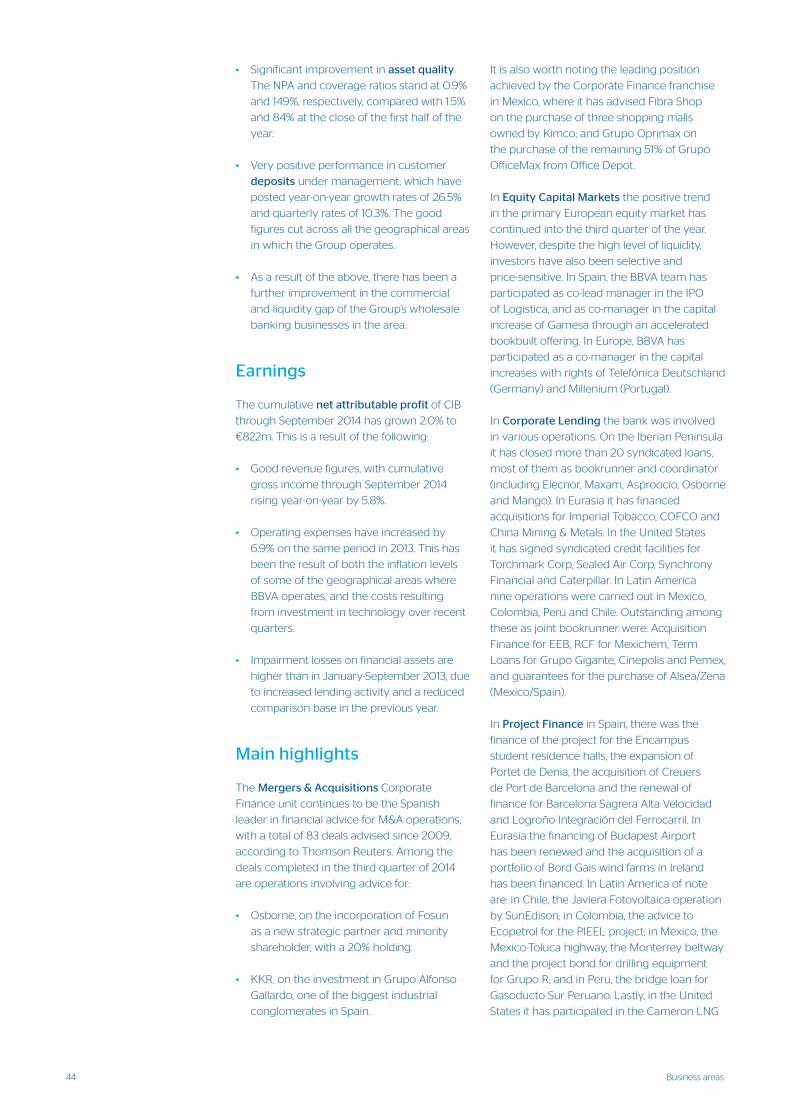
44 Business areas
• Significant improvement in asset quality.
The NPA and coverage ratios stand at 0.9%
and 149%, respectively, compared with 1.5%
and 84% at the close of the first half of the
year.
• Very positive performance in customer
deposits under management, which have
posted year-on-year growth rates of 26.5%
and quarterly rates of 10.3%. The good
figures cut across all the geographical areas
in which the Group operates.
• As a result of the above, there has been a
further improvement in the commercial
and liquidity gap of the Group’s wholesale
banking businesses in the area.
Earnings
The cumulative net attributable profit of CIB
through September 2014 has grown 2.0% to
€822m. This is a result of the following:
• Good revenue figures, with cumulative
gross income through September 2014
rising year-on-year by 5.8%.
• Operating expenses have increased by
6.9% on the same period in 2013. This has
been the result of both the inflation levels
of some of the geographical areas where
BBVA operates, and the costs resulting
from investment in technology over recent
quarters.
• Impairment losses on financial assets are
higher than in January-September 2013, due
to increased lending activity and a reduced
comparison base in the previous year.
Main highlights
The Mergers & Acquisitions Corporate
Finance unit continues to be the Spanish
leader in financial advice for M&A operations,
with a total of 83 deals advised since 2009,
according to Thomson Reuters. Among the
deals completed in the third quarter of 2014
are operations involving advice for:
• Osborne, on the incorporation of Fosun
as a new strategic partner and minority
shareholder, with a 20% holding.
• KKR, on the investment in Grupo Alfonso
Gallardo, one of the biggest industrial
conglomerates in Spain.
It is also worth noting the leading position
achieved by the Corporate Finance franchise
in Mexico, where it has advised Fibra Shop
on the purchase of three shopping malls
owned by Kimco; and Grupo Oprimax on
the purchase of the remaining 51% of Grupo
OfficeMax from Office Depot.
In Equity Capital Markets the positive trend
in the primary European equity market has
continued into the third quarter of the year.
However, despite the high level of liquidity,
investors have also been selective and
price-sensitive. In Spain, the BBVA team has
participated as co-lead manager in the IPO
of Logistica, and as co-manager in the capital
increase of Gamesa through an accelerated
bookbuilt offering. In Europe, BBVA has
participated as a co-manager in the capital
increases with rights of Telefónica Deutschland
(Germany) and Millenium (Portugal).
In Corporate Lending the bank was involved
in various operations. On the Iberian Peninsula
it has closed more than 20 syndicated loans,
most of them as bookrunner and coordinator
(including Elecnor, Maxam, Asproocio, Osborne
and Mango). In Eurasia it has financed
acquisitions for Imperial Tobacco, COFCO and
China Mining & Metals. In the United States
it has signed syndicated credit facilities for
Torchmark Corp, Sealed Air Corp, Synchrony
Financial and Caterpillar. In Latin America
nine operations were carried out in Mexico,
Colombia, Peru and Chile. Outstanding among
these as joint bookrunner were: Acquisition
Finance for EEB, RCF for Mexichem, Term
Loans for Grupo Gigante, Cinepolis and Pemex,
and guarantees for the purchase of Alsea/Zena
(Mexico/Spain).
In Project Finance in Spain, there was the
finance of the project for the Encampus
student residence halls, the expansion of
Portet de Denia, the acquisition of Creuers
de Port de Barcelona and the renewal of
finance for Barcelona Sagrera Alta Velocidad
and Logroño Integración del Ferrocarril. In
Eurasia the financing of Budapest Airport
has been renewed and the acquisition of a
portfolio of Bord Gais wind farms in Ireland
has been financed. In Latin America of note
are: in Chile, the Javiera Fotovoltaica operation
by SunEdison; in Colombia, the advice to
Ecopetrol for the PIEEL project; in Mexico, the
Mexico-Toluca highway, the Monterrey beltway
and the project bond for drilling equipment
for Grupo R; and in Peru, the bridge loan for
Gasoducto Sur Peruano. Lastly, in the United
States it has participated in the Cameron LNG
45Other information: Corporate & Investment Banking
deal, sponsored by the global clients Sempra,
GDF Suez, Mitsubishi, Mitsui and NYK.
Outstanding in Leveraged Finance are the
financing of the acquisition of Grupo Quirón
by IDC Salud, the financing of the takeover
bid by Invest Industrial for Club Med, the
refinancing of the participatory loan for Advent
in TINSA and the financing of the acquisition of
Industrias Doltz by Realza.
Global Transaction Banking (GTB) has
continued to develop solutions covering the
transaction needs of customers, launching
new products and services through online and
mobile banking:
• The security token integrated into cell
phones for access to and signing of BBVA
net cash transactions in Europe; and the
launch of the mobile access app for iOS and
Android in the United States.
• New functionalities in online banking,
BBVA net cash: in Spain, the new range
of foreign trade and currency services; in
Chile, foreign payment orders and the dollar
purchase service; in Colombia, payment
management from contributory master
accounts, online consultation of leasing
operations and greater security in access;
in Venezuela, downloading of account
and card activity; in Peru, management of
signatures, consultations and downloading
of financial statements, as well as daily
payment reports.
In addition, it is worth highlighting the
participation of GTB in the following
operations: as guarantor for the Xacbal Delta
Hydroelectric project in Guatemala and the
expansion and renewal of a hospital on the
Caribbean island of Aruba by a Spanish
construction company. In addition, BBVA has
headed up the financing of the STAR project
(the biggest project finance operation closed
in the history of Turkey) and finance for the
construction of a system of gas pipelines that
connect Tucson and Sasabe in Arizona (United
States).
Thanks to its customer-centric business model,
gross income remains positive for Global
Markets: in the first nine months of 2014 it
amounted to €895m (up 6.9% year-on-year).
This figure is supported by good business with
the institutional segment (up 16% year-on-year)
and in the equity and interest rate businesses.
By geographical areas there was outstanding
performance of customer revenue in Europe
(up 5% year-on-year) as well as the positive
performance of gross income in the United
States (up 25% year-on-year), Mexico (up 28%
y-o-y) and South America (up 13% y-o-y).
In the debt markets, the Bank has once more
received the award from Euromoney for the
“Best Debt House” in Spain, demonstrating
BBVA’s position as a benchmark in the market.
This quarter it has acted as global coordinator
in operations such as the Almirall bond issue
with the lowest coupon ever (4.62%) for a
high-yield entity, and the placement of hybrid
subordinated debt for Telefónica. In the public
sector, BBVA has consolidated its leading
position thanks to issues such as ADIF.
In Spain, BBVA once more leads equity
brokerage activity on the Spanish stock
market, increasing its market share to 13.2% at
the close of the third quarter of 2014.
Lastly, BBVA’s excellent work has led it to
receive awards from the magazine Structured
Retail Products in the area of structured
products in the Americas and as the best
Foreign Exchange house on the continent,
best institutional product and best ETF-Linked
product in Mexico.
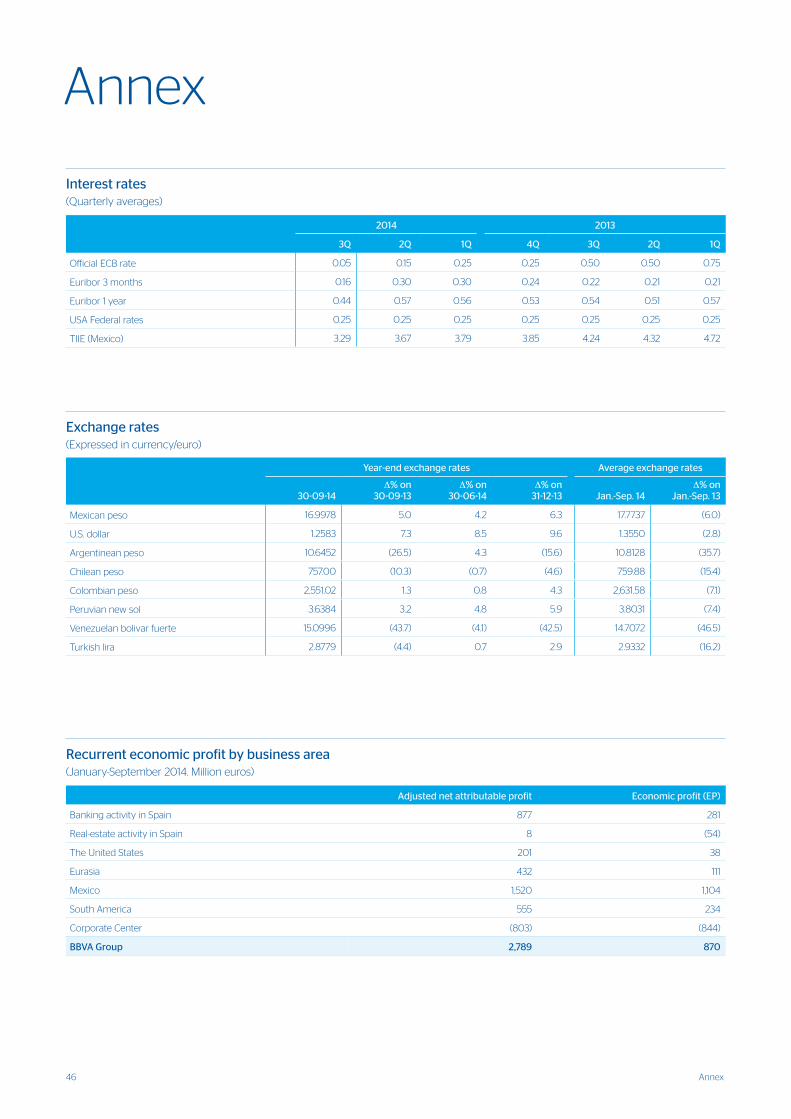
46 Annex
Interest rates(Quarterly averages)
2014 2013
3Q 2Q 1Q 4Q 3Q 2Q 1Q
Official ECB rate 0.05 0.15 0.25 0.25 0.50 0.50 0.75
Euribor 3 months 0.16 0.30 0.30 0.24 0.22 0.21 0.21
Euribor 1 year 0.44 0.57 0.56 0.53 0.54 0.51 0.57
USA Federal rates 0.25 0.25 0.25 0.25 0.25 0.25 0.25
TIIE (Mexico) 3.29 3.67 3.79 3.85 4.24 4.32 4.72
Exchange rates(Expressed in currency/euro)
Year-end exchange rates Average exchange rates
30-09-14∆% on
30-09-13∆% on
30-06-14∆% on
31-12-13 Jan.-Sep. 14∆% on
Jan.-Sep. 13
Mexican peso 16.9978 5.0 4.2 6.3 17.7737 (6.0)
U.S. dollar 1.2583 7.3 8.5 9.6 1.3550 (2.8)
Argentinean peso 10.6452 (26.5) 4.3 (15.6) 10.8128 (35.7)
Chilean peso 757.00 (10.3) (0.7) (4.6) 759.88 (15.4)
Colombian peso 2,551.02 1.3 0.8 4.3 2,631.58 (7.1)
Peruvian new sol 3.6384 3.2 4.8 5.9 3.8031 (7.4)
Venezuelan bolivar fuerte 15.0996 (43.7) (4.1) (42.5) 14.7072 (46.5)
Turkish lira 2.8779 (4.4) 0.7 2.9 2.9332 (16.2)
Annex
Recurrent economic profit by business area (January-September 2014. Million euros)
Adjusted net attributable profit Economic profit (EP)
Banking activity in Spain 877 281
Real-estate activity in Spain 8 (54)
The United States 201 38
Eurasia 432 111
Mexico 1,520 1,104
South America 555 234
Corporate Center (803) (844)
BBVA Group 2,789 870
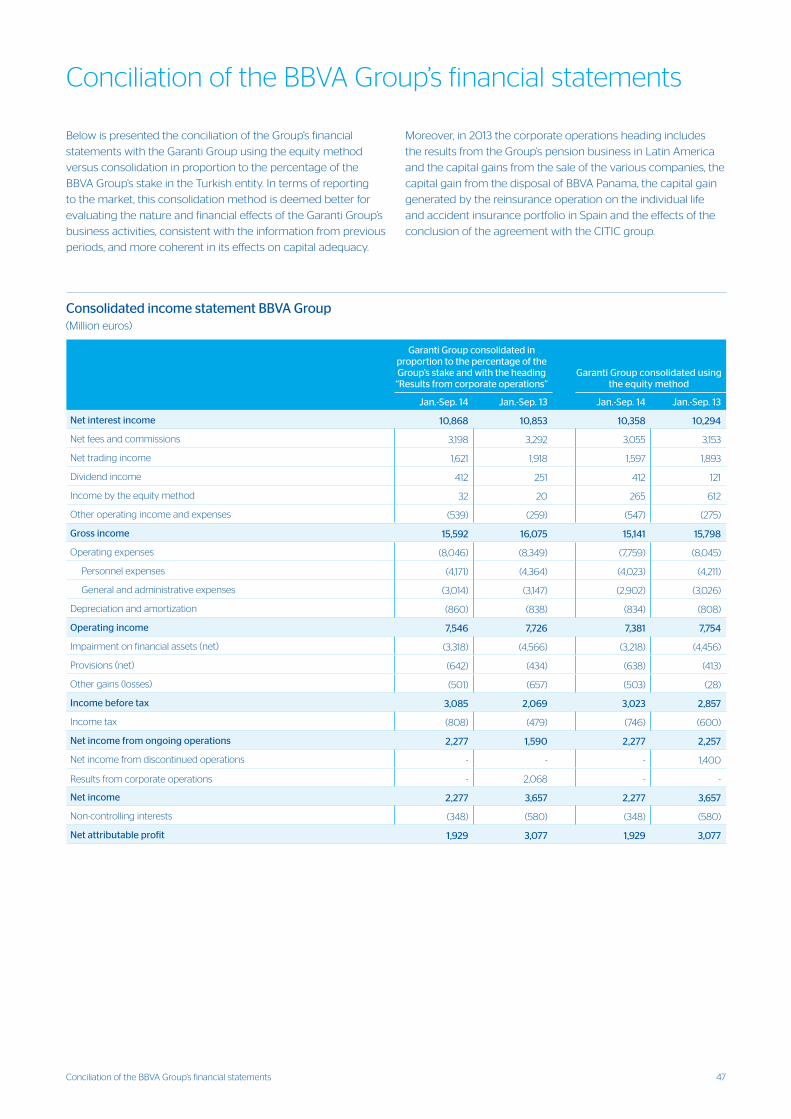
47Conciliation of the BBVA Group’s financial statements
Conciliation of the BBVA Group’s financial statements
Below is presented the conciliation of the Group’s financial
statements with the Garanti Group using the equity method
versus consolidation in proportion to the percentage of the
BBVA Group’s stake in the Turkish entity. In terms of reporting
to the market, this consolidation method is deemed better for
evaluating the nature and financial effects of the Garanti Group’s
business activities, consistent with the information from previous
periods, and more coherent in its effects on capital adequacy.
Moreover, in 2013 the corporate operations heading includes
the results from the Group’s pension business in Latin America
and the capital gains from the sale of the various companies, the
capital gain from the disposal of BBVA Panama, the capital gain
generated by the reinsurance operation on the individual life
and accident insurance portfolio in Spain and the effects of the
conclusion of the agreement with the CITIC group.
Consolidated income statement BBVA Group (Million euros)
Garanti Group consolidated in proportion to the percentage of the Group’s stake and with the heading “Results from corporate operations”
Garanti Group consolidated using the equity method
Jan.-Sep. 14 Jan.-Sep. 13 Jan.-Sep. 14 Jan.-Sep. 13
Net interest income 10,868 10,853 10,358 10,294
Net fees and commissions 3,198 3,292 3,055 3,153
Net trading income 1,621 1,918 1,597 1,893
Dividend income 412 251 412 121
Income by the equity method 32 20 265 612
Other operating income and expenses (539) (259) (547) (275)
Gross income 15,592 16,075 15,141 15,798
Operating expenses (8,046) (8,349) (7,759) (8,045)
Personnel expenses (4,171) (4,364) (4,023) (4,211)
General and administrative expenses (3,014) (3,147) (2,902) (3,026)
Depreciation and amortization (860) (838) (834) (808)
Operating income 7,546 7,726 7,381 7,754
Impairment on financial assets (net) (3,318) (4,566) (3,218) (4,456)
Provisions (net) (642) (434) (638) (413)
Other gains (losses) (501) (657) (503) (28)
Income before tax 3,085 2,069 3,023 2,857
Income tax (808) (479) (746) (600)
Net income from ongoing operations 2,277 1,590 2,277 2,257
Net income from discontinued operations - - - 1,400
Results from corporate operations - 2,068 - -
Net income 2,277 3,657 2,277 3,657
Non-controlling interests (348) (580) (348) (580)
Net attributable profit 1,929 3,077 1,929 3,077
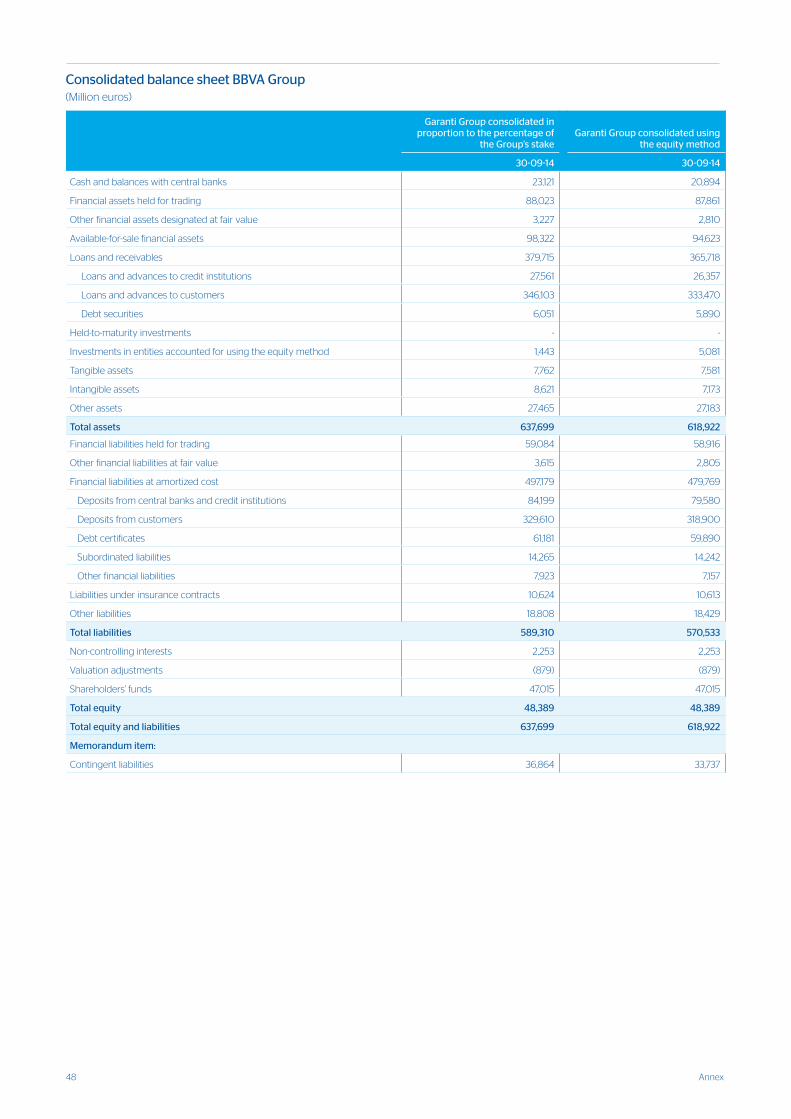
48 Annex
Consolidated balance sheet BBVA Group (Million euros)
Garanti Group consolidated in proportion to the percentage of
the Group’s stakeGaranti Group consolidated using
the equity method
30-09-14 30-09-14
Cash and balances with central banks 23,121 20,894
Financial assets held for trading 88,023 87,861
Other financial assets designated at fair value 3,227 2,810
Available-for-sale financial assets 98,322 94,623
Loans and receivables 379,715 365,718
Loans and advances to credit institutions 27,561 26,357
Loans and advances to customers 346,103 333,470
Debt securities 6,051 5,890
Held-to-maturity investments - -
Investments in entities accounted for using the equity method 1,443 5,081
Tangible assets 7,762 7,581
Intangible assets 8,621 7,173
Other assets 27,465 27,183
Total assets 637,699 618,922
Financial liabilities held for trading 59,084 58,916
Other financial liabilities at fair value 3,615 2,805
Financial liabilities at amortized cost 497,179 479,769
Deposits from central banks and credit institutions 84,199 79,580
Deposits from customers 329,610 318,900
Debt certificates 61,181 59,890
Subordinated liabilities 14,265 14,242
Other financial liabilities 7,923 7,157
Liabilities under insurance contracts 10,624 10,613
Other liabilities 18,808 18,429
Total liabilities 589,310 570,533
Non-controlling interests 2,253 2,253
Valuation adjustments (879) (879)
Shareholders' funds 47,015 47,015
Total equity 48,389 48,389
Total equity and liabilities 637,699 618,922
Memorandum item:
Contingent liabilities 36,864 33,737

BBVA INVESTOR RELATIONS
Headquarters
Paseo de la Castellana, 81 – 17th floor
28046 Madrid
SPAIN
Telephone: +34 91 374 65 26
E-mail: [email protected]
New York Office
1345 Avenue of the Americas, 44th floor
10105 New York, NY
Telephones: +1 212 728 24 16 / +1 212 728 16 60
London Office
One Canada Square, 44th floor
Canary Wharf, London E14 5AA
Telephone: +44 207 648 7671
Hong Kong Office
Level 95, International Commerce Centre
One Austin Road West, Kowloon,
Hong Kong
Telephone: +852 2582 3229
More information at:
http://shareholdersandinvestors.bbva.com

3Q14
3Q14